Abstract
Accurate estimation of the state of charge (SOC) is an important criterion to prevent the batteries from being over-charged or over-discharged, and this assures an electric vehicle’s safety and reliability. To investigate the effect of different operating conditions on the SOC estimation results, a dual-polarization model (DPM) and a fractional-order model (FOM) are established in this study, taking into account the prediction accuracy and structural complexity of a battery model. Based on these two battery equivalent circuit models (ECMs), a hybrid Kalman filter (HKF) algorithm is adopted to estimate the SOC of the battery; the algorithm comprehensively utilizes the ampere-hour (Ah) integration method, the Kalman filter (KF) algorithm, and the extended Kalman filter (EKF) algorithm. The SOC estimation results of the DPM and FOM, under the dynamic stress test (DST), federal urban driving schedule (FUDS), and hybrid pulse power characteristic (HPPC) cycle conditions, are compared and analyzed through six sets of experiments. Simulation results show that the SOC estimation accuracy of both the models is high and that the errors are within the range of ±0.06. Under any operating conditions, the SOC estimation error, based on the FOM, is always lower than the SOC estimation error of the DPM, but the adaptability of the FOM is not as high as that of the DPM.
1. Introduction
Lithium-ion power batteries are widely used in electric vehicles (EVs), owing to their advantages of high energy density, low self-discharge rate, long cycle life, and no memory effect [1]. To ensure the safe, efficient, and stable operation of the power batteries, it is essential to manage the batteries effectively [2]. It is known that the state of charge (SOC) serves as an important indicator to characterize the remaining battery capacity. Therefore, an accurate SOC estimation is the basis for preventing over-charge and over-discharge, and for equilibrium processing. Accurate SOC estimation is the core of an effective battery management system (BMS) [3,4,5].
An effective battery model is a prerequisite for estimating the SOC of a battery. A model that is not effective directly reduces the accuracy of the SOC estimation algorithm, and could even cause the estimation algorithm to diverge directly in severe cases. There are three main types of working lithium-ion battery models: the black-box models, the electrochemical models, and the equivalent circuit models (ECMs) [6]. These three types of models describe the characteristics of the lithium-ion batteries from different detail levels [7]. The black-box models are similar to a linear or nonlinear mapping function. This function reflects the characteristics of battery voltage response, whereas ignores the internal mechanism of the battery and has no physical existence. The electrochemical models contain many equations and parameters, but the simulation accuracy of the battery under complex working conditions is low. The ECMs are used to simulate the external operating characteristics of the battery by the matching of electronic components and are widely used in battery SOC estimation [8]. The pseudo-two-dimensional electrochemical mechanism model proposed by Doyle et al. [9] is often used as a full-order reference mechanism model, and it is also used to evaluate and test other simplified mechanism models. Wang et al. [10] established a nonlinear black-box battery model, and the verification under federal urban driving schedule (FUDS) operating conditions showed that the relative error of voltage was within 3.8%. Plett et al. [11] developed the commonly used ECMs in detail, including internal resistance models, models considering hysteresis effects, etc. Kim et al. [12] proposed a hybrid battery model consisting of a KiBaM model and a dual-polarization model (DPM), which can simultaneously describe the external dynamic characteristics and the recovery effect of the battery. Hu et al. [13] used a second-order fractional-order model to predict the terminal voltage under FUDS cycling conditions, and the average relative error does not exceed 0.1%, which proved the high accuracy of the model.
At present, the SOC estimation methods used both locally and internationally include: the ampere-hour (Ah) integration method [14], electrochemical impedance spectroscopy (EIS) method [15], open-circuit voltage (OCV) method [16], internal resistance method [1], particle filter (PF) [17], Kalman filter (KF) [18], fuzzy logic (FL) [19], artificial neural network (ANN) [20], support vector machine (SVM) [21], and relevance vector machine (RVM) [22]. The authors in [23] critically reviewed the existing SOC estimation methods in the past five years and introduced the basic principles and main disadvantages of various methods. Among these methods, the KF is an optimized autoregressive data filtering algorithm [24], which utilizes the principle of minimum mean square error to achieve an optimal state estimation for a complex dynamic system. Not only does the KF correct the initial error of the system but it also effectively suppresses the noise in the actual measurement process [8]. This feature makes the KF stand out among the current SOC estimation models. Therefore, a variety of improved algorithms have also been derived, such as the extended Kalman filter (EKF) [25], the adaptive unscented Kalman filter (AUKF) [26], and the central difference Kalman filter (CDEF) [27]. In 2004, Gregory L Plett [11] employed the EKF algorithm to perform the battery state and parameters’ estimation based on the ECM. He proposed an EKF algorithm as the core control method, which was supported and improved by many researchers [28,29,30]. Xu et al. [31] proposed a fractional-order model (FOM) for SOC estimation. Compared to the integer-order model, the accuracy of the SOC estimation is significantly improved with the FOM. Lai et al. [32] combined the Ah integration method and the EKF to estimate the SOC based on multi-model global identification. The results proved the robustness of the algorithm. Xu et al. [33] employed the double Kalman filter (DKF) algorithm to estimate the SOC of a lithium-ion battery based on the temperature-dependent DPM. After verification, the battery SOC estimation error could be kept within the range of ± 0.004 under different temperature conditions.
At present, most works in the existing literature focus on the SOC estimation algorithm, and the effects of operating conditions on SOC estimation are barely considered. In this study, we studied the influence of different operating conditions on SOC estimation based on different battery models. Simulation results show that the SOC estimation accuracy of the DPM and the FOM is satisfactory, and the errors are within the range of ±0.06. Under any operating condition, the SOC estimation error of the FOM is always less than that of the DPM, but the adaptability of the FOM is not as good as that of the DPM.
This paper is organized as follows: first, we establish a DPM and a FOM. Second, we apply a mixed-swarm-based cooperative particle swarm optimization (MCPSO) algorithm to identify the battery parameters. The accuracy of the model is verified by using dynamic stress test (DST) operating condition. Third, a hybrid Kalman filter (HKF) algorithm is used to estimate the SOC of the battery, comprehensively utilizing the Ah integration method, KF, and EKF. Finally, the SOC estimation results of the DPM and the FOM under DST, FUDS, and hybrid pulse power characteristic (HPPC) cycling conditions are analyzed by comparing six sets of experiments.
2. Establishment of Lithium-Ion Battery Model
The ECMs (integer-order models and FOMs) are the most widely used type of battery models in various battery-related research because of their clear physical representation, ease of mathematical analysis, and simple parameter identification [34]. Among these models, considering the trade-off between prediction accuracy and structural complexity, the DPM stands out from all integer-order models [35]. However, the integer-order models cannot accurately reflect the electrochemical reactions inside the battery. Therefore, in [36], the authors have used fractional-order impedance elements to improve the integer-order model further. This is because, from the perspective of EIS, a circuit composed of fractional-order impedance elements can better fit the impedance characteristics of a lithium-ion battery, and thus has better applications in battery principle analysis, battery modeling, and state estimation. To investigate the effects of different operating conditions on the battery SOC estimation, the SOC estimation experiments under different operating conditions were conducted in this study, based on the DPM and FOM.
Figure 1a shows the structure of the DPM, and Figure 1b shows the structure of the FOM, where Ud represents the battery terminal voltage, stands for the OCV, the current is denoted by I, indicates the Ohmic internal resistance, the polarization internal resistances are represented by and , and stand for the polarization capacitances, the constant phase elements are denoted by CPE1 and CPE2, and W indicates the Wahlberg element.
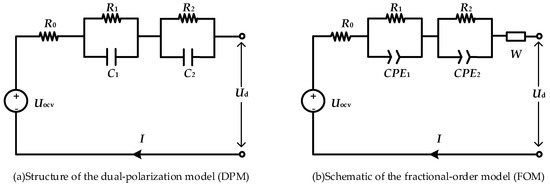
Figure 1.
Structural diagram of equivalent circuit models (ECMs).
2.1. Establishment of Lithium-Ion Battery DPM
The terminal voltage of the battery is shown as follows:
The changes in the rates of voltages and are and , respectively, which can be expressed by Equations (2) and (3):
The definition of SOC is presented in Equations (4) as follows:
where the values of SOC at time t and t0 are denoted by SOC(t) and SOC(t0), respectively, Q stands for the maximum available capacity, the charging and discharging efficiency is represented by . Supposing indicates the sampling time, discretizing Equations (1), (2), and (4) as follows:
The parameters to be identified are:
2.2. Establishment of Lithium-Ion Battery FOM
The transfer function is presented in Equation (9) for the lithium-ion battery FOM as follows:
where indicate the impedances of CPE1 and CPE2 element, respectively. The impedance of the Wahlberg element is denoted by .
Assuming the system input is u = I(t), and the output is y = UOCV (t) − Ud(t), then the system model is denoted by a fractional calculus equation, as shown in Equation (10).
Here, the fractional-orders of CPE1 and CPE2 are represented by α and β, and the fractional-order of the Wahlberg element is denoted by γ. The parameters Dγ, Dα, Dβ, , , , indicate the fractional-order operators.
The definition of SOC of the FOM is given by:
where Cn is the rated capacity of the battery; η stands for the battery coulomb efficiency.
By using calculations as presented in [13], we can transform Equation (10) into a first-order difference equation as follows:
Discretizing Equation (11):
The FOMs of lithium-ion batteries can be established using Equations (12) and (13), and the parameters that the model needs to identify are as follows:
2.3. Model Parameter Identification
2.3.1. Model Parameter Identification
The equipment employed in our experimentation included a battery testing device (BTS-5 V 100 A), an incubator (HL404C), a charging and discharging facility, and a computer. The sampling time of the battery test system was set to 0.1 s. Figure 2 shows the configuration of the battery testing system. The A123 ternary lithium-ion soft pack batteries were selected as the experimental objects, and their specifications can be seen in Table 1.
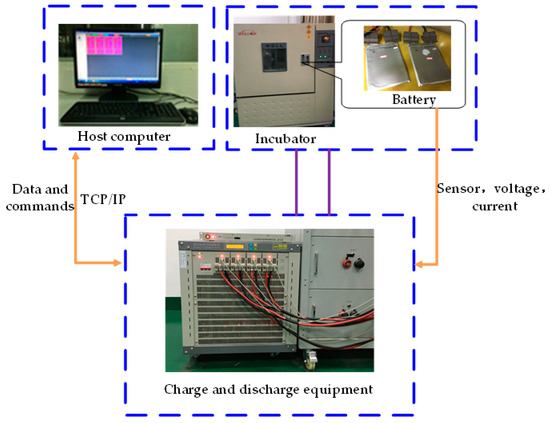
Figure 2.
Configuration of the battery testing bench.

Table 1.
Specification of the battery.
The OCV is an important parameter of the lithium-ion battery, and it usually has a relatively fixed corresponding relationship with the SOC. By testing the OCV at different SOC points, the SOC-OCV curve of the battery can be drawn. Generally, if the lithium-ion battery is left in the open state for a sufficiently long period, the measured battery terminal voltage can be approximately considered as the battery’s OCV [37]. According to the Empirical Formula (15) and the fitted data of Table 2, Figure 3 shows the connection between OCV and SOC [11]. The fitted parameters for the OCV-SOC curve are shown in Table 3.
Table 2.
Open-circuit voltage-state of charge (OCV-SOC) fitting curve parameter table.
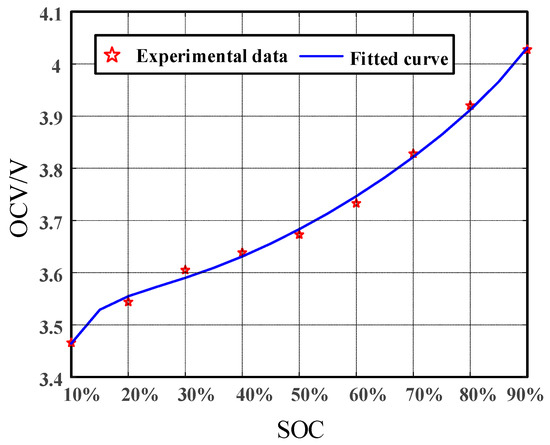
Figure 3.
Fitted curve of open-circuit voltage-state of charge (OCV-SOC).
Table 3.
Fitted parameters for the OCV-SOC curve.
To simulate cells operating in EVs and obtain their characteristics, static capacity test (SCT), DST, FUDS, and HPPC tests were performed at an environmental temperature of 25 °C. Later, the MCPSO algorithm [13] was employed to identify the parameters of the above-mentioned DPM and FOM in the time domain. The results of parameter identification are shown in Table 4 and Table 5.
Table 4.
Dual-polarization model (DPM) model parameter identification results.
Table 5.
Fractional-order model (FOM) parameter identification results.
2.3.2. Model Accuracy Verification
In this study, the DST test cycle conditions are used to verify the model accuracy for both the DPM and the FOM. The battery current is used as the model input variable so that the corresponding model voltage output can be measured and plotted. Figure 4 shows the current profile of DST operating condition. The comparison chart and error chart of the DPM output voltage and measured voltage are shown in Figure 5. The comparison chart and error chart of the FOM output voltage and measured voltage are shown in Figure 6.
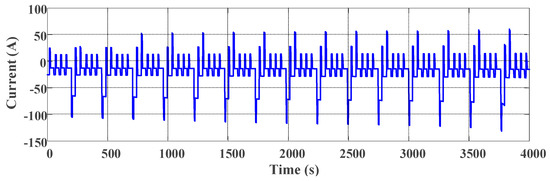
Figure 4.
Current profile of the dynamic stress test (DST) test cycle condition.
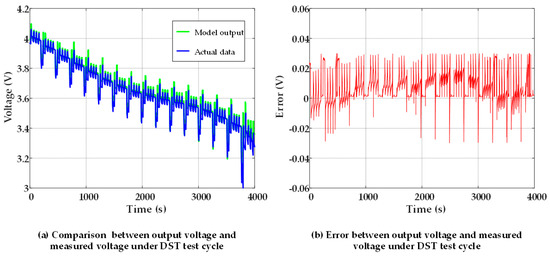
Figure 5.
DST working condition verification of the dual-polarization model (DPM).
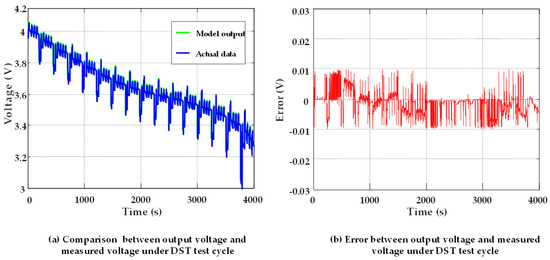
Figure 6.
The DST working condition verification of the fractional-order model (FOM).
Figure 5 and Figure 6 show that the output voltage curves and measured voltage curves of the DPM and the FOM are highly fitted. In addition, the voltage error of the DPM did not exceed 40 mV, and the voltage error of the FOM was kept within 20 mV. This shows that the established model yielded high accuracy under DST working conditions. However, the accuracy of the FOM was higher than that of the DPM. The quantitative results are presented for comparison in Table 6.
Table 6.
RMSEs and relative errors for different SOC ranges.
3. SOC Estimation Based on HKF Algorithm
The SOC estimation accuracy of the lithium-ion battery is essential for the BMS. It is reflected in other functions, including charging and discharging control, balance management, safety management, and fault diagnosis cannot be achieved without the high-precision SOC estimation. In this paper, an HKF algorithm based on an established DPM and the FOM is proposed for SOC estimation. The algorithm comprehensively utilizes the merits of the Ah integration method, the KF algorithm, and the EKF algorithm, with verified effectiveness under different operating conditions.
3.1. KF Algorithm and EKF Algorithm
For a discrete linear system, the KF algorithm can be used to improve the estimation accuracy of the system state variables. Recursive formulas used in the algorithm are shown in Table 7. However, the KF algorithm is only effective for linear systems. The DPM and the FOM of lithium-ion batteries established in this paper both are nonlinear models, challenging the usefulness of the KF algorithm. The EKF algorithm can linearize a nonlinear system, thus introducing approximation in the process, and inducing inevitable model errors. However, the algorithm poses certain advantages, such as being simple and fast in its implementation. Hence, the EKF algorithm has been extensively used to deal with the estimation problems for nonlinear models, and its recursive formula is shown in Table 8.
Table 7.
The Kalman filter (KF) algorithm recursive formula.
Table 8.
The extended Kalman filter (EKF) algorithm recursive formula.
3.2. SOC Estimation Based on HKF
Figure 7 shows the proposed HKF-based SOC estimation algorithm. This algorithm uses a two-layer filtering arrangement to proceed with SOC estimation. In the first layer, the error between the measured voltage (denoted by Vce) and the battery model output voltage (i.e., V) is utilized as the input to an EKF. The output from the EKF provides feedback to the established battery model to obtain a correctional SOC estimate, SOCEKF. The objective of the EKF is to dispose the nondeterminacy resulted from modeling defects. Thus, the estimation performance of SOC is improved. The second layer uses the KF to deal with the cumulative error caused by the Ah integration method. The specific way is that the error difference between SOCEKF and the SOC estimate came from the Ah integration method (namely SOCAh) is sent to a KF, then the output from the KF provides feedback to the Ah integration algorithm, producing a further correctional SOC estimate value, which is the output SOC. Therefore, the accuracy of SOC estimation can be further improved by the second filter.
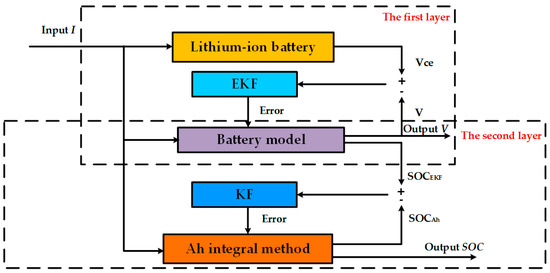
Figure 7.
Schematic diagram of the hybrid Kalman filter (HKF) algorithm.
To perform related calculations of the HKF, the DPM is converted into a state-space expression by Equations (5)–(7):
Among those, the state variable of the system is set to ; the input is , and the output is . The definitions of A, B, C, and D are shown as follows:
According to the FOM, the continuous state-space function can be expressed by Equations (21)–(23).
According to the definition, the system state SOC of the FOM can be denoted as Equation (24):
Supposing x(t) = [V1(t) V2(t) VW(t) SOC(t)] is state variable of the system, u = I(t) is the input of the system, and y = Ud(t) is the output from the system. Therefore, the pseudo-system state equation of the FOM in this paper is built as follows:
where, the definitions of A, B, C, and D are shown in Equations (26)–(29):
UOCV and SOC are functionally related. The fractional-order calculus and EKF principle are used to discretize Equation (25) as follows:
where , , and are defined as shown in Equations (31)–(34).
3.3. Comparison of SOC Estimation Results under Different Working Conditions
The test data in this section were based on the lithium-ion power battery test platform and the related basic characteristic tests. The main parameters are shown in Table 1. Besides, the tests in this section were performed at the ambient temperature of 25 °C. The initial SOC values in all the experiments were set to 90%, and the commissioning and verification of the SOC estimation under the HKF for the DPM and the FOM were completed under the parameters set, as explained. The experimental scheme is shown in Table 9. The basic characteristic tests performed as required for the battery SOC estimation algorithm included the DST cycle test, the FUDS cycle test, and the HPPC cycle test. Each working condition test refers to the relevant test methods in the USABC Electric Vehicle Battery Test Procedures Manual and the Freedom CAR Battery Test Manual for Power-Assist Hybrid Electric Vehicles. The specific experimental steps are given in Table 10. The sampling frequency was 10 Hz. The charging and discharging current and battery terminal voltage response of each test are shown in Figure 8.
Table 9.
Experiments under different models and different test conditions.
Table 10.
The specific experimental steps of the dynamic stress test (DST), federal urban driving schedule (FUDS), and hybrid pulse power characteristic (HPPC) test conditions.
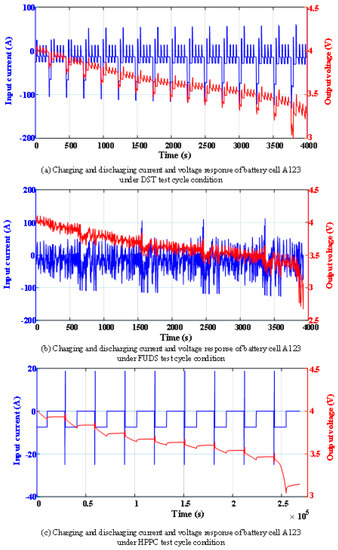
Figure 8.
Charging and discharging current and voltage response of battery cell A123 under different test cycle conditions.
Considering that the HKF needs to complete the prior estimation of the SOC by the Ah integration method, the sampling time interval is particularly important. Here we chose to collect the current and voltage signal every 0.1 s. It should be noted that, for most devices, the sampling interval cannot be completely and constantly controlled; that is, the sampling time interval fluctuates slightly around 0.1 s.
The above experimental data are battery current and voltage values. To compare the effects of DPM and FOM on SOC estimation, it was necessary to obtain reference values for SOC changes. Considering that under the experimental conditions, the voltage and current acquisition accuracy were very high, and the battery’s initial SOC and maximum available capacity were known, the sufficiently accurate SOC change curve could be obtained by the Ah integration method. The curve found by integration was used as a reference value for the SOC estimation results of the two models, and the simulation results are shown in Figure 9, Figure 10 and Figure 11.
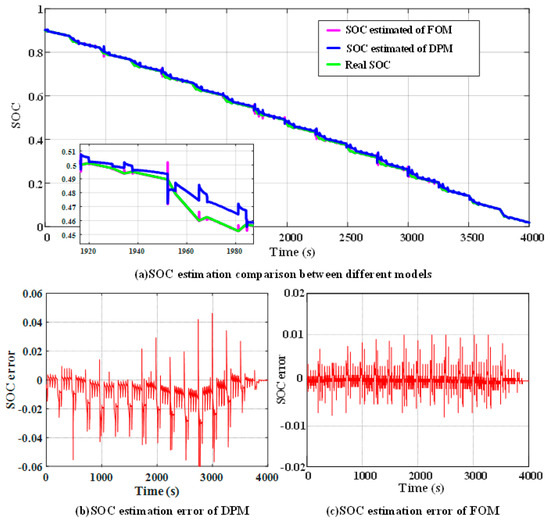
Figure 9.
SOC estimation results under the DST test cycle condition.
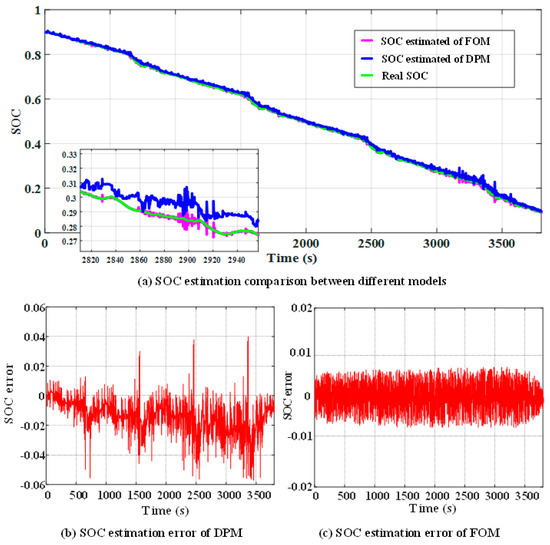
Figure 10.
SOC estimation results under the federal urban driving schedule (FUDS) test cycle condition.
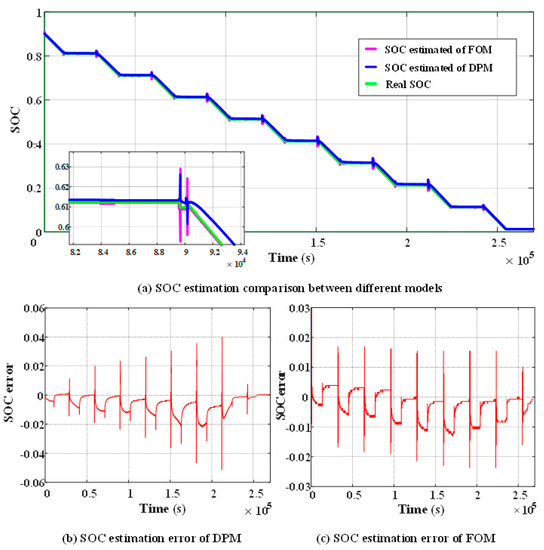
Figure 11.
SOC estimation results under the hybrid pulse power characteristic (HPPC) test cycle condition.
As can be seen from Figure 9, the SOC estimation error based on the DPM fluctuated within a range of ±0.06 under the DST test cycle condition, and the SOC estimation error based on the FOM remained within a range of ±0.01. Figure 10 shows that the error of SOC estimation based on the DPM fluctuated within the range of ±0.06 under the FUDS test cycle condition, and the error of SOC estimation based on the FOM can fluctuate within ±0.01. It is clear from Figure 11 that under the condition of HPPC, the error of SOC estimation based on the DPM fluctuated within ±0.05 range, and the SOC estimation error based on the fractional-order model remained fluctuating within ±0.03 range. The results of SOC estimation errors under different models and different test conditions are summarized in Table 11. It can be observed that irrespective of the working conditions applied, the SOC estimation error of the FOM was always less than the estimation error of the DPM, which benefits from the more accurate simulation of the battery impedance characteristics achieved by the fractional-order model. This illustrates that the higher the accuracy of the selected model, the lower the SOC estimation error.
Table 11.
SOC estimation errors using different models under different test conditions.
From Figure 9b, Figure 10b, and Figure 11b, it could be seen that in the DPM, the frequency of current change in the DST mode and FUDS mode was nearly the same, and the error of SOC estimation was within ± 0.06 range; the SOC estimation error could be maintained within ±0.05 range under HPPC test cycle condition. The maximum fluctuation of the SOC estimation error between different operating conditions was 0.01. From Figure 9c, Figure 10c, and Figure 11c, the SOC estimation error of the FOM in the DST and FUDS test cycle conditions fluctuated within ±0.01 range. Under the HPPC test cycle condition, the SOC estimation result was relatively poor, but the SOC estimation error could also remain within a range of ±0.03. The maximum fluctuation of the SOC estimation error between different operating conditions was 0.02. This shows that the adaptability of the FOM was not as good as that of the DPM. As can be seen from Figure 9a and Figure 11a, in most cases, the SOC simulation values of the two models basically fluctuated slightly around the measured values, and only fluctuated slightly larger when the voltage and current change suddenly. Moreover, the fluctuation range of the FOM was larger than that of the DPM, but it immediately converged near the theoretical value, which had better convergence than the DPM. In summary, although the SOC estimation accuracy of the FOM was higher, the adaptability of working conditions was not as good as that of the DPM.
4. Conclusions
To investigate the effect of different operating conditions on the SOC estimation results, a DPM and a FOM were established in this study, taking into account the prediction accuracy and structural complexity of a battery model. Further, based on these two battery ECMs, an HKF was used to estimate the SOC of the battery, utilizing the Ah integration method, KF, and EKF. The SOC estimation results of the DPM and the FOM under DST, FUDS, and HPPC test cycle conditions were compared and analyzed through six sets of experiments. Simulation results showed that the SOC estimation accuracy of both models was satisfactory, and the errors were within the range of ± 0.06. Under any operating condition, the SOC estimation error of the FOM was always less than that of the DPM, but the adaptability of the FOM was not as good as that of the DPM. In future work, we consider combining several typical working conditions to form a new working condition, then identify the parameters of the battery models to make them more adaptable in different operating conditions.
Author Contributions
Conceptualization, M.H.; methodology, M.H.; validation, G.J.; formal analysis, G.J., L.L., and Y.X.; investigation, G.J., L.L., Y.X., and D.Q.; writing—original draft, G.J. and L.L.; writing—review and editing, M.H. and C.F.; supervision, M.H. and C.F.; project administration, L.L. and Y.X.; funding acquisition, D.Q., M.H. and C.F. All authors have read and agreed to the published version of the manuscript.
Funding
This work was supported by the National Key R&D Program of China [No. 2018YFB0106102], and the Major Program of Chongqing Municipality [No. cstc2018jszx-cyztzxX0007].
Conflicts of Interest
The authors declare no conflict of interest. The funders had no role in the design of the study; in the collection, analyses, or interpretation of data; in the writing of the manuscript; or in the decision to publish the results.
Abbreviations
| SOC | state of charge |
| DPM | dual-polarization model |
| FOM | fractional-order model |
| ECM | equivalent circuit model |
| HKF | hybrid Kalman filter |
| Ah | ampere-hour |
| KF | Kalman filter |
| EKF | extended Kalman filter |
| DST | dynamic stress test |
| FUDS | federal urban driving schedule |
| HPPC | hybrid pulse power characteristic |
| EVs | electric vehicles |
| BMS | battery management system |
| EIS | electrochemical impedance spectroscopy |
| OCV | open-circuit voltage |
| PF | particle filter |
| FL | fuzzy logic |
| ANN | artificial neural network |
| SVM | support vector machine |
| RVM | relevance vector machine |
| AUKF | adaptive unscented Kalman filter |
| CDKF | central difference Kalman filter |
| DKF | double Kalman filter |
| MCPSO | mixed-swarm-based cooperative particle swarm optimization |
| SCT | static capacity test |
References
- Piller, S.; Perrin, M.; Jossen, A. Methods for state-of-charge determination and their applications. J. Power Sources 2001, 96, 113–120. [Google Scholar] [CrossRef]
- Stan, A.-I.; Swierczynski, M.; Stroe, D.-I.; Teodorescu, R.; Andreasen, S.J. Lithium ion battery chemistries from renewable energy storage to automotive and back-up power applications—An overview. In Proceedings of the 2014 International Conference on Optimization of Electrical and Electronic Equipment (OPTIM), Bran, Romania, 22–24 May 2014; pp. 713–720. [Google Scholar]
- Xiong, R.; Cao, J.; Yu, Q.; He, H.; Sun, F. Critical Review on the Battery State of Charge Estimation Methods for Electric Vehicles. IEEE Access 2018, 6, 1832–1843. [Google Scholar] [CrossRef]
- Ng, K.S.; Moo, C.-S.; Chen, Y.-P.; Hsieh, Y.-C. Enhanced coulomb counting method for estimating state-of-charge and state-of-health of lithium-ion batteries. Appl. Energy 2009, 86, 1506–1511. [Google Scholar] [CrossRef]
- Chaoui, H.; Ibe-Ekeocha, C.C. State of Charge and State of Health Estimation for Lithium Batteries Using Recurrent Neural Networks. IEEE Trans. Veh. Technol. 2017, 66, 8773–8783. [Google Scholar] [CrossRef]
- Seaman, A.; Dao, T.-S.; McPhee, J. A survey of mathematics-based equivalent-circuit and electrochemical battery models for hybrid and electric vehicle simulation. J. Power Sources 2014, 256, 410–423. [Google Scholar] [CrossRef]
- Farmann, A.; Sauer, D.U. Comparative study of reduced order equivalent circuit models for on-board state-of-available-power prediction of lithium-ion batteries in electric vehicles. Appl. Energy 2018, 225, 1102–1122. [Google Scholar] [CrossRef]
- Xiong, R.; Sun, F.; Chen, Z.; He, H. A data-driven multi-scale extended Kalman filtering based parameter and state estimation approach of lithium-ion olymer battery in electric vehicles. Appl. Energy 2014, 113, 463–476. [Google Scholar] [CrossRef]
- Doyle, M.; Fuller, T.; Newman, J. Modeling of galvanostatic charge and discharge of the lithium/polymer/insertion cell. J. Electrochem. Soc. 1993, 140, 1526–1533. [Google Scholar] [CrossRef]
- Junping, W.; Quanshi, C.; Binggang, C. Support vector machine based battery model for electric vehicles. Energ Convers Manag. 2006, 47, 858–864. [Google Scholar] [CrossRef]
- Plett, G.L. Extended Kalman filtering for battery management systems of LiPB-based HEV battery packs: Part 2. Modeling and identification. J. Power Sources 2004, 134, 262–276. [Google Scholar] [CrossRef]
- Kim, T.; Qiao, W. A Hybrid Battery Model Capable of Capturing Dynamic Circuit Characteristics and Nonlinear Capacity Effects. IEEE Trans. Energy Convers. 2011, 26, 1172–1180. [Google Scholar] [CrossRef]
- Hu, M.; Li, Z.; Li, Y.; Li, S.; Fu, C.; Qin, D. Lithium-ion battery modeling and parameter identification based on fractional theory. Energy 2018, 165, 153–163. [Google Scholar] [CrossRef]
- Deng, Y.; Hu, Y.; Cao, Y. An improved algorithm of SOC testing based on open-circuit voltage-ampere hour method. Commun. Comput. Inf. Sci. 2014, 463, 258–267. [Google Scholar]
- Yang, Q.X.; Xu, J.; Cao, B.G.; Li, X.Q. A simplified fractional order impedance model and parameter identification method for lithium-ion batteries. PLoS ONE 2017, 12, e0172424. [Google Scholar] [CrossRef] [PubMed]
- Lee, S.; Lee, J.; Kim, J.; Cho, B.H. State-of-charge and capacity estimation of lithium-ion battery using a new open-circuit voltage versus state-of-charge. J. Power Sources 2008, 185, 1367–1373. [Google Scholar] [CrossRef]
- Orchard, M.E.; Hevia-Koch, P.; Zhang, B.; Tang, L. Risk Measures for Particle-Filtering-Based State-of-Charge Prognosis in Lithium-Ion Batteries. IEEE Trans. Ind. Electron. 2013, 60, 5260–5269. [Google Scholar] [CrossRef]
- Mastali, M.; Vazquez-Arenas, J.; Fraser, R.; Fowler, M.; Afshar, S.; Stevens, M. Battery state of the charge estimation using Kalman filtering. J. Power Sources 2013, 239, 294–307. [Google Scholar] [CrossRef]
- Zenati, A.; Desprez, P.; Razik, H. Estimation of the SOC and the SOH of li-ion batteries, by combining impedance measurements with the fuzzy logic inference. In Proceedings of the IECON 2010 - 36th Annual Conference on IEEE Industrial Electronics Society, Glendale, AZ, USA, 7–10 November 2010; pp. 1773–1778. [Google Scholar]
- Weigert, T.; Tian, Q.; Lian, K. State-of-charge prediction of batteries and battery–supercapacitor hybrids using artificial neural networks. J. Power Sources 2011, 196, 4061–4066. [Google Scholar] [CrossRef]
- Hansen, T.; Wang, C.-J. Support vector based battery state of charge estimator. J. Power Sources 2005, 141, 351–358. [Google Scholar] [CrossRef]
- Zhang, Y.; Guo, B. Online capacity estimation of lithium-ion batteries based on novel feature extraction and adaptive multi-kernel relevance vector machine. Energies 2015, 8, 12439–12457. [Google Scholar] [CrossRef]
- Rivera-Barrera, J.P.; Muñoz-Galeano, N.; Sarmiento-Maldonado, H.O. Soc estimation for lithium-ion batteries: Review and future challenges. Electronics (Switzerland) 2017, 6, 102. [Google Scholar] [CrossRef]
- Sun, F.; Hu, X.; Zou, Y.; Li, S. Adaptive unscented Kalman filtering for state of charge estimation of a lithium-ion battery for electric vehicles. Energy 2011, 36, 3531–3540. [Google Scholar] [CrossRef]
- Plett, G.L. Extended Kalman filtering for battery management systems of LiPB-based HEV battery packs: Part 3. State and parameter estimation. J. Power Sources 2004, 134, 252–261. [Google Scholar] [CrossRef]
- Meng, J.; Luo, G.; Gao, F. Lithium Polymer Battery State-of-Charge Estimation Based on Adaptive Unscented Kalman Filter and Support Vector Machine. IEEE T Power Electr. 2016, 31, 2226–2238. [Google Scholar] [CrossRef]
- He, H.; Zhang, Y.; Xiong, R.; Wang, C. A novel Gaussian model based battery state estimation approach: State-of-Energy. Appl. Energy 2015, 151, 41–48. [Google Scholar] [CrossRef]
- Xiong, R.; He, H.; Sun, F.; Zhao, K. Evaluation on State of Charge Estimation of Batteries With Adaptive Extended Kalman Filter by Experiment Approach. IEEE Trans. Veh. Technol. 2013, 62, 108–117. [Google Scholar] [CrossRef]
- Schwunk, S.; Armbruster, N.; Straub, S.; Kehl, J.; Vetter, M. Particle filter for state of charge and state of health estimation for lithium–iron phosphate batteries. J. Power Sources 2013, 239, 705–710. [Google Scholar] [CrossRef]
- Chen, C.; Xiong, R.; Shen, W. A Lithium-Ion Battery-in-the-Loop Approach to Test and Validate Multiscale Dual H Infinity Filters for State-of-Charge and Capacity Estimation. IEEE Trans. Power Electron. 2018, 33, 332–342. [Google Scholar] [CrossRef]
- Xu, J.; Mi, C.C.; Cao, B.; Cao, J. A new method to estimate the state of charge of lithium-ion batteries based on the battery impedance model. J. Power Sources 2013, 233, 277–284. [Google Scholar] [CrossRef]
- Lai, X.; Qiao, D.; Zheng, Y.; Zhou, L. A fuzzy state-of-charge estimation algorithm combining ampere-hour and an extended Kalman filter for li-ion batteries based on multi-model global identification. Appl. Sci. (Switz.) 2018, 8, 2028. [Google Scholar] [CrossRef]
- Xu, Y.D.; Hu, M.H.; Fu, C.Y.; Cao, K.B.; Su, Z.; Yang, Z. State of Charge Estimation for Lithium-Ion Batteries Based on Temperature-Dependent Second-Order RC Model. Electronics 2019, 8, 1012. [Google Scholar] [CrossRef]
- Widanage, W.D.; Barai, A.; Chouchelamane, G.H.; Uddin, K.; McGordon, A.; Marco, J.; Jennings, P. Design and use of multisine signals for Li-ion battery equivalent circuit modelling. Part 2: Model estimation. J. Power Sources 2016, 324, 61–69. [Google Scholar] [CrossRef]
- Hu, X.; Li, S.; Peng, H. A comparative study of equivalent circuit models for Li-ion batteries. J. Power Sources 2012, 198, 359–367. [Google Scholar] [CrossRef]
- Ma, Y.; Zhou, X.; Li, B.; Hong, C. Fractional Modeling and SOC Estimation of Lithium-ion Battery. J. Autom. Engl. 2016, 3, 281–287. [Google Scholar]
- Pattipati, B.; Balasingam, B.; Avvari, G.V.; Pattipati, K.R.; Bar-Shalom, Y. Open circuit voltage characterization of lithium-ion batteries. J. Power Sources 2014, 269, 317–333. [Google Scholar] [CrossRef]
© 2020 by the authors. Licensee MDPI, Basel, Switzerland. This article is an open access article distributed under the terms and conditions of the Creative Commons Attribution (CC BY) license (http://creativecommons.org/licenses/by/4.0/).