Article

Big Data for Energy Management and Energy-Efficient Buildings

by
Vangelis Marinakis
Decision Support Systems Laboratory, School of Electrical and Computer Engineering, National Technical University of Athens, 9 Heroon Polytechniou str., 15773 Athens, Greece
Energies 2020, 13(7), 1555; https://doi.org/10.3390/en13071555
Submission received: 31 January 2020 / Revised: 20 March 2020 / Accepted: 23 March 2020 / Published: 27 March 2020
(This article belongs to the Special Issue Sustainable Buildings for Citizens, Cities and Communities)

Abstract

:
European buildings are producing a massive amount of data from a wide spectrum of energy-related sources, such as smart meters’ data, sensors and other Internet of things devices, creating new research challenges. In this context, the aim of this paper is to present a high-level data-driven architecture for buildings data exchange, management and real-time processing. This multi-disciplinary big data environment enables the integration of cross-domain data, combined with emerging artificial intelligence algorithms and distributed ledgers technology. Semantically enhanced, interlinked and multilingual repositories of heterogeneous types of data are coupled with a set of visualization, querying and exploration tools, suitable application programming interfaces (APIs) for data exchange, as well as a suite of configurable and ready-to-use analytical components that implement a series of advanced machine learning and deep learning algorithms. The results from the pilot application of the proposed framework are presented and discussed. The data-driven architecture enables reliable and effective policymaking, as well as supports the creation and exploitation of innovative energy efficiency services through the utilization of a wide variety of data, for the effective operation of buildings.

Graphical Abstract

1. Introduction

As the world’s urban population increases by more than 2.5 billion, especially to urban areas by 2050, the construction of new, energy-efficient buildings and cities will be essential to the transformation of the economy [1]. Moreover, the building and construction sector must decarbonize by 2050 to meet the goals of the Paris Agreement [2,3].
The current energy performance of the building sector is poor [4]. In the European Union (EU), with buildings accounting for nearly 40% of its energy consumption, the building sector should play a key role in effective climate policy [5,6]. A number of European directives and initiatives are setting strict objectives on member states, such as the Energy Performance of Buildings Directive (EPBD) [7], the Energy Efficiency Directive [8] and the amending Directive on Energy Efficiency as part of the ‘Clean energy for all Europeans package’ [9], as well as the ecodesign directive [10] and the energy labelling regulation [11], providing consistent EU-wide rules for improving the environmental performance of products (e.g., household appliances) [12].
The needs for a variety of buildings value chain (BVC) stakeholders should be seamless integrated within a comprehensive energy transition framework, in order to guarantee its sustainability and resilience along the buildings’ life cycle (from its conceptualization to its refurbishment or demolition). Energy is consumed at each of these buildings’ steps, sometimes is locally generated at prosumer level and can be analyzed from different perspectives or scales (building, district, city, regional or national scale), depending on the level of granularity required and the BVC stakeholder that should be involved.
The constantly increasing momentum of big data and their related technologies constitutes an unprecedented market opportunity for improving the energy efficiency along the building sector and its lifecycle and for better managing energy consumption and generation at building level. More and more data are being generated within buildings nowadays, due to the increasing adoption of leading-edge information and communication technologies (ICTs), such as Internet of things (IoT), artificial intelligence (AI), distributed ledger technology (DLT)/blockchain and big data; hence, contributing to move forward towards a smart building landscape [13].
Buildings data are heterogeneous, often dispersed in non-interoperable silos, with varying resolution, mostly asynchronous and are stored in different formats (raw or processed) at various locations [14]. Individual devices and functional units generate thousands of terabytes data annually and building-related stakeholders must handle millions of terabytes of data [15], which continues to increase over time. Accordingly, next generation building management systems will be processing overwhelming amounts of heterogeneous data. Appropriate management of buildings data clearly requires a big data original approach where it becomes necessary to process large volume and varieties of both real-time and historical data to extract meaningful information in order to make data-driven decisions [16].
These trends—combined with AI, namely the new ‘engine’ of the Fourth Industrial Revolution and IoT infrastructure management enablers—constitute a catalyst towards conceptualizing and generating innovative applications and services for energy management and energy-efficient buildings. It becomes of utmost importance to create an open interoperable scalable data-driven framework [17] able to manage in a fully scalable and interoperable way the implementation of policy objectives—hence to generate win-win situations—which may enable the adoption of novel business models by buildings-related existing stakeholders and/or opening up new opportunities for BVC stakeholders.
The aim of this paper is to present a high-level data-driven architecture for buildings data exchange, management and real-time processing. This multi-disciplinary big data environment enables the integration of cross-domain data, combined with emerging AI algorithms and distributed ledgers technology. Semantically enhanced, interlinked and multilingual repositories of heterogeneous types of data are coupled with a set of visualization, querying and exploration tools, suitable application programming interfaces (APIs) for data exchange, as well as a suite of configurable and ready-to-use analytical components that implement a series of advanced machine learning (ML) and deep learning (DL) algorithms. The results from the pilot application of the proposed framework are presented and discussed. The collected data can be processed to create different business cases considering the interaction of different stakeholders and scales. More specifically, the data-driven architecture enables reliable and effective policymaking, as well as support the creation of innovative applications through the utilization of a wide variety of data, for the safe and effective operation of buildings.
The rest of the paper is organized as follows. In Section 2, a literature review is presented concerning the exploitation of big data technologies in energy, smart grid and building domain. In Section 3, the high-level data-driven architecture for buildings is thoroughly presented. Section 4 is devoted to the pilot application. In Section 5, innovative energy efficiency applications related to the buildings sector and its lifecycle are described. In Section 6, the contributions and conclusions of the current study are discussed respectively.

2. Scalable Big Data Management

Data processing through ML techniques are fundamental for the data analytics aiming to improve the accuracy of the developed algorithms and systems based on intelligent adaptive systems [18]. It leverages on a variety of ML, statistical and AI-based algorithms and models, including clustering, correlation, classification, categorization, regression, feature extraction, with a view to extract valuable yet actionable information from the dataset [19,20] and enable informed decision-making.
ML techniques are further classified into supervised, unsupervised, semi-supervised and reinforcement learning techniques based on the nature of the learning "signal" or "feedback" available to a learning system. Most big data analytics and AI techniques for smart buildings are based on conventional (supervised or unsupervised) ML/DL algorithms, which operate in a context specific way and hence do not provide enough support for cross-stakeholder transfer learning, AI-based learning models reusability and fast cross-domain applications adaptation [21].
Supervised learning includes Bayesian classification methods, regression techniques, lazy learners, decision trees and support vector machines. These methods have been used in analyzing building operational data [22,23], for short, medium and long-term energy prediction in distinct building environment [24]. To accurately capture the complicated relationships between input and output variables, the supervised learning techniques adopted are typically of high complexity, such as artificial neural networks [25], deep neural networks [26], support vector machines [27,28] and decision-tree based ensembles [29,30]. For buildings with complex and unstable occupancy schedules and energy use patterns, multiple linear regression and support vector machine methods can achieve a high accuracy with fast computation speed [31].
In the past, smart grid, smart buildings and big data are usually reported separately and the analysis of the big data in smart grid / buildings is rarely reported. Zhou et al. reviewed the big data-driven smart energy management which mainly illustrates the architecture and industrial applied energy management tools [32]. Support vector machines have been used as well for fault detection in power grids [33]. Moreover, research projects have investigated ML methods with supervised techniques for wind turbines power generation [34,35].
Unsupervised learning explores the intrinsic data structures, associations and correlations. Miller et al. [36] and Fan et al. [37] presented a review of unsupervised data analytics for building energy performance big data. The research of Lapalu et al. focused on the unsupervised mining of activities for smart home prediction [38]. Unsupervised ML algorithms for developing personalized behavior models using activity data have been presented [39]. dynamic programming, Monte Carlo methods and temporal difference methods can be exploited for solving a reinforcement learning problem. In semi-supervised learning, learning accuracy is improved by combining large amount of labelled data with a typically small amount of unlabeled data. Semi-supervised energy modelling for smart buildings / homes was used [40,41].
Supervised learning and training of ML algorithms is a very challenging process as building managers and stakeholders are reluctant to share data, which are necessary to train ML algorithms. If not properly handed, ML models may reveal inappropriate details of the sensitive data, since models are known to implicitly memorize details during training and inadvertently reveal them during inference [42,43]. A solution to the problem is to adopt differential privacy, which is considered as the by default standard in privacy preserving ML modelling. The first learning algorithms adapted to provide differential privacy with respect to their training data were often linear and convex [44]. More recently, successful developments in deep learning called for differentially private stochastic gradient descent algorithms, some of which have been tailored to learn in federated settings [45]. Differentially private selection mechanisms like GNMax [46] are commonly used in hypothesis testing, frequent item set mining and as building blocks of more complicated private mechanisms.
In the domain of buildings, different tools exist for energy performance assessment and prediction as well as for buildings simulation [47]. On the one hand, tools like Leap [48] and AleaSoft [49] include a limited set of AI methods, which rely on expert knowledge to ensure appropriate use. On the other hand, simulation tools are used to model different aspects of building management like building physics; thermal building models; heating, ventilation and air conditioning (HVAC) systems or building control systems use typically static data and do not allow integration of dynamic information [50]. Another important aspect is that buildings data analytics at the moment include mostly descriptive and diagnostic models, hence very few predictive and prescriptive applications have been made available.
As the key objective of data analytics is to provide preventive solution, predictive models become more and more necessary to forecast operating conditions and future decisions [51]. Prescriptive analysis, on the other hand, are designed for providing longer term insights to utilities in making strategic operational and investment planning.
The challenges that also arises here, is the fact that training data-driven models needs a considerable amount of data and can take time to converge to an optimal policy [22]. Cross-context transfer learning is explored as a solution, aiming to minimize number of days of training data needed to achieve a policy with a certain accuracy. In that respect, there are some initial attempts to utilize transfer learning in the smart energy domain, in particular addressing the problem of building energy consumption [52,53]. On the other hand, forecasting algorithms are often based on static predictive modelling which leverage on AI-based learning and are not able to capture and assess when a given model is not anymore able to capture the modelled context and/or to reconstruct the missing and/or poor data quality.

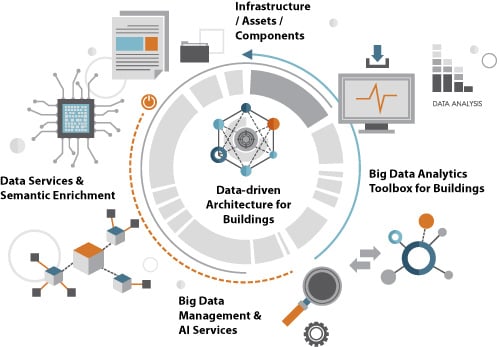
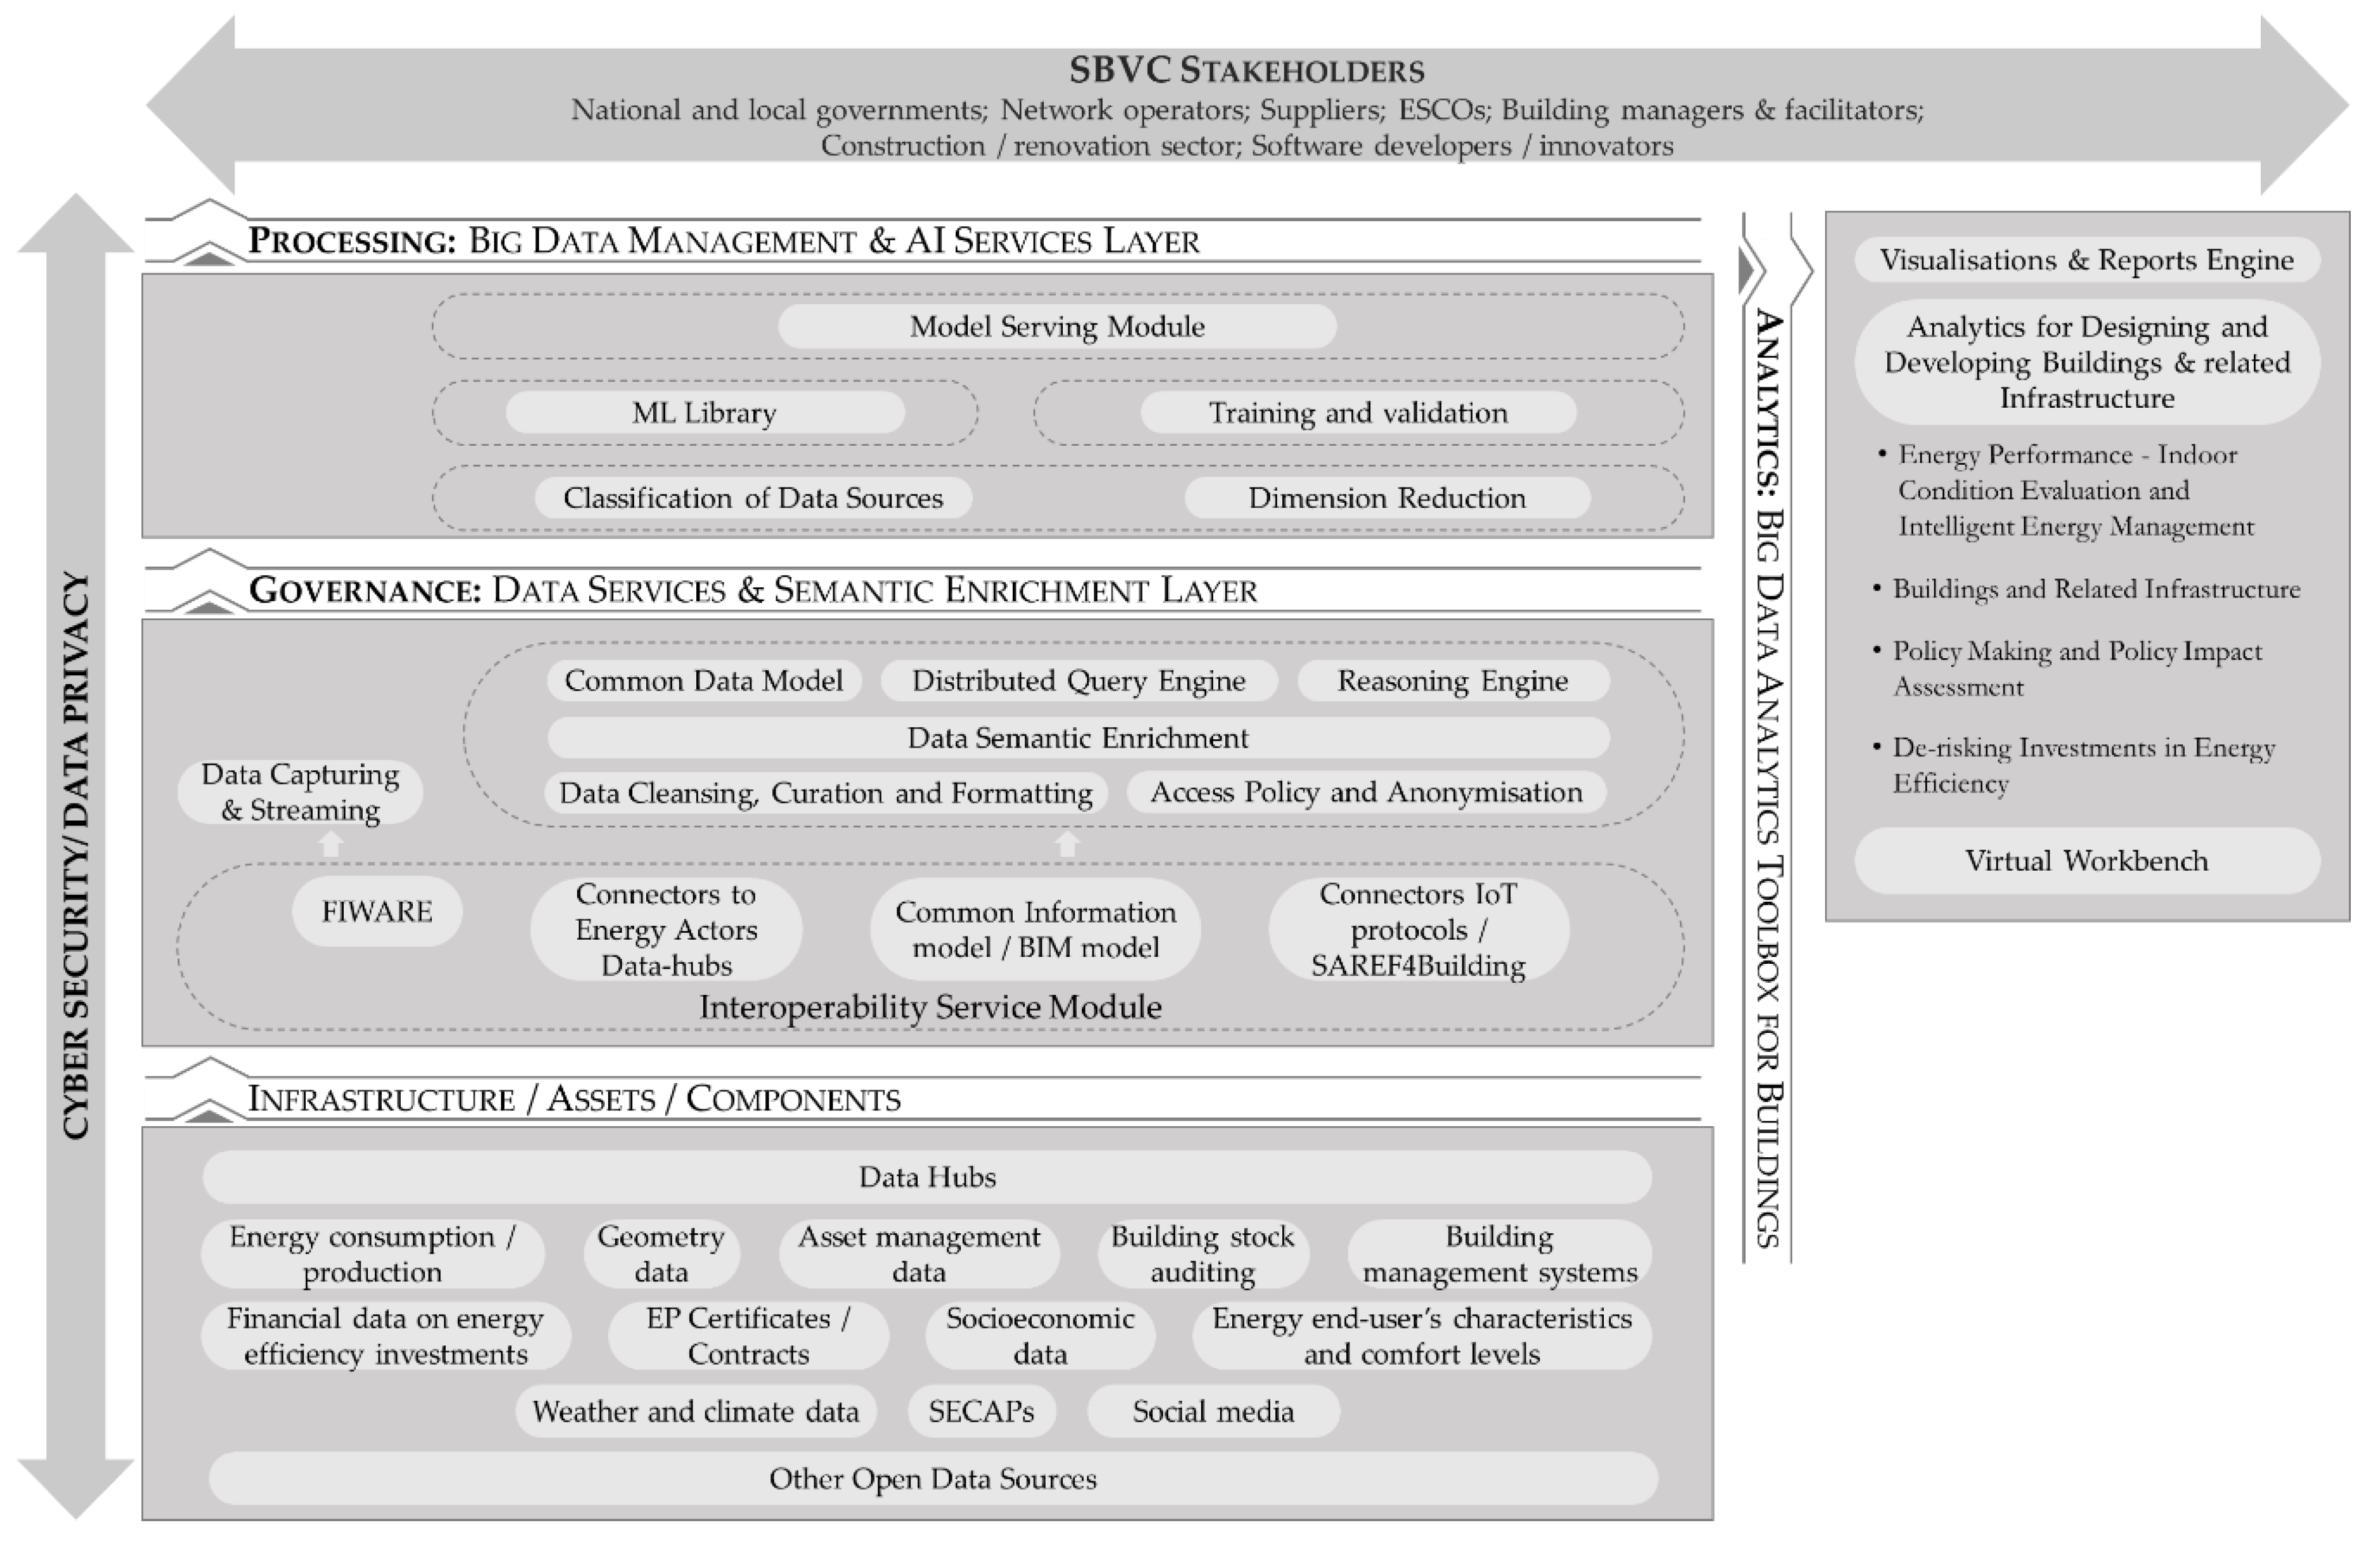
3. High-Level Architecture for Building Data

The proposed framework relies on a decentralized architecture, where data are stored locally at “building-edge” layer and are exposed in a privacy-aware manner at the AI layer run in a centralized cloud. This hybrid approach is expected to increase trust in data sharing among stakeholders and subsequently increase models’ accuracy by raising the amounts of data available for AI-based learning.
The high-level architecture is presented in Figure 1.
This distributed scalable data governance module facilitates data sharing among building stakeholders to maximize the value of AI-based analytics at upper layers. More specifically, the proposed framework consists of three main pillars:
  • The Governance Layer, encompassing modules related to data collection, semantic annotation and distributed storage.
  • The Processing Layer, including ML and DL models.
  • The Analytics Layer, providing a set of analytics tools.
The aim is to increase accuracy of AI-based services for buildings, by training a large set of ML/DL models utilizing a rich data set of heterogeneous dispersed static and dynamic data and enable data analysis and visualization as well as scenario analysis and simulation at different scales in time and geographical level addressing needs from different stakeholders.

3.1. Infrastructure/Asset/Components

A large share of big data is related to energy consumption and production data in buildings. Moreover, off-domain data, such as EC databases (e.g., EU Building Stock Observatory, De-risking Energy Efficiency Platform, EU Energy Poverty Observatory, etc.), building stock auditing, energy performance certificates, energy performance contracts, weather and climate data, geometry data (e.g., from building information modelling), geographical imagery, multimedia unstructured data sources, financial data on energy efficiency investments, socioeconomic data, social media, energy end-user’s characteristics and comfort levels, etc. whereas suitably integrated, may allow novel energy analytics to provide BVC stakeholders with more robust actionable insights, as well as to enable analytics driven improved decision-making.
A wide range of data analysis techniques (including among others optimization, forecasting, classification and clustering) can be applied on the aforementioned amounts of (big) data, supporting the design of new data-driven applications for BVC stakeholders, such as national and local governments, network operators and suppliers, energy service companies (ESCOs), building managers and facilitators, construction and renovation sector, investors and financiers, policy makers and researchers.
Data are provided through suitable data service providers. Connectors encapsulate the capability of federating interoperable data sets and/or interoperable data platforms. External off-grid data sets and resources may be federated and integrated, including weather data, etc.

3.2. Data Services and Semantic Enrichment

The data services and semantic enrichment (governance) layer provides the necessary middleware to act as a mediator between data users (applications and tools) and data providers who may want to decide case by case whether to disclose their data or not. State of the art solutions (i.e., blockchain/DLT/smart contracts with off-chain data) are used to guarantee traceability, provenance tracking and accountability. The components at the governance layer allow the integration, pre-processing, semantic annotation and querying of heterogeneous data. It integrates the following main components related to data and semantic interoperability:
  • At the bottom, an interoperability service module is in charge of facilitating data sharing from different sources and/or platforms belonging to different actors in the energy and non-energy ecosystem, such as smart meters, sensors, IoT devices, building management systems (BMSs), systems (TBMs), building automation and control systems (BACs), energy performance contracts, energy performance certificates, legacy systems. It is based on open standards, open APIs (e.g., NGSI-LD CIM APIs [54]) and open data models (e.g., FIWARE Smart Energy Reference Architecture [55], Building Information Modeling (BIM) [56], Smart Appliances REFerence (SAREF) [57]). Interfaces to other third-party energy and non-energy datasets/data platforms willing to federate/integrate with the proposed framework are provided, with a view to allowing the incremental population of the platform’s data hub.
  • Data Cleansing Curation and Formatting Module is an umbrella term for tasks that span from simple data pre-processing, such as restructuring, predefined value substitutions and reformatting of fields (e.g., dates) to more advanced processes, such as outliers’ detection and elimination from a dataset, data inconsistencies handling and noise reduction. To better organize the data collected and facilitate their future use, special ML pre-processing algorithms are developed for automatically cleansing and formatting it. This includes algorithms for normalizing their values, handling possible outliers, filling missing observations and dealing with different timestamp formats. The abovementioned algorithms take into consideration the particular characteristics of the data examined, such as their frequency, trend, seasonality, cycle, randomness and empirical distribution, enhancing that way the quality and the content of the constructed dataset, decreasing simultaneously the time required for training the algorithms of the toolbox and boosting their expected performance.
  • Access Policy and Anonymization Module: The proposed framework incorporates enforcement policies mechanisms for data access policy brokerage, hence allowing to address and programmatically encapsulate (via DLT/smart contracts) specialized and context-based data hubs access policies brokerage. In order to be able to handle datasets containing sensitive information, this module also performs anonymization on the data ingestion process to protect this information, by either complete data removal-suppression, generalization or pseudonymity.
  • Data Capturing and Streaming Module aimed to manage dynamically the frequency rate of the data streaming for the subsequent in-memory processing of the high latency near real time data. Such component could be tightly connected to the performance of some analytics.
  • Data Semantic Enrichment Module is responsible for the semantic annotation and enrichment of data to facilitate their processing at upper analytics layers. Semantic enrichment uses well-established vocabularies and schemas related to the domains of energy, buildings, weather and climate, sensors network (e.g., SAREF4Building [58], BRICK schema [59], HAYSTACK [60], IFC [61], BACnet [62], LonMark [63]). The Common Data Model serves data interoperability by ensuring that all data processed by the system adhere to the same standards of semantics based on a common set of terms, concepts and relations across different data sources.
  • On top of the data integration and semantic enrichment components, the platform enables easy access and querying of data to be exposed in upper analytics layer:
  • Reasoning Engine—A Graph Database technology (i.e., AllegroGraph) can be used as a triplestore in order to persist the dataset semantics and any Resource Description Framework (RDF) information produced by the Semantic Enrichment Module. On top of that, a Semantic Reasoning Engine, such as PoolParty Semantic Classifier, Jena or BaseVisor is going to enable the application of semantic queries on the triplestore to retrieve the semantic information and improve the performance of reasoning operations to extract new insights. This component exposes intelligent querying and search capabilities as API to the Virtual Workbench or directly feeds UI and recommender engines supporting the analytics for designing and developing buildings and related infrastructure.
  • Distributed Query Engine: The data retrieval from the distributed data warehouse is performed by utilizing a high-performance distributed query execution engine, like Presto, Tez or Apache Druid while also utilizing column-oriented approaches like MonetDB for handling the analytics workload. Such engines provide the ability to perform complex queries on a distributed Data Lake in very efficient and high-scalable way. The distributed query execution over a pure memory-based architecture allows the fast generation of the result-sets required from the analytical processes.

3.3. Big Data Management and AI Services

The Big data management and AI services (Processing) Layer provides a library of reusable AI-based ML/DL models that are made available with a view to promote quick adaptation and reuse of ML models along different contexts. The following functional modules are included:
  • Classification of data sources: In order for the AI-based analytics to be meaningful, accurate and easy to construct, their input variables have to be highly correlated and refer to the same time, place and application. For instance, when constructing a model for predicting the hourly energy produced by a Photovoltaic (PV) system, the weather forecasts exploited, such as radiation and temperature forecasts, must all be easy to track and refer to the same geographic location and time. Given the size and the diversity of the data present, retrieving the most relevant variables becomes a challenging problem, especially for cases of semi-structured or completely unstructured data. To deal with this problem, special ML algorithms are exploited to effectively classify the data available in terms of domain, type, location, time and frequency. These algorithms consider Natural Language Processing and Sentiment Analysis techniques to effectively process the description and the labels provided for each variable and classify them in representative classes based on their content (domain, type and location). The timestamp being available is also be processed to extract additional valuable information (frequency and time) and introduce further filters (sub-classes) that can improve the categorization of the available data and facilitate modelling.
  • Dimension reduction: Identifying the most appropriate variables for solving a regression, classification or clustering problem is a complicated task, especially when lots and diverse data are present. To cope with this issue, dimension reduction ML algorithms are used to enable the identification and creation of principal variables, either through feature selection or feature extraction approaches. Such algorithms have been proven particularly effective when constructing deep learning models that effectively extract information from large unstructured datasets and provide solutions in a completely unsupervised way. For instance, Convolution Neural Networks can be exploited to minimize the pre-processing required for training other ML algorithms, filter and clear the raw information provided and boost the final performance of the algorithms.
  • Training and validation: In order to make sure that the developed algorithms will be accurate and robust and mitigate the uncertainty present in the whole modelling process, the adoption of proper training and validation procedures becomes a prerequisite. Depending on the problem examined and the algorithms tested, different procedures and measures for assessing the performance of the available alternatives might be required. In this respect, the proposed framework involves a variety of training and evaluation procedures, as well as advanced criteria for selecting the most appropriate one per case. Simple holdout tests, cross-validation and random sampling are just some examples of the validation procedures that are considered, while Classification Accuracy, Logarithmic Loss, Confusion Matrix, F1 Score and Mean Absolute/Squared Error some of the indicative performance measures that will accompany them. Note that the type of the problem being solved (supervised or unsupervised learning / classification, regression or clustering), the size of the sample data and the objectives of the algorithm (accuracy vs. efficiency) is also taken into consideration for performing an incremental analysis and determining the selections made. Moreover, different hyper parameters are examined for each one of the considered algorithms and the most successive ones are adopted per case to maximize their potential and ensure that they are properly optimized for the particular training dataset.
  • Library of ML algorithms: The Processing Layer provides a variety of advanced ML algorithms that are supported by diverse and multiple data to support, in a smart way, complex decisions related to energy management and energy-efficient services. The aim of these services is to enhance energy systems’ reliability and robustness, mitigate the effect of critical events and power unavailability, improve the profit-loss function of the power generation units, perform proactive analytics to track buildings’ performance and decrease the risk of malfunctions and deterioration, interact and exchange data between different power generation units to provide smart energy solutions at local level, provide accurate power & capacity forecasting and planning, exploit smart meter data to enhance energy conservation and promote efficiency, improve energy storage options and finally, provide powerful descriptive analytics and evaluations. Each algorithm has different data import requirements, pre-defined based on the type of decision support problem being supported. However, these requirements are as abstract and generalized as possible, in order to enable their direct utilization from the majority of the users and parties interested in their exploitation.
  • Model Serving Module: It includes the set of the developed and trained models and constitutes the building block of the upper layer. These models are fed with both batch and streaming data coming from the Query Engine and the Data Streaming Module respectively. The models will be evaluated and refined over several iterations until will be finally used (served).

3.4. Big Data Analytics Toolbox for Buildings

The Big Data Analytics Toolbox for Buildings (Analytics) Layer exposes AI-based analytics services to multiple BVC stakeholders, incorporating the following components:
  • A Visualizations and Reports Engine, responsible for the visual representation of the stored data and the results produced from the analytical components. It offers a variety of visual representations including charts and map visualizations, based on specific Key Performance Indicators (KPIs).
  • A range of innovative Analytics Building Services, such as: (1) Analytics for energy performance—indoor condition evaluation and intelligent energy management; (2) Analytics for building systems and infrastructure; (3) Analytics for policy making and policy impact assessment on building level; (4) Analytics for building efficiency investments.
  • A ‘virtual workbench’, to incorporate a variety of assets, including data, third party services, ML models, computing resources, storage resources as tradable assets. It provides a set of tools targeting Small-Medium Enterprises (SMEs), developers, researchers and potential innovators, who design and develop new applications for the buildings sector. The tools at this level constitute a set of APIs exposing the ML/DL models and data to be tailored on specific circumstances and context provided by the users.

3.5. Cyber Security and Data Privacy

To establish user authentication and authorization, to secure the non-open data of the transactions as well as to comply with the European Commission (EC) regulations on Data Protection (GDPR) and finally, for logging user actions and system events, a security layer is necessary that is vertical in the proposed architecture, in the sense that it spans and interacts with several building blocks of the latter.

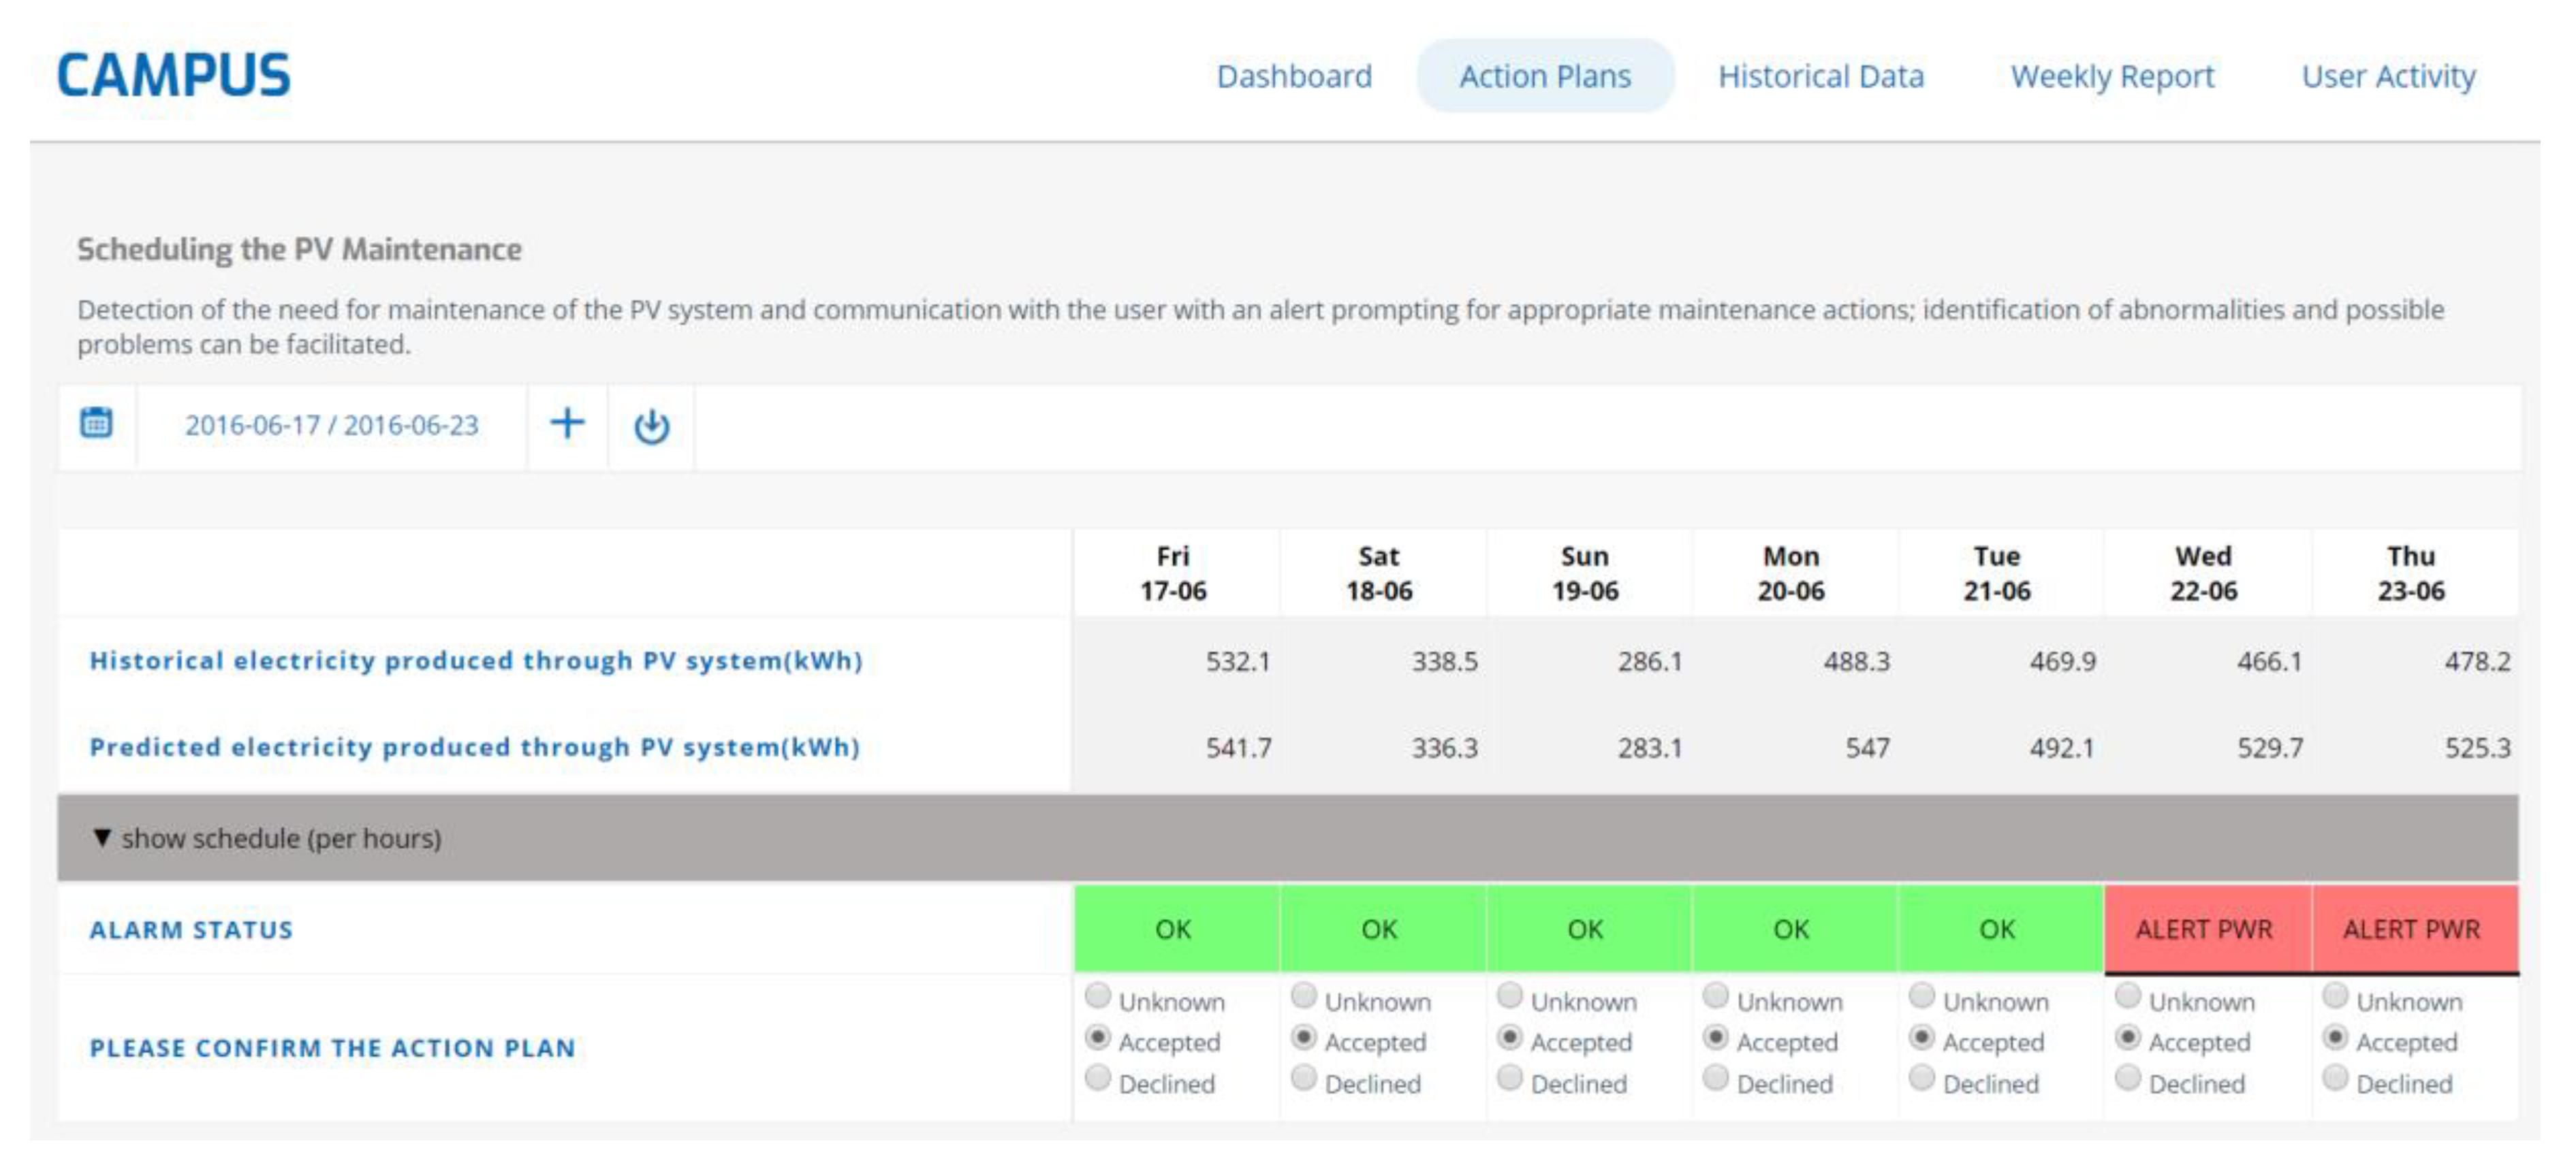
4. Case Study: Scheduling the PV Maintenance

4.1. Methodological Approach

This section presents a case study for the scheduling of the photovoltaic (PV) maintenance, introducing a decision support systems (DSS) tool. PV maintenance tools are necessary for the optimization of the return-on-investment and minimization of time to warranty claim in PV installations. Novel solutions for fault prediction based on data-driven approaches can contribute to the cost-effective energy management of the buildings. To this end, a decision support tool was developed, aiming at the monitoring of the PV performance and triggering maintenance actions.
The energy produced by the PV plant is intermittent and is highly dependent on a number of variables, such as solar irradiance, temperature and other atmospheric parameters (e.g., humidity and cloud coverage), as well as age of the equipment and operational condition [64]. According to the literature, there are numerous applications of multiple linear regression (MLR) models for energy production forecasting, such as hourly PV production estimation [65]. In this context, an MLR model was adopted, to predict the PV production ( y ^ ), considering the relation among different variables ( x i ):
y ^ = a x 1 + b x 2 + + k x i + + x p = y + ε   ε = y ^ y
This means that ε will be the deviation between the predicted ( y ^ ) and actual ( y ) PV production. In order to further improve the forecasting performance of the model we calculated 24 different models, one for each hour of the day [66]. In this regard, we took into consideration more effectively the particularities of each hour and season.

4.2. Pilot Appraisal

The presented DSS tool was applied to the campus of Savona, Italy. It closely resembles any urban district, since it hosts (a) educational buildings, such as offices, classrooms and laboratories; (b) research centers; (c) private companies; (d) student residences. The smart polygeneration microgrid contributes to the operation of its electrical and thermal systems [67]. Thanks to this infrastructure, the site may be considered an example of a “smart urban district”, equipped with distributed generations, local control and supervision infrastructures [68].

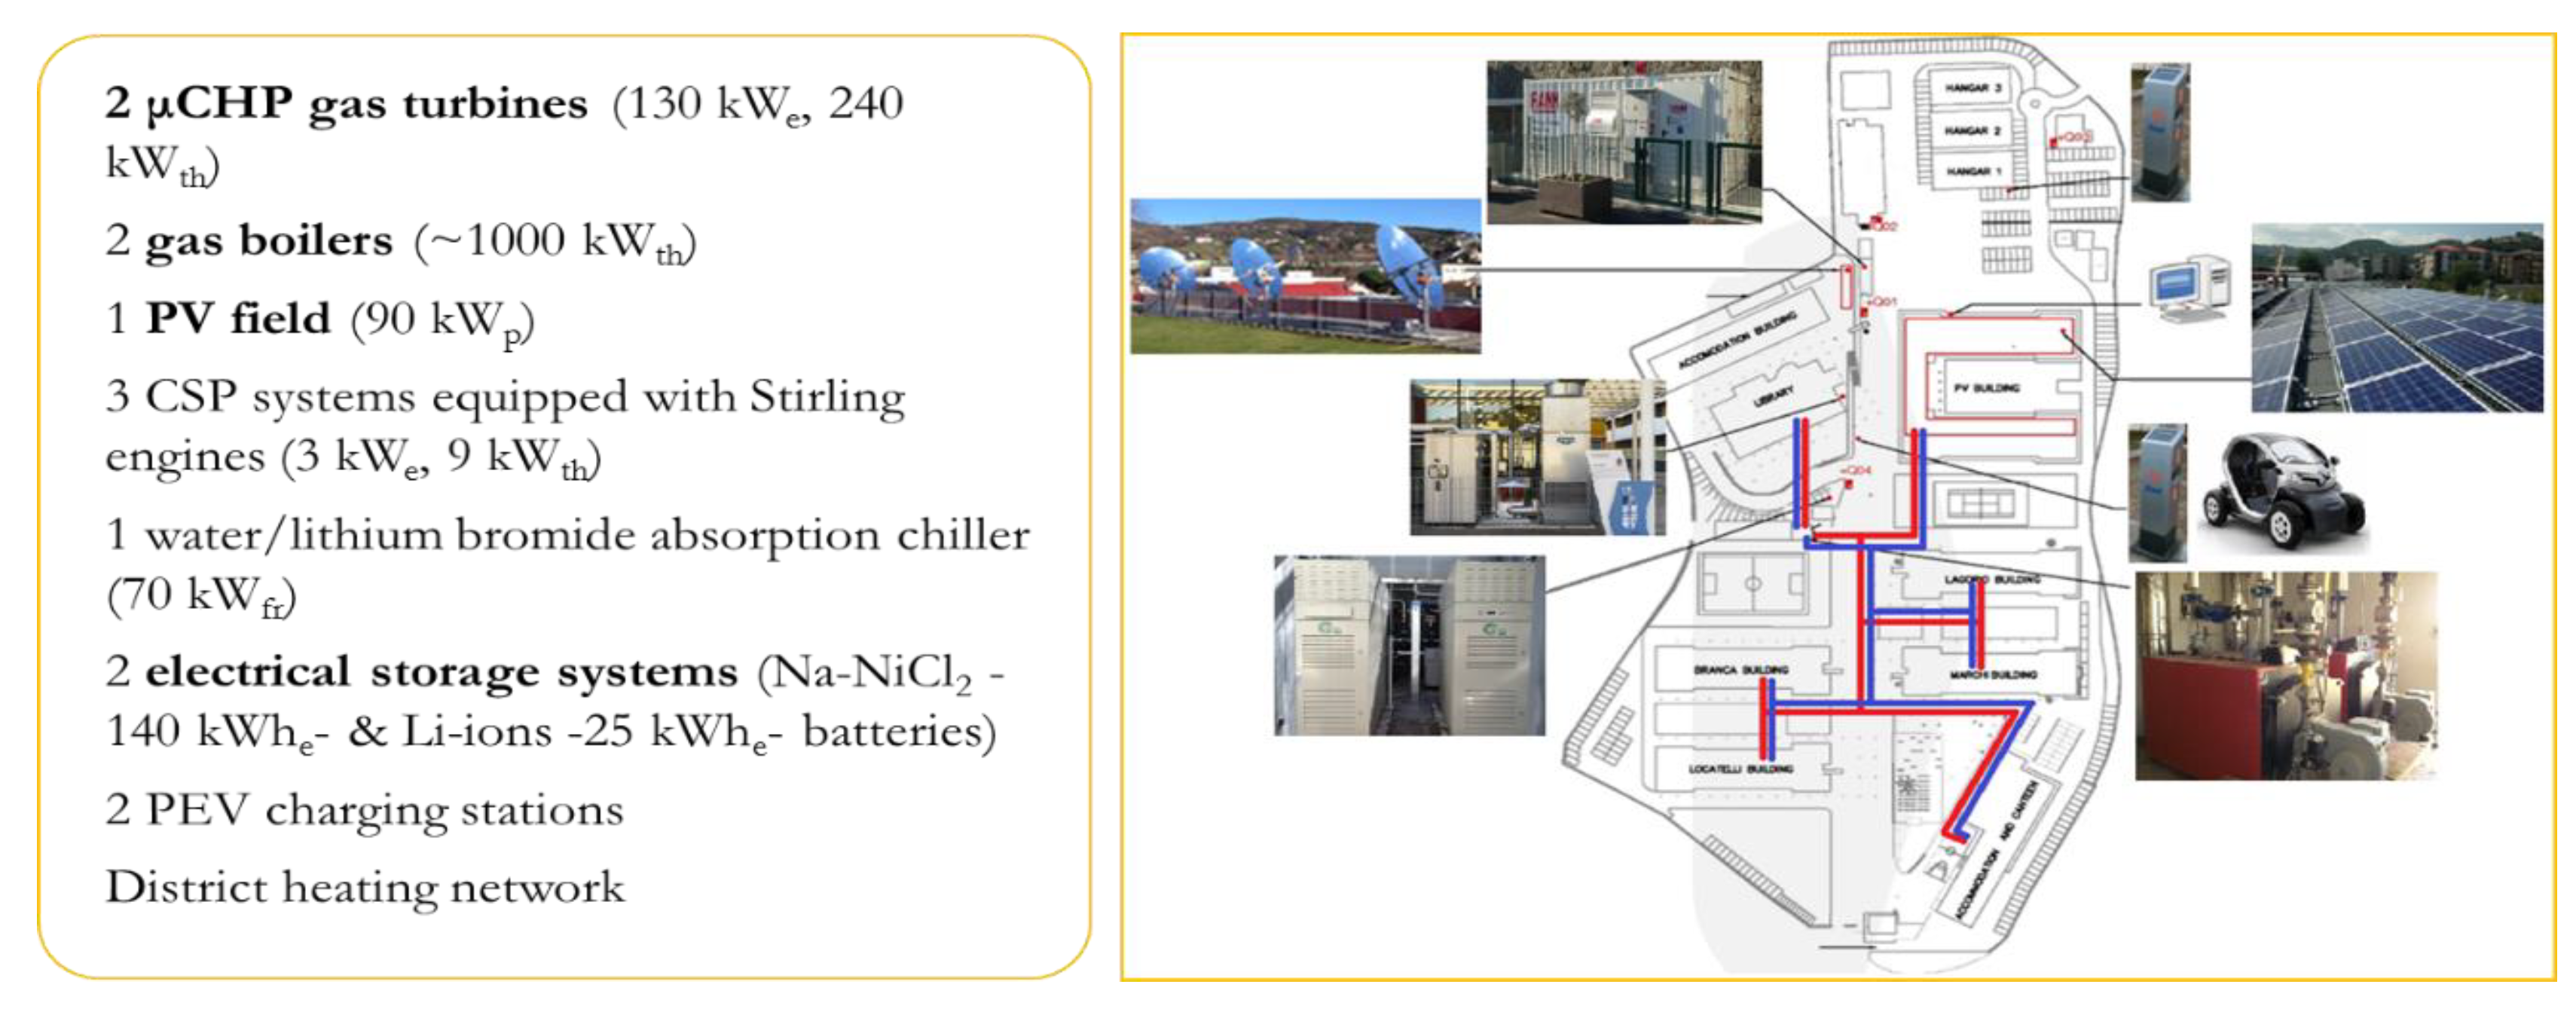
4.2.1. Infrastructure/Asset/Components

The microgrid supervisory control and data acquisition (SCADA) system is used to share information with the DSS tool via an ftp connection. More specifically, the following weather forecasting information is acquired on daily basis: outdoor temperature, relative humidity, pressure, global radiation and rainfall. In addition, the following data streams are shared (Figure 2): Actual solar radiation; electrical power produced by the PV field; electrical power produced by the grid connected microturbine; electrical power produced by the dual mode microturbine; thermal power produced by the grid connected microturbine; thermal power produced by the dual mode microturbine; electrical power exchanged by the storage; electrical power exchanged with the external network; thermal power from the boilers; chiller thermal power in input and in output.

4.2.2. Data Governance and Processing

Given that PV production and weather data were collected without any problems worth mentioning, we exploited a sample of 12 months to analyze energy production. The production was not standard as it strongly depended on the radiation levels in the field. The mean PV production of the campus for each hour of the day was also analyzed. Production began to increase at around 7:00 and reaches a peak at 14:00. After this point, production was reduced until sunset, when it reached a value of zero. In this respect, 15 MLR models were calculated (from 7:00 to 20:59). From 21:00 to 6:59 energy production was not detected and the corresponding prediction values were set to zero.
The estimation of the expected energy to be produced by the PV plant at 07:00–07:59 ( PV prod ( 07 : 00 07 : 59 ) ), 16:00–16:59 ( PV prod ( 16 : 00 16 : 59 ) ) and 18:00–18:59 ( PV prod ( 18 : 00 18 : 59 ) ) is given by the following formulas:
PV prod ( 07 : 00 07 : 59 ) = Constant + a Solar   Radiation + b Solar   Radiation 2
PV prod ( 16 : 00 16 : 59 ) = Constant + a Solar   Radiation + b SolarRadiation 2 + c Humidity
PV prod ( 18 : 00 18 : 59 ) = Constant + a Month + b Temperature + c Humidity + d SolarRadiation + e Dewpoint + f SolarRadiation 2
The parameters (a–f) are calculated by linearly correlating the radiation and humidity values with these of the PV production measured. The polynomial form of the models was chosen to enable its fit to non-linear patterns and make it more flexible to temporal changes. The regression coefficients of the MLR models were re-estimated periodically (every two months) using an automated process.
A data-cleansing approach was implemented before the coefficients of the MLR models were calculated. The removal of the outliers, high leverage points through standardized residuals and the calculation of the Cook’s distance to the observations were included [69]. Finally, the collinearity and the p-values/F-statistic were checked, and additional adjustments were performed as necessary.

4.2.3. Data Analytics

Using the DSS tool, an actual action is required by the user (energy manager) only when an alarm is triggered, due to a detected anomaly in the produced energy values. The proposed approach provides 95% accuracy, when a deviation ( ε ) between predicted ( y ^ ) and actual ( y ) values is detected and exceeds the 5% accepted error. Then, an alarm should be sent by the system, in order to notify the user of the possible need for maintenance of the PV system.
The modelling and the whole forecasting procedure were performed using the R software platform. R is a software environment and programming language focusing on data manipulation, calculation and graphical display such as (linear and nonlinear modelling, classical statistical tests, time-series analysis, classification, clustering, etc.).

4.2.4. Results

Starting from April 2016, the DSS tool was available for the campus. For instance, at the end of June 2016, when an alarm was triggered for the campus PV, the user verified that an actual problem affected the system (in particular, the inverter connecting it to the network) by inspecting the values of the power produced by the PV, which are logged in the microgrid SCADA; the behavior of the power over time evidenced that the system kept going off-line and restarting due to a fault in the inverter controller, thus causing the loss of generated energy (Figure 3). In this respect, the user contacted the inverter maintenance service to solve this malfunction.
The DSS tool has a diagnostic nature, so its impact can be evaluated only in terms of avoided costs or avoided loss of production. For instance, if the problem affecting the PV inverter was not detected, supposing a daily production of about 300 kWh for that period and a reduction of the 50% due to the problem, a loss of about 150 kWh per day would have occurred. The DSS tool intervention prevented an energy loss of about half the PV production per day. An unmeasurable outcome is how the managers of the installation run it. For example, within the implementation of the PV maintenance the DSS users have significantly reduced the visits to the PV installation to check the operation of the panels for possible errors.

5. Enabling Data-Driven Applications and Services for Buildings

This multi-scale and multi-stakeholder approach, presented in Section 3, can enable the development of data-driven applications and services for any stakeholder involved in the BVC.

5.1. Data-Driven Management of Self-Production Systems in Energy Communities

Nowadays, some prosumers have access to data regarding the production of energy from their Renewable Energy System (RES) self-consumption system and know what they are consuming from the grid [70]. However, they do not have tools where they can match that data or analyze it or receive indications on how to better management their energy consumption in accordance with their production. Energy cooperatives also have members which are in energy poverty and do not know what they can do to tackle that problem; in general, all members want to have more information on energy savings [71].
In this context, new applications can be provided to cross data coming from smart meters and from energy bills with the data from energy performance certificates. With this crossing tools, it will be possible to match the real consumption of electricity with the energy performance certificate, which are geo-referenced. More specifically, the aim is to support members of an energy cooperative to better manage their self-production system (for prosumers) and to improve the energy performance of the households (for the members with supplier contract).
The outcomes of these tools could also be used by municipalities to better identify people in energy poverty and to realize how they could help them to tackle that issue. Policy makers could also use these tools to understand how energy poverty is more located in the country due to the analysis of real consumption data and adapt and create more policies to better help those people.

5.2. SECAPs Impact Assessment, Implementation and Monitoring

Local and regional authorities during the past decade have been actively engaged in sustainable energy policy planning [72], with efforts also placed the last couple of years on integrating climate planning as well, through the initiative of the (Global) Covenant of Mayors for Climate and Energy (CoM). In this aspect, the authorities produce Sustainable Energy and Climate Action Plans (SECAPs) that are focusing on the climate resilience of the public infrastructure and services, as well as reduction of the local authorities’ energy consumption and carbon footprint, through a wide range of actions that mainly target the municipal lighting and transport sectors and the buildings of the municipal, tertiary and residential sectors [73].
The actions included in the SECAPs are a significant data source for activities of business interest to a wide range of stakeholders, including among others building component manufacturers and installers, especially concerning renovation activities, such as double glazing and buildings’ insulation (walls, roofs, floor), RES installers (photovoltaics, solar water heaters, biomass burners etc.), architecture companies (bioclimatic design), urban planners, street lighting wholesale companies, ESCOs, as well as civic crowdfunding projects, etc. It is thus clear that a market opportunity is there but needs data retrieval and classification in user friendly databases, where interested market actors and other municipalities can easily and quickly navigate around [74].
The challenge is to retrieve these data from SECAPs, as well as monitoring reports, not only from the CoM, but other databases (e.g., carbonn Climate Registry [75]) or initiatives at the national level (Lighthouse cities, etc.), analyze and integrate them in apposite sectoral actions at the local/regional/national level. In this respect, different types of data can be collected and analyzed, using the data-driven architecture, as follows:
  • Data related to the planned actions’ characteristics and specific category: building, street lighting or transport action, as well as the type of the action (e.g., building insulation, etc.) and more specific characteristics, such as the envisaged energy savings, envelope design, construction techniques and materials, size, building type, appliances used, lighting technology etc.
  • Data about the envisaged costs, discount rates used, as well as any calculated financial indicators, such as net present value (NPV), internal rate of return (IRR), etc.
  • Data regarding the reduction of the carbon footprint and cross comparison with similar actions from other plans at the national and European level.

5.3. Next Generation Energy Performance Assessment and Certification

Energy performance certificates (EP certificates) are among the most important drivers of energy performance of the European building stock [76]. They provide a picture of the current state of the building stock in terms of energy efficiency and include recommendations to improve the buildings’ energy performance. In each EU country, EP certificates data have been collected using different energy assessment tools and procedures. They have been stored in disperse databases and in multiple formats. Moreover, there is not a common vocabulary to define the contents of EP certificates in different EU countries.
In order to make analyses of EP certificates data cutting across countries and domains, a unique representation of their content is required. Besides the structured attributes that an EP Certificate record contains, there are non-structured data provided by energy technicians (usually in natural language), such as refurbishment measures, building regulations, etc. This information cannot be processed and structured and, therefore, cannot be used to enrich the EP certificates data [77].
The integration of EP certificates with other data sources (e.g., building regulations, socioeconomic data, building materials and systems, financial investments, etc.) is fundamental for third parties, in order to analyze the building stock and take actions to improve it. For instance, to identify a building typology which is amenable to renovation, to carry out a deep refurbishment plan at the municipal, regional or even national and trans-national scales. This requires not only to have access to the data, but to integrate them so that a multidimensional analysis can be performed.
Based on the analyses of the above-mentioned multidimensional, cross-domain and multi-lingual data, new applications can give rise to new business opportunities for ESCOs, building components manufacturers, construction companies, etc. Specific data analysis and visualization tools will enable to meet the requirements of specific beneficiaries.

5.4. Improving the Financeability of Energy Efficiency Investments

The energy efficiency projects are often fragmented, with high transaction costs and fall below the minimum value that many private financial institutions are willing to consider. The finance community is lacking a tested, evidence-based platform, providing decision makers with support in regard to the impacts of various investment criteria, risk-aware assessment and performance applied on a pool of energy efficiency investments [78]. The capability offered by emerging near big data analytics to integrate cross-domain financial and energy consumption is the key for building the necessary market confidence in energy efficiency projects and making them an attractive investment asset class. The availability of comparable, anonymized historical data, pooled from the major market segments for buildings and corporates and structured along major project characteristics can encourage a greater energy efficiency investment flow [79].
New data-driven applications, built on the proposed reference architecture, can attract and mobilize private funding on energy efficiency projects, providing investors/financiers (e.g., commercial/green investment banks, institutional and insurance funds) and project developers (public/local authorities, providers of energy companies, ESCOs, construction companies, architects, etc.) with data and tools, in order to identify sustainable investment pathways and decrease the risk of investing in energy efficiency.
In this context, different types of data can be exploited, as follows: energy data (energy consumption before and after the saving measures, avoided CO2 emissions, etc.); financial data (upfront capital expenditure, total volume of the investment, type and sources of financing, payback period, market value and many others), enabling a deep understanding of the financial aspects of the investment.; secondary data (location, type of investment, market segment, type of project promoter and type of asset or user profile); large databases for energy efficiency investments performance monitoring and benchmarking, with extensive data on the existing projects in the EU countries, such as De-risking Energy Efficiency Platform (DEEP) (including more than 5000 projects in buildings).
Extensive processing of these data can be applied, in order to elaborate and categorize financing instruments and risk mitigation strategies, as well as to identify best practices on private financing which can be considered as a basis for benchmarking.

5.5. Data-Driven Policy Making and Policy Impact Assessment for Energy-Efficient Buildings

The European Commission (EC) presented its long-awaited vision for a European Green Deal [80] which, among other objectives, aims at making the continent CO2 neutral by 2050. Among the various announced initiatives, the EC proposes to work with stakeholders on a new renovation initiative in 2020, whose aim would be to organize renovation efforts, lifting national regulatory barriers to renovation and focusing in particular on social housing [81,82].
The public, cooperative and social housing providers are in position to play a leading role in this transition, as they are already key drivers of the renovation efforts across Europe. However, the role of the sector in the successful implementation of the future European Green Deal cannot be overestimated but could benefit from the right policy and financial framework. To this end, extensive processing of these data can be applied using the data-driven architecture, in order to elaborate and categorize policy instruments and risk mitigation strategies, as well as to identify best practices on right policy and financial framework which can be considered as a basis for benchmarking and for policy implementation and its link to financial mechanisms.
In this respect, an accurate vision of the impact of the implemented policies is offered, enabling the identification and benchmarking of best practices, which can be replicated in order to achieve the maximum impact. In turn, the setting of objectives within policies can be facilitated. The reliable deployment of actions can be induced by linking policy objectives to the specific actions that have been proven most effective and to the financing mechanisms and business models capable of unlocking them.

6. Conclusions

This paper presented a high-level data-driven architecture that aims to combine existing modern technological breakthroughs in the areas of the DLTs/blockchain, ML/DL and big data, in order to develop a new decision-making and data analytics solutions for energy management and energy-efficient buildings. The proposed approach realizes a holistic, state-of-the-art AI-empowered framework for decision-support models, data analytics and visualizations for the building sector.
The proposed framework provides the necessary capabilities for pushing forward scalable big data management and processing, with a view to reduce some of the major barriers actually hampering big data and analytics full scale deployment in the emerging smart energy-efficient buildings domain, i.e., the excessive communication costs and the need for keeping generated data as much as possible closer to the generation point and the owner.
A library of trained models is introduced, aiming at solving problems that may constitute building blocks for more complex problems, such as energy prediction, geo-clustering, energy performance prediction, multi-criteria assessment of building interventions, etc. These advanced data processing and management methods are combined in view of providing advanced and precise statistical analysis, data visualization, business intelligence, predictive modelling and multi-criteria decision support systems.
It is expected to have a significant impact on the building sector and its lifecycle, as it will have the ability to be utilized in a wide range of use cases under different perspectives, including, but not limited to: monitor and improve the energy performance of buildings; facilitate the design and development of building infrastructure; support policy making and policy impact assessment; de-risk investments in energy efficiency.

Funding

This research was funded by the Institute of Communication and Computer Systems (ICCS).

Acknowledgments

The author wishes to thank Massimo Bertoncini (Engineering Ingegneria Informatica Spa|Italy), Gema Hernández Moral and César Valmaseda (CARTIF Technology Center|Spain), whose contribution, helpful remarks and fruitful observations were invaluable for the development of this work. It should be noted that the case study is based on research conducted within the framework of the project “OPTIMising the energy USe in cities with smart decision support system (OPTIMUS)”. In this respect, the author wishes to acknowledge the contributions of Evangelos Spiliotis (National Technical University of Athens, Greece) and Mansueto Rossi (Università degli Studi di Genova, Italy). The content of the paper is the sole responsibility of its author and does not necessary reflect the views of the EC.

Conflicts of Interest

The author declares no conflict of interest.

References

  1. United Nations. World’s Population Increasingly Urban with More Than Half Living in Urban Areas. 2014. Available online: https://www.un.org/en/development/desa/news/population/world-urbanization-prospects-2014.html (accessed on 18 January 2020).
  2. Word Green Building Council. COP24: Time to Address the Building and Construction Sector’s Total Emissions Impact. 2018. Available online: https://www.worldgbc.org/news-media/cop24-time-address-building-and-construction-sector%E2%80%99s-total-emissions-impact (accessed on 28 January 2020).
  3. Doukas, H.; Nikas, A. Decision support models in climate policy. Eur. J. Oper. Res. 2020, 280, 1–24. [Google Scholar] [CrossRef]
  4. Petidis, I.; Aryblia, M.; Daras, T.; Tsoutsos, T. Energy saving and thermal comfort interventions based on occupants’ needs: A students’ residence building case. Energy Build. 2018, 174, 347–364. [Google Scholar] [CrossRef]
  5. European Commission. Energy Use in Buildings. Available online: https://ec.europa.eu/energy/en/eu-buildings-factsheets-topics-tree/energy-use-buildings (accessed on 12 January 2020).
  6. United Nations Climate Change. What Is the Paris Agreement? Available online: https://unfccc.int/process-and-meetings/the-paris-agreement/what-is-the-paris-agreement (accessed on 18 December 2019).
  7. European Commission. Energy Performance of Buildings Directive. Available online: https://ec.europa.eu/energy/en/topics/energy-efficiency/energy-performance-of-buildings/energy-performance-buildings-directive (accessed on 28 January 2020).
  8. European Commission. Directive 2012/27/EU of the European Parliament and of the Council of 25 October 2012 on Energy Efficiency, Amending Directives 2009/125/EC and 2010/30/EU and Repealing Directives 2004/8/EC and 2006/32/EC; European Commission: Brussels, Belgium, 2012. [Google Scholar]
  9. European Commission. Directive (EU) 2018/2002 of the European Parliament and of the Council of 11 December 2018 Amending Directive 2012/27/EU on Energy Efficiency; European Commission: Brussels, Belgium, 2018. [Google Scholar]
  10. European Commission. Directive 2009/125/EC of the European Parliament and of the Council of 21 October 2009 Establishing a Framework for the Setting of Ecodesign Requirements for Energy-Related Products (Recast); European Commission: Brussels, Belgium, 2009. [Google Scholar]
  11. European Commission. Regulation (EU) 2017/1369 of the European Parliament and of the Council of 4 July 2017 Setting a Framework for Energy Labelling and Repealing Directive 2010/30/EU; European Commission: Brussels, Belgium, 2017. [Google Scholar]
  12. Ecodesign. Available online: https://ec.europa.eu/growth/industry/sustainability/ecodesign_en (accessed on 28 January 2020).
  13. Marinakis, V.; Doukas, H. An advanced IoT-based system for intelligent energy management in buildings. Sensors 2018, 18, 610. [Google Scholar] [CrossRef] [PubMed] [Green Version]
  14. Bhattarai, B.P.; Paudyal, S.; Luo, Y.; Mohanpurkar, M.; Cheung, K.; Tonkoski, R.; Manic, M. Big data analytics in smart grids: State-of-the-art, challenges, opportunities, and future directions. IET Smart Grid 2019, 2, 141–154. [Google Scholar] [CrossRef]
  15. Pancholi, S. Solving Big Data Challenges, Us Electric Utility Industry. In Proceedings of the IEEE PES General Meeting Presentation, National Harbor, MD, USA, 27–31 July 2014. [Google Scholar]
  16. Wen, L.; Zhou, K.; Yang, S.; Li, L. Compression of smart meter big data: A survey. Renew. Sustain. Energy Rev. 2018, 91, 59–69. [Google Scholar] [CrossRef]
  17. Marinakis, V.; Doukas, H.; Tsapelas, J.; Mouzakitis, S.; Sicilia, Á.; Madrazo, L.; Sgouridis, S. From big data to smart energy services: An application for intelligent energy management. Future Gener. Comput. Syst. 2018. [Google Scholar] [CrossRef]
  18. Ferreira, J.; Agostinho, C.; Lopes, R.; Chatzikokolakis, K.; Zissis, D.; Vidal, M.E.; Mouzakitis, S. Maritime Data Technology Landscape and Value Chain Exploiting Oceans of Data for Maritime Applications. In Proceedings of the 2017 International Conference on Engineering, Technology and Innovation (ICE/ITMC), Funchal, Portugal, 27–29 June 2017. [Google Scholar]
  19. Wang, Y.; Chen, Q.; Kang, C.; Xia, Q. Clustering of electricity consumption behavior dynamics toward big data applications. IEEE Trans. Smart Grid 2016, 7, 2437–2447. [Google Scholar] [CrossRef]
  20. Sheng, G.; Hou, H.; Jiang, X.; Chen, Y. A novel association rule mining method of big data for power transformers state parameters based on probabilistic graph model. IEEE Trans. Smart Grid 2018, 9, 695–702. [Google Scholar] [CrossRef]
  21. Wei, Y.; Zhang, X.; Shi, Y.; Xia, L.; Pan, S.; Wu, J.; Han, M.; Zhao, X. A review of data-driven approaches for prediction and classification of building energy consumption. Renew. Sustain. Energy Rev. 2018, 82, 1027–1047. [Google Scholar] [CrossRef]
  22. Amasyali, K.; El-Gohary, N.M. A review of data-driven building energy consumption prediction studies. Renew. Sustain. Energy Rev. 2018, 81, 1192–1205. [Google Scholar] [CrossRef]
  23. Yu, Z.; Haghighat, F.; Fung, B.C.M. Advances and challenges in building engineering and data mining applications for energy-efficient communities. Sustain. Cities Soc. 2016, 25, 33–38. [Google Scholar] [CrossRef] [Green Version]
  24. Ahmad, T.; Chen, H.; Huang, R.; Yabin, G.; Wang, J.; Shair, J.; Muhammad, H.; Akram, A.; Agha, S.; Mohsan, H.; et al. Supervised based machine learning models for short, medium and long-term energy prediction in distinct building environment. Energy 2018, 158, 17–32. [Google Scholar] [CrossRef]
  25. Deb, C.; Siew Eang, L.; Yang, J.; Santamouris, M. Forecasting diurnal cooling energy load for institutional buildings using Artificial Neural Networks. Energy Build. 2016, 121, 284–297. [Google Scholar] [CrossRef]
  26. Sadeghi, A.; Sinaki, R.Y.; Young, W.A.; Weckman, G.R. An intelligent model to predict energy performances of residential buildings based on deep neural networks. Energies 2020, 13, 571. [Google Scholar] [CrossRef] [Green Version]
  27. Dong, B.; Cao, C.; Eang Lee, S. Applying support vector machines to predict building energy consumption in tropical region. Energy Build. 2005, 37, 545–553. [Google Scholar] [CrossRef]
  28. Chen, Y.B.; Tan, H. Short-term prediction of electric demand in building sector via hybrid support vector regression. Appl. Energy 2017, 204, 1363–1374. [Google Scholar] [CrossRef]
  29. Fan, C.; Xiao, F.; Wang, S. Development of prediction models for next-day building energy consumption and peak power demand using data mining techniques. Appl. Energy 2014, 127, 1–10. [Google Scholar] [CrossRef]
  30. Wang, Z.Y.; Wang, Y.; Srinivasan, R.S. A novel ensemble learning approach to support building energy use prediction. Energy Build. 2018, 159, 109–122. [Google Scholar] [CrossRef]
  31. Zeng, A.; Liu, S.; Yu, Y. Comparative study of data driven methods in building electricity use prediction. Energy Build. 2019, 194, 289–300. [Google Scholar] [CrossRef]
  32. Zhou, K.; Fu, C.; Yang, S. Big data driven smart energy management: From big data to big insights. Renew. Sustain. Energy Rev. 2016, 56, 215–225. [Google Scholar] [CrossRef]
  33. Livani, H. Supervised Learning-Based Fault Location in Power Grids. In Big Data Application in Power Systems; Arghandeh, R., Zhou, Y., Eds.; Elsevier: Amsterdam, The Netherlands, 2018; pp. 303–319. [Google Scholar]
  34. Andrew, C.; Kilcher, L.; Lundquist, J.K.; Fleming, P. Using machine learning to predict wind turbine power output. Environ. Res. Lett. 2013, 8, 024009. [Google Scholar] [CrossRef]
  35. Heinermann, J.; Kramer, O. Machine learning ensembles for wind power prediction. Renew. Energy 2016, 89, 671–679. [Google Scholar] [CrossRef]
  36. Miller, C.; Nagy, Z.; Schlueter, A. A review of unsupervised statistical learning and visual analytics techniques applied to performance analysis of non-residential buildings. Renew. Sustain. Energy Rev. 2018, 81, 1365–1377. [Google Scholar] [CrossRef]
  37. Fan, C.; Xiao, F.; Li, Z.; Wang, J. Unsupervised data analytics in mining big building operational data for energy efficiency enhancement: A review. Energy Build. 2018, 159, 296–308. [Google Scholar] [CrossRef]
  38. Lapalu, J.; Bouchard, K.; Bouzouane, A.; Bouchard, B.; Giroux, S. Unsupervised mining of activities for smart home prediction. Procedia Comput. Sci. 2013, 19, 503–510. [Google Scholar] [CrossRef] [Green Version]
  39. Fiorini, L.; Cavallo, F.; Dario, P.; Eavis, A.; Caleb-Solly, P. Unsupervised machine learning for developing personalised behaviour models using activity data. Sensors 2017, 17, 1034. [Google Scholar] [CrossRef] [Green Version]
  40. Naganathan, H.; Chong, W.K.; Chen, X. Semi-supervised Energy Modeling (SSEM) for building clusters using machine learning techniques. Procedia Eng. 2015, 118, 1189–1194. [Google Scholar] [CrossRef] [Green Version]
  41. Aicha, N.; Englebienne, G.; Krse, B. Modeling Visit Behaviour in Smart Homes Using Unsupervised Learning. In Proceedings of the 2014 ACM International Joint Conference on Pervasive and Ubiquitous Computing: Adjunct Publication, ser. UbiComp ‘14 Adjunct, New York, NY, USA, 13–17 September 2014; pp. 1193–1200. [Google Scholar]
  42. Zhang, C.; Bengio, S.; Hardt, M.; Recht, B.; Vinyals, O. Understanding Deep Learning Requires Rethinking Generalization. arXiv 2017, arXiv:1611.03530. [Google Scholar]
  43. Shokri, R.; Stronati, M.; Song, C.; Shmatikov, V. Membership inference attacks against machine learning models. arXiv 2017, arXiv:1610.05820. [Google Scholar]
  44. Bassily, R.; Smith, A.D.; Thakurta, A. Differentially private empirical risk minimization: Efficient algorithms and tight error bounds. arXiv 2014, arXiv:1405.7085. [Google Scholar]
  45. McMahan, H.B.; Ramage, D.; Talwar, K.; Zhang, L. Learning differentially private language models without losing accuracy. arXiv 2017, arXiv:1710.06963. [Google Scholar]
  46. Papernot, N.; Song, S.; Mironov, I.; Raghunathan, A.; Talwar, K.; Erlingsson, Ú. Scalable private learning with PATE. arXiv 2018, arXiv:1802.08908. [Google Scholar]
  47. Doukas, H.; Patlitzianas, K.D.; Iatropoulos, K.; Psarras, J. Intelligent building energy management system using rule sets. Build. Environ. 2007, 42, 3562–3569. [Google Scholar] [CrossRef]
  48. LEAP, the Long-Range Energy Alternatives Planning System. Available online: http://www.energycommunity.org/default.asp?action=47 (accessed on 28 January 2020).
  49. AleaSoft. Available online: http://www.aleasoft.com/ (accessed on 28 January 2020).
  50. Modelica Association. Available online: http://www.modelica.org (accessed on 28 January 2020).
  51. Spiliotis, E.; Assimakopoulos, V.; Makridakis, S. Generalizing the Theta method for automatic forecasting. Eur. J. Oper. Res. 2020, 284, 550–558. [Google Scholar] [CrossRef]
  52. Mocanu, E.; Nguyen, P.H.; Kling, W.L.; Gibescu, M. Unsupervised energy prediction in a Smart Grid context using reinforcement cross-building transfer learning. Energy Build. 2016, 116, 646–655. [Google Scholar] [CrossRef] [Green Version]
  53. Spiliotis, E.; Petropoulos, F.; Kourentzes, N.; Assimakopoulos, V. Cross-temporal aggregation: Improving the forecast accuracy of hierarchical electricity consumption. Appl. Energy 2020, 261, 114339. [Google Scholar] [CrossRef]
  54. Bees, D.; Frost, L.; Bauer, M.; Fisher, M.; Li, W. NGSI-LD API: For Context Information Management. ETSI White Paper No. 31. 2019. Available online: https://www.etsi.org/images/files/ETSIWhitePapers/etsi_wp31_NGSI_API.pdf (accessed on 28 January 2020).
  55. FIWARE Smart Energy. Available online: https://www.fiware.org/community/smart-energy/ (accessed on 28 January 2020).
  56. Lee, S.-K.; Kim, K.-R.; Yu, J.-H. BIM and ontology-based approach for building cost estimation. Autom. Constr. 2014, 41, 96–105. [Google Scholar] [CrossRef]
  57. Smart Appliances REFerence (SAREF) Ontology. Available online: https://sites.google.com/site/smartappliancesproject/ontologies/reference-ontology (accessed on 12 January 2020).
  58. Villalon, P.M.; Castro, G.R. SAREF Extension for Building Device. 2017. Available online: http://ontoology.linkeddata.es/publish/saref4bldg/index-en.html (accessed on 12 January 2020).
  59. Brick. Available online: https://brickschema.org/ (accessed on 12 January 2020).
  60. Project Haystack. Available online: https://project-haystack.org/ (accessed on 12 January 2020).
  61. BuildingSMART International. IFC Specifications Database. Available online: https://technical.buildingsmart.org/standards/ifc/ifc-schema-specifications/ (accessed on 12 January 2020).
  62. BACnet—A Data Communication Protocol for Building Automation and Control Networks. Available online: http://www.bacnet.org/ (accessed on 12 January 2020).
  63. LonMark International. Available online: http://www.lonmark.org/ (accessed on 12 January 2020).
  64. Behera, M.K.; Majumder, I.; Nayak, N. Solar photovoltaic power forecasting using optimized modified extreme learning machine technique. Eng. Sci. Technol. Int. J. 2018, 21, 428–438. [Google Scholar] [CrossRef]
  65. Trigo-González, M.; Batlles, F.J.; Alonso-Montesinos, J.; Ferrada, P.; del Sagrado, J.; Martínez-Durbán, M.; Cortés, M.; Portillo, C.; Marzo, A. Hourly PV production estimation by means of an exportable multiple linear regression model. Renew. Energy 2019, 135, 303–312. [Google Scholar] [CrossRef]
  66. Spiliotis, E.; Kouloumos, A.; Assimakopoulos, V.; Makridakis, S. Are forecasting competitions data representative of the reality? Int. J. Forecast. 2020, 36, 37–53. [Google Scholar] [CrossRef]
  67. Bracco, S.; Delfino, F.; Ferro, G.; Pagnini, L.; Robba, M.; Rossi, M. Energy planning of sustainable districts: Towards the exploitation of small size intermittent renewables in urban areas. Appl. Energy 2018, 228, 2288–2297. [Google Scholar] [CrossRef]
  68. Bracco, S.; Brignone, M.; Delfino, F.; Procopio, R. An Energy Management System for the Savona Campus Smart Polygeneration Microgrid. IEEE Syst. J. 2017, 11, 1799–1809. [Google Scholar] [CrossRef]
  69. Sicilia, Á.; Costa, G.; Doukas, H.; Spiliotis, E.; Anastasopoulos, G.; Capozzoli, A.; Corrado, V.; Gorrino, A.; Tellado, B. Analysis Tools to Process Data and Inference Rules; Deliverable No: 3.2; OPTIMising the Energy USe in Cities with Smart Decision Support System; OPTIMUS, 2016. [Google Scholar]
  70. Sifakis, N.; Savvakis, N.; Daras, T.; Tsoutsos, T. Analysis of the energy consumption behavior of European RES cooperative members. Energies 2019, 12, 970. [Google Scholar] [CrossRef] [Green Version]
  71. Chalkiadakis, G.; Akasiadis, C.; Savvakis, N.; Tsoutsos, T.; Hoppe, T.; Coenen, F. Providing a scientific arm to renewable energy cooperatives. Green Energy Technol. 2018, 717–731. [Google Scholar] [CrossRef]
  72. Tsoutsos, T.; Drandaki, M.; Frantzeskaki, N.; Iosifidis, E.; Kiosses, I. Sustainable energy planning by using multi-criteria analysis application in the island of Crete. Energy Policy 2009, 37, 1587–1600. [Google Scholar] [CrossRef]
  73. Doukas, H.; Papadopoulou, A.; Savvakis, N.; Tsoutsos, T.; Psarras, J. Assessing energy sustainability of rural communities using Principal Component Analysis. Renew. Sustain. Energy Rev. 2012, 16, 1949–1957. [Google Scholar] [CrossRef]
  74. Marinakis, V.; Doukas, H.; Xidonas, P.; Zopounidis, C. Multicriteria decision support in local energy planning: An evaluation of alternative scenarios for the Sustainable Energy Action Plan. Omega 2017, 69, 1–16. [Google Scholar] [CrossRef]
  75. The Carbonn® Center. Supporting Cities, Towns and Regions Tackling Climate Change to Create Transparency, Accountability and Credibility. Available online: http://carbonn.org/ (accessed on 12 January 2020).
  76. Li, Y.; Kubicki, S.; Guerriero, A.; Rezgui, Y. Review of building energy performance certification schemes towards future improvement. Renew. Sustain. Energy Rev. 2019, 113, 109244. [Google Scholar] [CrossRef]
  77. Miguel-Herrero, F.J.; Serna-González, V.I.; Hernández-Moral, G. Supporting tool for multi-scale energy planning through procedures of data enrichment. Int. J. Sustain. Energy Plan. Manag. 2019, 24, 125–134. [Google Scholar]
  78. Doukas, H. On the appraisal of “Triple-A” energy efficiency investments. Energy Sources Part B Econ. Plan. Policy 2018, 13, 320–327. [Google Scholar] [CrossRef]
  79. Stamtsis, G.; Doukas, H. Cooperation or localization in european capacity markets? A coalitional game over graph approach. Energies 2018, 11, 1473. [Google Scholar] [CrossRef] [Green Version]
  80. European Commission. The European Green Deal. COM(2019) 640 FInal; European Commission: Brussels, Belgium, 2019. [Google Scholar]
  81. Housing Europe. European Commission’s Green Deal Clearly Recognises Role of Social, Cooperative and Public Housing Providers in Making the “Renovation Wave” Happen While Acknowledging Obstacles and Financial Needs. 2019. Available online: http://www.housingeurope.eu/resource-1343/european-commission-s-green-deal-clearly-recognises-role-of-social-cooperative-and-public-housing-providers-in-making-the-renovation-wave-happen-while-acknowledging-obstacles-and-financial-needs (accessed on 12 January 2020).
  82. European Commission. Building and Renovating: The European Green Deal. 2019. Available online: https://ec.europa.eu/commission/presscorner/api/files/attachment/859198/Building_and_Renovating_en.pdf.pdf (accessed on 12 January 2020).
Figure 1. High-level data-driven architecture for buildings.
Energies 13 01555 g001
Figure 2. Monitoring of the Savona Campus.
Energies 13 01555 g002
Figure 3. Scheduling the PV maintenance in the Savona Campus.
Energies 13 01555 g003

