Abstract
Linear generator utilization in a wave energy converter (WEC) is an attractive alternative to a rotary generator. This paper presents the design of a permanent magnet linear machine (PMLM) for WEC applications in low wave power areas. In this paper, the wave height and vertical speed of Malaysian water is used for the simulation and design. Two design variants are introduced which are tubular PMLM with no spacer (TPMLM-NS) and tubular PMLM with spacer (TPMLM-S). Finite element analysis (FEA) has been conducted to investigate the performance and to refine the main dimensions of the design in terms of split ratio, pitch ratio and tooth width. The FEA results are then validated using an analytical method which is established according to the design’s magnetic field distribution. Based on main dimension refinement, it can be deduced that both the split ratio and the pitch ratio have a significant influence on the airgap flux density and back EMF of the design. The obtained FEA results also reveal that the TPMLM-NS variant is capable of producing 240 V back EMF, 1 kW output power with satisfactory efficiency. Consequently, this indicates the capability of the design to convert wave energy with good performance. Additionally, good agreement between the analytical predictions and FEA results was obtained with a low percentage of error, thus providing concrete assurance of the accuracy of the design.
1. Introduction
Electricity generation from renewable energy (RE) resources is one of the alternatives to attain energy sustainability and security as the demand for electricity grows. In Malaysia, hydro energy is the dominant RE source for electricity generation, contributing 10.8% of the production [1]. Other RE sources being utilized in Malaysia are solar energy and biomass. In addition to these major RE sources in Malaysia, the potential for wave energy utilization in electricity generation has also been investigated. Nasir et al. [2] stated that 48% of Malaysian waters are suitable for power generation and the average potential power from local waves is around 2.8–8.6 kW/m. This value is also supported by a study by Samrat et al. [3]. It is also reported that the ocean in the South China Sea areas such as offshore from Sabah, Sarawak and Terengganu has higher wave availability than West Peninsular Malaysia [2,3,4,5]. Therefore, even though the wave power value in Malaysia is low, there is still potential for the development of wave energy extraction [6]. Similarly, other areas with low wave power areas as Malaysia also have potential for wave power extraction with suitable usage of technology and system design. With the current technology of WEC and further research, the efficiency of the conversion from small input power can be increased [4]. Several works have been conducted on wave energy converter (WEC) development in Malaysia. Yaakob et al. [7] proposed a device based on oscillating water column (OWC) technology, while Ahmad et al. [8] presented a floating oscillating body technology for application at shoreline areas.
In addition to the WEC devices developed by Yaakob et al. [7] and Ahmad et al. [8], which convert the energy into electricity by mean of rotary generators, another alternative to convert wave energy into electricity via a direct drive linear generator is also possible. Unlike rotary generators which require a transmission system such as the turbine system used by Yaakob et al. [7] and hydraulic transfer as employed by Ahmad et al. [8], linear generators are able to directly drove the heaving motion of wave energy. This feature of linear generator in a WEC is advantageous as it can result in higher device efficiency and a simpler design concept [9,10]. Therefore, direct drive linear generator utilization in extracting wave energy from low wave power area is very attractive.
A WEC system consists of several sub-systems or conversion stages, as illustrated in Figure 1. From the figure, the direct drive linear generator conversion method requires a primary interface and also an electrical generator. Typically, floating buoy or point absorber technology is used as the primary interface to capture the motion of sea wave as depicted by Zhang et al. [11], Hodgins et al. [12] and Franzitta et al. [13]. As for linear generators, various specifications and topologies based on operating speed and applications have been proposed in the previous literature. In this paper, the focus is mainly to study the design of a linear generator to be used in a direct drive WEC system at low wave power areas such as Malaysia.
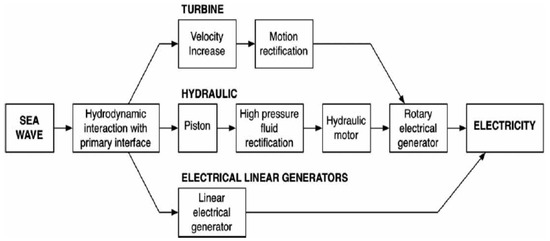
Figure 1.
Energy Conversion in WEC [14].
Tubular linear generator design structures have been extensively employed in previous works [11,15,16,17,18,19,20,21]. A tubular permanent magnet linear machine (PMLM) design with an air-cored winding for small scale WEC applications has been introduced by Kim et al. [19] with a rated stroke and speed of 100 mm and 0.3 m/s, respectively. The design yields an output voltage of 3.5 V at the rated output power of 3 W [19]. Likewise, a PMLM design by Zhang et al. [11] also employed a tubular structure for application at 0.4 m/s speed. The novelty of this design is the asymmetric slot structure which is reported to be able to reduce detent force and enhance the airgap flux density in the design [11]. A tubular switched reluctance linear machine (SRLM) has been proposed and analysed by Mendes et al. [20] using FEA, mathematical modelling and experiments. The SRLM design is found to perform effectively under condition of 1.3 m/s velocity with a maximum translation of 4.4 m.
In contrast, planar or flat structure designs have also been reported [22,23,24]. Kim et al. [23] proposed four-sided planar linear generator with an operating velocity of 0.7 m/s and an output voltage of 300 V. Each side of the four-sided structure is expected to give an output of 2 kW [23]. A PMLM design with a planar structure for application with a rated stroke and speed of 90 mm and 1 m/s, respectively, has been presented by Ibrahim et al. [22]. Additionally, the study added variations to the design in terms of the number of planar sides and position of the translator. Based on the analysis conducted on the design, the design variation with a three-sided and exterior translator produced the best output voltage of 199 V [22].
In addition to the structure topologies of the design, design variation in term of magnet configuration can also be observed in the previous designs. One of the most common magnet configurations used is radial magnetization, which has been implemented in [16,24,25]. Prudell et al. [25] presented a PMLM design with radial magnets for a 0.76 m/s velocity application with 1 kW output power. Few novelties were proposed in the design which are a seawater airgap for lubrication, cogging force reduction techniques (i.e., fractional pitch winding and shaped stator tooth) and radially oriented lamination to reduce core loss [25]. Similarly, Kumar et al. [24] also employed 6-pole radial magnets to yield sufficient flux in a single-phase PMLM design in producing a peak voltage of 150 V.
As opposed to the radial magnet configuration, the axial magnet configuration has also been reported in PMLM designs by Busa et al. [15] and Kim et al. [19]. In the work by Busa et al. [15], axial magnets are used for application in The Philippines. The design is capable of providing a peak voltage output of 9.819 V at a wave height of 0.3 m and velocity of 0.061 m/s [15].
In addition to radial and axial magnet configurations, a number of previous works have also employed Halbach magnets in their linear generator designs [11,17,18,22]. A Halbach magnet configuration was used by Si et al. [17] in their design in which the magnet assembly consists of both surface-mounted and interior magnets. FEA has been conducted on the design and the results show that the design is capable of improving the sinusoidal characteristics of the airgap flux density and increasing the efficiency as compared to conventional surface-mounted magnet designs [17].
From the presented previous works, it can be deduced that various linear generator designs have been proposed with various topologies and performances. It is also noted that linear generator performance is related to the application parameters such as the operating speed and translation limit of the design. Hence, it is very significant for this research to be conducted in proposing linear generator designs for WEC systems that consider the wave characteristics in low wave power areas.
This paper presents the details on a proposed linear generator which is designed by considering the wave characteristics of wave energy in low wave power areas, particularly Malaysia, to be used in direct drive point absorber WEC technology. The analysis in this paper consists of a finite element analysis (FEA) which is then validated using analytical methods based on Maxwell’s equations and Fourier series analysis of the proposed design.
2. Linear Generator Proposed Design
The proposed linear generator design considered the wave characteristics in the South China Sea around Malaysia as tabulated in Table 1. The average wave height and vertical wave speed was used to determine the translational limit and speed of the proposed translator, respectively. Therefore, the general specifications of the generator are as given in Table 2.

Table 1.
Wave Characteristics in South China Sea, Malaysia [5].

Table 2.
Specification of the Generator.
Due to the low wave power density in Malaysia waters, significant factors that are affecting the efficiency of the generator were prioritized in selecting the suitable topology of the proposed design, which are higher flux density and reduced power losses. In terms of machine type, a permanent magnet linear machine (PMLM) was deduced to be advantageous for this application due to its compact size, ability to provide adequate forces in low speed applications and high efficiency [26,27,28]. Additionally, the tubular configuration has high potential to be used in the proposed design predominantly due to the higher force density and efficiency of the configuration [19,29]. Similarly, slotted iron-cored topology was chosen due to the higher power density and efficiency offered by these configurations as opposed to slotless air-cored topology [30,31]. The conceptual proposed design is as shown in Figure 2. Radial magnetized magnets were employed in the design due to the simple configuration and installation of the magnets.
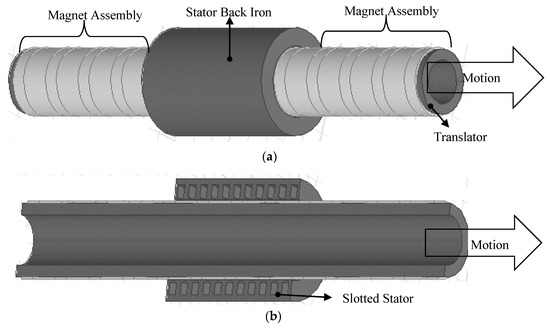
Figure 2.
3-dimension TPMLM Conceptual Design: (a) Full Design; (b) Cross Section.
The slow motion of ocean waves leads to the requirement of a larger size linear generator in producing a specific output power compared to rotary generators [9,21,32,33,34]. As the result, the material cost and weight of the system is also increased. Thus, a design alternative to the linear generator design was also introduced in order to reduce the total material cost as well as weight of the system at very minimal reduction of the performance of the generator which is the utilization of aluminium spacers as part of the magnet assembly.
As the size of machine increases, the number of magnets used will also increase. Permanent magnets, especially the neodymium (NdFeB) magnets that are mostly applied in present electrical machine designs are expensive and an increase in the number used will affect the material cost greatly, especially in long translator designs which use more magnets [25,35]. Aluminium spacers were proposed to replace some parts of the magnet as they are cheaper and less dense than permanent magnets. Spacers are usually used with axial magnet arrangements to assemble the same polarity magnet next to each other [36,37].
Therefore, two variants of the proposed design were introduced which are tubular PMLM (TPMLM) with no spacer (TPMLM-NS) and TPMLM with spacer (TPMLM-S). These variants are as shown in Figure 3 and Figure 4, respectively. The dimensions of the proposed designs are as presented in Table 3.

Figure 3.
2-Dimension Quarter Symmetry Cross-Section of TPMLM-NS Design Variant.

Figure 4.
2-Dimension Quarter Symmetry Cross-Section of TPMLM-S.

Table 3.
Dimensions of the Proposed Design.
3. Methods
The method used to analyse the linear generator is based on a numerical and analytical method. The numerical finite element analysis (FEA) method as provided in the Ansys Maxwell software was used. The design was solved using a 2-dimensional transient magnetic solution. Three setups were applied to the design for the analysis which are generator static no-load setup, generator moving no-load setup and motor static setup.
In the generator static no-load setup, no motion was induced on the design and the setup aims to acquire the open-circuit flux distribution and airgap flux density result. For the generator moving no-load setup, motion was introduced at the translator of the design with translation limit of 0.45 m and speed of 0.6 m/s (as in Table 2). From this setup, the open-circuit flux linkage and back EMF results can be obtained. Lastly, to compute the losses of the design, a motor static setup was applied. As the generator and motor can work interchangeably, the design was simulated to work as a motor and injected with current while monitoring the force induced at the translator. From the computed losses, the efficiency, , of the design can be calculated as follows:
where is the power output, is the copper loss and is the core loss.
Main dimension refinement of the design was also conducted using FEA. Main dimension refinement was conducted to investigate the influence of the dimensions on the performance of the proposed design and consequently ensure that the particular dimension is optimized to produce the optimal output. Main dimension refinement was done on four parameters which are the split ratio, pitch ratio, stator back-iron height and tooth width. Split ratio is the ratio of magnet radius, over outer stator radius, . Pitch ratio is the ratio of magnet width, τm to pole pitch, τp.
Refinement on the split ratio was conducted to find the optimal balance between the magnetic loading and the electrical loading of the design. The magnetic loading is represented by , while electrical loading is represented by the total height of the stator core (i.e., summation of and ) as shown in Figure 5. The refinement was done by varying the value while maintaining the value of . The effect of the variation was then analyzed in terms of airgap flux density and losses.

Figure 5.
Split Ratio, / Refinement.
Pitch ratio refinement was executed to investigate the influence of the magnet width over pole-pitch ratio on the design. In this refinement, the width of the magnet, τm, was varied while maintaining the pole-pitch, τp, value as shown in Figure 6. For TPMLM-NS, the width of north-polarity magnet, τmn was varied by altering the width of the south-polarity magnet, τms at the same time, while for TPMLM-S, the width of τmn and τms were varied against the width of the aluminum spacer, τas.
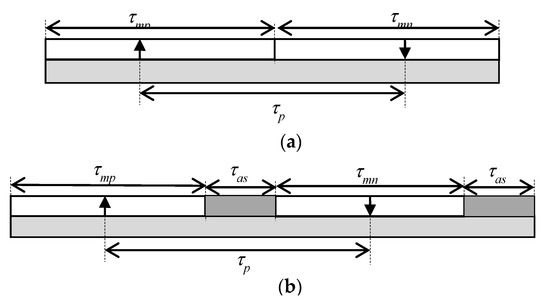
Figure 6.
Pitch Ratio, τm/τp Variation.
Lastly, refinement of the magnet tooth width, was done in order to find the optimal value that produces the optimal flux density at the stator core while balancing the changes in copper loss due to change in slot area. and values of the design were varied while maintaining the dimension of stator length, as illustrated in Figure 7.

Figure 7.
Tooth Width, Tw Variation.
The proposed design was also solved analytically by developing the model to validate the FEA results. The analytical method used in this paper is based on Maxwell’s equations and the equations were derived and solved according to the open-circuit magnetic field distribution of the design. This method is based on the analytical method proposed by [38] with several amendments in term of the coefficients for the solution as suggested by [39,40] and the Fourier series representation of magnetic distribution, of the design which need to be derived according to the magnet configurations. The analytical model was used to compute the flux density, flux linkage and back EMF of the design is as explained in Section 3.1.
3.1. Analytical Model Development and Computation
3.1.1. Open-Circuit Magnetic Field Distribution
The following assumptions were taken into account to establish the analytical model of the designs [39,40]:
- (1)
- Slotless machine topology with infinite permeability of the iron is considered. Slotting effects of the design is added by utilizing Carter’s coefficient [38] as calculated in:where g′ = g + hm/, is the stator slot-pitch, and is the slotting factor which can be defined as:where, is the axial length of slot opening. From Equation (1), the effective airgap length, ge can be computed as:
From Equation (4), the effective radius of the stator bore is:
where is outer radius of the magnet.
- (2)
- The axial length of the generator is infinite. The infinitely long translator consists of a series of permanent magnet (PM) armatures. The PM armature series are disconnected by the axial distance of as illustrated in Figure 8.
 Figure 8. Analytical Model of the Proposed Designs.
The magnetic field of the model is analysed based on two regions as also shown in Figure 8. Region I is the air region with permeability of , while region II is the PM region with the permeability of , where is the relative recoil permeability. In term of magnetic vector potential, , the principal field equations in cylindrical coordinates are [39,40]:
The magnetization, is defined as:
Due to the utilization of radial magnetized magnets in the proposed design, only , which indicates the components of the magnetization in the r directions, has value. The magnetic field distribution of the proposed design is as shown in Figure 9. The magnetization of the design is expressed as:
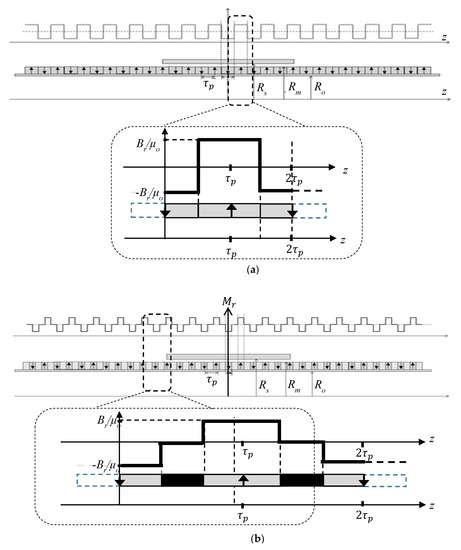
Figure 9.
Magnetic Distribution of the Design Variants; (a) TPMLM-NS; (b) TPMLM-S.
for TPMLM-NS variant can be represented by Fourier series of:
As for TPMLM-S, the can be represented as:
where , is the fundamental period of the series PM armature defined as , is the remanence of the magnet and is the pole-pitch. Hence, combining Equations (6)–(8), Equation (6) can be rewritten as:
of the design variants is expressed as:
As mentioned in [39] the analytical model has the following boundary conditions that need to be fulfilled, which are:
Solving for Equation (10) by taking into account the boundary conditions in Equation (13), yields flux density components expressions as follows:
where and are modified Bessel functions of the first kind; and are modified Bessel functions of the second kind, of order 0 and 1, respectively. , , , , and are as given in Appendix A [39].
3.1.2. Flux Linkage and Back EMF
The flux linkage of electrical machine can be computed by integrating the radial flux density component at effective radius of the stator bore, and thus the total flux linkage can be described as:
where is the translator displacement at z-axis. is defined as:
in which is the number of turns per phase, while and of an iron-cored electrical machines are expressed as:
Induced back EMF of a single-phase stator winding can be acquired by differentiating the flux linkage over time or can also be described as:
4. Results and Discussion
4.1. Open-Circuit FEA Results
FEA results of the proposed design are explained in term of flux distribution, airgap flux density, flux linkage and back EMF.
4.1.1. Flux Distribution
Figure 10 shows the flux distribution of both design variants at different translator’s axial translation which are at 0 mm, 20 mm and 40 mm. Axial translation of 0 mm signifies the initial position of the translator, 20 mm implies the movement of the translator at half of the magnet pole-pitch and 40 mm specifies the position at which the translation of the translator equal to one magnet pole-pitch.
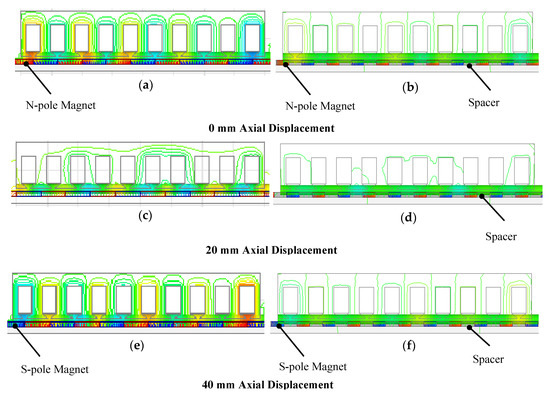
Figure 10.
Open-circuit Flux Distribution of (a) Magnetization without Spacer Design at 0 mm Axial Displacement; (b) Magnetization with Spacer Design at 0 mm Axial Displacement; (c) Magnetization without Spacer Design at 20 mm Axial Displacement; (d) Magnetization with Spacer Design at 20 mm Axial Displacement; (e) Magnetization without Spacer Design at 40 mm Axial Displacement; (f) Magnetization with Spacer Design at 40 mm Axial Displacement.
At 0 mm and 40 mm, both variants produced fluxes that flow from one tooth to the adjacent tooth. This flux distribution is achieved as the magnet pole-pairs are symmetrical with respect to the stator core and each stator tooth coincides with one magnet polarity only. Consequently, this allows maximum and symmetrical fluxes to flow from the north-polarity magnet (as indicated by red colour in Figure 10) to the south-polarity magnet (as indicated by blue colour in Figure 10). As the linkage of flux in the machine is affected by the behaviour of the flux, it is expected that at 0 mm and 40 mm of axial translation, the flux linkage value will also be at a maximum. In contrast, a difference between flux distribution at 0 mm and 40 mm can be pointed out which is the polarity of the flux flow. As can be seen in Figure 10, the magnet polarity that coincides with a particular tooth at 40 mm is the opposite of the magnet polarity at 0 mm. For example, the first tooth is facing the north-polarity magnet during 0 mm, while at 40 mm, the same tooth is facing the south-polarity magnet. This alternate polarity condition at 0 mm and 40 mm is also predicted to be observed in flux linkage results.
At translation of 20 mm, the symmetrical flux distribution as in 0 mm and 40 mm translation is absent as the magnet pole-pairs have been shifted at half of the magnet pole-pitch and causing each stator tooth to coincide with both the north-polarity magnet and south-polarity magnet. In the TPMLM-NS design variant, it can be clearly seen that some of the fluxes return through the same tooth and this reduces flux flow at stator back-iron. This flux distribution condition is expected to also cause reduction in flux linkage at 20 mm of axial translation.
Even though both design variants exhibit similar flux behaviours, one significant distinction that can be seen is the concentration of flux. Design variant TPMLM-NS has higher flux concentration at stator core as oppose to TPMLM-S. With the introduction of aluminium spacers in the design, the magnet volume in TPMLM-S is reduced, causing lesser flux to flow through the airgap and stator core compared to TPMLM-NS. Due to this condition, more total number of coil turns will be required in TPMLM-S to yield the same back EMF value as in TPMLM-NS.
4.1.2. Airgap Flux Density
The FEA result of airgap flux density over length of one magnet pole-pair which is equivalent to 80 mm is as shown in Figure 11. As can be seen from the waveforms, two alternate polarities of flux density at the airgap is acquired in both variants due to the usage of radial magnetized magnets. The positive polarity indicates the north-polarity magnet while the negative polarity signifies the south-polarity magnet. As both design variants utilize the same magnet material which is neodymium magnets, the maximum peak of both waveform is at similar value which is around 0.6–0.65 T. However, as the design TPMLM-S variant has aluminium spacers in the design in which aluminium is not a ferromagnetic material, parts of the axial length of the airgap experience zero flux density. In return, this reduces the average airgap flux density value of TPMLM-S (i.e., average flux density = 0.34 T) by 46.8% from TPMLM-NS (i.e., average flux density = 0.64 T). This percentage difference of average flux density in both design variants is slightly smaller than the percentage of magnet volume reduction in the design which is 50%. For TPMLM-S to produce similar flux linkage and back EMF value, a higher number of turns is required in the design variant due to the reduction in airgap flux density.
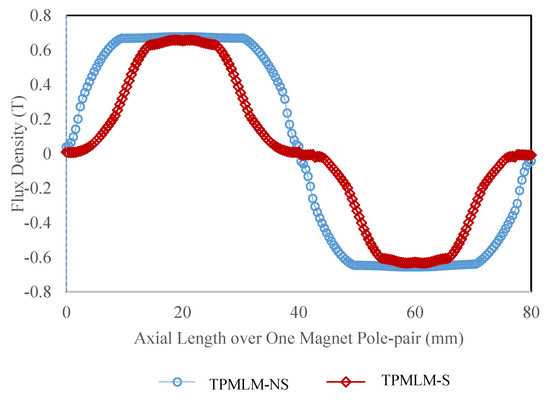
Figure 11.
Airgap Flux Density along the Length of One Magnet Pole-pair.
4.1.3. Flux Linkage and Back EMF
Figure 12 and Figure 13 exhibit FEA results of flux linkage and back EMF of both design variants. As mentioned in Section 4.1.2, to overcome the decrease in airgap flux density in TPMLM-S, the number of coil turns used in the variant is doubled of the total used in TPMLM-NS. Thus, similar average flux linkage and back EMF value can be obtained from the variants.
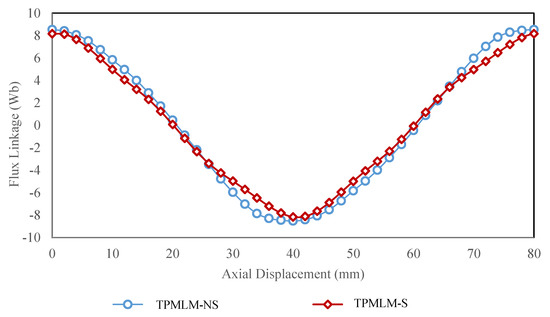
Figure 12.
Flux Linkage.
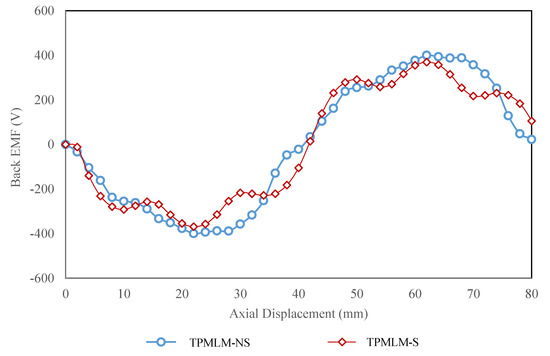
Figure 13.
Back EMF.
The flux linkage waveforms in Figure 12 show cosine waveform characteristics. The cosine waveform characteristic is the product of the magnets’ position of the design with respect to the stator teeth. At initial position, the magnets are positioned so that the whole axial length of the tooth tips coincide with high flux, leading to maximum flux flow at 0 mm. Maximum magnitudes of flux linkage are acquired at 0 mm and 40 mm with alternate polarity at these two points. These conditions matched the predictions in Section 4.1.1, in which a maximum flux concentration is observed at the particular translation points with different direction of flux flow. At 20 mm, the flux linkage is around 0 T and this value is expected based on the discussion in Section 4.1.1, in which minimum flux flow at stator core was observed at this position and in return, causes the linkage of flux with the coil is almost zero.
Based on Figure 13, although the waveforms of the back EMF are not smooth, it can be assumed that the waveforms follow the trend of negative sine wave with zero value at 0 mm and maximum magnitude at 20 mm (i.e., quarter of the total axial translation). This sine wave trend is the result of the relationship of back EMF and flux linkage which can be defined as:
Therefore, as the flux linkage exhibits cosine waveform trends, the differentiation of it is equivalent to negative sine as being demonstrated in back EMF waveform. Waveform of TPMLM-S has more distortions that TPMLM-NS due to the presence of aluminium spacers in the design, causing the change in flux at the stator core to be not smooth. These distortions were computed using total harmonic distortion (THD) waveform analysis, and the THD percentage in TPMLM-S is higher by 24% than TPMLM-NS. Nonetheless, as the total number of turn in the design variant has been manipulated, the average back EMF value of both variants satisfied the design specification which is 240 V.
Based on the FEA results on open-circuit flux distribution and airgap flux density, it can be deduced that both design variants are justified in term of magnet configuration of the design in which good agreement between the results and design configuration is achieved. Additionally, the reduction in flux density of TPMLM-S is also justified based on the reduction in magnet volume in the variant. Lastly, despite the difference in airgap flux density values of the variants, a consistent back EMF average value was achieved by varying the total number of coil turns.
4.2. Main Dimension Refinement
4.2.1. Influence of Split Ratio, /
The influence of / refinement on the airgap flux density of the design variants is as shown in Figure 14. Both design variants exhibit similar trends due to the variation of / refinement. One of the significant effects is in term magnitude of airgap flux density. Higher magnitude of airgap flux density is acquired as / rises. This is due to the volume of magnet that is also increased as the magnet radius, increases. Additionally, it can also be pointed out that the shape of waveforms is kept constant throughout the variation. This condition is due to the configuration of the magnet that is not changed despite the change in the volume and consequently maintains the other behaviours of the flux density except for the concentration. The highest value of average flux linkage for TPMLM-NS is 0.561 T, while for TPMLM-S, the highest average value is 0.349 T.
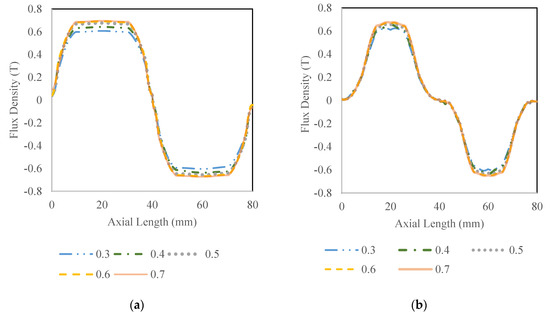
Figure 14.
Influences of Split Ratio, Rm/Re on Airgap Flux Density of (a) TPMLM-NS; (b) TPMLM-S.
Figure 15 show the effect of / refinement on copper loss and core loss of the design. The copper loss of TPMLM-S shows significant changes throughout the variation. / of 0.5 produces the lowest copper loss for TPMLM-S design variant. / values that are smaller than 0.5 experience rise in copper loss due to the high value of injected current required to produce the constant power output and the same time to compensate the reduction in airgap flux density with the decrease in magnet volume. For / bigger than 0.5, the slight increase in copper loss is because of the area of the slot that is reduced to accommodate the increment in . Reduction in area of slot in return increases the resistance of the winding. The trend of copper loss in TPMLM-NS variants is not as significant as TPMLM-S. However, slight decrement in copper loss is obtained at / of 0.4.
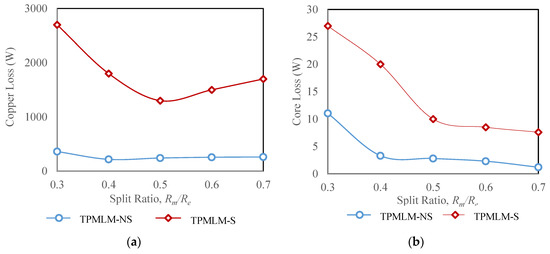
Figure 15.
Influence of Split Ratio, Rm/Re on Losses (a) Copper Loss; (b) Core Loss.
In term of core loss, both design variants have decreasing trends of core loss with the increment in /. This trend is produced as the volume of stator core is reduced while value is increased. The waveform trends in copper loss and core loss of the design variants due to refinement of / agreed will with previous work in [40].
The efficiency of the design variants with variation of / is as illustrated in Figure 16. For TPMLM-S, the evident point of optimization is at 0.5 with percentage of 43.3%. This optimization is achieved due to the significant dip in the copper loss waveform. Even though in the core loss result, a lower loss is observed with the increment of /, however the increment in copper loss of the two points of 0.6 and 0.7 is more significant than the reduction in core loss. For TPMLM-NS, the optimization point is quite ambiguous as the values in / of 0.4 and above are almost similar. Despite the increment in copper loss for points bigger than 0.4, the particular points also experience reduction in core loss and thus, produces almost similar efficiencies. Nonetheless, / of 0.4 is selected as the optimal point with slight advantage at efficiency of 81%.
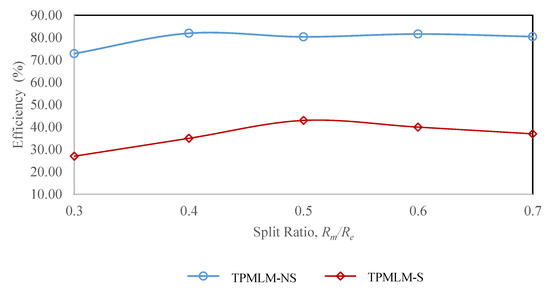
Figure 16.
Influences of Split Ratio, Rm/Re on Efficiency.
4.2.2. Influence of Pitch Ratio
The effects of variation on the airgap flux density of TPMLM-NS are as shown in Figure 17a. From the result, it can be seen that the symmetry properties of the waveform as in Figure 14 are altered as varies. The symmetrical waveform is acquired by having same magnet width for both polarity magnets (i.e., north-polarity magnet and south-polarity magnet). However, as the width of both polarity magnets is not the same, the waveform also changed. It can be pointed out that, the area covered by the positive polarity in the waveform is decreased as decreases and vice versa. As mentioned in Section 4.1.2, positive polarity in the waveform represents the North-polarity magnet. Therefore, this condition is acquired due to the value which is smaller than with the decrement of .
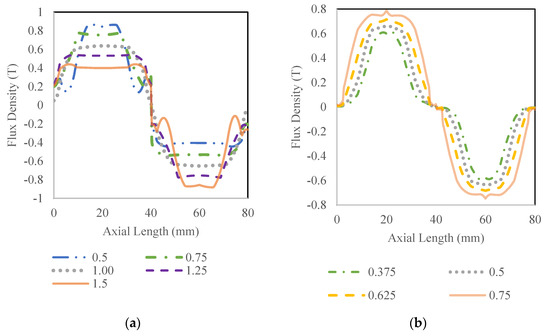
Figure 17.
Pitch Ratio, τm/τp Influence on Airgap Flux Density of (a) TPMLM-NS; (b) TPMLM-S.
For TPMLM-S, the airgap flux density trend with variation of is as shown in Figure 17b. It can be observed that the flux density increases as increases, with of 0.75 having the highest maximum and minimum point. This trend is obtained as the volume of magnet increases as increases and thus, producing more flux density at the airgap. Unlike the trend in TPMLM-NS airgap flux density waveform in Figure 17a, the shape of the waveform for TPMLM-S is consistent throughout the variation. This is due to the method of refinement conducted onto the design variant in which the value is varied against the value. Therefore, in all refinement points, the values of and are the same resulting in the symmetrical waveforms.
The influence of pitch ratio, of the copper loss of the design variants is as shown in Figure 18. As can be seen, the trends of copper loss for the two design variants are different due to the presence of aluminium spacer in TPMLM-S design. For TPMLM-S variant, refinement was done by varying the value against value, while for TPMLM-NS variant, the refinement was completed by varying the two different polarity magnets against each other.
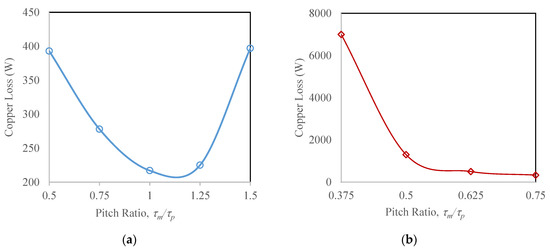
Figure 18.
Influences of Pitch Ratio, τm/τp on Copper Loss for (a) TPMLM-NS; (b) TPMLM-S.
The lowest copper loss obtained from TPMLM-NS variant is at 1 which is the initial point that makes the value be the same as value. Higher copper losses are produced in all other points is because of the higher current injected to compensate the reduction in flux density that becomes unsymmetrical with the change in while maintaining . For TPMLM-S, a lower copper loss can be observed as decreases. This is due to the increase in the magnet volume as opposed to the volume of aluminum. Point 0.75 is the limit for the design variant before the dimensions for the aluminum are too small.
Figure 19 illustrates the trend of core loss due to the variation of . A similar trend as in copper loss results can be observed in the core loss results. For the TPMLM-S variant, a significant difference in the reduction rate of copper and core loss can be highlighted. Copper loss of the TPMLM-S variant decreased sharply from of 0.375 to 0.5 and marginally dropped from 0.5 to 0.75. However, for core loss, the decrement rate is almost constant from 0.375 to 0.75. This is due to the high number of coil turns used in TPMLM-NS that causes the copper loss to increase significantly with an increase in injected current, while for core loss, the value is not dependent on the number of coil turns in the design and thus, is not impacted by the parameter.
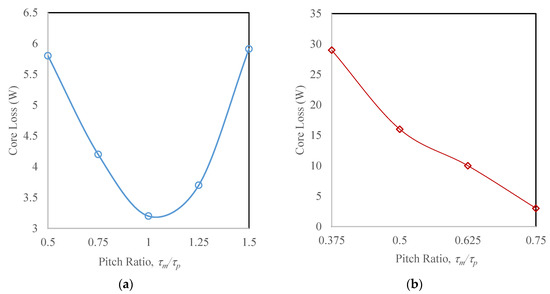
Figure 19.
Influences of Pitch Ratio, τm/τp on Core Loss for (a) TPMLM-NS; (b) TPMLM-S.
Figure 20 exhibits the efficiency of the design variants with the variation of . For TPMLM-NS, the optimization point is at 1 with efficiency of 81%. The TPMLM-S design variant has increasing efficiency as increases with no apparent optimization point. However, 0.75 is the limit for value as value higher than this lead to manufacturing constraint in fabricating the aluminium with too small dimension. Therefore, 0.75 is chosen as the best value for TPMLM-S with efficiency of 75%.
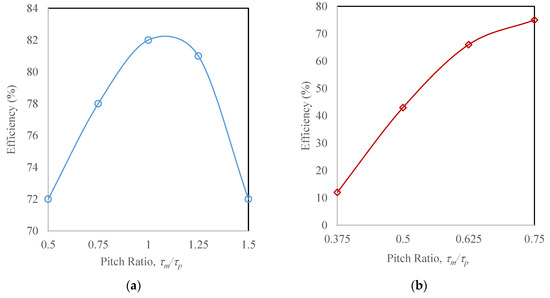
Figure 20.
Influences of Pitch Ratio, τm/τp on Efficiency for Design with Spacer, (a) TPMLM-NS; (b) TPMLM-S.
4.2.3. Influence of Tooth Width
Figure 21 shows the flux density at stator core of TPMLM-NS variants due to tooth width, refinement. Minor deviations in flux density at the teeth of the stator can be observed. Smaller variations have higher flux concentration at the teeth area near the tip due to the small flux path. Conversely, an increment in causes the total area concentrated with flux (i.e., area covered with green colour indication) to also increase. This is predictable to impact the core loss of the design and consequently affect the efficiency. The trends in TPMLM-S flux density at stator core due to variation are similar to TPMLM-NS.
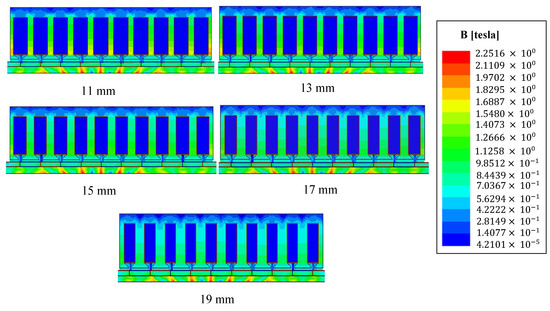
Figure 21.
Influences of Tw Variation on Flux density at Stator of TPMLM-NS.
Figure 22 and Figure 23 illustrate the trends in copper loss and core loss of the design variants with refinement respectively. From the copper loss waveform, the smallest value of copper loss for both design variants is at of 15 mm. A higher value produces a higher copper loss due to the reduction in slot area and thus, causes the resistance of coil to be increased. In contrast, for with smaller value, slight increment in copper loss can be observed as more injected current is needed to produce constant output power. Core loss results show different trends from copper loss, with marginal increment in core loss value as increases. This is because of the increment in teeth area with concentrated flux as discussed previously in Figure 21. Even though, smaller values experienced concentrated flux in area near the tooth tip, however, the effect of increase in teeth area with higher flux concentration is apparently more significant for the total volume of the stator core.
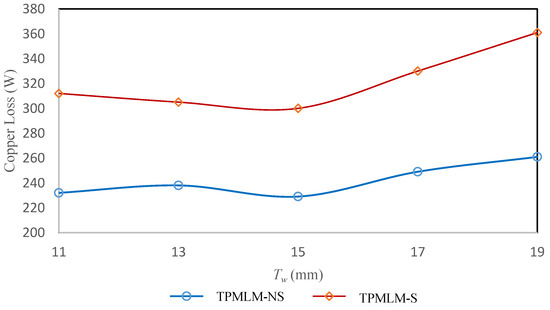
Figure 22.
Influences of Tw Variation on Copper Loss.
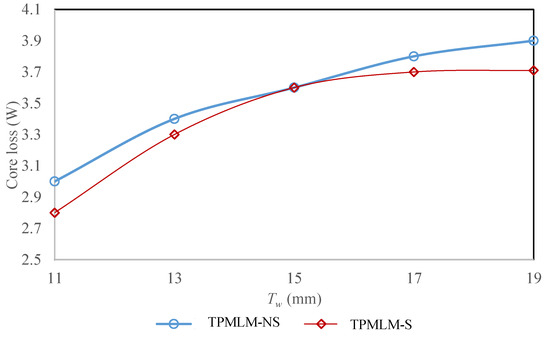
Figure 23.
Influences of Tw Variation on Core Loss.
The efficiency of the design variants due to refinement is as shown in Figure 24. The optimal efficiency for both design variants are obtained at of 15 mm with 81% and 76% for TPMLM-NS and TPMLM-S respectively. values that is lower than 15 mm experienced decrement in efficiency because of the higher copper loss. For higher , lower efficiency is produced due to rise in both copper loss and core loss.
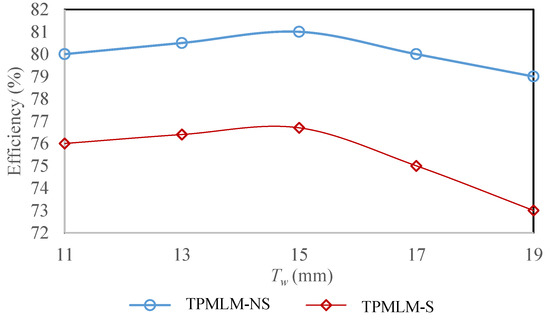
Figure 24.
Influences of Tw Variation on Efficiency.
4.3. Validation Using Analytical Methods
Comparisons on the analytical prediction and FEA of airgap flux density are as shown in Figure 25. The average percentage error over a fundamental period, which is approximately 3.1% and 9.3% for TPMLM-NS and TPMLM-S, respectively, is relatively small. For both variants, good agreement in terms of the shape waveform can be observed, especially for TPMLM-NS which displays an exact match between the analytical prediction and FEA. For TPMLM-S, the waveforms show agreement in terms of frequency but a slight deviation can be seen, especially at the tip of waveforms. The analytical prediction waveform has a slightly rounded tip while the waveform resulting from FEA imitates a square shape waveform. This difference is the effect of the slot representation in the analytical prediction that is not precise. In TPMLM-S, the effect is significant due to the presence of aluminium spacers. The developed analytical model considered the airgap axial lengths that coincide with aluminium spacers to have zero flux density, causing a slight decrement in the total flux density value, whereas, in FEA, the tooth tip at the stator core is taken into account and thus, even though the airgap lengths are covered by aluminium spacers, due to the presence of tooth tips, some of the fluxes flow through the airgap lengths as shown in Figure 26. In TPMLM-NS, the effect ofhe slotted model in analytical prediction is not that significant because of the consistent flux density throughout the length of the airgap. Discrepancy in analytical predictions due to slot representation is also mentioned by [38].
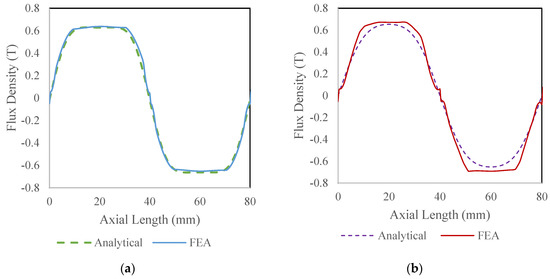
Figure 25.
Airgap Flux Density Validation of (a) TPMLM-NS; (b) TPMLM-S.
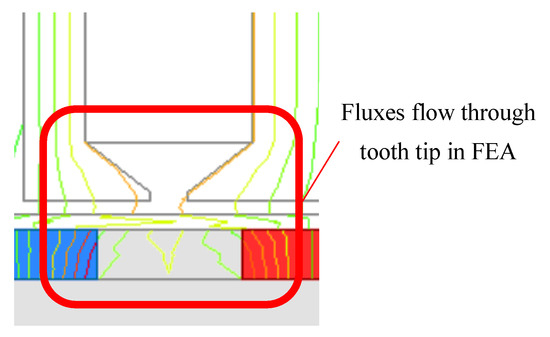
Figure 26.
Tooth Tip Effect on Airgap Flux Density in FEA.
Figure 27 and Figure 28 illustrate the comparison of analytical predictions and FEA for flux linkage and back EMF, respectively. The flux linkage waveforms resulting from the analytical predictions match the result from FEA, in terms of amplitude and frequency. The percentage error calculated from both waveforms are 0.8% and 0.4% for the respective TPMLM-NS and TPMLM-S variants. Similarly, the back EMF waveforms produced by both methods show good agreement with each other, even though there are some discrepancies in the waveforms. For example, the analytical prediction waveform for TPMLM-NS has a slightly bigger value than the FEA one around the axial displacement of 0–10 mm. This is again due to the slotted representation used in the analytical model in which returning fluxes through the same tooth as shown in Figure 29 are not considered. Nevertheless, the back EMF percentage errors between analytical predications and FEA for both variants, which are 0.8% and 0.4% for TPMLM-NS and TPMLM-S, respectively, are very small. Therefore, as the percentage errors for the three parameters are less than 10%, it can be concluded that the FEA results are validated by the analytical predictions and thus, serve as an assurance of the accuracy of the design performance.
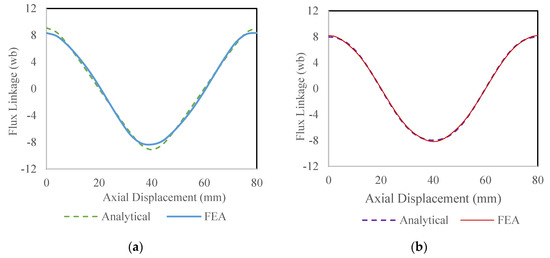
Figure 27.
Flux Linkage Validation of (a) TPMLM-NS; (b) TPMLM-S.
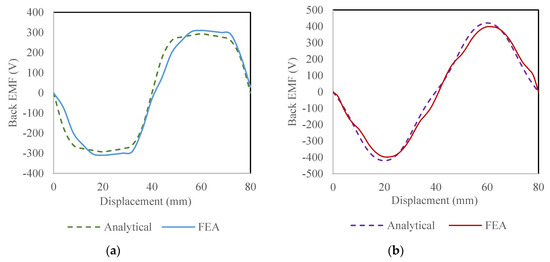
Figure 28.
Induced Back EMF Validation of (a) TPMLM-NS; (b) TPMLM-S.
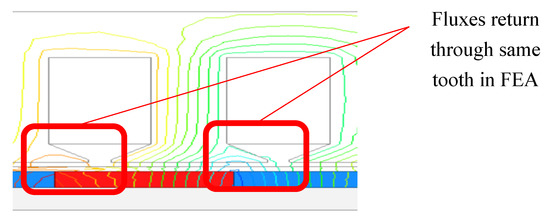
Figure 29.
Returning Fluxes Through Same Tooth at 10 mm Axial Displacement in FEA.
4.4. Power-to-Weight Ratio and Material Cost
Table 4 shows the performance of both design variants in terms of weight, material cost, back EMF and efficiency. As previously mentioned, the TPMLM-S variant is introduced to cater the big size and high cost of linear generators in direct drive systems. However, the optimal design of the variant shows that only the material cost of TMPLM-S variant is advantageous over the conventional design as in TPMLM-NS variant. The introduction of aluminum spacer as part of magnet assembly reduced the material cost as aluminum costs less than NdFeB. In terms of total weight, the TPMLM-S weight slightly heavier than TPMLM-NS which is contrary to the hypothesis put forth earlier as the variant requires more back iron at the translator than the TPMLM-NS variant.

Table 4.
Performance Comparison of the Optimized Proposed Designs.
The power-to-weight ratios (kW/kg) of TPMLM-NS and TPMLM-S are 0.006010 kW/kg and 0.006002 kW/kg, respectively. TPMLM-NS has a better power-to-weight ratio as opposed to TPMLM-S. Even though TPMLM-NS has a better power-to-weight ratio and efficiency than TPMLM-S, the total weight of the design is still high due to the heavy weight of the stator mainly caused by the weight of the slotted back iron.
5. Conclusions
This paper presents a tubular permanent magnet linear machine (TPMLM) design for linear generators for wave energy conversion systems in low wave power areas which has been designed and analyzed based on the wave characteristics of Malaysian waves. The generator is designed to be able to produce 240 V output back EMF. The proposed design, which was divided into two variants, which are TPMLM-no spacer (TPMLM-NS) and TPMLM-spacer (TPMLM-S), has been analyzed numerically using the FEA and analytical methods. The open-circuit flux distribution and flux density results from FEA provide a good representative of the design magnetic configuration. From the main dimension refinement, it can be deduced that variations of the design’s dimensions affect the flux density behavior in the design that consequently influences other parameters such as the electrical losses. Therefore, a detailed refinement of the design dimensions is crucial in order to achieve an optimal performance. The computed efficiency of the generator considering electrical losses is high, with 81% for TPLMN-NS and 76% for TPMLM-S. Even though the TPMLM design is simulated based on Malaysian local wave characteristics, the design can also be used in other locations with similar wave characteristics to Malaysia in order to obtain an optimal design working efficiency.
Further analysis should be conducted such as detailed core losses and eddy current losses so a prototype of the design can be fabricated. The fabricated prototype can be used to conduct in-laboratory experimental testing to validate the simulation and computation results. Additionally, complete assembly of the linear generator design and wave buoy to capture the motion of wave is to be deliberated, so that the whole system can be tested in in laboratory wave tanks and open seas.
Author Contributions
Conceptualization, N.A.M.Z.; methodology, N.A.M.Z., T.I.; software, N.A.M.Z., T.I.; validation, N.A.M.Z.; formal analysis, N.A.M.Z.; writing—original draft preparation, N.A.M.Z.; writing—review and editing, T.I., N.M.N.; visualization, N.A.M.Z.; supervision, T.I., N.M.N.; project administration, N.A.M.Z., T.I.; funding acquisition, T.I., N.M.N. All authors have read and agreed to the published version of the manuscript.
Funding
This research was funded by Yayasan Universiti Teknologi PETRONAS (YUTP) under YUTP-FRG 2018 (grant number: 015LC0-012).
Acknowledgments
The authors would like to acknowledge Universiti Teknologi PETRONAS for the support and facilities provided in conducting this research.
Conflicts of Interest
The authors declare no conflict of interest.
Appendix A
The coefficients as in Equation (14) are computed as follows:
Let,
Let and to be the solutions for the following linear equation:
and are expressed as:
References
- Malaysia Energy Statistics Handbook; Energy Commission: Putrajaya, Malaysia. 2017. Available online: http://meih.st.gov.my/ (accessed on 10 October 2018).
- Nasir, N.A.M.; Maulud, K.N.A. Wave power potential in Malaysian territorial waters. IOP Conf. Ser. Earth Environ. Sci. 2016, 37. Available online: http://stacks.iop.org/1755-1315/37/i=1/a=012018 (accessed on 9 January 2019). [CrossRef]
- Samrat, N.; Ahmad, N.; Choudhury, I.; Taha, Z. Prospect of wave energy in Malaysia. In Proceedings of the 2014 IEEE 8th International Power Engineering and Optimization Conference (PEOCO2014), Kedah, Malaysia, 24–25 March 2014. [Google Scholar] [CrossRef]
- Maulud, K.N.A.; Karim, O.A.; Sopian, K.; Darus, Z.M.; Ramly, E.E.M. Identification a potential wave energy location in Malaysia using GIS. In Proceedings of the 10th WSEAS International Conference on Mathematical Methods, Computational Techniques and Intelligent Systems, Corfu, Greece, 26–28 October 2008; World Scientific and Engineering Academy and Society (WSEAS): Stevens Point, WI, USA, 2008; pp. 426–430. [Google Scholar]
- Chiang, E.P.; Zainal, Z.A.; AswathaNarayana, P.A.; Seetharamu, K.N. Potential of renewable wave and offshore wind energy sources in Malaysia. In Marine Technology 2003 Seminar; Marine Technology Center, Universiti Teknologi Malaysia: Skudai, Johor, Malaysia, 2003. [Google Scholar]
- Muzathik, A.; Nik, W.S.W.; Ibrahim, M.Z.; Samo, K. Wave energy potential of Peninsular Malaysia. ARPN J. Eng. Appl. Sci. 2010, 5, 11–23. [Google Scholar]
- Yaakob, O.B.; Ahmed, Y.M.; Mazlan, M.N.; Jaafar, K.E.; Muda, R.M.R. Model testing of an ocean wave energy system for Malaysian sea. World Appl. Sci. J. 2013, 22, 67–671. [Google Scholar]
- Ahmad, N.H.T.H.; Ibrahim, M.Z.; Rahman, S.J.A.; Albani, A.; Mohad, S. The development of wave energy converter system using hydraulic power take off at Terengganu Shoreline. In Proceedings of the 2018 International Conference and Utility Exhibition on Green Energy for Sustainable Development (ICUE), Phuket, Thailand, 24–26 October 2018; pp. 1–7. [Google Scholar] [CrossRef]
- Mueller, M.A.; Polinder, H.; Baker, N. Current and novel electrical generator technology for wave energy converters. In Proceedings of the 2007 IEEE International Electric Machines & Drives Conference, Antalya, Turkey, 3–5 May 2007; Volume 2, pp. 1401–1406. [Google Scholar] [CrossRef]
- Hamim, M.A.F.M.; Ibrahim, T.; Nor, N.M. Modelling and analysis a single-phase halbach magnetized tubular linear permanent magnet generator for wave energy conversion. In Proceedings of the IEEE International Conference on Power Energy, Kuching, Malaysia, 1–3 December 2014. [Google Scholar]
- Zhang, J.; Yu, H.; Shi, Z. Design and experiment analysis of a direct-drive wave energy converter with a linear generator. Energies 2018, 11, 735. [Google Scholar] [CrossRef]
- Hodgins, N.; Keysan, O.; McDonald, A.S.; Mueller, M.A. Design and testing of a linear generator for wave-energy applications. IEEE Trans. Ind. Electron. 2012, 59, 2094–2103. [Google Scholar] [CrossRef]
- Franzitta, V.; Curto, D.; Milone, D.; Rao, D. Assessment of renewable sources for the energy consumption in Malta in the Mediterranean Sea. Energies 2016, 9, 1034. [Google Scholar] [CrossRef]
- Drew, B.; Plummer, A.R.; Sahinkaya, M.N. A review of wave energy converter technology. Proc. Inst. Mech. Eng. Part A 2009, 223, 887–902. [Google Scholar] [CrossRef]
- Busa, M.; Figuracion, E.; Santos, D.A.; Tan, A.R.; Ostia, C., Jr.; Teresa, J. Development of portable axially magnetized generator utilizing shoreline wave energy for electronic charging systems. AIP Conf. Proc. 2018, 2045, 020063-1–020063-5. [Google Scholar] [CrossRef]
- Qiu, S.; Wang, H. Simulation of tubular transverse flux permanent magnet linear generator. In Proceedings of the 21st International Conference on Electrical Machines and Systems (ICEMS), Jeju, Korea, 7–10 October 2018; pp. 1766–1770. [Google Scholar]
- Si, J.; Feng, H.; Su, P.; Zhang, L. Design and analysis of tubular permanent magnet linear wave generator. Sci. World J. 2014, 2014, 258109. [Google Scholar] [CrossRef]
- Elgebaly, A.; El-Nemr, M. Optimal design of slotless PM halbach array linear generator for wave energy converters at maximum power transfer condition. In Proceedings of the 2018 Twentieth International Middle East Power Systems Conference (MEPCON), Cairo, Egypt, 18–20 December 2018; pp. 271–276. [Google Scholar] [CrossRef]
- Kim, J.M.; Koo, M.M.; Jeong, J.H.; Hong, K.; Cho, I.H.; Choi, J.Y. Design and analysis of tubular permanent magnet linear generator for small-scale wave energy converter. AIP Adv. 2017, 7, 056630-1–056630-6. [Google Scholar] [CrossRef]
- Mendes, R.P.G.; Calado, M.R.A.; Mariano, S.J.P.S. Electromagnetic design method for a TLSRG with application in ocean wave energy conversion. Electr. Power Energy Syst. 2020, 121, 1–11. [Google Scholar] [CrossRef]
- Xia, T.; Yu, H.; Chen, Z.; Huang, L.; Liu, X.; Hu, M. Design and analysis of a field-modulated tubular linear permanent magnet generator for direct-drive wave energy conversion. IEEE Trans. Magn. 2017, 53, 1–4. [Google Scholar] [CrossRef]
- Ibrahim, T.; Hussain, A.; Nallagowden, P.; Abrro, F.R. Design development and modelling of linear permanent magnet generator topologies for wave energy conversion. Int. J. Appl. Eng. Res. 2017, 12, 3329–3336. [Google Scholar]
- Kim, J.S.; Kim, J.Y.; Park, J.B. Design and optimization of a 8kW linear generator for a direct-drive point absorber. In Proceedings of the 2013 OCEANS, San Diego, CA, USA, 23–27 September 2013; pp. 1–6. [Google Scholar] [CrossRef]
- Kumar, M.S.; Krishna, M.; Ranjan, A.; Dubey, M. Permanent magnet linear generator design. IOSR J. Electr. Electron. Eng. 2015, 10, 86–90. [Google Scholar]
- Prudell, J.; Stoddard, M.; Amon, E.; Brekken, T.K.A.; Jouanne, A.V. A permanent-magnet tubular linear generator for ocean wave energy conversion. IEEE Trans. Ind. Appl. 2010, 46, 2392–2400. [Google Scholar] [CrossRef]
- Libert, F.; Soulard, J. Investigation on pole-slot combinations for permanent-magnet machines with concentrated windings. In Procceding of the International Conference on Electrical Machines; Institute of Mechatronics and Information Systems, Technical University of Lodz: Cracow, Poland, 2004; pp. 530–535. [Google Scholar]
- Haring, T.; Forman, K.; Huhtanen, T.; Zawadzki, M. Direct drive-opening a new era in many applications. In Proceedings of the Conference Record of the 2003 Annual Pulp and Paper Industry Technical Conference, Charleston, SC, USA, 16–20 June 2003; pp. 171–179. [Google Scholar] [CrossRef]
- Lu, Q.; Huang, L.; Ye, Y.; Huang, X.; Fang, Y. Design of a novel permanent magnet linear synchronous motor with segmented armature core for ropeless lifter. COMPEL Int. J. Comput. Math. Electr. Electron. Eng. 2016, 35, 556–571. [Google Scholar] [CrossRef]
- Vermaak, R.; Kamper, M.J. Design aspects of a novel topology air-cored permanent magnet linear generator for direct drive wave energy converters. IEEE Trans. Ind. Electron. 2012, 59, 2104–2115. [Google Scholar] [CrossRef]
- Gieras, J.F.; Piech, Z.J.; Tomczuk, B. Linear Synchronous Motors: Transportation and Automation Systems, 2nd ed.; CRC Press: Boca Raton, FL, USA, 2017. [Google Scholar]
- Rucker, J.E. Design and Analysis of a Permanent Magnet Generator for Naval Applications. Master’ Thesis, Science in Electrical Engineering and Computer Science, Department of Ocean Engineering, Massachusetts Institute of Technology, Cambridge, MA, USA, 2001. [Google Scholar]
- López, I.; Andreu, J.; Ceballos, S.; de Alegría, I.M.; Kortabarria, I. Review of wave energy technologies and the necessary power-equipment. Renew. Sustain. Energy Rev. 2013, 27, 413–434. [Google Scholar] [CrossRef]
- Faiz, J.; Nematsaberi, A. Linear permanent magnet generator concepts for direct-drive wave energy converters: A comprehensive review. In Proceedings of the 2017 12th IEEE Conference on Industrial Electronics and Applications (ICIEA), Siem Reap, Cambodia, 18–20 June 2017; pp. 618–623. [Google Scholar] [CrossRef]
- Huang, L.; Chen, M.; Wang, L.; Yue, F.; Guo, R.; Fu, X. Analysis of a hybrid field-modulated linear generator for wave energy conversion. IEEE Trans. Appl. Supercond. 2018, 28, 1–5. [Google Scholar] [CrossRef]
- Polinder, H.; Mecrow, B.C.; Jack, A.G.; Dickinson, P.G.; Mueller, M.A. Conventional and TFPM linear generators for direct-drive wave energy conversion. IEEE Trans. Energy Convers. 2005, 20, 260–267. [Google Scholar] [CrossRef]
- Parel, T.; Rotaru, M.D.; Sykulski, J.K.; Hearn, G.E. Optimisation of a tubular linear machine with permanent magnets for wave energy extraction. Int. J. Comput. Math. Electr. Electron. Eng. 2011, 30, 1056–1068, Emerald Group Publishing Limited. [Google Scholar] [CrossRef]
- Wang, J.; Jewell, G.W.; Howe, D. Design optimisation and comparison of tubular permanent magnet machine topologies. IEE Proc. Electr. Power Appl. 2001, 148, 456–464. [Google Scholar] [CrossRef]
- Jiabin, W.; Jewell, G.W.; Howe, D. A general framework for the analysis and design of tubular linear permanent magnet machines. IEEE Trans. Magn. 1999, 35, 1986–2000. [Google Scholar] [CrossRef]
- Abdalla, I.I.; Ibrahim, T.; Nor, N.M. Analysis of tubular linear motors for different shapes of magnets. IEEE Access 2018, 6, 10297–10310. [Google Scholar] [CrossRef]
- Ibrahim, T. Short-Stroke, Single-Phase Tubular Permanent Magnet Motors for Refrigeration Applications. Ph.D. Thesis, Department of Electronic and Electrical Engineering, University of Sheffield, Sheffield, UK, 2009. [Google Scholar]
Publisher’s Note: MDPI stays neutral with regard to jurisdictional claims in published maps and institutional affiliations. |
© 2020 by the authors. Licensee MDPI, Basel, Switzerland. This article is an open access article distributed under the terms and conditions of the Creative Commons Attribution (CC BY) license (http://creativecommons.org/licenses/by/4.0/).