Comprehensive Review of Methods and Instruments for Photovoltaic–Thermoelectric Generator Hybrid System Characterization


Abstract
1. Introduction
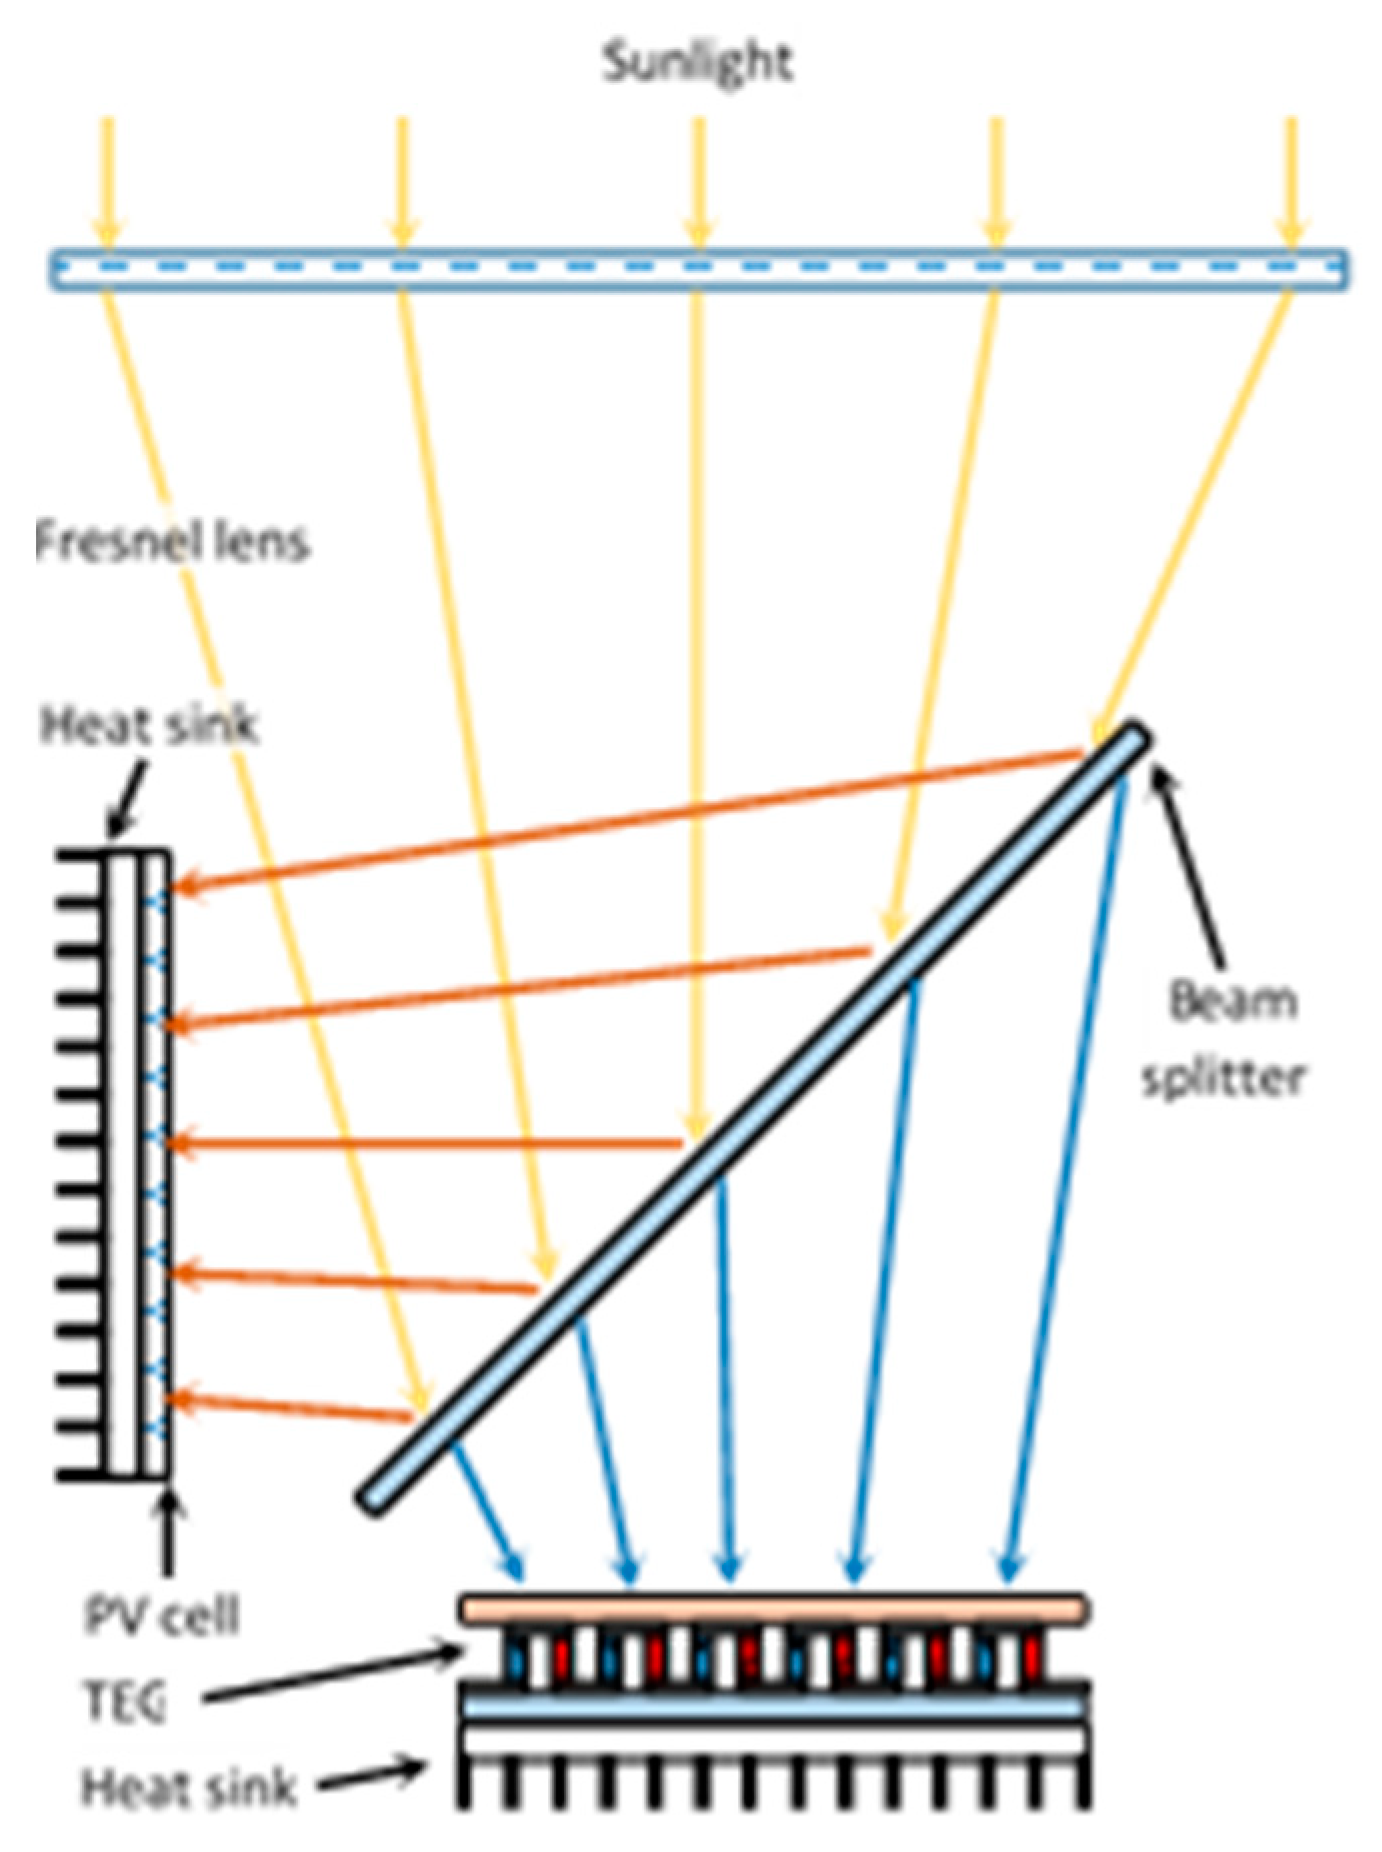
2. HS Structures
3. HS Component Models
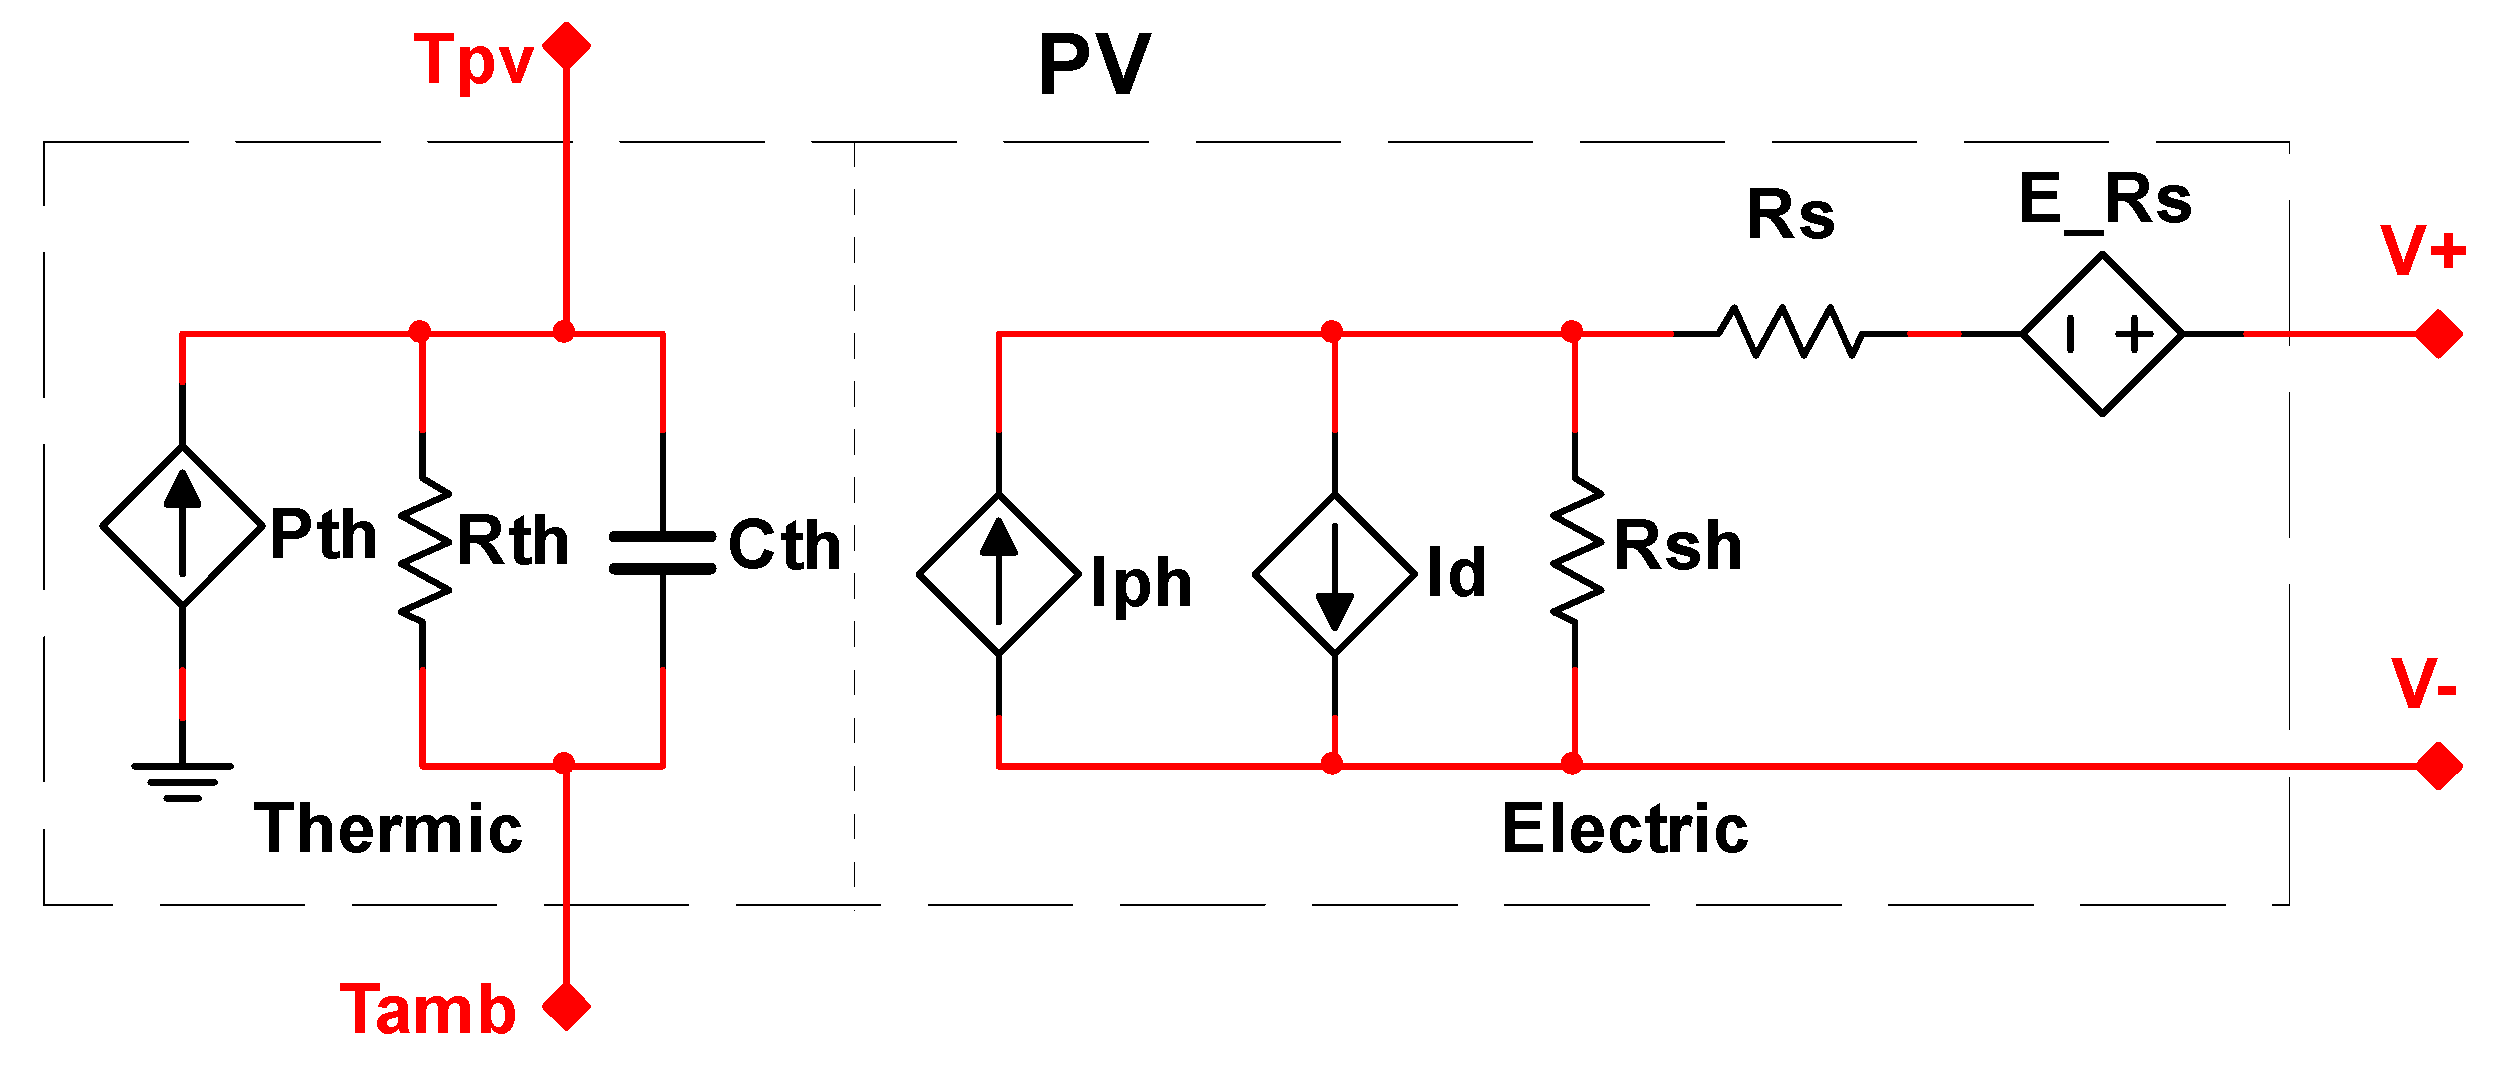
3.1. PV Models
- -
- One-diode model:
- -
- Two-diode model:
- -
- Three-diode model:where I and V are the current and voltage generated by the PV, Iph is the photogenerated current, I0 is the reverse saturation current, q is the elementary electrical charge, Rs and Rsh are the series and shunt resistances, n is the ideality factor of the diode, k is the Boltzmann constant and T is the temperature. The 1, 2 and 3 indexes relate the diffusion, the generation–recombination and the thermionic mechanisms, respectively.
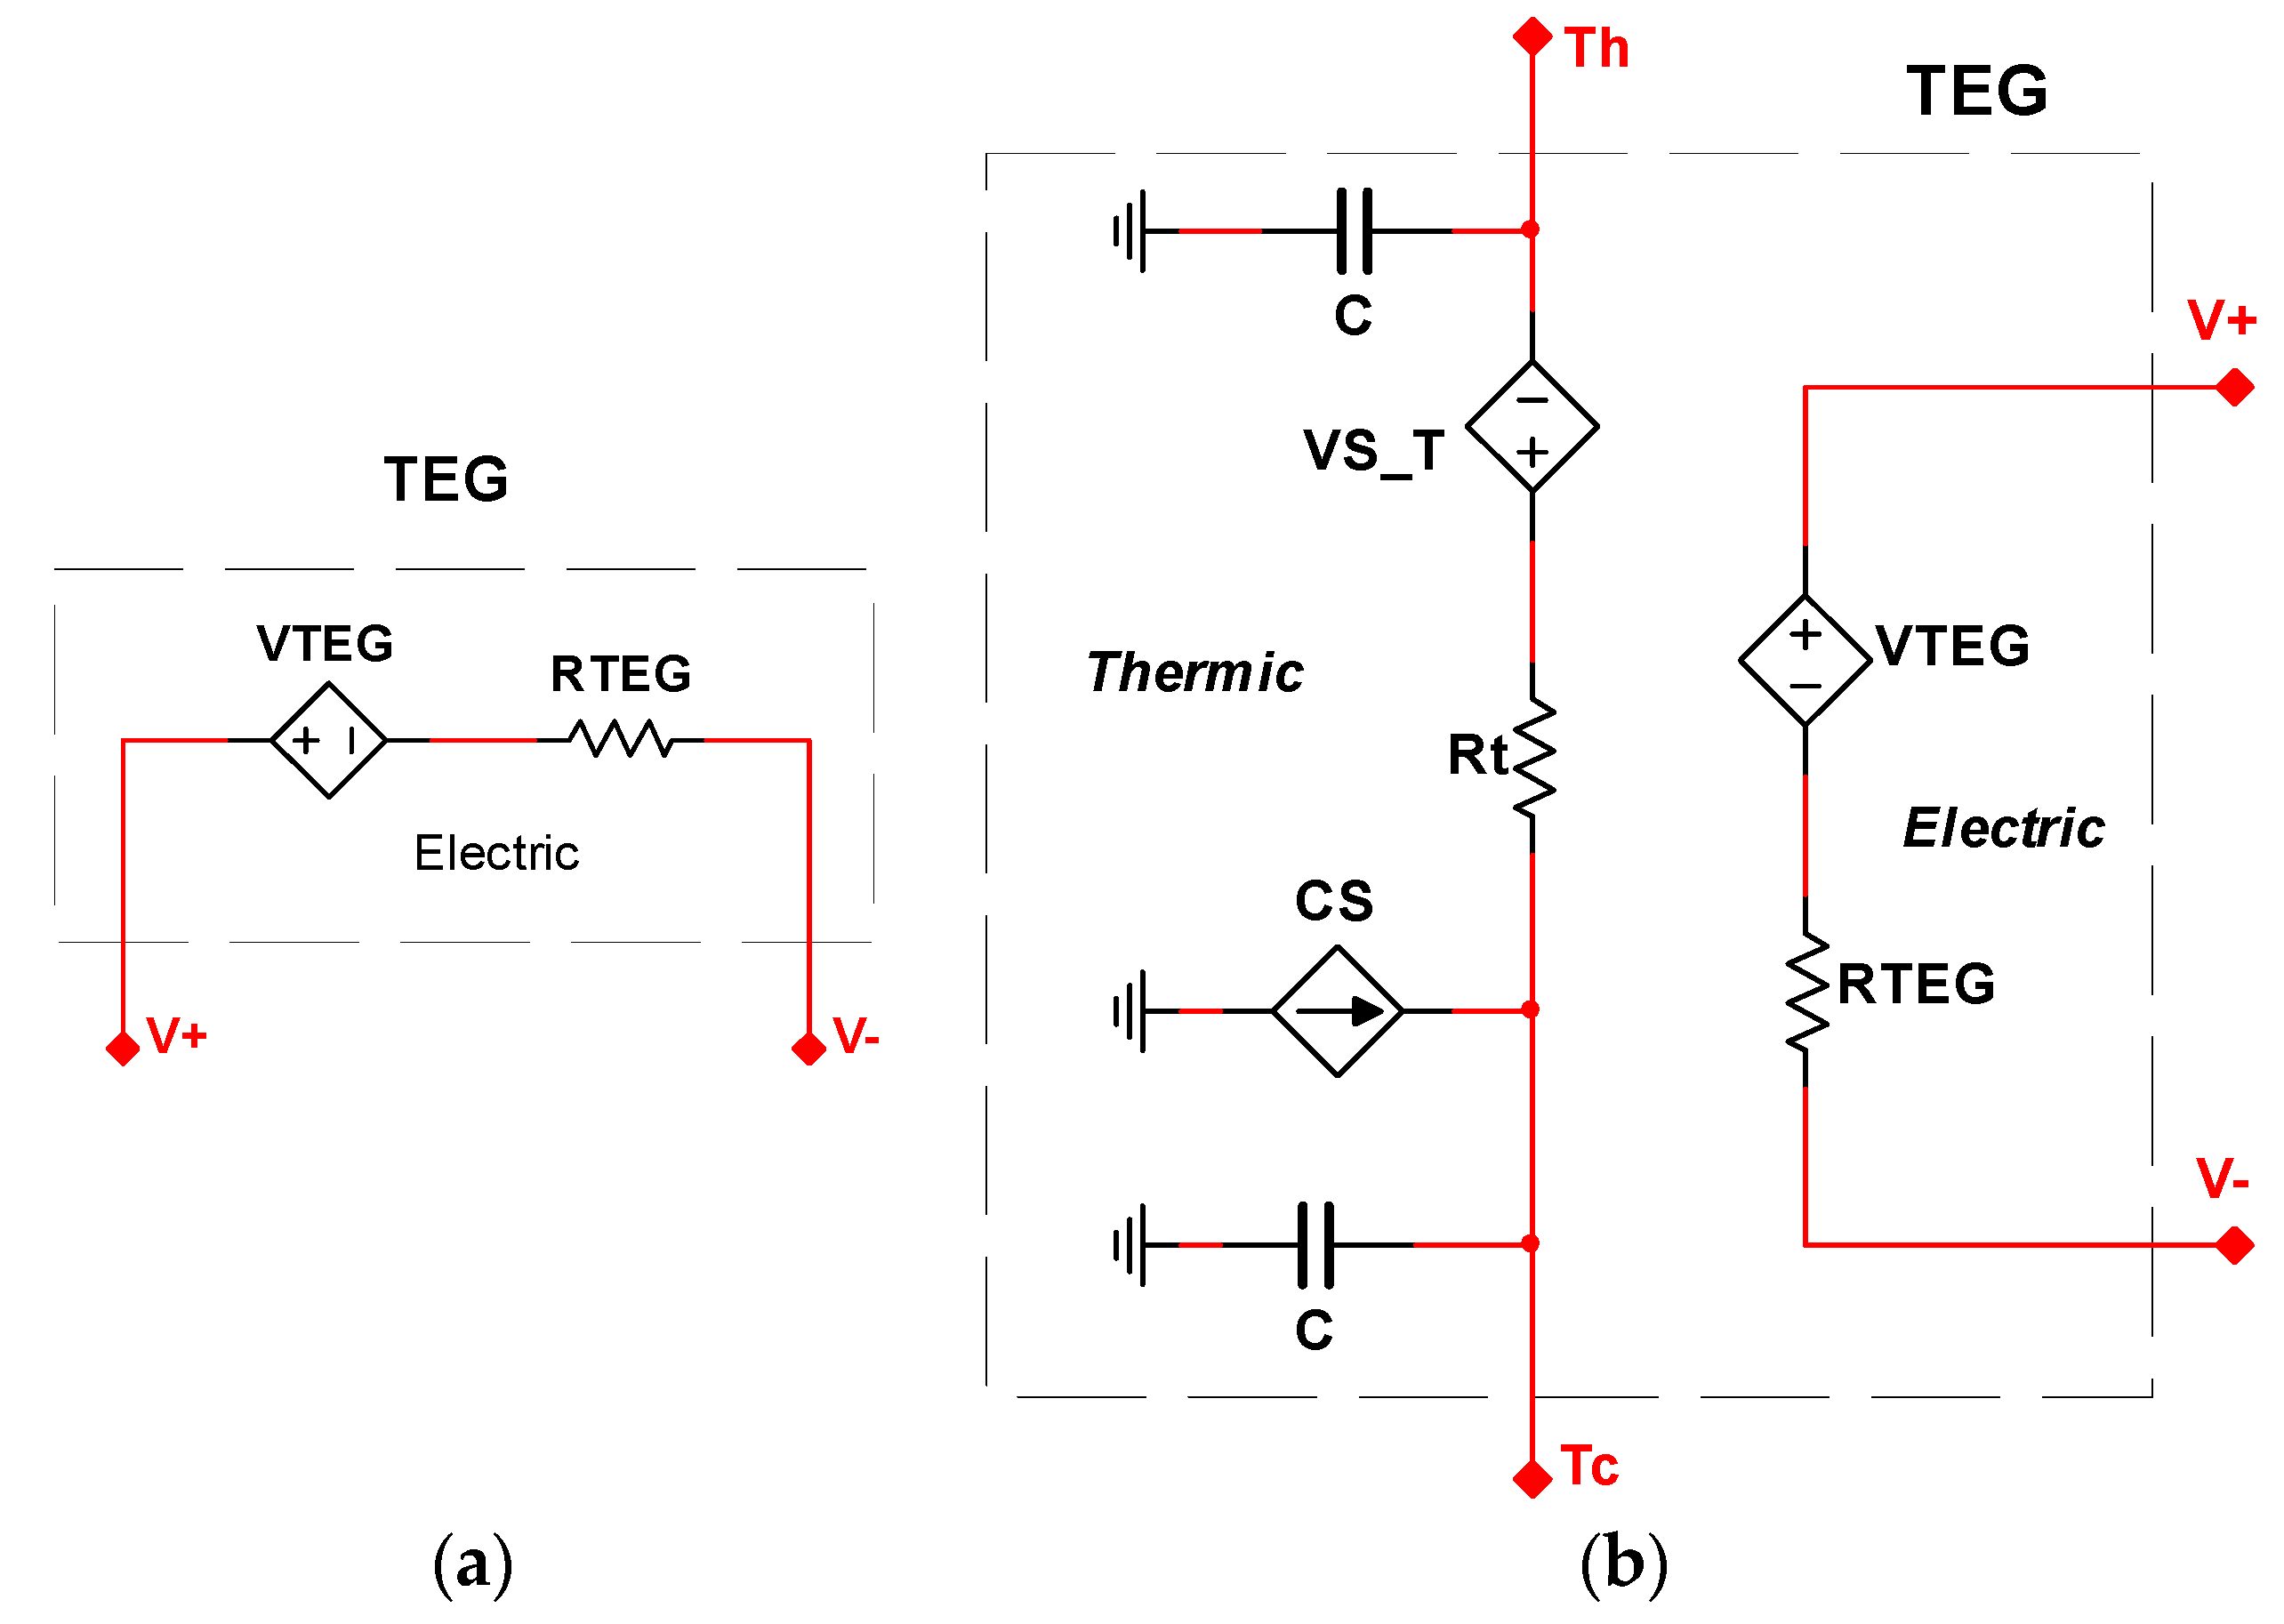
3.2. TEG Models
4. HS Characterization
4.1. Numerical Studies
4.2. Experimental Studies
- Inside/outside characterization;
- Long/short monitoring time;
- Performance;
- Cost.
4.3. Independent Component Characterization Studies
4.3.1. TEG Characterization
4.3.2. PV Characterization
Resistor-Based Method (RBM)
Transistor-Based Electronic Load Method (TBM)
Capacitor-Based Method (CBM)
The IoT Applied in PV Systems
5. Discussion and Conclusions
- Future Work on PV-TEG HS Development
- Developing new procedures and methodologies for HS system characterization to improve the quality of the measurements and decrease the measurement uncertainties.
- Improving the models of the HS components considering 3D approaches (even if there are already papers published that cover this field, they are only a few) for the better prediction of HS behavior.
- Developing dedicated instruments for PV-TEG HS characterization (at the component level or as a whole).
- Developing new and more complex HS structures by combining different energy harvesting components such as PVs, TEGs, PCM materials, Sterling engines and solar thermal collectors in order to increase the efficiency of the hybrid systems.
- Enlarging the scale of the studied PV-TEG HS at the farm level for a better understanding of the performance of the integrated system, the life cycle and the feasibility of the HS.
- Introducing distributed characterization systems based on modern IT concepts such as the IoT and cloud computing for large-scale systems.
Author Contributions
Funding
Conflicts of Interest
References
- REN21. Renewables 2019 Global Status Report Collaborative. Edited by Lisa Mastny and James Glave. Ren21. Vol. 105. REN21 Secretariat, Paris, France. 2019. Available online: https://www.ren21.net/wp-content/uploads/2019/05/gsr_2019_full_report_en.pdf (accessed on 15 November 2020).
- Green, M.A.; Dunlop, E.D.; Hohl-Ebinger, J.; Yoshita, M.; Kopidakis, N.; Ho-Baillie, A.W.Y. Solar cell efficiency tables (Version 55). Prog. Photovolt. Res. Appl. 2020, 28, 3–15. [Google Scholar] [CrossRef]
- Cotfas, D.T.; Cotfas, P.A. Multiconcept methods to enhance photovoltaic system efficiency. Int. J. Photoenergy 2019, 2019. [Google Scholar] [CrossRef]
- Grubišić Čabo, F.; Nižetić, S.; Giama, E.; Papadopoulos, A. Techno-economic and environmental evaluation of passive cooled photovoltaic systems in Mediterranean climate conditions. Appl. Therm. Eng. 2020, 169, 114947. [Google Scholar] [CrossRef]
- Nižetić, S.; Marinić-Kragić, I.; Grubišić-Čabo, F.; Papadopoulos, A.M.; Xie, G. Analysis of novel passive cooling strategies for free-standing silicon photovoltaic panels. J. Therm. Anal. Calorim. 2020, 141, 163–175. [Google Scholar] [CrossRef]
- Joshi, S.S.; Dhoble, A.S. Photovoltaic-Thermal systems (PVT): Technology review and future trends. Renew. Sustain. Energy Rev. 2018, 92, 848–882. [Google Scholar] [CrossRef]
- Benghanem, M.; Al-Mashraqi, A.A.; Daffallah, K.O. Performance of solar cells using thermoelectric module in hot sites. Renew. Energy 2016, 89, 51–59. [Google Scholar] [CrossRef]
- Champier, D. Thermoelectric generators: A review of applications. Energy Convers. Manag. 2017, 140, 167–181. [Google Scholar] [CrossRef]
- Pourkiaei, S.M.; Ahmadi, M.H.; Sadeghzadeh, M.; Moosavi, S.; Pourfayaz, F.; Chen, L.; Pour Yazdi, M.A.; Kumar, R. Thermoelectric cooler and thermoelectric generator devices: A review of present and potential applications, modeling and materials. Energy 2019, 186, 115849. [Google Scholar] [CrossRef]
- Shittu, S.; Li, G.; Zhao, X.; Ma, X. Review of thermoelectric geometry and structure optimization for performance enhancement. Appl. Energy 2020, 268, 115075. [Google Scholar] [CrossRef]
- Ma, Z.; Wei, J.; Song, P.; Zhang, M.; Yang, L.; Ma, J.; Liu, W.; Yang, F.; Wang, X. Review of experimental approaches for improving zT of thermoelectric materials. Mater. Sci. Semicond. Process. 2021, 121, 105303. [Google Scholar] [CrossRef]
- Karthick, K.; Suresh, S.; Hussain, M.M.M.D.; Ali, H.M.; Kumar, C.S.S. Evaluation of solar thermal system configurations for thermoelectric generator applications: A critical review. Sol. Energy 2019, 188, 111–142. [Google Scholar] [CrossRef]
- Sahin, A.Z.; Ismaila, K.G.; Yilbas, B.S.; Al-Sharafi, A. A review on the performance of photovoltaic/thermoelectric hybrid generators. Int. J. Energy Res. 2020, 44, 3365–3394. [Google Scholar] [CrossRef]
- Shittu, S.; Li, G.; Akhlaghi, Y.G.; Ma, X.; Zhao, X.; Ayodele, E. Advancements in thermoelectric generators for enhanced hybrid photovoltaic system performance. Renew. Sustain. Energy Rev. 2019, 109, 24–54. [Google Scholar] [CrossRef]
- Babu, C.; Ponnambalam, P. The role of thermoelectric generators in the hybrid PV/T systems: A review. Energy Convers. Manag. 2017, 151, 368–385. [Google Scholar] [CrossRef]
- Allouhi, A. Advances on solar thermal cogeneration processes based on thermoelectric devices: A review. Sol. Energy Mater. Sol. Cells 2019, 200, 109954. [Google Scholar] [CrossRef]
- Sripadmanabhan, S.; Aravind, C.; Chong, K.; Saidur, R.; Faizal, M.; Abubakar, S.; Paiman, S. A review on various configurations of hybrid concentrator photovoltaic and thermoelectric generator system. Sol. Energy 2020, 201, 122–148. [Google Scholar] [CrossRef]
- Kossyvakis, D.N.; Voutsinas, G.D.; Hristoforou, E.V. Experimental analysis and performance evaluation of a tandem photovoltaic-thermoelectric hybrid system. Energy Convers. Manag. 2016, 117, 490–500. [Google Scholar] [CrossRef]
- Gu, W.; Ma, T.; Song, A.; Li, M.; Shen, L. Mathematical modelling and performance evaluation of a hybrid photovoltaic-thermoelectric system. Energy Convers. Manag. 2019, 198, 111800. [Google Scholar] [CrossRef]
- Rajaee, F.; Rad, M.A.V.; Kasaeian, A.; Mahian, O.; Yan, W.M. Experimental analysis of a photovoltaic/thermoelectric generator using cobalt oxide nanofluid and phase change material heat sink. Energy Convers. Manag. 2020, 212, 112780. [Google Scholar] [CrossRef]
- Makki, A.; Omer, S.; Su, Y.; Sabir, H. Numerical investigation of heat pipe-based photovoltaic-thermoelectric generator (HP-PV/TEG) hybrid system. Energy Convers. Manag. 2016, 112, 274–287. [Google Scholar] [CrossRef]
- Shittu, S.; Li, G.; Zhao, X.; Zhou, J.; Ma, X.; Akhlaghi, Y.G. Experimental study and exergy analysis of photovoltaic-thermoelectric with flat plate micro-channel heat pipe. Energy Convers. Manag. 2020, 207, 112515. [Google Scholar] [CrossRef]
- Li, G.; Zhao, X.; Ji, J. Conceptual development of a novel photovoltaic-thermoelectric system and preliminary economic analysis. Energy Convers. Manag. 2016, 126, 935–943. [Google Scholar] [CrossRef]
- Cotfas, P.A.; Cotfas, D.T.; Machidon, O.M. Modelling and PSPICE Simulation of a Photovoltaic/Thermoelectric System. In Proceedings of the IEEE 22nd International Symposium for Design and Technology in Electronic Packaging, SIITME, Oradea, Romania, 20–23 October 2016. [Google Scholar]
- Bonin, R.; Boero, D.; Chiaberge, M.; Tonoli, A. Design and characterization of small thermoelectric generators for environmental monitoring devices. Energy Convers. Manag. 2013, 73, 340–349. [Google Scholar] [CrossRef]
- Babu, C.; Ponnambalam, P. The theoretical performance evaluation of hybrid PV-TEG system. Energy Convers. Manag. 2018, 173, 450–460. [Google Scholar] [CrossRef]
- Rowe, D.M. Thermoelectrics Handbook: Macro to Nano (Google eBook); CRC Press: Boca Raton, FL, USA, 2010; ISBN 1420038907. [Google Scholar]
- Martins, J.; Goncalves, L.M.; Antunes, J.; Brito, F.P. Thermoelectric exhaust energy recovery with temperature control through heat pipes. SAE Tech. Pap. 2011. [Google Scholar] [CrossRef]
- Ando, O.H.; Izidoro, C.L.; Gomes, J.M.; Correia, J.H.; Carmo, J.P.; Schaeffer, L. Acquisition and monitoring system for TEG characterization. Int. J. Distrib. Sens. Networks 2015, 2015, 1–7. [Google Scholar] [CrossRef]
- Lineykin, S.; Ben-Yaakov, S. PSPICE-Compatible Equivalent Circuit of Thermoelectric Coolers. In Proceedings of the IEEE 36th Conference on Power Electronics Specialists, Recife, Brazil, 16 June 2005; Volume 2005, pp. 608–612. [Google Scholar] [CrossRef]
- Mahmoudinezhad, S.; Rezania, A.; Cotfas, P.A.; Cotfas, D.T.; Rosendahl, L.A. Transient behavior of concentrated solar oxide thermoelectric generator. Energy 2019, 168, 823–832. [Google Scholar] [CrossRef]
- Turcotte, D.; Rossb, M.; Sheriffa, F. Photovoltaic Hybrid System Sizing And Simulation Tools: Status And Needs. In Proceedings of the PV Horizon: Workshop on Photovoltaic Hybrid Systems, Montreal, QC, Canada, 10 September 2001; Volume 13, pp. 1–10. [Google Scholar]
- Sinha, S.; Chandel, S.S. Review of software tools for hybrid renewable energy systems. Renew. Sustain. Energy Rev. 2014, 32, 192–205. [Google Scholar] [CrossRef]
- Van Sark, W.G.J.H.M. Feasibility of photovoltaic—Thermoelectric hybrid modules. Appl. Energy 2011, 88, 2785–2790. [Google Scholar] [CrossRef]
- Koushik, S.; Das, S.; Sharma, V.; Walde, P.; Maji, N. PV and TEG Hybrid Power Generation for Enhancement of Efficiency. In Proceedings of the India International Conference on Power Electronics IICPE, Jaipur, India, 13–15 December 2018. [Google Scholar] [CrossRef]
- Shatar, N.M.; Abdul Rahman, M.A.A.; Shaikh Salim, S.A.Z.; Ariff, M.H.M.; Muhtazaruddin, M.N.; Badlisah, A.K.A. Design of Photovoltaic-Thermoelectric Generator (PV-TEG) Hybrid System for Precision Agriculture. In Proceedings of the IEEE 7th International Conference on Power and Energy, PECon, Kuala Lumpur, Malaysia, 3–4 December 2018; pp. 50–55. [Google Scholar] [CrossRef]
- Keser, O.F.; Idare, B.; Bulat, B.; Okan, A. The Usability of PV-TEG Hybrid Systems on Space Platforms. In Proceedings of the 9th International Conference on Recent Advances in Space Technologies, RAST, Istanbul, Turkey, 11–14 June 2019; pp. 109–115. [Google Scholar] [CrossRef]
- Teffah, K.; Zhang, Y. Modeling and experimental research of hybrid PV-thermoelectric system for high concentrated solar energy conversion. Sol. Energy 2017, 157, 10–19. [Google Scholar] [CrossRef]
- Kolahan, A.; Maadi, S.R.; Kazemian, A.; Schenone, C.; Ma, T. Semi-3D transient simulation of a nanofluid-base photovoltaic thermal system integrated with a thermoelectric generator. Energy Convers. Manag. 2020, 220, 113073. [Google Scholar] [CrossRef]
- Skjølstrup, E.J.H.; Søndergaard, T. Design and optimization of spectral beamsplitter for hybrid thermoelectric-photovoltaic concentrated solar energy devices. Sol. Energy 2016, 139, 149–156. [Google Scholar] [CrossRef]
- Yang, Z.; Li, W.; Chen, X.; Su, S.; Lin, G.; Chen, J. Maximum efficiency and parametric optimum selection of a concentrated solar spectrum splitting photovoltaic cell-thermoelectric generator system. Energy Convers. Manag. 2018, 174, 65–71. [Google Scholar] [CrossRef]
- Yin, E.; Li, Q.; Xuan, Y. A novel optimal design method for concentration spectrum splitting photovoltaic e thermoelectric hybrid system. Energy 2018, 163, 519–532. [Google Scholar] [CrossRef]
- Mohammadnia, A.; Ziapour, B.M. Investigation effect of a spectral beam splitter on performance of a hybrid CPV/Stirling/TEG solar power system. Appl. Therm. Eng. 2020, 180. [Google Scholar] [CrossRef]
- Mohammadnia, A.; Rezania, A.; Ziapour, B.M.; Sedaghati, F.; Rosendahl, L. Hybrid energy harvesting system to maximize power generation from solar energy. Energy Convers. Manag. 2020, 205. [Google Scholar] [CrossRef]
- Salari, A.; Parcheforosh, A.; Hakkaki-Fard, A.; Amadeh, A. A numerical study on a photovoltaic thermal system integrated with a thermoelectric generator module. Renew. Energy 2020, 153, 1261–1271. [Google Scholar] [CrossRef]
- Shittu, S.; Li, G.; Zhao, X.; Akhlaghi, Y.G.; Ma, X.; Yu, M. Comparative study of a concentrated photovoltaic-thermoelectric system with and without flat plate heat pipe. Energy Convers. Manag. 2019, 193, 1–14. [Google Scholar] [CrossRef]
- Mahmoudinezhad, S.; Rezania, A.; Cotfas, D.T.; Cotfas, P.A.; Rosendahl, L.A. Experimental and numerical investigation of hybrid concentrated photovoltaic—Thermoelectric module under low solar concentration. Energy 2018, 159, 1123–1131. [Google Scholar] [CrossRef]
- Mahmoudinezhad, S.; Ahmadi Atouei, S.; Cotfas, P.A.; Cotfas, D.T.; Rosendahl, L.A.; Rezania, A. Experimental and numerical study on the transient behavior of multi-junction solar cell-thermoelectric generator hybrid system. Energy Convers. Manag. 2019, 184, 448–455. [Google Scholar] [CrossRef]
- Indrasari, W.; Habiburosid; Fahdiran, R. Characterization of hybrid solar panel prototype using PV-TEG module. AIP Conf. Proc. 2019, 2169. [Google Scholar] [CrossRef]
- Ruzaimi, A.; Shafie, S.; Hassan, W.Z.W.; Azis, N.; Ya’Acob, M.E.; Supeni, E.E. Photovoltaic Panel Temperature and Heat Distribution Analysis for Thermoelectric Generator Application. In Proceedings of the 2018 IEEE 5th International Conference on Smart Instrumentation, Measurement and Application ICSIMA, Songkla, Thailand, 28–30 November 2018; pp. 28–30. [Google Scholar] [CrossRef]
- Shatar, N.M.; Rahman, M.A.A.; Muhtazaruddin, M.N.; Salim, S.A.Z.S.; Singh, B.; Muhammad-Sukki, F.; Bani, N.A.; Saudi, A.S.M.; Ardila-Rey, J.A. Performance evaluation of unconcentrated photovoltaic-thermoelectric generator hybrid system under tropical climate. Sustainability 2019, 11, 6192. [Google Scholar] [CrossRef]
- Piarah, W.H.; Djafar, Z.; Syafaruddin; Mustofa. The characterization of a spectrum splitter of Techspec AOI 50.0mm square hot and cold mirrors using a halogen light for a photovoltaic-thermoelectric generator hybrid. Energies 2019, 12, 353. [Google Scholar] [CrossRef]
- Bruzzi, M.; Baldi, A.; Carnevale, E.A.; Catelani, M.; Ciani, L. Conversion efficiency of Si-InGaAs and GaAsP-Si-Ge lateral beam splitting photovoltaic devices. Measurement 2018, 119, 102–107. [Google Scholar] [CrossRef]
- Cotfas, D.T.; Cotfas, P.A.; Ciobanu, D.; MacHidon, O.M. Characterization of Photovoltaic-Thermoelectric-Solar Collector Hybrid Systems in Natural Sunlight Conditions. J. Energy Eng. 2017, 143. [Google Scholar] [CrossRef]
- Popov, R.; Paunkov, N.; Rangelova, V.; Georgiev, A. Study of hybrid thermal system with photovoltaic panels using virtual instruments. Renew. Energy 2020, 154, 1053–1064. [Google Scholar] [CrossRef]
- Lashin, A.; Turkestani, M.A.; Sabry, M. Concentrated photovoltaic/thermal hybrid system coupled with a thermoelectric generator. Energies 2019, 12, 2623. [Google Scholar] [CrossRef]
- Riahi, A.; Ben Haj Ali, A.; Fadhel, A.; Guizani, A.; Balghouthi, M. Performance investigation of a concentrating photovoltaic thermal hybrid solar system combined with thermoelectric generators. Energy Convers. Manag. 2020, 205, 112377. [Google Scholar] [CrossRef]
- Zhou, Y.; Yin, X.; Zhang, Q.; Wang, N.; Yamamoto, A.; Koumoto, K.; Shen, H.; Lin, H. Perovskite solar cell-thermoelectric tandem system with a high ef fi ciency of over 23 %. Mater. Today Energy 2019, 12, 363–370. [Google Scholar] [CrossRef]
- Li, G.; Shittu, S.; Zhou, K.; Zhao, X.; Ma, X. Preliminary experiment on a novel photovoltaic-thermoelectric system in summer. Energy 2019, 188, 116041. [Google Scholar] [CrossRef]
- Ahiska, R.; Ahiska, K. New method for investigation of parameters of real thermoelectric modules. Energy Convers. Manag. 2010, 51, 338–345. [Google Scholar] [CrossRef]
- Ahiska, R.; Dişlitaş, S. Computer controlled test system for measuring the parameters of the real thermoelectric module. Energy Convers. Manag. 2011, 52, 27–36. [Google Scholar] [CrossRef]
- Ahiska, R.; Dislitas, S.; Omer, G. A new method and computer-controlled system for measuring the time constant of real thermoelectric modules. Energy Convers. Manag. 2012, 53, 314–321. [Google Scholar] [CrossRef]
- Carmo, J.P.; Antunes, J.; Silva, M.F.; Ribeiro, J.F.; Goncalves, L.M.; Correia, J.H. Characterization of thermoelectric generators by measuring the load-dependence behavior. Measurement 2011, 44, 2194–2199. [Google Scholar] [CrossRef]
- Karabetoglu, S.; Sisman, A.; Ozturk, Z.F.; Sahin, T. Characterization of a thermoelectric generator at low temperatures. Energy Convers. Manag. 2012, 62, 47–50. [Google Scholar] [CrossRef]
- Ahiska, R.; Mamur, H. A test system and supervisory control and data acquisition application with programmable logic controller for thermoelectric generators. Energy Convers. Manag. 2012, 64, 15–22. [Google Scholar] [CrossRef]
- Liu, C.; Chen, P.; Li, K. A 500 W low-temperature thermoelectric generator: Design and experimental study. Int. J. Hydrogen Energy 2014, 39, 15497–15505. [Google Scholar] [CrossRef]
- Özdemir, A.E.; Köysal, Y.; Özbaş, E.; Atalay, T. The experimental design of solar heating thermoelectric generator with wind cooling chimney. Energy Convers. Manag. 2015, 98, 127–133. [Google Scholar] [CrossRef]
- Izidoro, C.L.; Ando Junior, O.H.; Carmo, J.P.; Schaeffer, L. Characterization of thermoelectric generator for energy harvesting. Measurement 2017, 106, 283–290. [Google Scholar] [CrossRef]
- Massaguer, E.; Massaguer, A.; Montoro, L.; Gonzalez, J.R. Development and validation of a new TRNSYS type for the simulation of thermoelectric generators. Appl. Energy 2014, 134, 65–74. [Google Scholar] [CrossRef]
- Al Musleh, M.; Topriska, E.V.; Jenkins, D.; Owens, E. Thermoelectric generator characterization at extra-low-temperature difference for building applications in extreme hot climates: Experimental and numerical study. Energy Build. 2020, 225, 110285. [Google Scholar] [CrossRef]
- Zhu, Y.; Xiao, W. A comprehensive review of topologies for photovoltaic I–V curve tracer. Sol. Energy 2020, 196, 346–357. [Google Scholar] [CrossRef]
- Cotfas, D.T.; Cotfas, P.A. PV Innovative Techniques and Experimental Test Sets. In Renewable Energy Systems: Theory, Innovations and Intelligent Applications; Kaplanis, S., Kaplani, E., Eds.; Nova Science Publishers, Inc.: New York, NY, USA, 2013; pp. 1–28. ISBN 978-1-62417-741-5. [Google Scholar]
- Amiry, H.; Benhmida, M.; Bendaoud, R.; Hajjaj, C.; Bounouar, S.; Yadir, S.; Raïs, K.; Sidki, M. Design and implementation of a photovoltaic I-V curve tracer: Solar modules characterization under real operating conditions. Energy Convers. Manag. 2018, 169, 206–216. [Google Scholar] [CrossRef]
- De Medeiros, R.P.; De Macedo, E.C.T.; De Souza Neto, J.M.R.; Vitorino, M.A.; Hartmann, L.V. A simple circuit for characterization of photovoltaic module under uniform radiation and shading conditions. In Proceedings of the IEEE International Instrumentation and Measurement Technology Conference Proceedings, Taipei, Taiwan, 23–26 May 2016. [Google Scholar] [CrossRef]
- Taciuc, M. An experimental system for measuring the PV panel characteristics curves under real operation conditions. In Proceedings of the International Symposium on Fundamentals of Electrical Engineering ISFEE, Bucharest, Romania, 30 June–2 July 2016. [Google Scholar] [CrossRef]
- Vega, A.; Valiño, V.; Conde, E.; Ramos, A.; Reina, P. Double sweep tracer for I-V curves characterization and continuous monitoring of photovoltaic facilities. Sol. Energy 2019, 190, 622–629. [Google Scholar] [CrossRef]
- Sarikh, S.; Raoufi, M.; Bennouna, A.; Benlarabi, A.; Ikken, B. Implementation of a plug and play I-V curve tracer dedicated to characterization and diagnosis of PV modules under real operating conditions. Energy Convers. Manag. 2020, 209, 112613. [Google Scholar] [CrossRef]
- Cáceres, M.; Firman, A.; Montes-Romero, J.; González Mayans, A.R.; Vera, L.H.; Fernández, E.F.; de la Casa Higueras, J. Low-Cost I–V Tracer for PV Modules under Real Operating Conditions. Energies 2020, 13, 4320. [Google Scholar] [CrossRef]
- Erkaya, Y.; Moses, P.; Marsillac, S. On-site characterization of PV modules using a portable, MOSFET-based capacitive load. In Proceedings of the IEEE 44th Photovoltaic Specialist Conference PVSC, Washington, DC, USA, 25–30 June 2017; pp. 1–4. [Google Scholar] [CrossRef]
- Cotfas, P.A.; Cotfas, D.T. Design and implementation of RELab system to study the solar and wind energy. Measurement 2016, 93. [Google Scholar] [CrossRef]
- Cotfas, D.T.; Cotfas, P.A.; Ursutiu, D.; Samoila, C. Current-voltage characteristic raising techniques for solar cells. Comparisons and applications. In Proceedings of the International Conference on Optimization of Electrical and Electronic Equipment, OPTIM, Brasov, Romania, 20–22 May 2010. [Google Scholar]
- Cotfas, D.T.; Cotfas, P.A.; Floroian, D.I.; Floroian, L. Accelerated Life Test for Photovoltaic Cells Using Concentrated Light. Int. J. Photoenergy 2016, 2016. [Google Scholar] [CrossRef]
- Chen, Z.; Lin, W.; Wu, L.; Long, C.; Lin, P.; Cheng, S. A capacitor based fast I-V characteristics tester for photovoltaic arrays. Energy Procedia 2018, 145, 381–387. [Google Scholar] [CrossRef]
- Ortega, E.; Aranguren, G.; Jimeno, J.C. New monitoring method to characterize individual modules in large photovoltaic systems. Sol. Energy 2019, 193, 906–914. [Google Scholar] [CrossRef]
- García-Valverde, R.; Chaouki-Almagro, S.; Corazza, M.; Espinosa, N.; Hösel, M.; Søndergaard, R.R.; Jørgensen, M.; Villarejo, J.A.; Krebs, F.C. Portable and wireless IV-curve tracer for >5 kV organic photovoltaic modules. Sol. Energy Mater. Sol. Cells 2016, 151, 60–65. [Google Scholar] [CrossRef]
- Shapsough, S.; Takrouri, M.; Dhaouadi, R.; Zualkernan, I. An IoT-based remote IV tracing system for analysis of city-wide solar power facilities. Sustain. Cities Soc. 2020, 57, 102041. [Google Scholar] [CrossRef]
- Pereira, R.I.S.; Dupont, I.M.; Carvalho, P.C.M.; Jucá, S.C.S. IoT embedded linux system based on Raspberry Pi applied to real-time cloud monitoring of a decentralized photovoltaic plant. Measurement 2018, 114, 286–297. [Google Scholar] [CrossRef]
- Pereira, R.I.S.; Jucá, S.C.S.; Carvalho, P.C.M. IoT embedded systems network and sensors signal conditioning applied to decentralized photovoltaic plants. Measurement 2019, 142, 195–212. [Google Scholar] [CrossRef]
- Kekre, A. Solar Photovoltaic Remote Monitoring System Using IOT. In Proceedings of the International Conference on Recent Innovations in Signal Processing and Embedded Systems (RISE), Bhopal, India, 27–29 October 2017. [Google Scholar]
- López-Vargas, A.; Fuentes, M.; Vivar, M. On the application of IoT for real-time monitoring of small stand-alone PV systems: Results from a new smart datalogger. In Proceedings of the IEEE 7th World Conference on Photovoltaic Energy Conversion (WCPEC) (A Joint Conference of 45th IEEE PVSC, 28th PVSEC & 34th EU PVSEC), Waikoloa Village, HI, USA, 10–15 June 2018. [Google Scholar]
- Data, B.; Khan, M.S.; Delhi, N.; Sharma, H.; Haque, A.; Delhi, N. IoT Enabled Real-Time Energy Monitoring for Photovoltaic Systems. In Proceedings of the International Conference on Machine Learning, Big Data, Cloud and Parallel Computing (COMITCon), Faridabad, India, 14–16 February 2019; pp. 10–14. [Google Scholar]
- Kumar, N.M.; Atluri, K.; Palaparthi, S. Internet of Things (IoT) in Photovoltaic Systems. In Proceedings of the National Power Engineering Conference NPEC, Madurai, India, 9–10 March 2018. [Google Scholar] [CrossRef]
- Rouibah, N.; Barazane, L.; Mellit, A.; Hajji, B.; Rabhi, A. A Low-Cost Monitoring System for Maximum Power Point of a Photovoltaic System Using IoT Technique. In Proceedings of the International Conference on Wireless Technologies, Embedded and Intelligent Systems (WITS), Fez, Morocco, 3–4 April 2019; pp. 4–8. [Google Scholar]
- Choi, C.; Jeong, J.; Han, J.; Park, W.; Lee, I. Implementation of IoT based PV Monitoring System with Message Queuing Telemetry Transfer protocol and Smart Utility Network. In Proceedings of the International Conference on Information and Communication Technology Convergence (ICTC), Jeju Island, Korea, 18–20 October 2017; pp. 1077–1079. [Google Scholar]
- Choi, C.; Jeong, J.; Lee, I.; Park, W. LoRa based Renewable Energy Monitoring System with Open IoT Platform 2. LoRa based Energy IoT Monitoring. In Proceedings of the International Conference on Electronics, Information, and Communication (ICEIC), Honoulul, HI, USA, 24–27 January 2018. [Google Scholar]
- Hamied, A. IoT-Based Experimental Prototype for Monitoring of Photovoltaic Arrays. In Proceedings of the International Conference on Applied Smart Systems (ICASS), Medea, Algeria, 24–25 November 2018. [Google Scholar]
- Deshmukh, N.S. A Smart Solar Photovoltaic Remote Monitoring and Controlling. In Proceedings of the 2nd International Conference on Intelligent Computing and Control Systems (ICICCS), Madurai, India, 14–15 June 2018; pp. 67–71. [Google Scholar]
- Ziolkowski, P.; Blaschkewitz, P.; Müller, E. Heat flow measurement as a key to standardization of thermoelectric generator module metrology: A comparison of reference and absolute techniques. Measurement 2021, 167, 108273. [Google Scholar] [CrossRef]
- Guarnieri Calò Carducci, C.; Spadavecchia, M.; Attivissimo, F. High accuracy testbed for thermoelectric module characterization. Energy Convers. Manag. 2020, 223, 113325. [Google Scholar] [CrossRef]
- Attivissimo, F.; Carducci, C.G.C.; Lanzolla, A.M.L.; Spadavecchia, M. An extensive unified thermo-electric module characterization method. Sensors 2016, 16, 2114. [Google Scholar] [CrossRef]


| Reference | Platform and Method | Current | Voltage | Temperature | Temp. Sensors | Irradiance | Testing Conditions/Comments | Application Scope 4 | ||||||
|---|---|---|---|---|---|---|---|---|---|---|---|---|---|---|
| Device | Characteristics | Device | Ch. 1 | Device | Ch. 1 | Device | Ch. 1 | Device | Ch. 1 | Device | Ch. 1 | |||
| Hybrid system | ||||||||||||||
| Benghanem et al. in [7] | PC | ReRa Tracer Software | Keithley 2420 | - | Keithley 2420 | - | PeakTech DMM 3695 | - | K-type thermocouples | - | Kipp & Zonen CM11 Pyranometer | - | Natural light | A: Outside; B: Short; C: High; D. High. |
| Rajaee et al. [20] | - | - | DMM UT71C | MA2 = ±(0.8% + 1) MSD3 = 0.051 | DMM UT71C | MA 2 = ±(0.6% + 1) MSD3 = 0.046 | TESTO -177-T4 | MA 2 = ±0.5 MSD 3 = 0.14 | K-type thermocouples | MA2 = ±1 MSD3 = 0.288 | - | - | Natural light | A: Outside; B: Short; C: Average/High; D: Average |
| Mahmoudinezhad et al. [31,47,48] | NI cRIO 9074 | LabVIEW | NI 9227 module | Resolution, 24 bits; Range, 5ARMS Relative uncertainty, 0.26% | NI 9215 module | Resolution, 16 bits; Range, ±10V Relative uncertainty, 2.34% | NI 9211, NI 9213 modules | Resolution, 24 bits; Range, ±80 mV/±78.125 mV Relative uncertainty, 0.09 and 0.03% | K-type thermocouples | - | Thermogauge sensor | - | Xenon lamps | A: Outside/Inside; B: Long; C: High; D: Average/High. |
| Indrasari et al. [49] | Arduino Uno R3 | - | INA219 | - | INA219 | - | - | - | DS18B20 | - | - | - | Natural light | A: Outside; B: Short; C: Low; D: Low. |
| Shatar et al. [51] | PC | Solar charger controller and NI NI USB-6211 DAQ | - | Solar charger controller and NI NI USB-6211 DAQ | Solar charger controller and NI NI USB-6211 DAQ | K-type thermocouple | - | - | - | Natural light | A: Outside; B: Long; C: Average; D: Average. | |||
| Piarah et al. [52] | - | DMM GW Instek GDM-8135 | 0.414 μA | DMM GW Instek GDM-8135 | Power, 0.818 × 10⁻³ μW | - | - | - | Mini USB spectrometer | - | Halogen bulb and Fresnel lens | A: Inside; B: Short; C: Average/High; D: High. | ||
| Bruzzi et al. [53] | PC | MATLAB | Keithley 2401 source meter | ±10 μA | Keithley 2401 source meter | ±1 mV | Keithley 2001 | - | PT100 | - | Pyranometer—Keithley 181 nanovoltmeter | ±10 W/m2 | 2000 Abet Technologies solar simulator and natural light | A: Inside/Outside; B: Long; C: High; D: High. |
| Popov et al. [55] | PC | LabVIEW | LabJack UE9/MCP609 OpAmp/HCF4051B and 0.1% resistor | - | LabJack UE9/ MCP609,OpAmp/ HCF4051B | LabJack UE9/MCP609 OpAmp/HCF4051B or 1 wire interface | - | PT100/ DS1820 | - | Kipp & Zonen CMP6 pyranometer | - | Natural light | A: Outside; B: Long; C: Average/High; D: Average/High. | |
| Shittu et al. [22] | PV RS Pro ISM 490 TEG Aneng AN8009 DMM Earlywish Variable decade resistor | Accuracy ±1% ±0.5% ±1% | PV RS Pro ISM 490 TEG Neoteck Pocket DMM Earlywish Variable decade resistor | Accuracy, ±1% ±0.5% ±1% | Hioki Memory HiLogger LR8400 | - | K-type thermocouple | Accuracy, ±0.5% | Hukseflux Pyranometer SR20-D2 | Accuracy, ±1.2% | Atlas Solar simulator Solar constant MHG 4000/2500 | A: Inside; B: Short; C: High; D: High. | ||
| Riahi et al. [57] | PC | LabVIEW | Keithley DAQ 2700 | - | Keithley DAQ 2700 | - | Keithley DAQ 2700 | - | K-type thermocouples | - | - | - | Natural light | A: Outside; B: Short/Average; C: High; D: Average/High. |
| Zhou et al. [58] | - | - | Keithley 2400 source meter | - | Keithley 2400 source meter | - | - | - | K-type thermocouple model SMPW-TT-K-30-SLE (OMEGA) | - | Calibrated silicon standard solar cell | - | Oriel solar simulator model 91192 | A: Inside; B: Short/Average; C: High; D: High. |
| Li et al. [59] | PC | - | PV RS Components Ltd.—ISM490 TEG Neoteck DMM | Accuracy, ±1% Experimental RME, ±1% | PV RS Components Ltd.—ISM490 TEG Neoteck DMM | Accuracy, ±1% Experimental RME, ±1% | Agilent DAQ 34970A | - | Copper–constantan thermocouples (homemade) | Accuracy, ±0.5 K Experimental RME, 0.33% | Jinzhou Pyranometer—TBQ-2 | Accuracy, 2% Experimental RME, 2% | Natural light | A: Outside; B: Short; C: High; D: Average/High. |
| PV Component Alone | ||||||||||||||
| Amiry et al. [73] | Arduino Mega | Method: I–V with RBM | INA 219 | Resolution, 1 mA Accuracy, 1% | INA 219 | Resolution, 4.89 mV | MAX6675 | Resolution, 0.25 °C | K-type thermocouple | - | Solarimeter—SL200 | - | Natural light | A: Inside/Outside; B: Short/Average; C: Low; D: Low. |
| Taciuc [75] | 12-bit ADC with 40 AI | Method: I–V with TBM | ADC and Allegro MicroSystems Hall effect-based current sensor ACS713 | - | ADC and resistive voltage divisor | - | ADC | - | NTC thermistors NTCM-HP-10K-1% | - | Kipp & Zonen SMP11 Pyranometer | - | Natural light | A: Inside/Outside; B: Long; C: Low/Average; D: Average/High. |
| anemometer Adolf Thies GmbH & Co.KG | ||||||||||||||
| Cáceres et al. [78] | PC and TivaC Series LaunchPad | LabVIEW 12-bit ADC 1 MS/s sampling rate and 48 GPIO lines Method: I–V with CBM | Instrumentation amplifier AD620BNZ with shunt resistor | - | Instrumentation amplifier AD620BNZ as attenuator | - | Instrumentation amplifier AD620BNZ | - | PT100 | - | Based on shunted PV | - | Natural light | A: Inside/Outside; B: Average/Long; C: Average; D: Low. |
| Cotfas [80] | PC with NI NELVIS II, NI myDAQ or NI myRIO and RELab board | LabVIEW Method: I–V with CBM | NI platform with instrumentation amplifier AD8222 with shunt resistor | - | NI platform with Instrumentation amplifier AD8222 | - | NI platform with | - | LM35 | ±0.25 °C | TSL230 | ±10% | Halogen lamp or natural light | A: Inside/Outside; B: Short; C: Average; D: Average. |
| Chen et al. [83] | TMS320F28335 DSP processor | LabVIEW Method: I–V with CBM | LTS 15-NP | Accuracy, 0.7% (Datasheet) | LV 25-P | Accuracy, 0.9% (Datasheet) | Are not mentioned | - | Are not mentioned | - | Are not mentioned | - | - | A: Inside/Outside; B: Average/Long; C: Average; D: Low. |
| Sarikh et al. [77] | Raspberry Pi | Method: I–V with TBM | ADS1115 ADC and AC712 Hall effect sensor | Comparison with a references Rsquared = 0.97793 RMSE = 0.35678 MSE = 0.034203 | ADS1115 ADC and voltage resistive divider | Comparison with a reference Rsquared = 0.98567 RMSE = 1.0779 MSE = −0.01777 | ADS1115 ADC | - | Pt-1000 RTD | - | ADS1115 ADC and shunted solar cell | - | Simulation and natural light | A: Inside/Outside; B: Average/Long; C: Average; D: Low. |
| García-Valverde et al. [85] | PC and TM4C123G evaluation board | LabVIEW Method: I–V with CBM | 12-bit ADC with TS912BIDT OpAmp and LR2512-R50FW shunt resistance | - | 12-bit ADC with TS912BIDT OpAmp and 300.2-100M-DF-1:1000- DF voltage divider | - | Arduino Mega 2560 R3 with | - | DS18B20 and DHT22 (temperature and humidity) sensors | - | BPW34 Photodiode | - | Natural light | A: Outside; B: Short/Average; C: Average; D: Low. |
| Shapsough et al. [86] | Raspberry Pi | IoT concept Method: I–V with CBM | Yocotwatt wattmeter | Sample rate, 100 Hz | Yocotwatt wattmeter | Sample rate, 100 Hz | Are not mentioned | - | Are not mentioned | - | Are not mentioned | - | Natural light | A: Outside; B: Long; C: Average; D: Average. |
| Pereira et al. [87] | Raspberry Pi | IoT concept Method: monitoring only | SanUSB microcontroller+ ACS712—5A sensor | 1.5% error | SanUSB microcontroller + voltage resistive divider | SanUSB microcontroller and Raspberry Pi | - | LM35 and DHT11 | Accuracy 0.5 °C and accuracy 2 °C for temperature and 5% for humidity | LP02 Pyranometer with SanUSB microcontroller and LM324 amplifier | - | Natural light | A: Outside; B: Long; C: Low/Average; D: Low. | |
| TEG Component Alone | ||||||||||||||
| Typical quantity | ||||||||||||||
| Carmo et al. [63] | PC | LabVIEW | Agilent 34410A with 6½ digits | Max. error: {40 μA, 60 μA, 0.6 mA} for the range of {100 mA, 1 A, 3 A} | Agilent 34410A with 6½ digits | Max. error: {3 μV, 6 μV, 40 μV} for the range of {100 mV, 1 V, 10 V} | PC and NI USB-6009 | - | Two thermistors | - | - | - | Laboratory design system/ Tested TEG—TEC1-12707 | A: Inside; B: Short; C: Average/High; D: Average/High. |
| Izidoro et al. [68] | PC + PIC18F452 microcontroller | - | PIC18F452 microcontroller + ACS712-5 sensor | Errors with calibration: 2% | PIC18F452 microcontroller + voltage resistive divider | Errors with calibration: ±1.5% | MAX31855 | Errors with calibration: 5% | K-type thermocouples | Included in the system error | - | - | Laboratory design system/ Tested TEG—inbC1-127.08HTS | A: Inside; B: Short; C: Average/High; D: Average/High. |
| Massaguer et al. [69] | PC NI cRIO | - | NI cRIO + I/O module (type is not specified) | - | NI cRIO + I/O module (type is not specified) | - | NI cRIO + I/O module (type is not specified) | - | K-type thermocouples | - | - | - | Laboratory design system | A: Inside; B: Short/Average; C: High; D: High. |
| Al Musleh et al. in [70] | PC | - | RO2—I-V TRACER | Accuracy, 1.5% | RO2—I-V TRACER | Accuracy, 1.5% | WL 110 heat exchanger unit | - | RTD PT100—type JUMO 902150/10 | Accuracy ± 0.12%= ±0.24 °C | Paddle-wheel water flow meter type Bürkert 783724Y | ±2% of full scale = ±0.083 l/m | Laboratory design system/ Tested TEG—GM250-127–14-16 (European Thermodynamics Limited) | A: Inside; B: Short/Average; C: High; D: High. |
| Ref | Software | HS Type | Comments |
|---|---|---|---|
| Koushik et al. [35] | MATLAB-Simulink | directly coupled HS | |
| Shatar et al. [36] | MATLAB-Simulink | directly coupled HS | agriculture application |
| Keser et al. [37] | MS Visio—Visio OTK with thermal solver Sinda | directly coupled HS | space application/finite volume method |
| Teffah et al. [38] | MATLAB-Simulink and COMSOL Multiphysics | directly coupled HS | finite element model |
| Kolahan et al. [39] | FORTRAN | tridiagonal matrix algorithm | |
| Gu et al. [19] | MATLAB | directly coupled HS | finite element model |
| Skjølstrup and Søndergaard [40] | MATLAB | indirectly coupled HS | Nelder–Mead simplex algorithm |
| Mohammadnia et al. [43] and [44] | Engineering Equation Solver | indirectly coupled HS | CPV/Stirling engine/TEG |
| Salari in [45] | - | directly coupled HS | finite volume method |
| Mahmoudinezhad et al. [47] | MATLAB | directly coupled HS | finite volume method |
| Mahmoudinezhad et al. [48] | COMSOL Multiphysics | directly coupled HS | 3-diode finite element analysis |
| Shittu et al. [46] | COMSOL Multiphysics | indirectly coupled HS | 3-diode finite element method |
| Riahi et al. [57] | Engineering Equation Solver | directly coupled HS | CPVT-TEG/energy balance equations |
| Zhou et al. [58] | MATLAB | directly coupled HS | |
| Massaguer et al. [69] | TRNSYS and Fortran | TEG only | finite differences and Newton–Raphson |
| Al Musleh et al. [70] | COMSOL Multiphysics V5.4 | TEG only | finite element method |
Publisher’s Note: MDPI stays neutral with regard to jurisdictional claims in published maps and institutional affiliations. |
© 2020 by the authors. Licensee MDPI, Basel, Switzerland. This article is an open access article distributed under the terms and conditions of the Creative Commons Attribution (CC BY) license (http://creativecommons.org/licenses/by/4.0/).
Share and Cite
Cotfas, P.A.; Cotfas, D.T. Comprehensive Review of Methods and Instruments for Photovoltaic–Thermoelectric Generator Hybrid System Characterization. Energies 2020, 13, 6045. https://doi.org/10.3390/en13226045
Cotfas PA, Cotfas DT. Comprehensive Review of Methods and Instruments for Photovoltaic–Thermoelectric Generator Hybrid System Characterization. Energies. 2020; 13(22):6045. https://doi.org/10.3390/en13226045
Chicago/Turabian StyleCotfas, Petru Adrian, and Daniel Tudor Cotfas. 2020. "Comprehensive Review of Methods and Instruments for Photovoltaic–Thermoelectric Generator Hybrid System Characterization" Energies 13, no. 22: 6045. https://doi.org/10.3390/en13226045
APA StyleCotfas, P. A., & Cotfas, D. T. (2020). Comprehensive Review of Methods and Instruments for Photovoltaic–Thermoelectric Generator Hybrid System Characterization. Energies, 13(22), 6045. https://doi.org/10.3390/en13226045