Conversion and Testing of a Solar Thermal Parabolic Trough Collector for CPV-T Application


Abstract
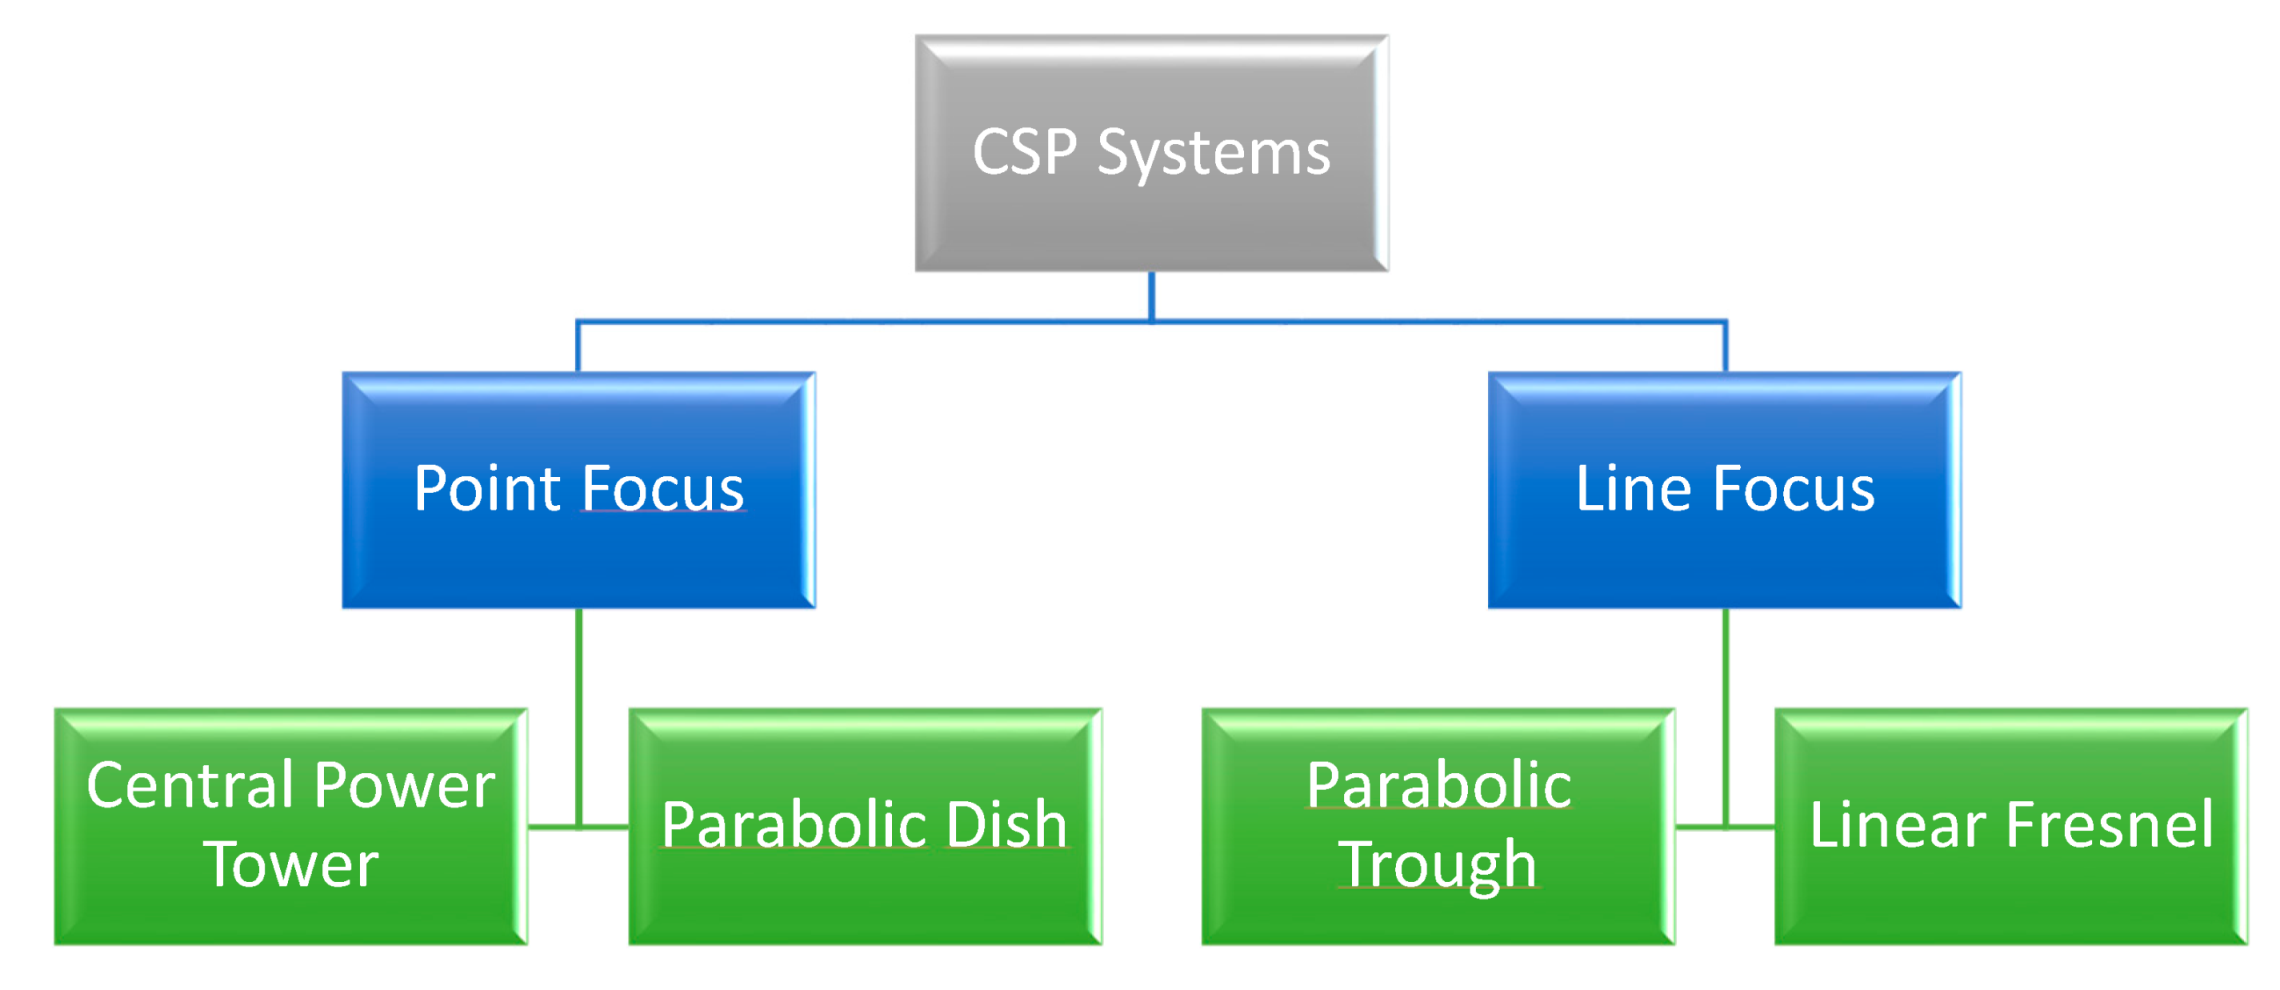
1. Introduction
1.1. Motivation
- The required raw materials are relatively expensive, and hence uneconomic when large surface areas are needed.
- Since CPV cells are usually operated under high concentration of sunlight, a heat rejection system (i.e., active cooling) is needed.
- CPV and CSP systems require sun-tracking mechanisms as they can only exploit direct and not global irradiance.
- (a)
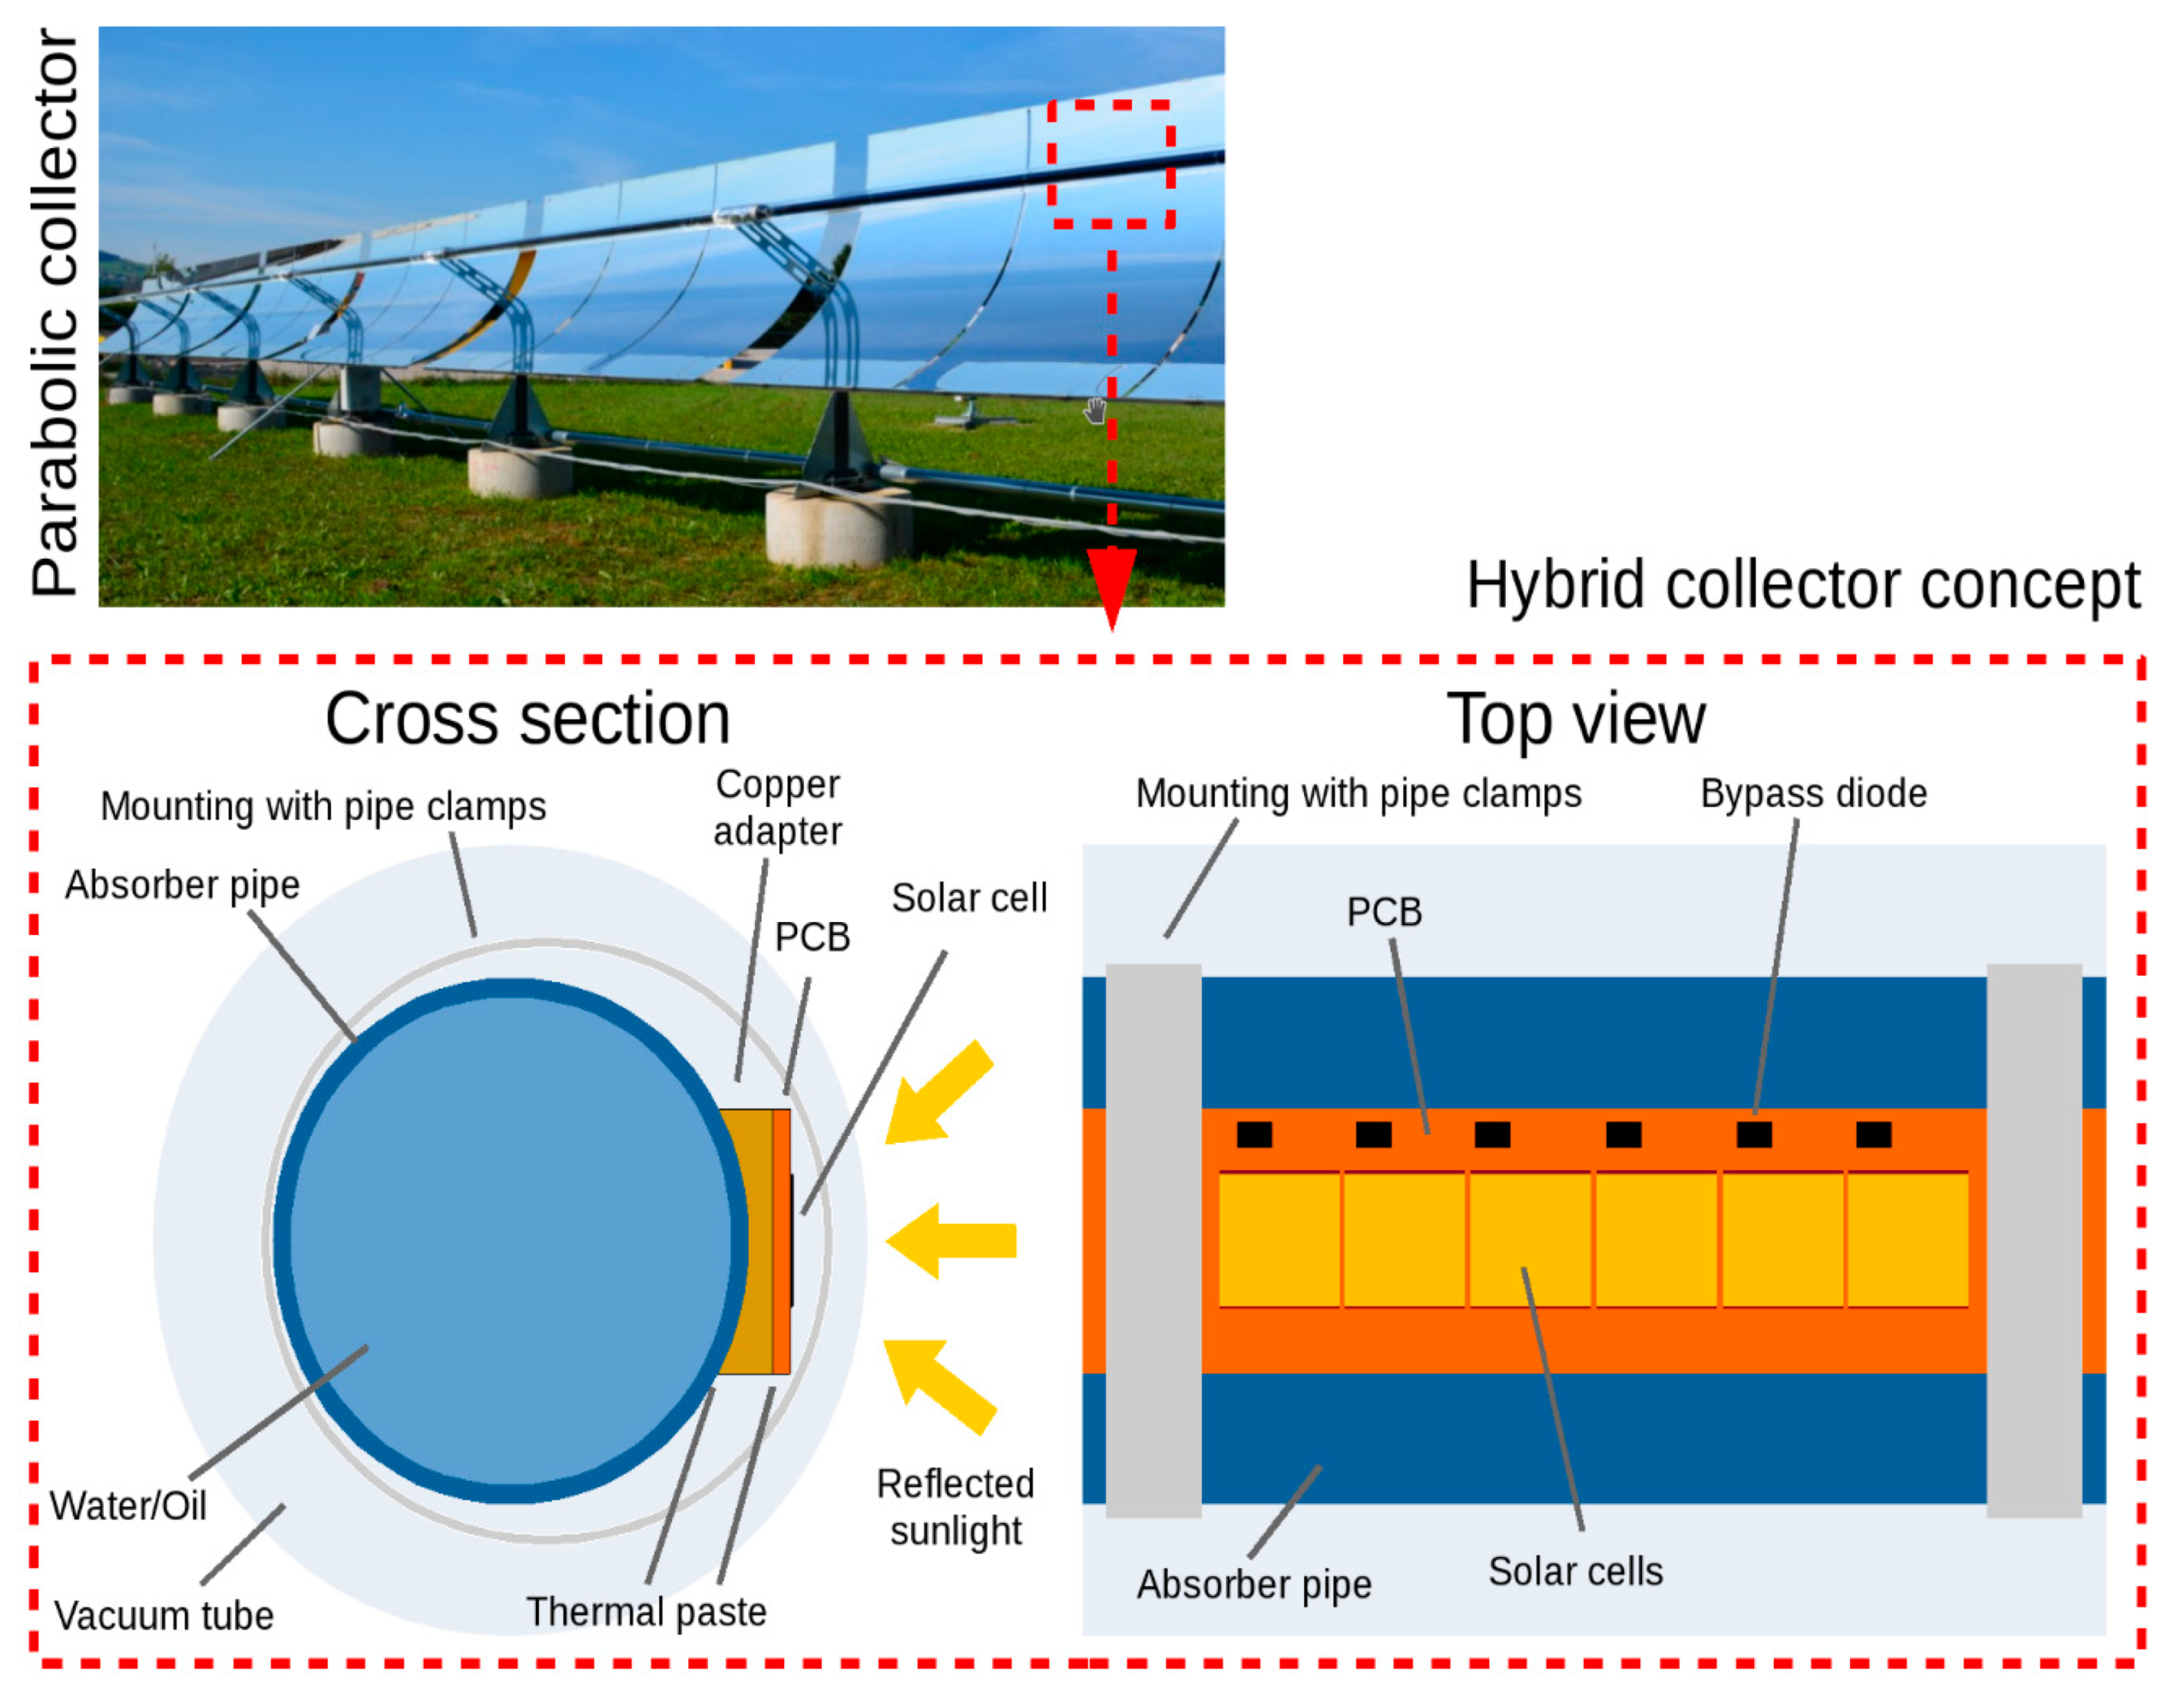
- The existing mirror of the collector is used to focus the light on the cell.
- (b)
- The existing absorber tube is used as an active back side cooling system for the cell.
- (c)
- The tracking mechanism is used for the CPV-cell and the thermal collector at once.
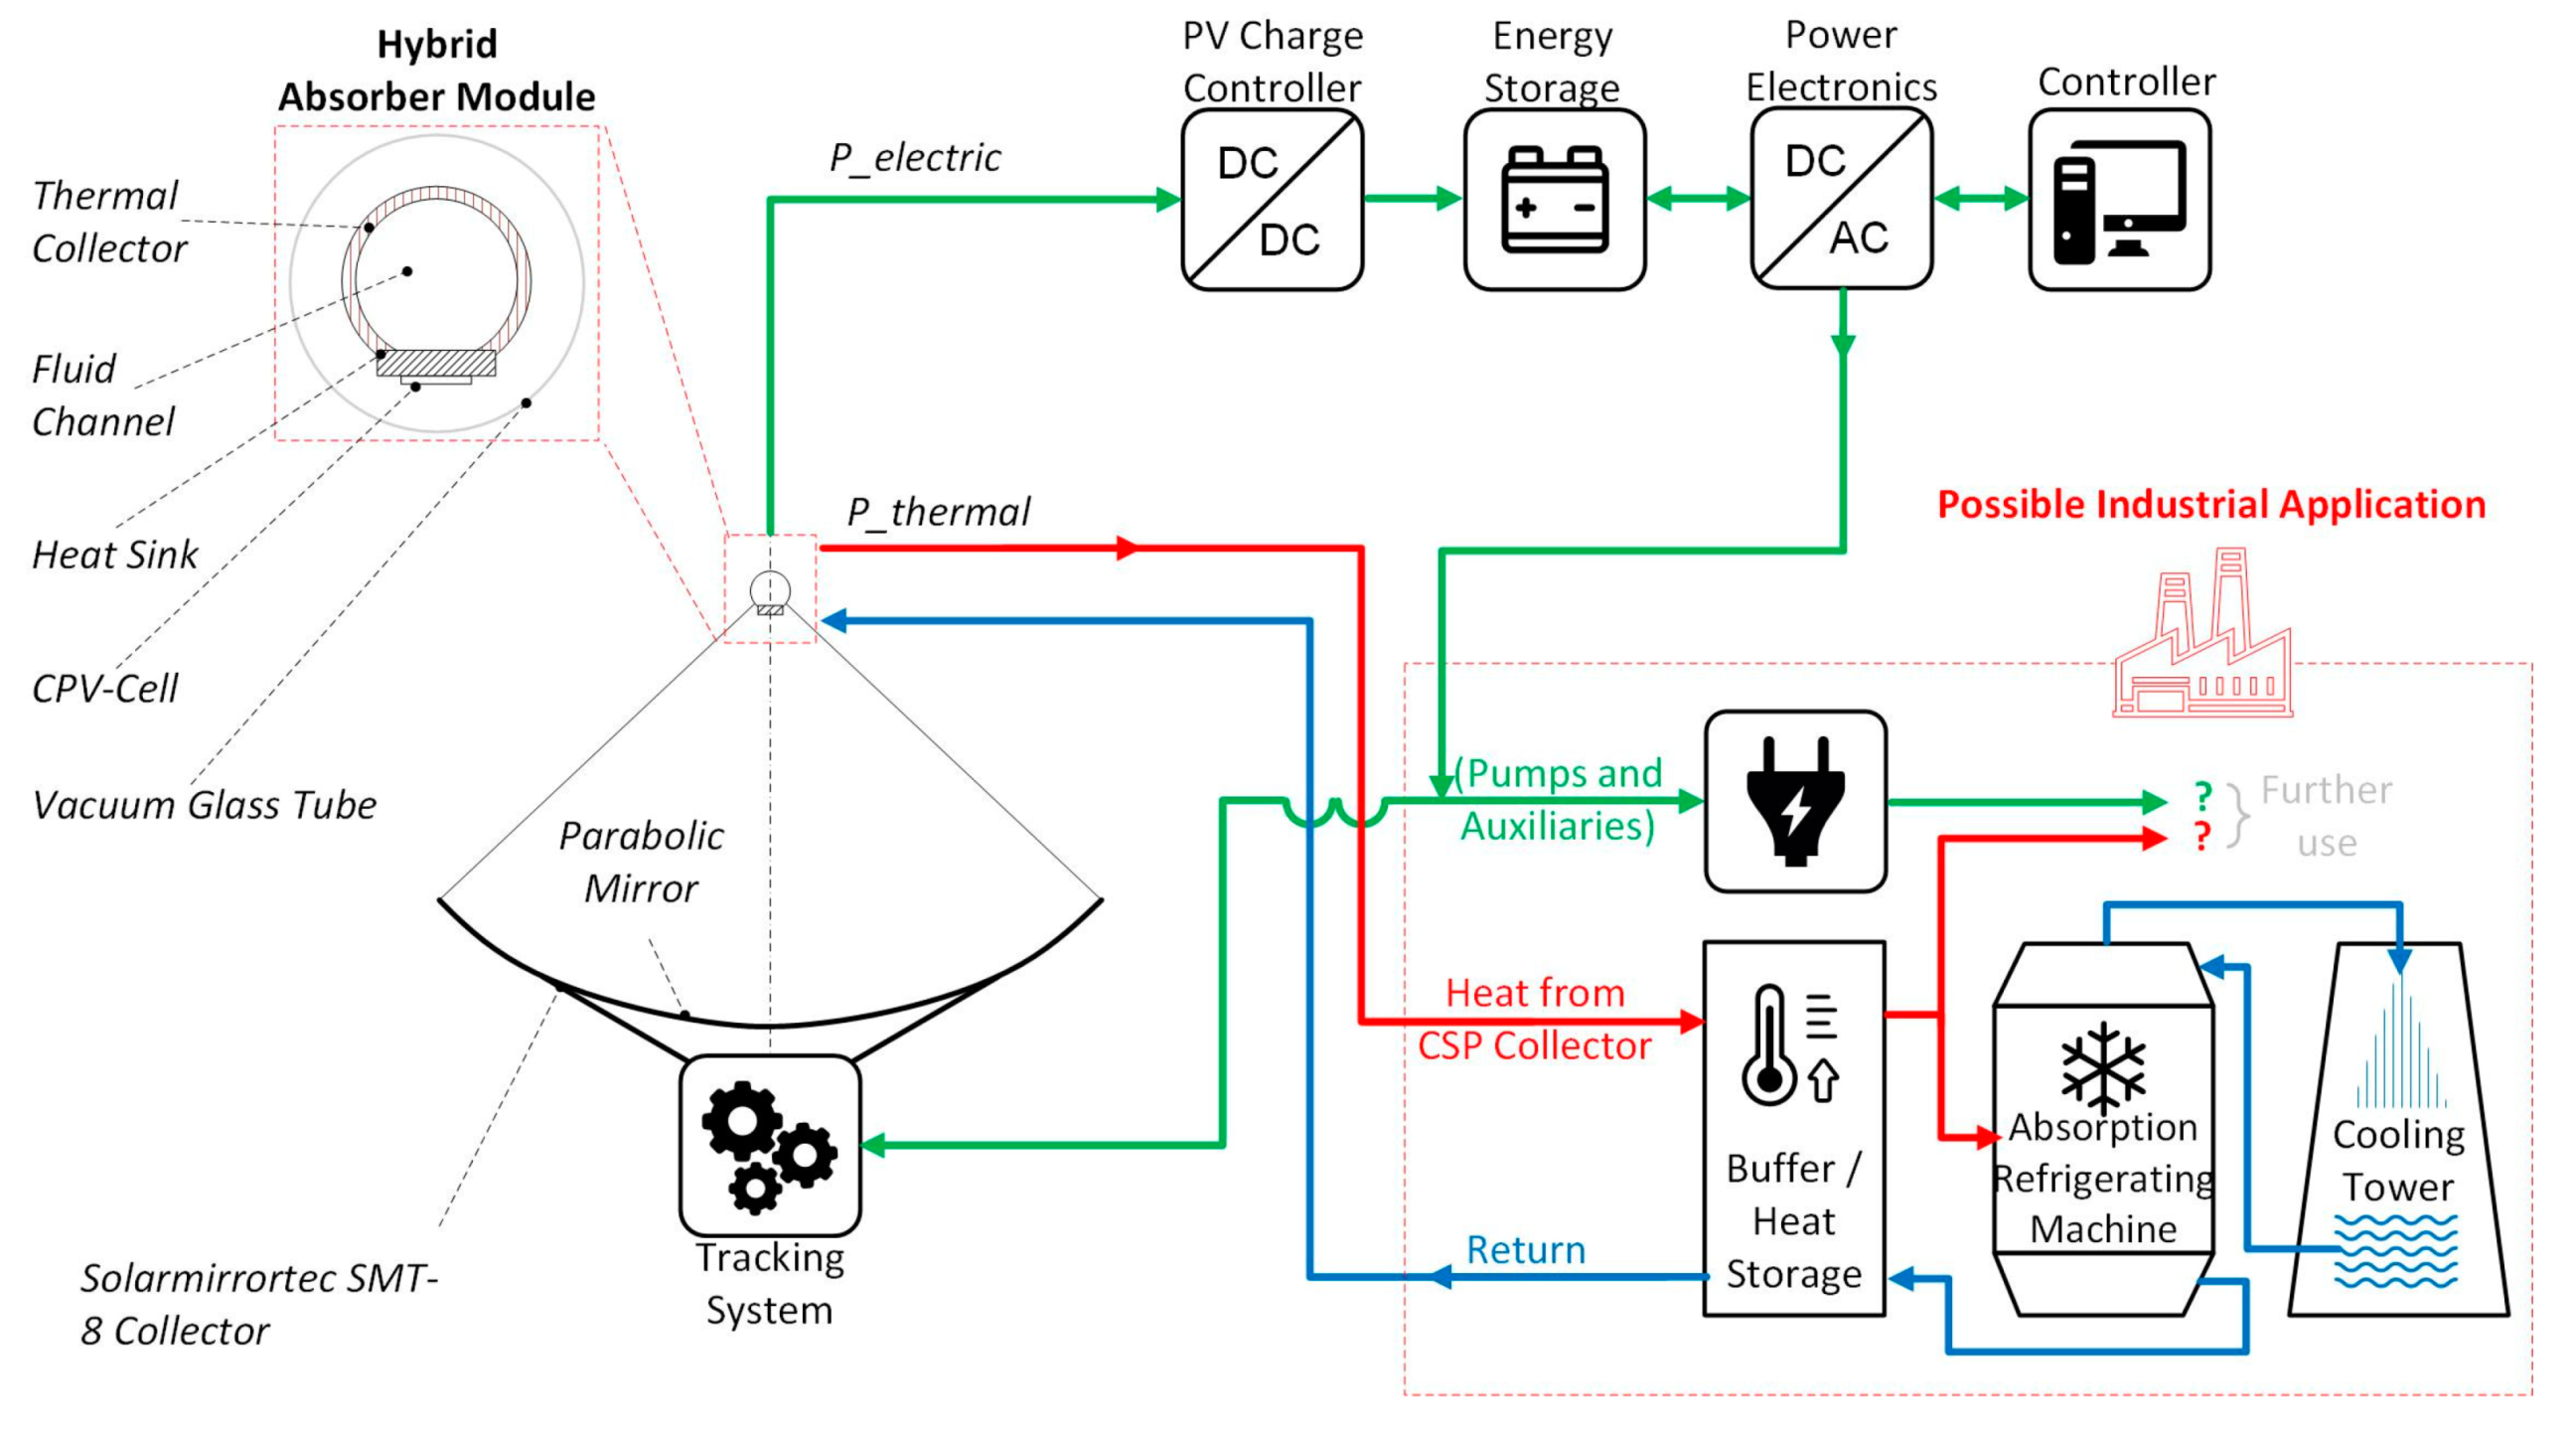
Versatile Applications of Modern CPV-T Systems
- 65% of machinery,
- 61% of transport equipment,
- 58% of mining and quarrying,
- 58% of food and tobacco,
- 50% of other industries,
1.2. State of the Art in CPV-T Systems
1.3. Idea and Initial Situation
2. Design of the CPV-T Retrofit System
2.1. Selection of the CPV Cell
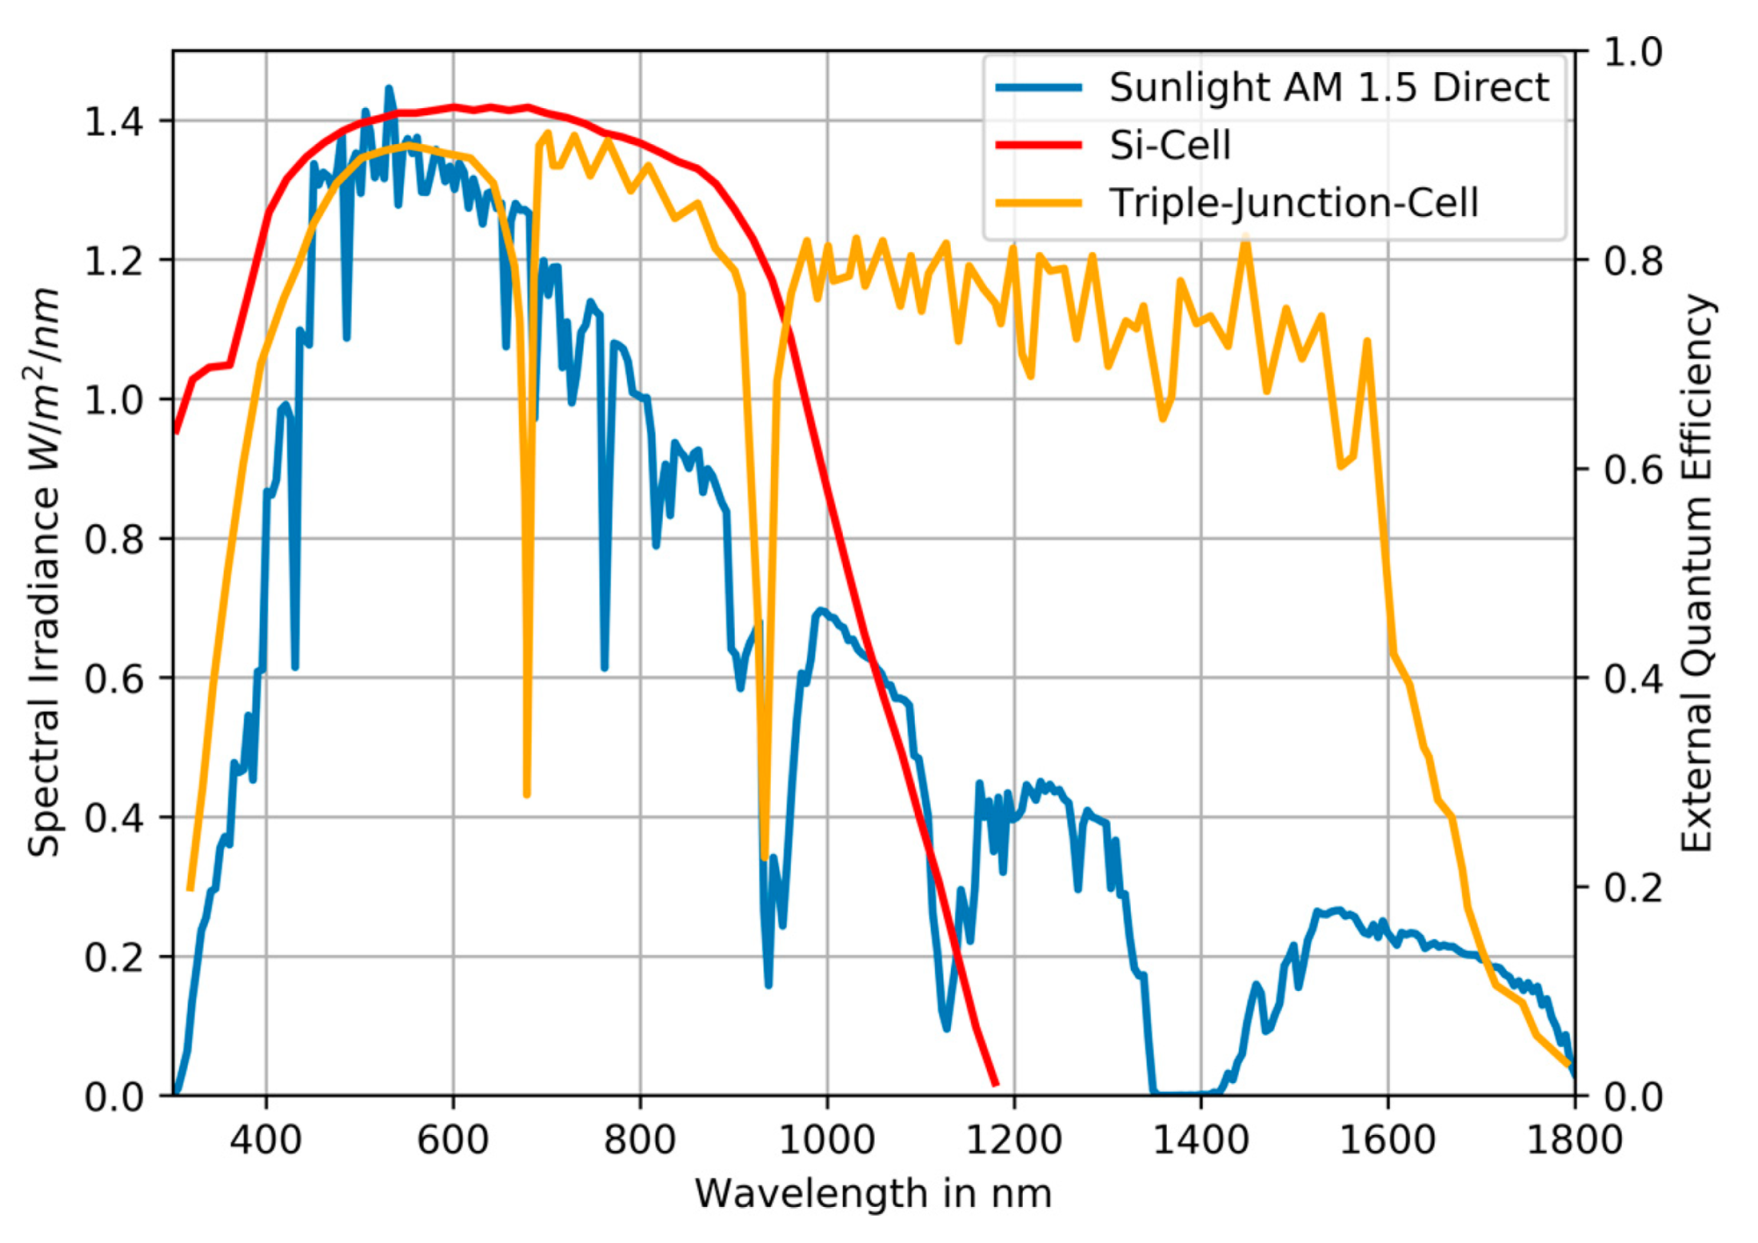
- Concentrated sunlight: In contrast to conventional flat panel solar cells which are designed for normal sun intensities (1× sun), the sunlight in concentrated systems is increased many times by mirrors (e.g., 150 suns, this depends on the mirror geometries and the system structure). This concentration ratio can save solar cell area.
- Geometry and electrical connectivity suitable for dense packing: The possibility to mount cells close together in the line focus is crucial to achieve high electrical system efficiencies. Wide spaces between the cells would reduce electrical yield/efficiency significantly, no matter how high the efficiency of the cells themselves are.
- High operating temperatures: The maximum cell temperature limits the HTF temperature in the thermal circuit and thus the maximum thermal temperature of the entire system. In order to be able to use the technology in many different industrial processes, the aim is to use a solar cell with a high working temperature (compare Section 1.1).
- High efficiency and low temperature coefficient: All in all, the solar cell should have a good degree of efficiency in order to be able to generate a lot of electrical energy. Furthermore, solar cells lose efficiency with increasing temperature (negative temperature coefficient). In order to use the cells effectively in industrial processes with higher temperatures, the temperature coefficient must be as low as possible.
- Good commercial availability at low cost: While cell price may be secondary in academic research projects, it will be important for future commercialization. Moreover, the availability of small quantities plays a crucial role for the prototype construction.
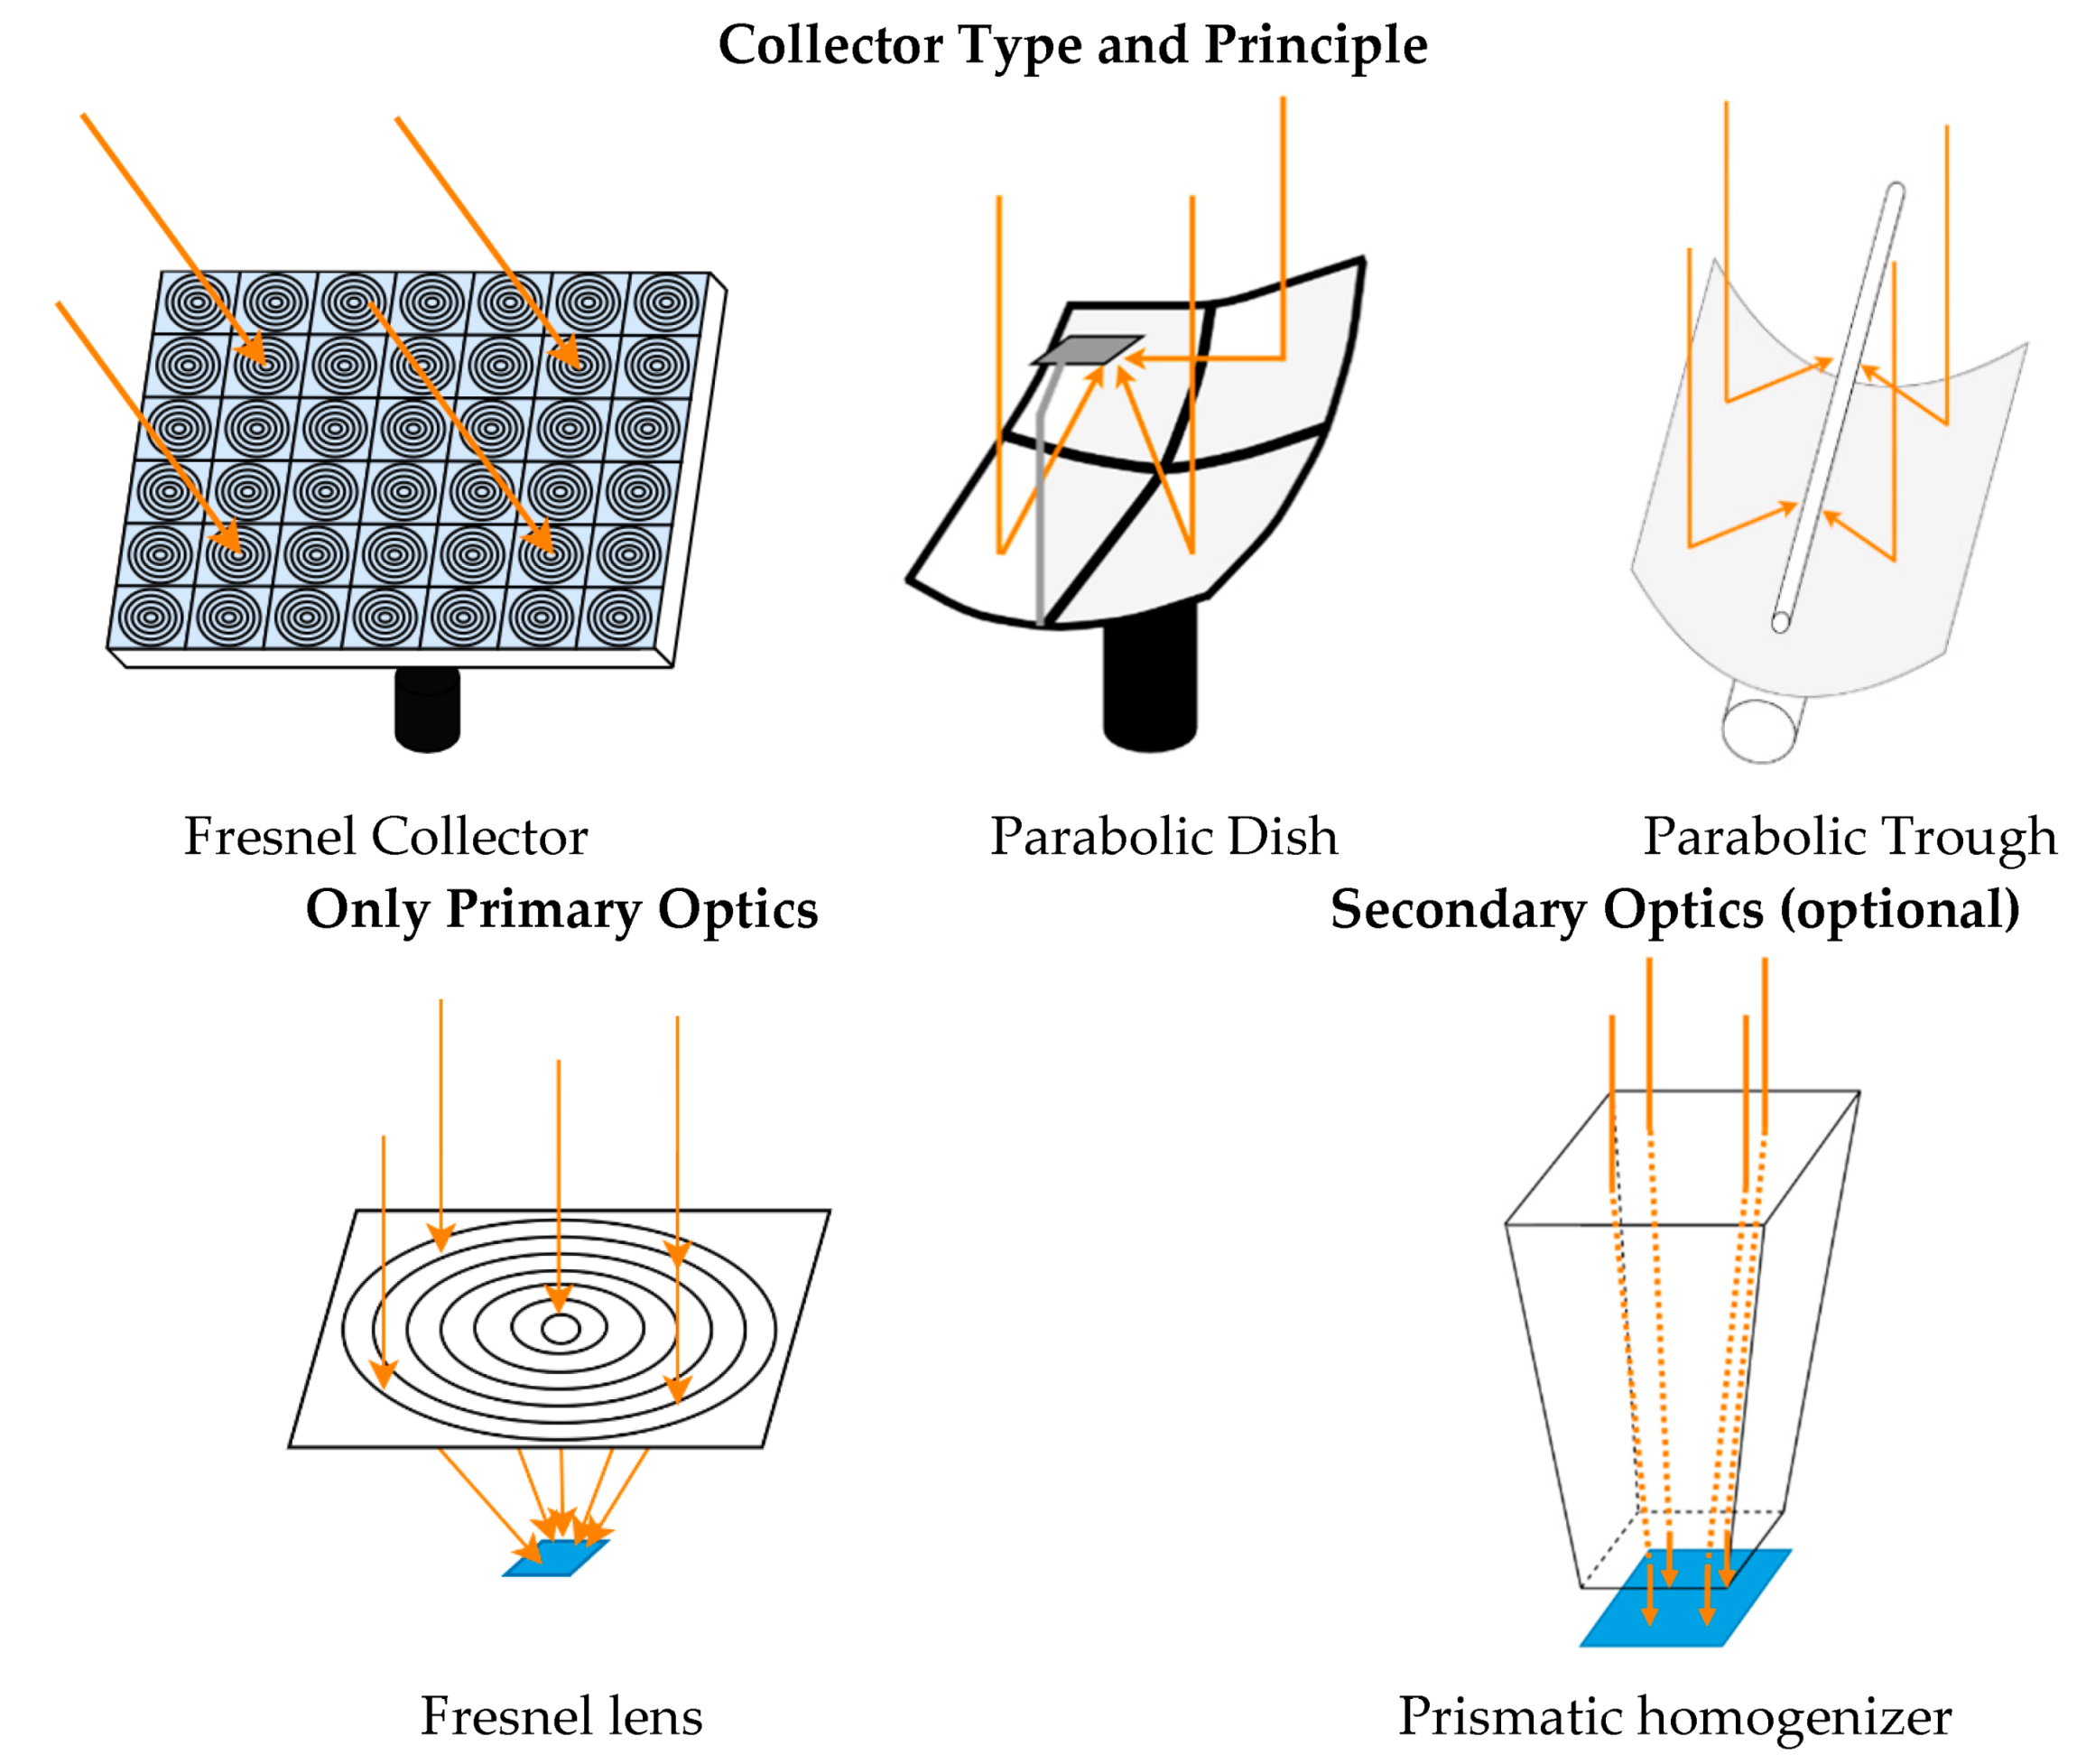
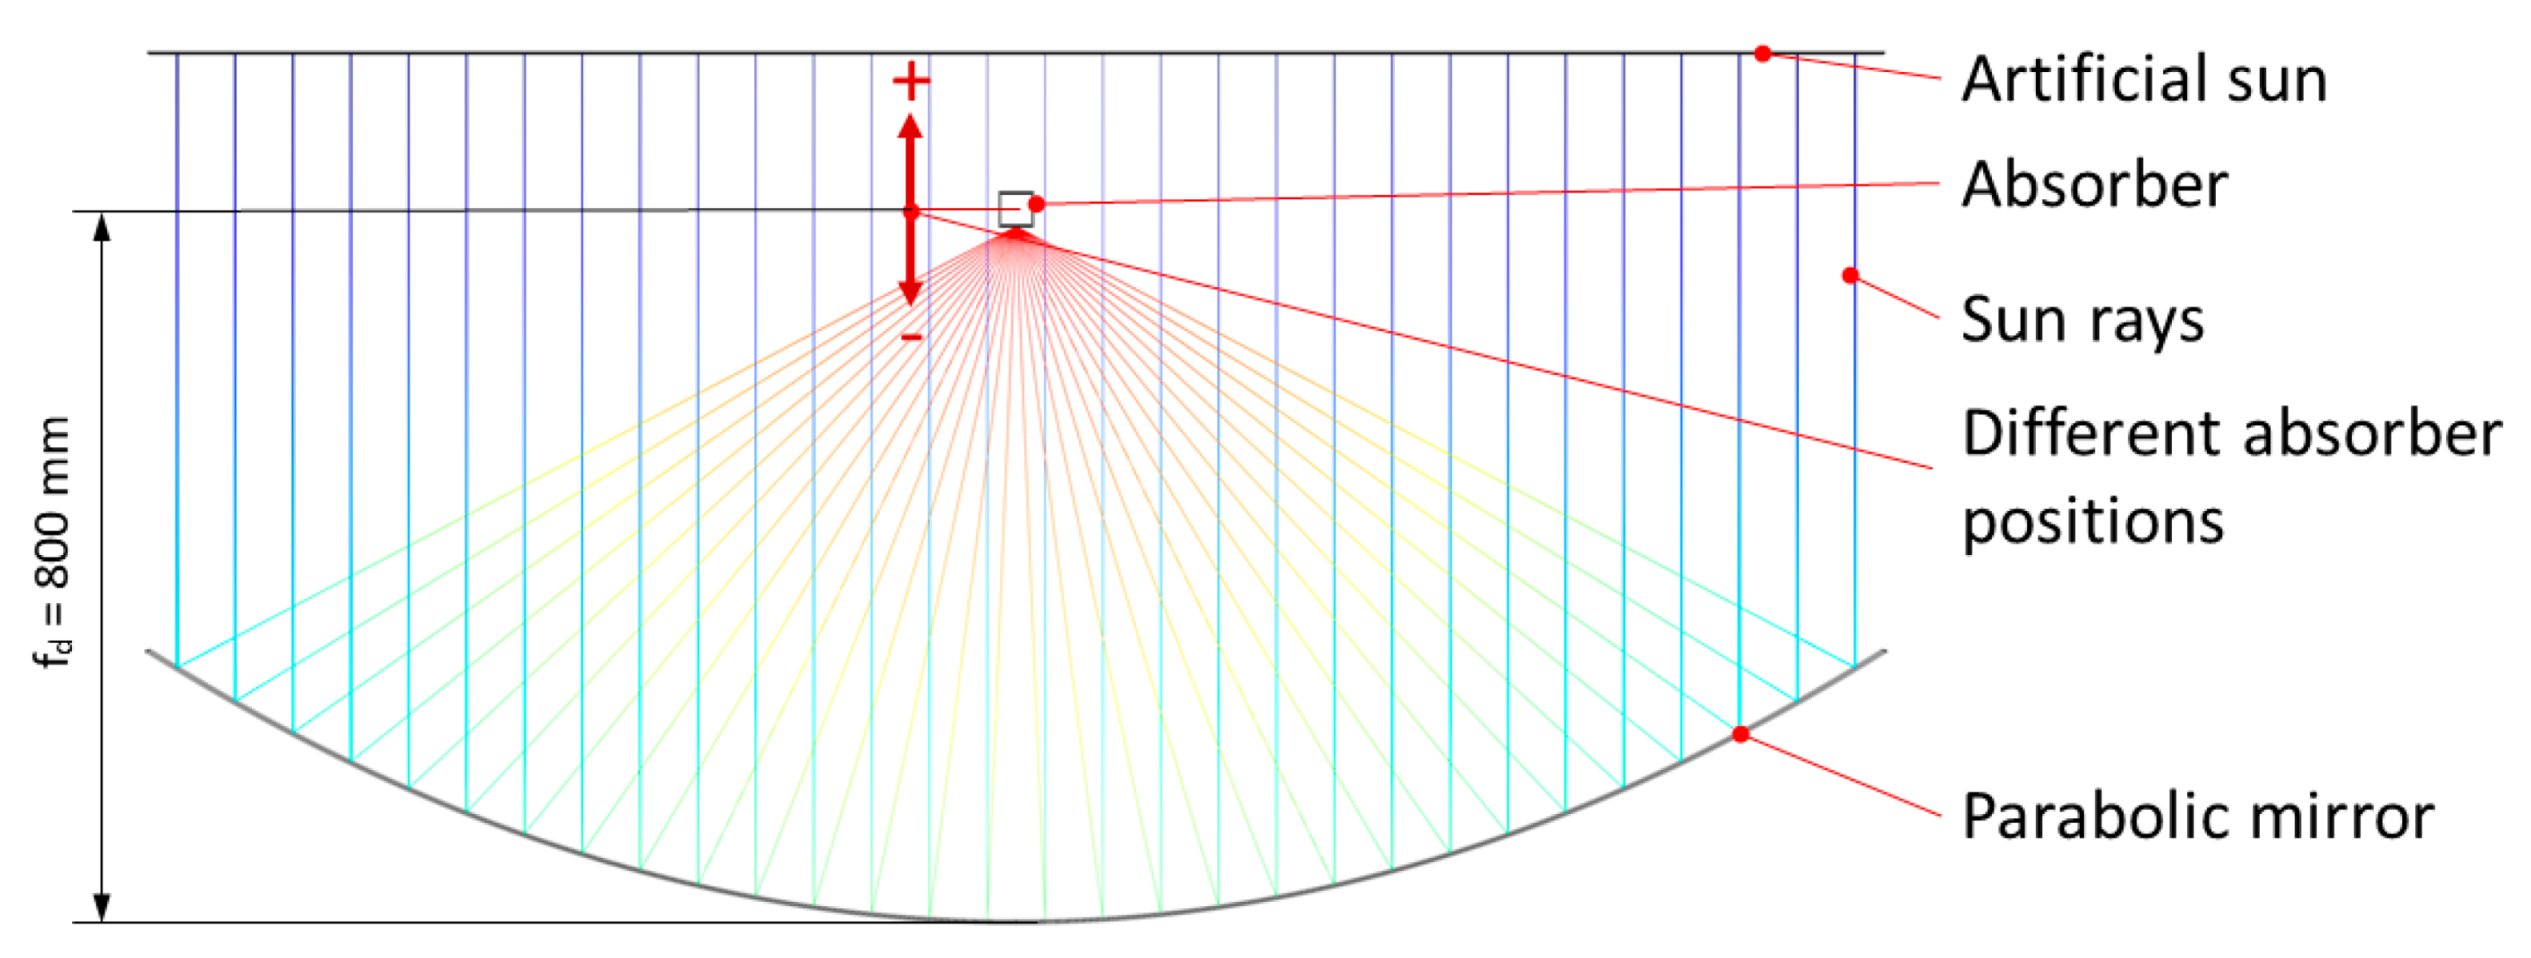
2.2. Optical System Requirements
2.3. Mechanical and Tracking Requirements
- Manufacturing tolerances of the support structure affect mirror accuracy (in this case, fidelity of the parabolic shape).
- Structural soundness/stiffness affects optical accuracy during wind loads and gravity sag.
- The gear ratio of tracking system/actuators affects the mechanical “resolution”, meaning how precise the sun can be tracked.
- Cell size and sensitivity to partial shading.
- Accuracy of tracking system.
- Stiffness of the construction.
- Manufacturing and assembly tolerances.
2.4. Heat Rejection and Thermal System
- Maintaining cell operating temperature within permissible limits.
- Maximum heat yield and max. temperature level of heat transfer fluid.
- (a)
- To successively increase the concentration factor and ensure the heat rejection system works properly.
- (b)
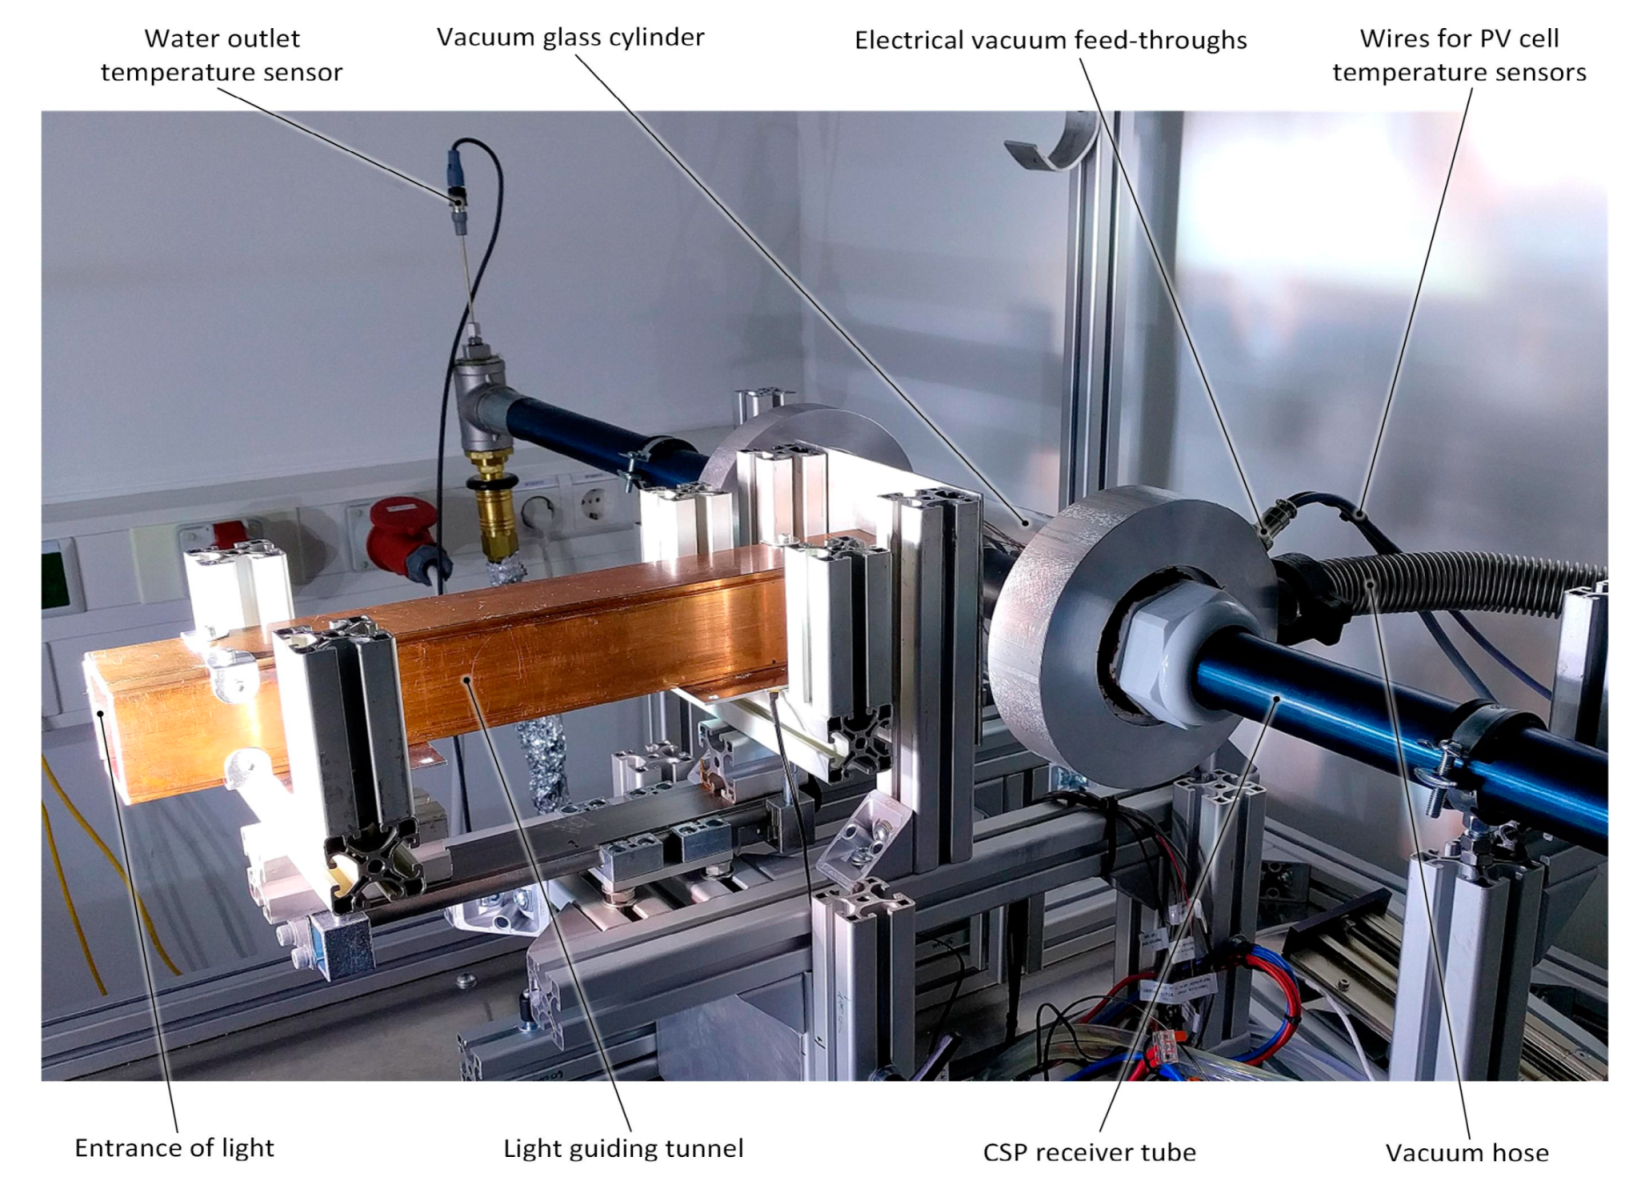
- To validate FEM simulations of the heat rejection system by applying irradiance in reproducible laboratory conditions.
- (c)
- To validate the functionality of the measurement system (several temperature sensors on the CPV-cell board and in the hydraulic circuit) before field installation.
3. Measurement Results and Discussion
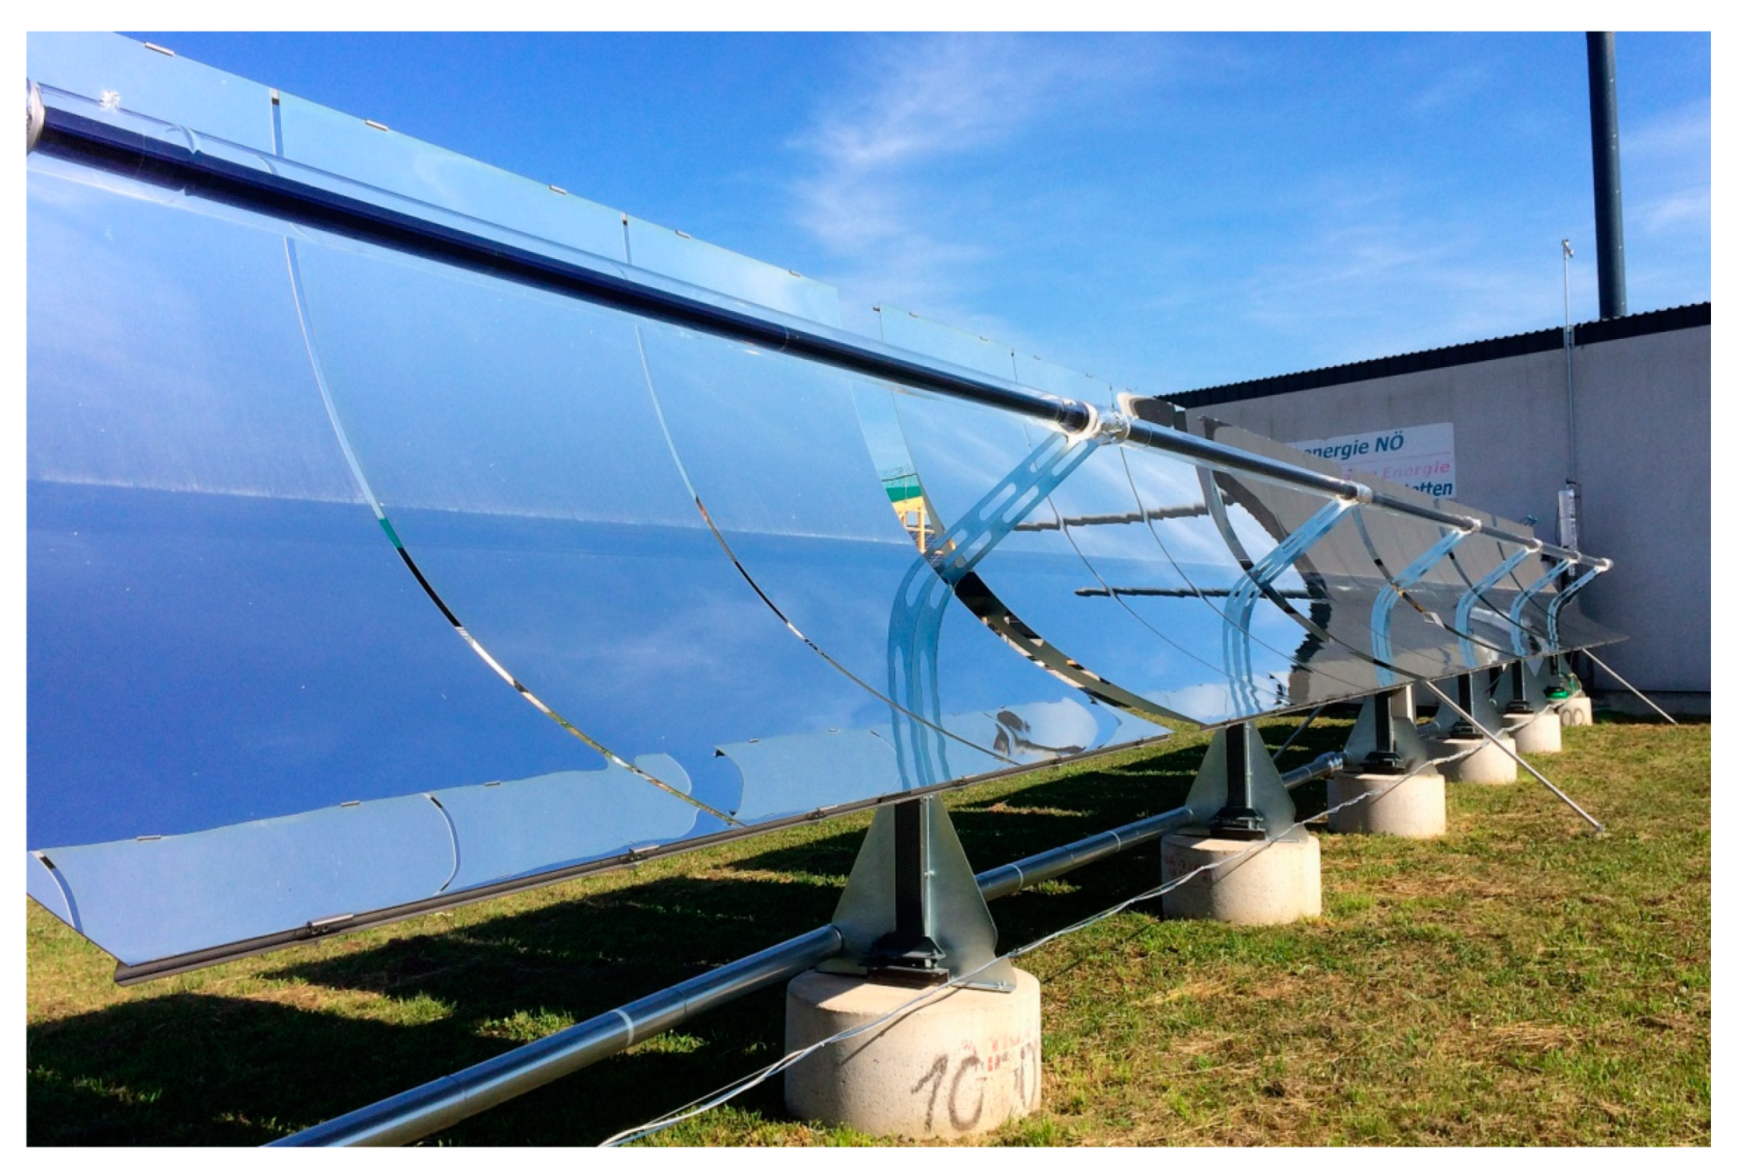
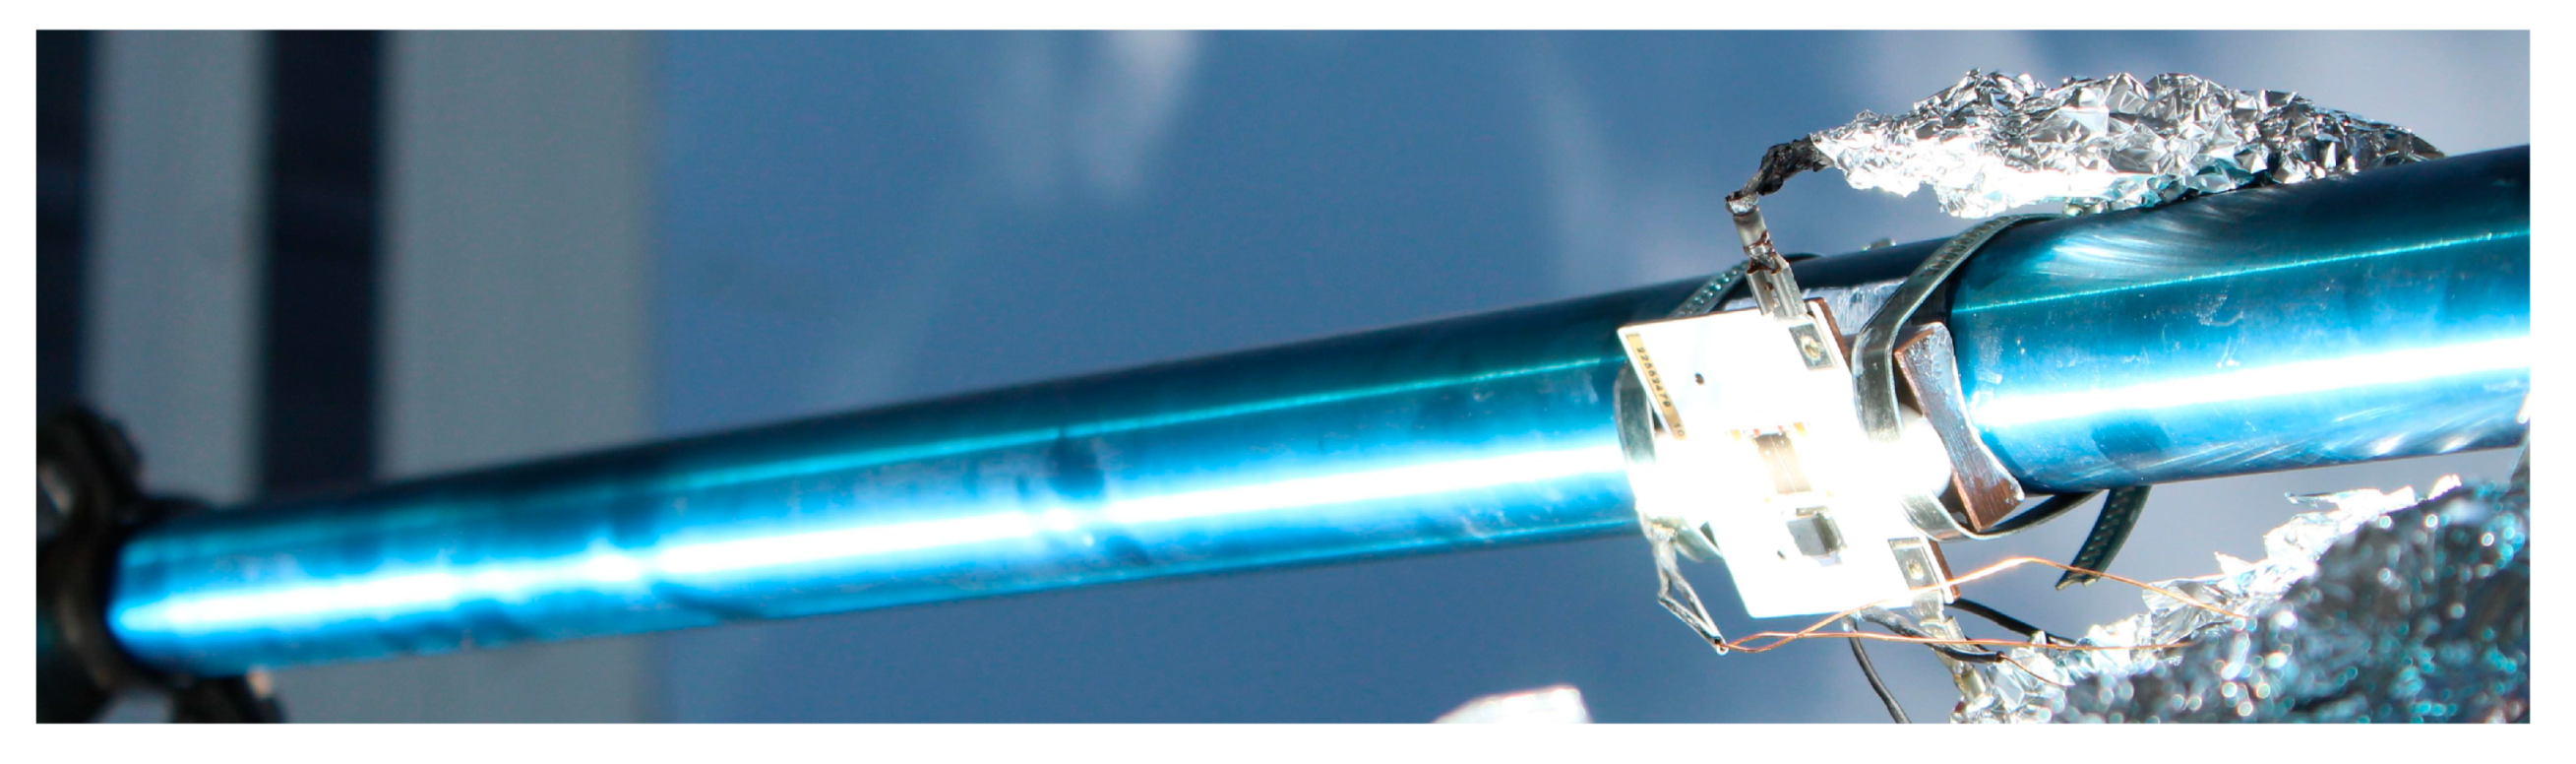
3.1. Test Setup
- Irradiance: The global horizontal irradiance (GHI, 10 min average) and air temperature was measured by a nearby (2.5 km) national monitoring station (ZAMG) [37]. In the following measurements, the DNI (direct normal irradiance, which is commonly used in these applications) is calculated from the GHI, assuming that 89% of the GHI corresponds to the DNI (same as in the standardized AM 1.5 spectrum) [31].
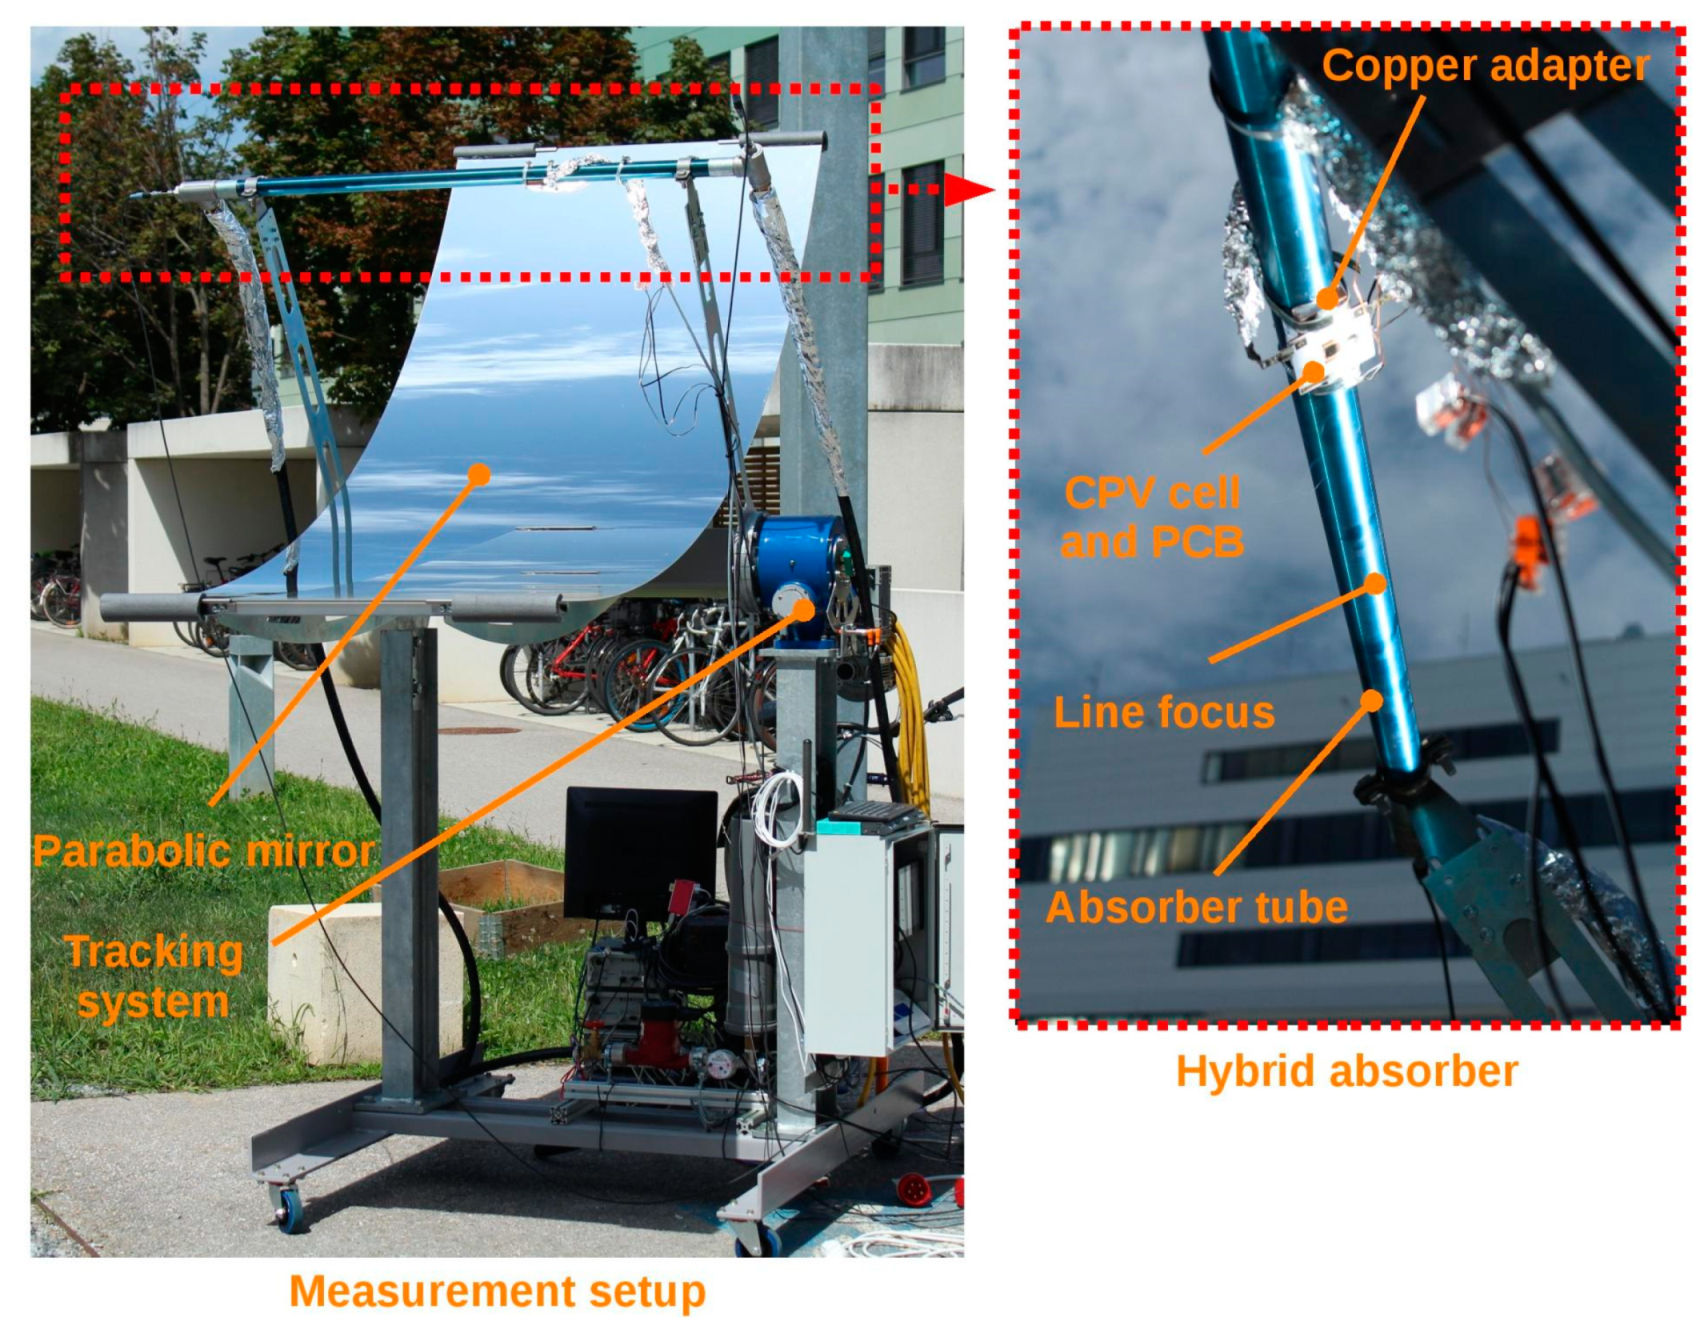
- Tracking: The parabolic mirror was manually directed towards the sun. The focus of the collector was chosen so that it was aligned as precisely as possible to the solar cell. The movement of the sun, only allowed measurement periods of several minutes.
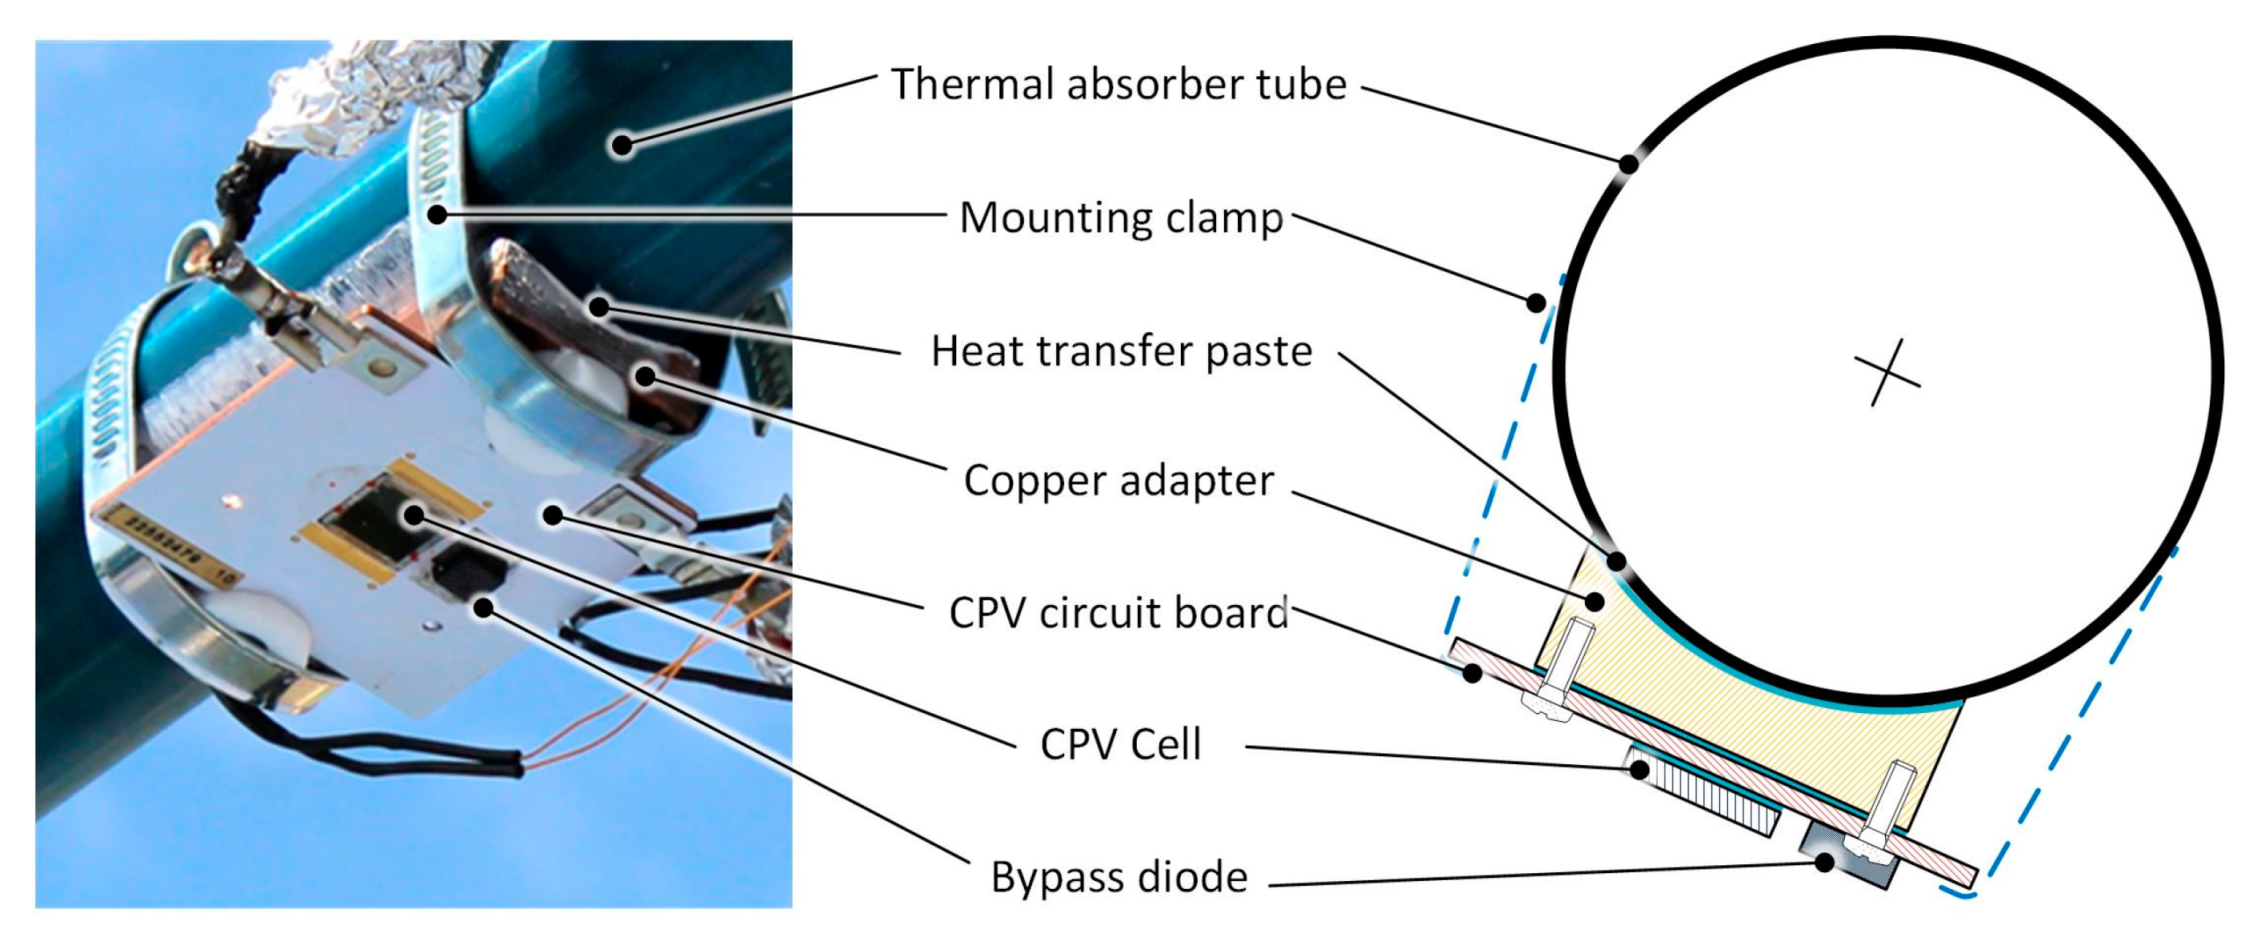
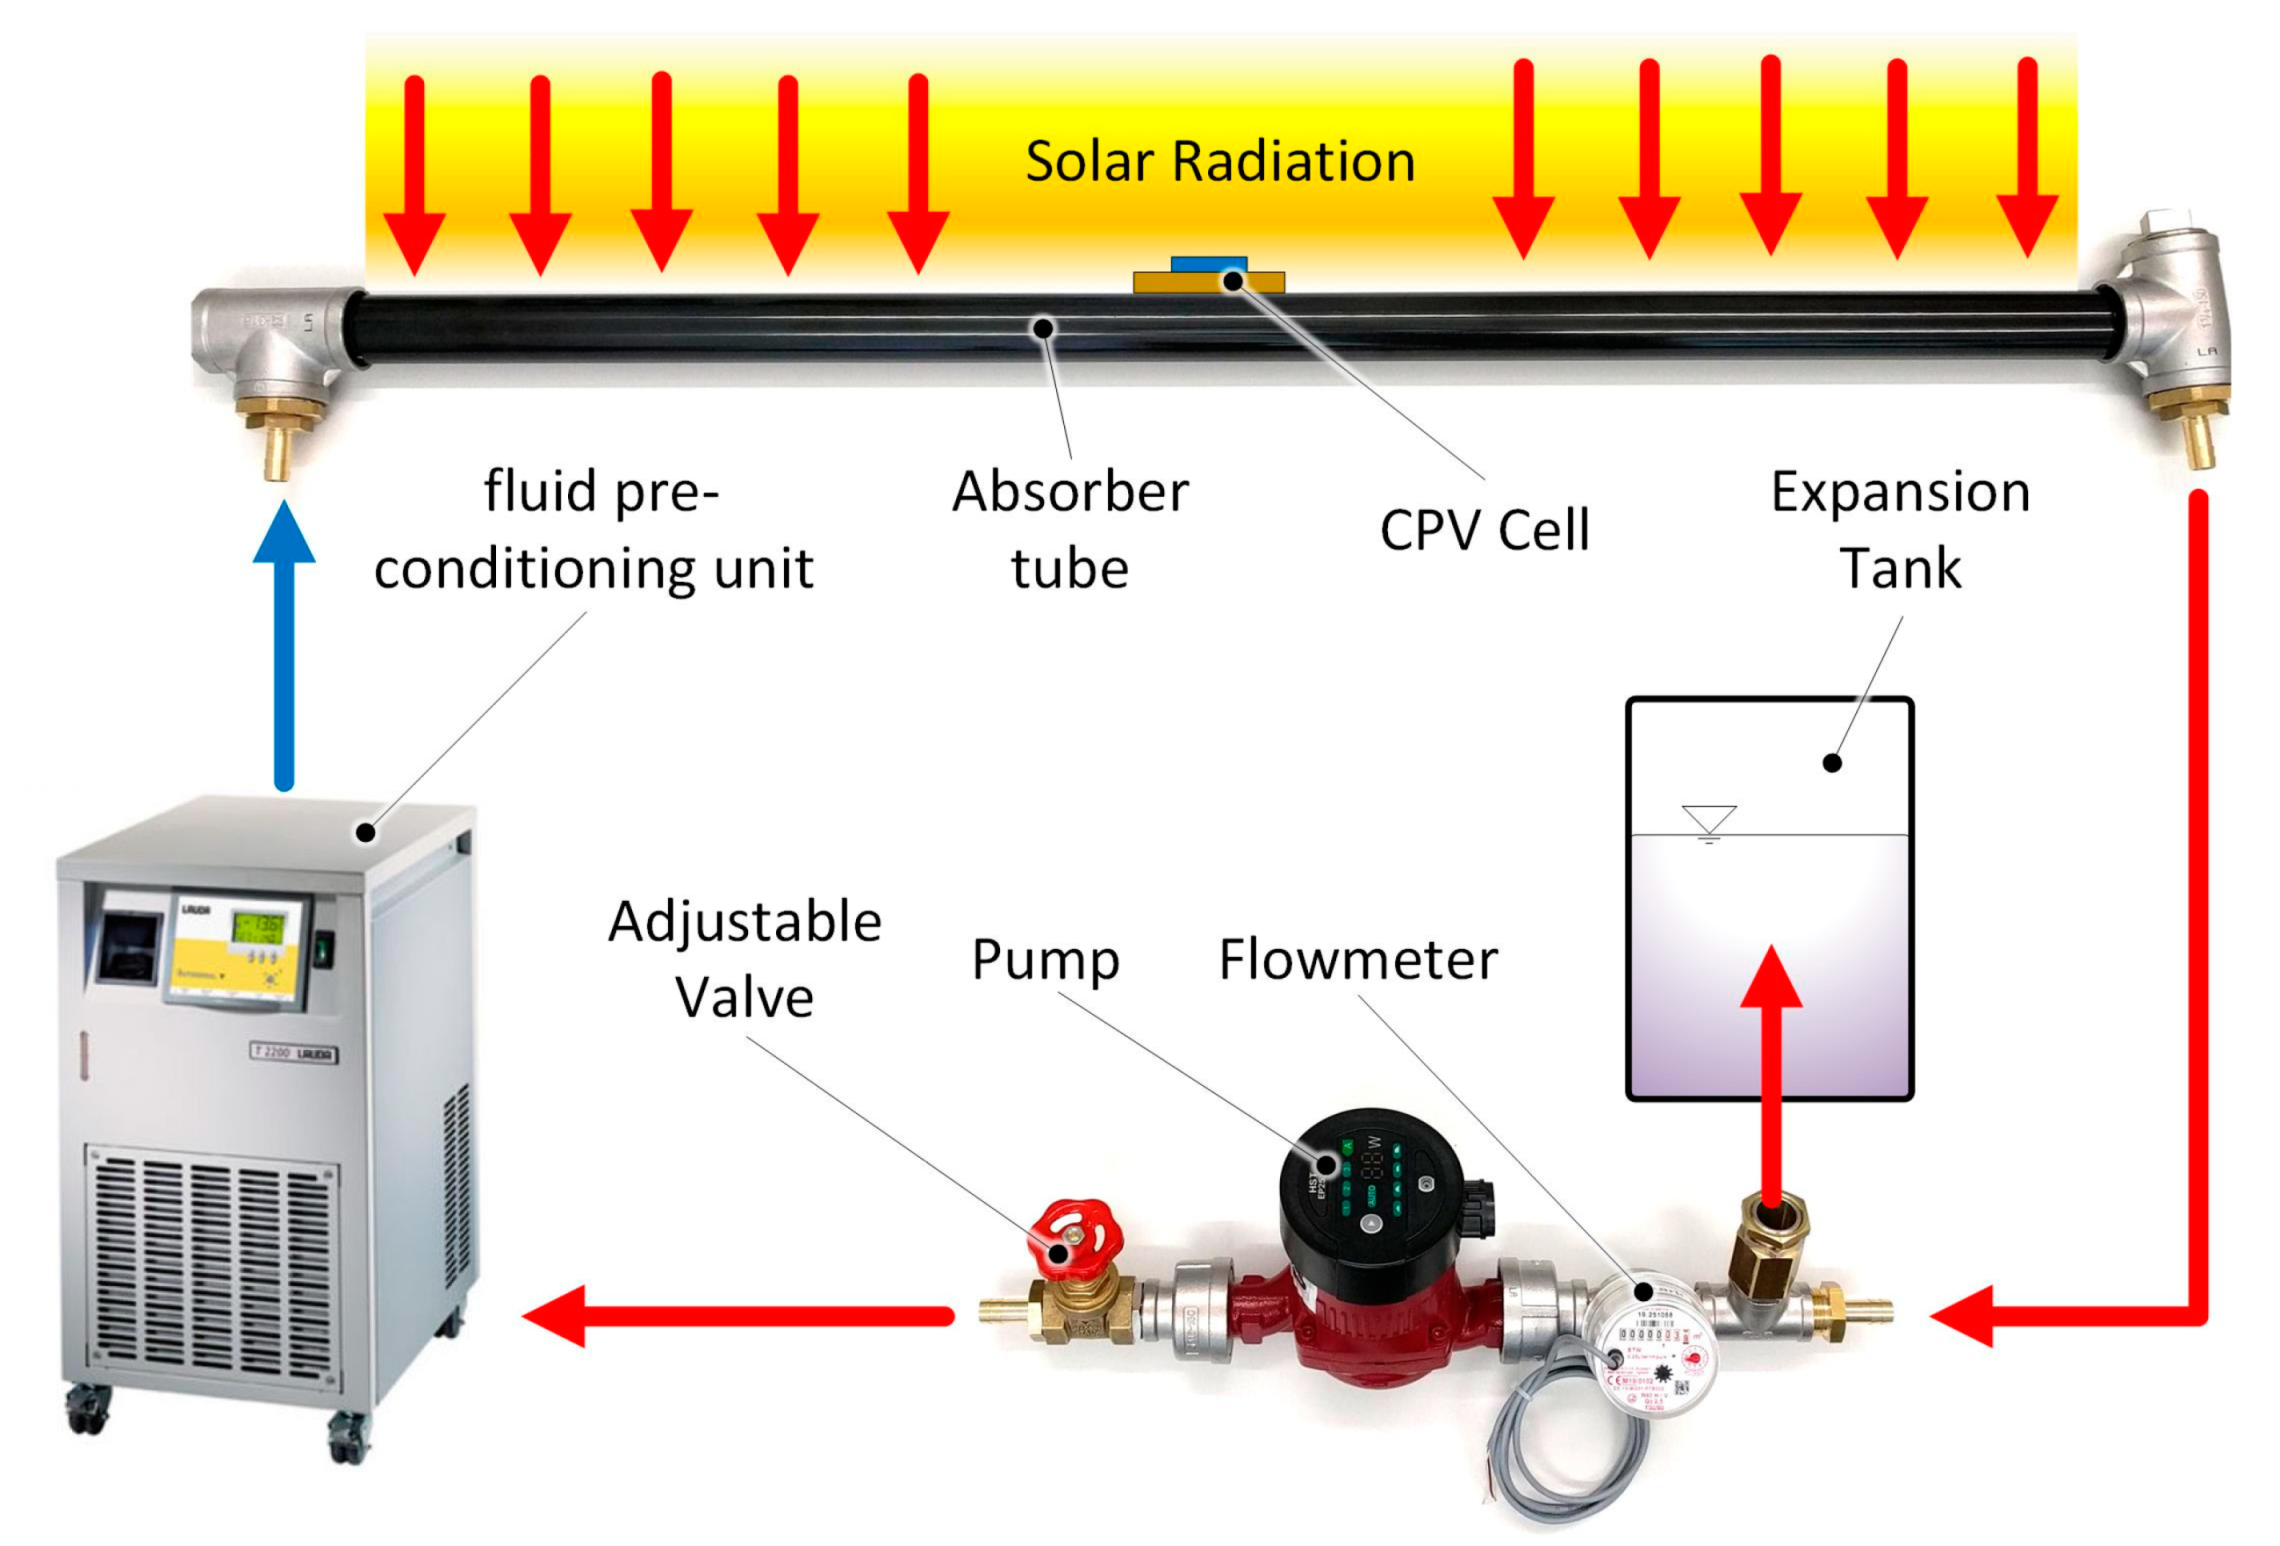
- Temperatures: Two calibrated PT100 temperature sensors were used to measure the water/glycol (HTF) temperature at the inlet and outlet of the absorber tube. Additional NTC temperature sensors were used to measure the temperatures at the solar cell and the absorber tube (see Figure 15). All temperature sensors were recorded via a Rigol M300 digital multimeter. A common domestic hot water flow meter was used to determine the flow of water. A Lauda T2200 was used as a cooling and water conditioning unit. The thermal power can be calculated from the flow rate of the heat transfer fluid and the temperature difference (4190 J/(kg K) was used as specific heat capacity).
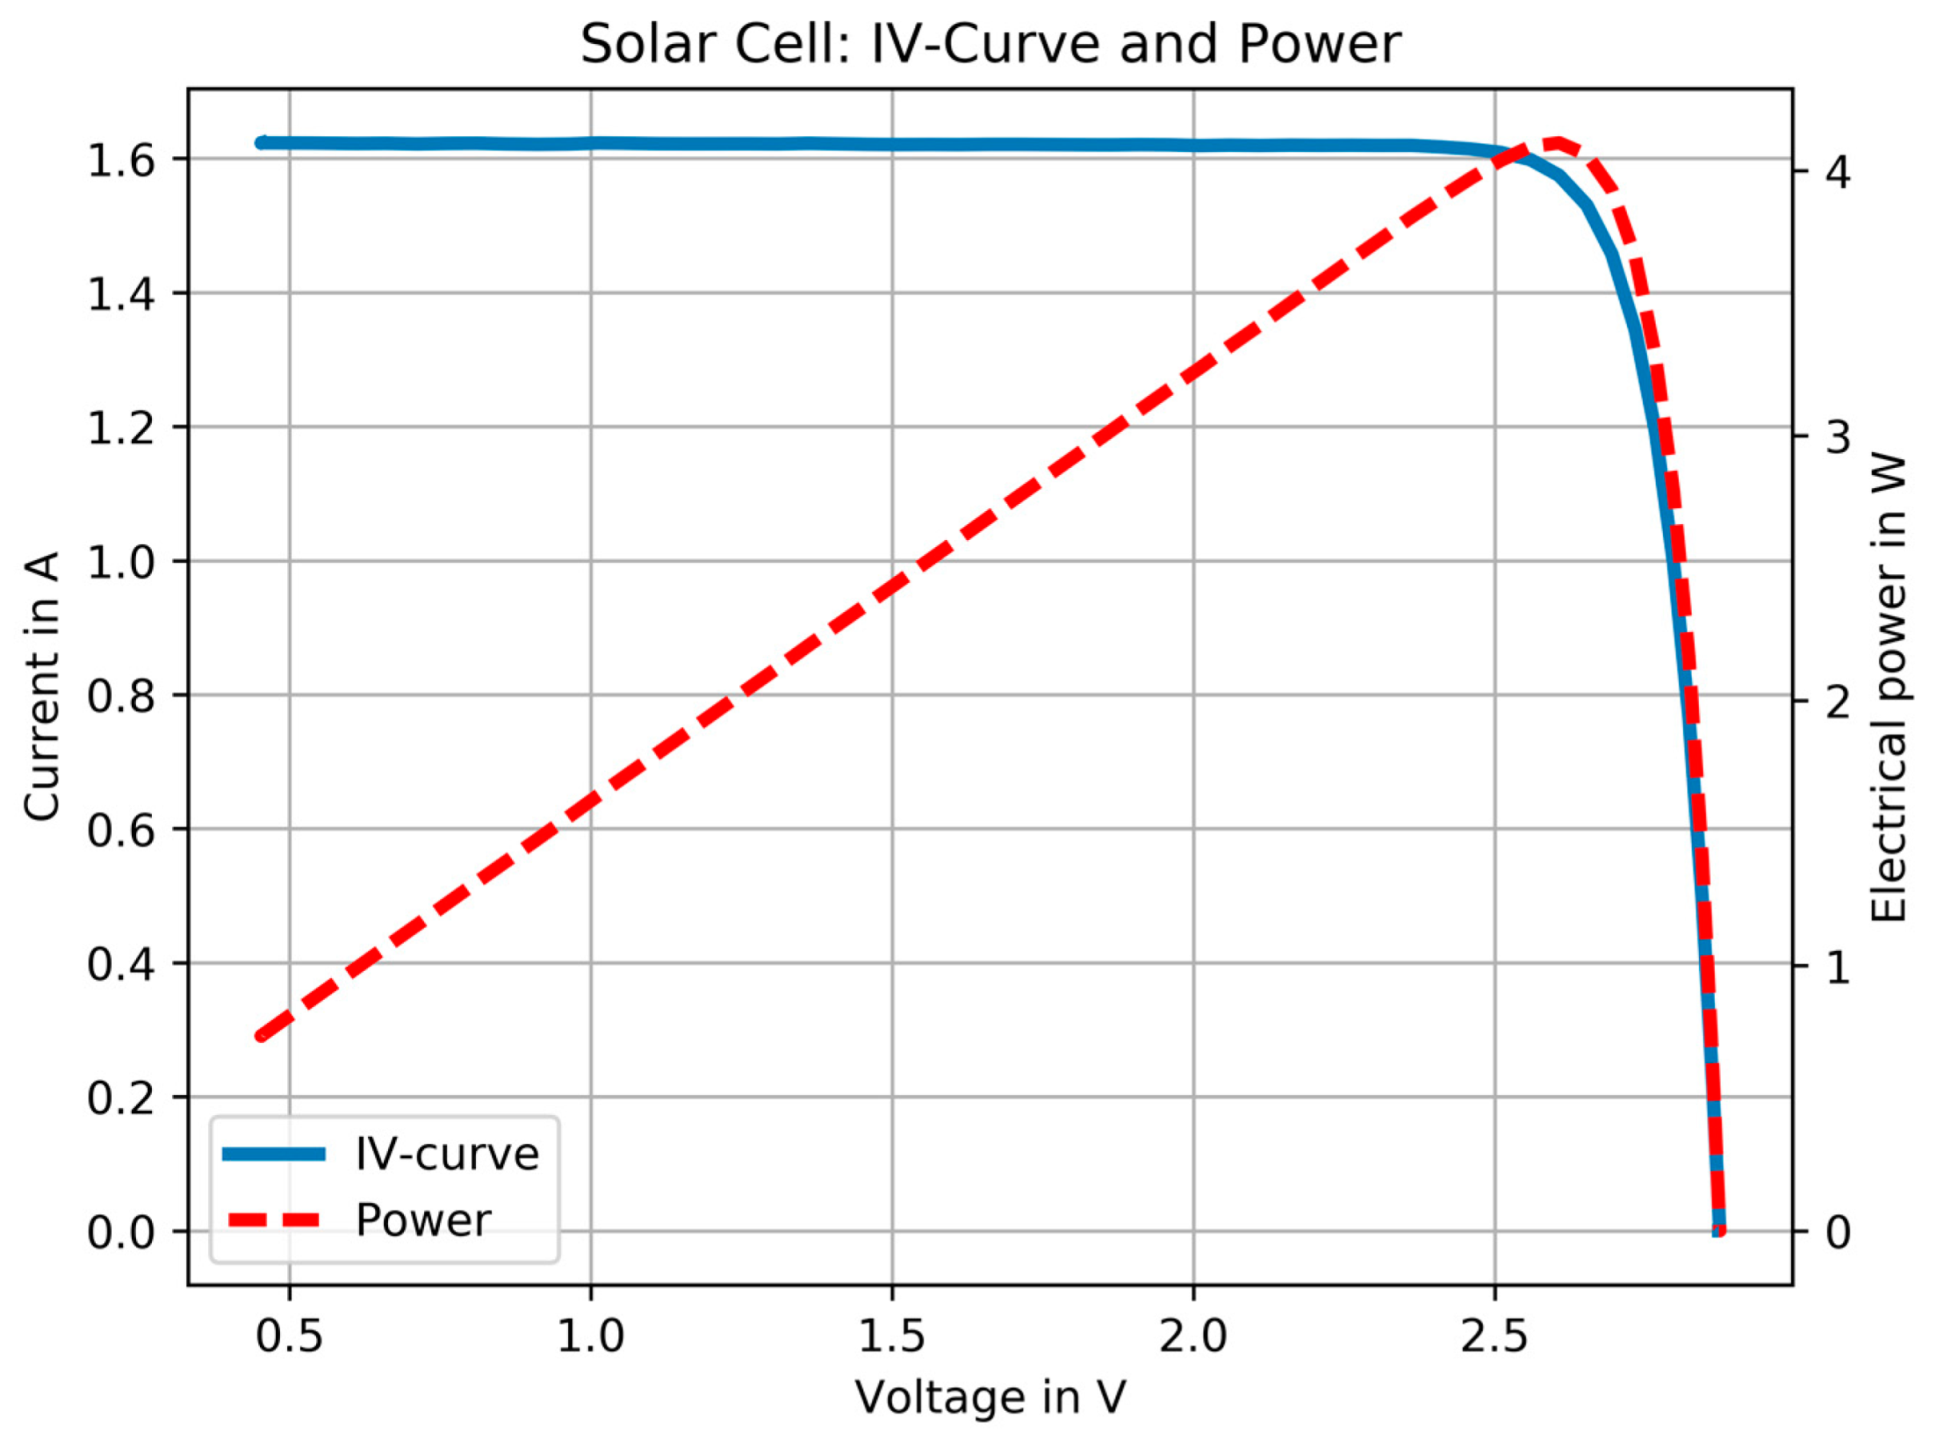
- Electric Power: The solar cell was measured mainly according to the 4-wire method (a small 2-wire section was compensated afterwards). The cell was connected to an electrical load (RND 320 KEl103). Current and voltage were each measured with a multimeter (Rigol DM3058E). To determine the maximum power point (MPP), the IV-curve of the solar cell was measured automatically using a script running on a “Raspberry Pi” (note that this increases the overall cell temperature since the MPP was not always adjusted).
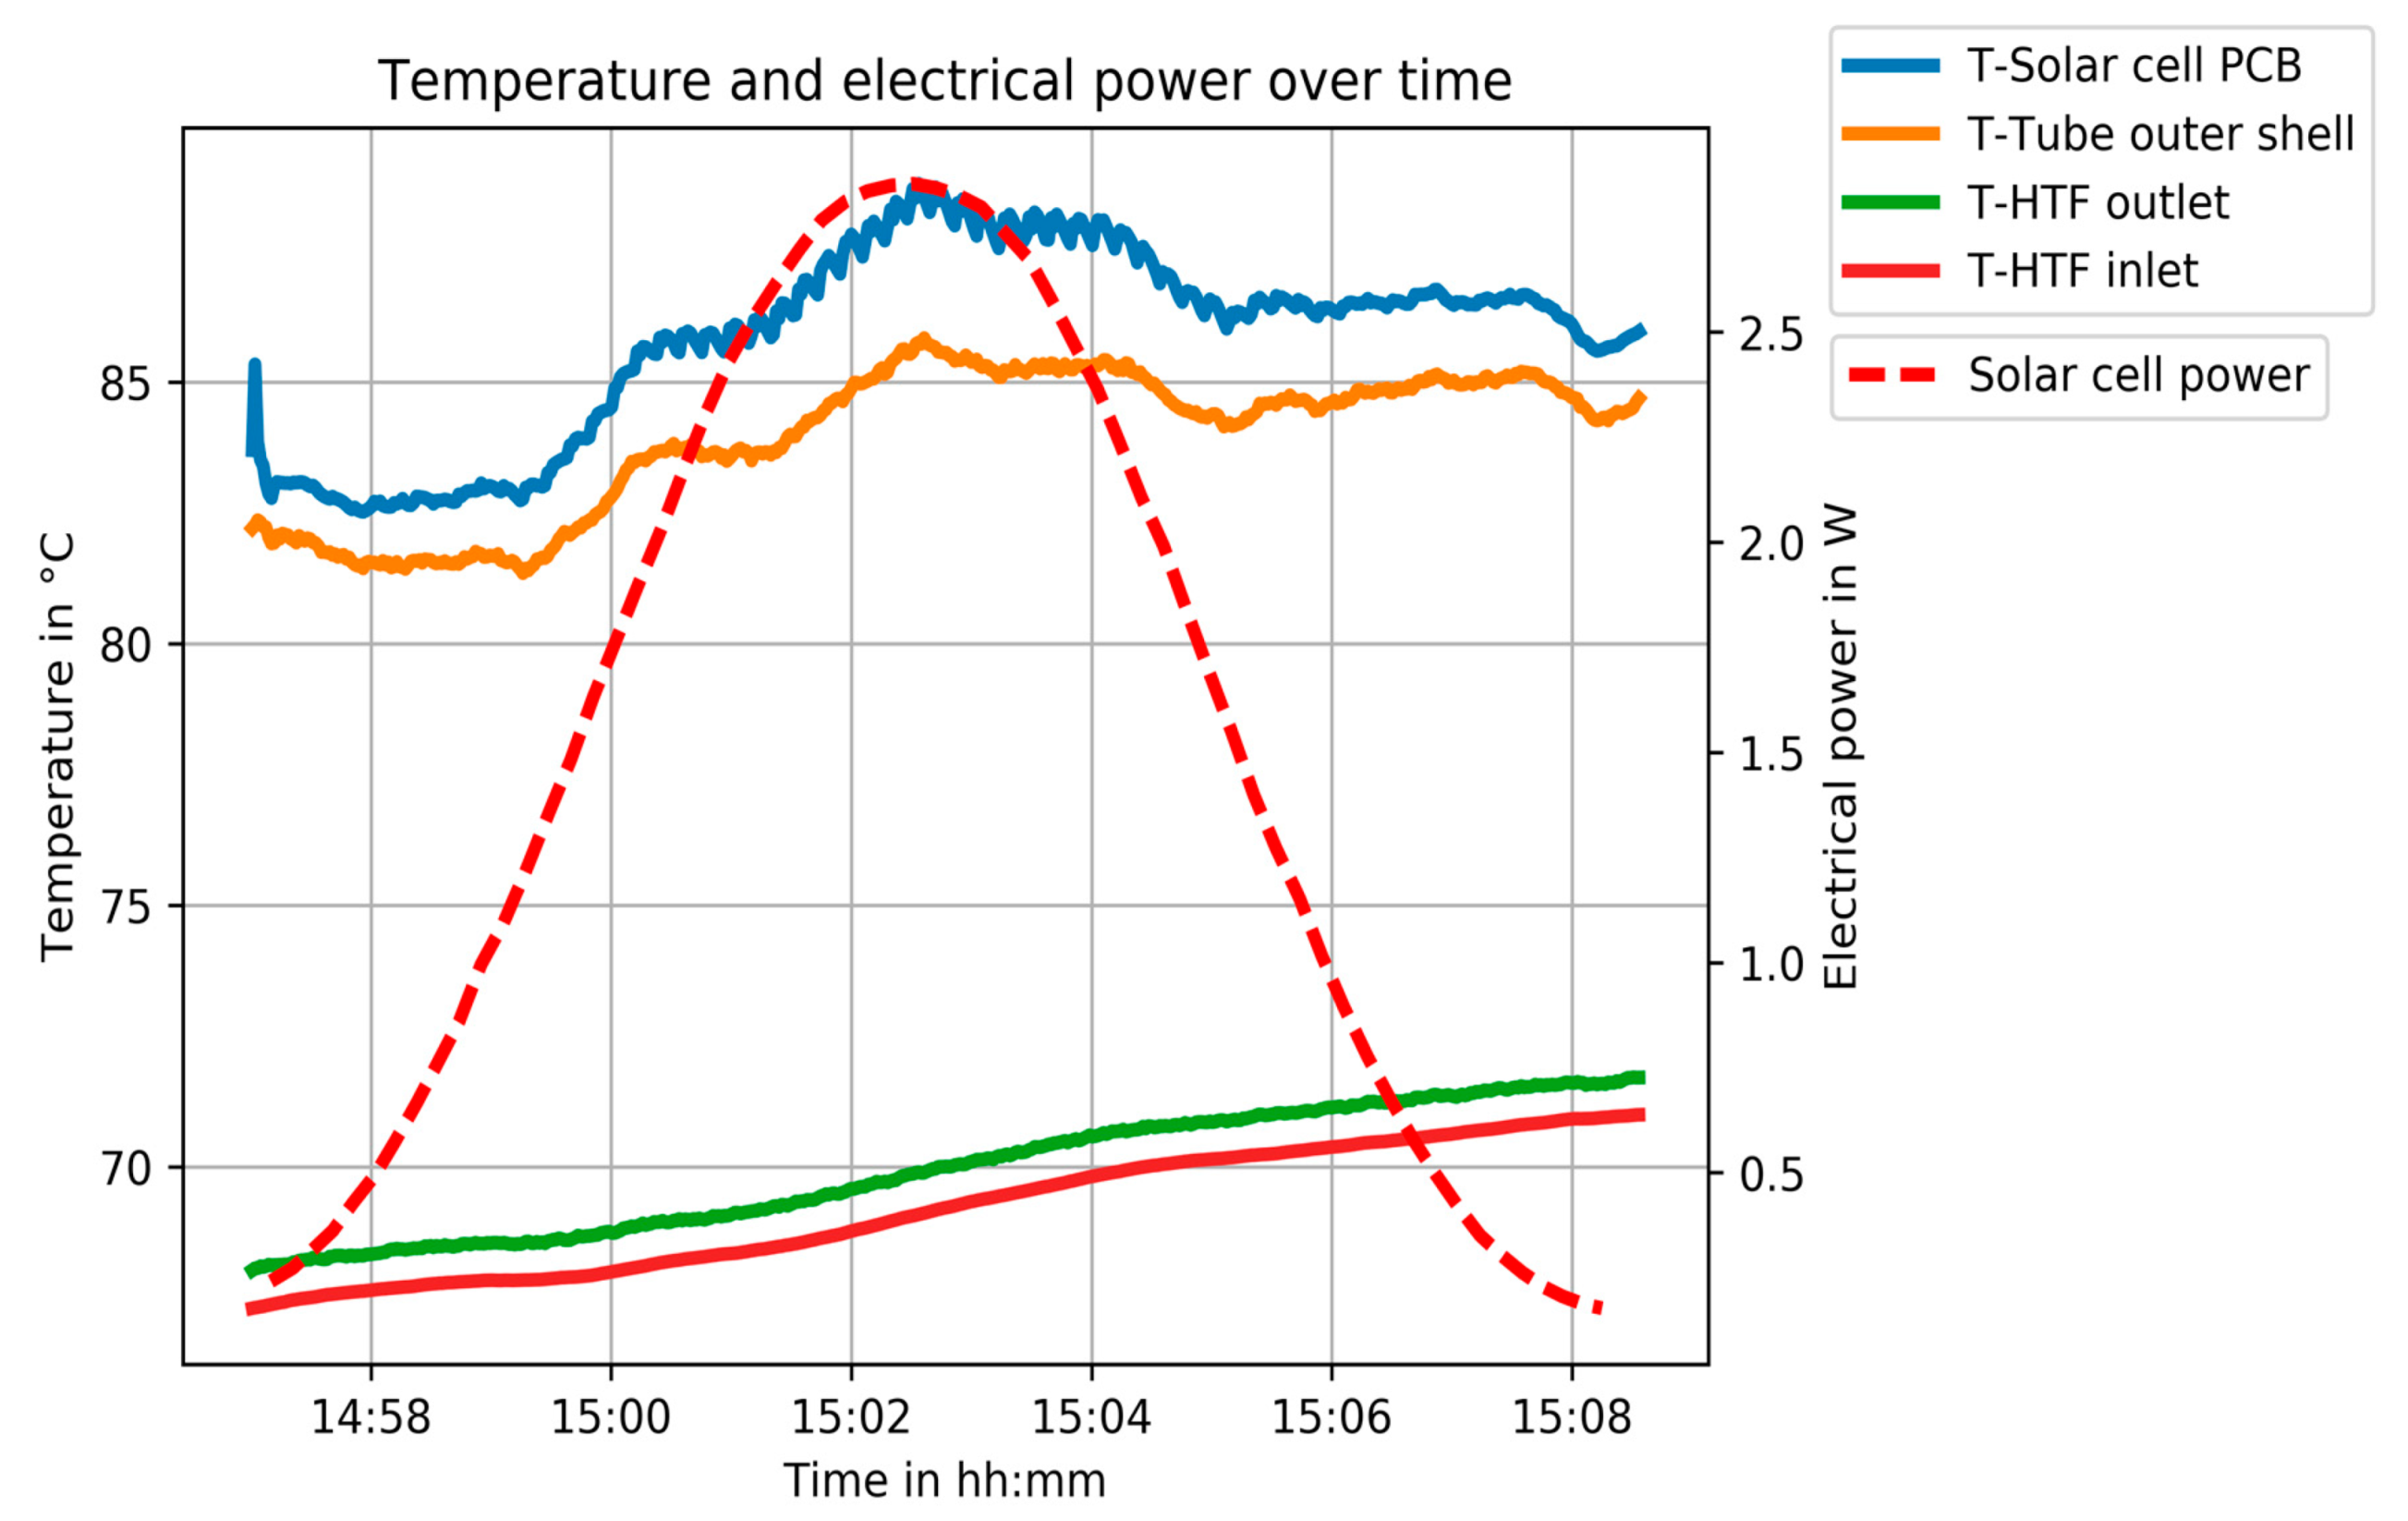
3.2. Measurements as the Line Focus Passes over the Solar Cell
- Global Horizontal Irradiance in W/m².
- Direct Normal Irradiance in W/m².
- width of the cell in m.
- span width of the parabolic mirror in m.
- Conversion factor between GHI to DNI: 89%.
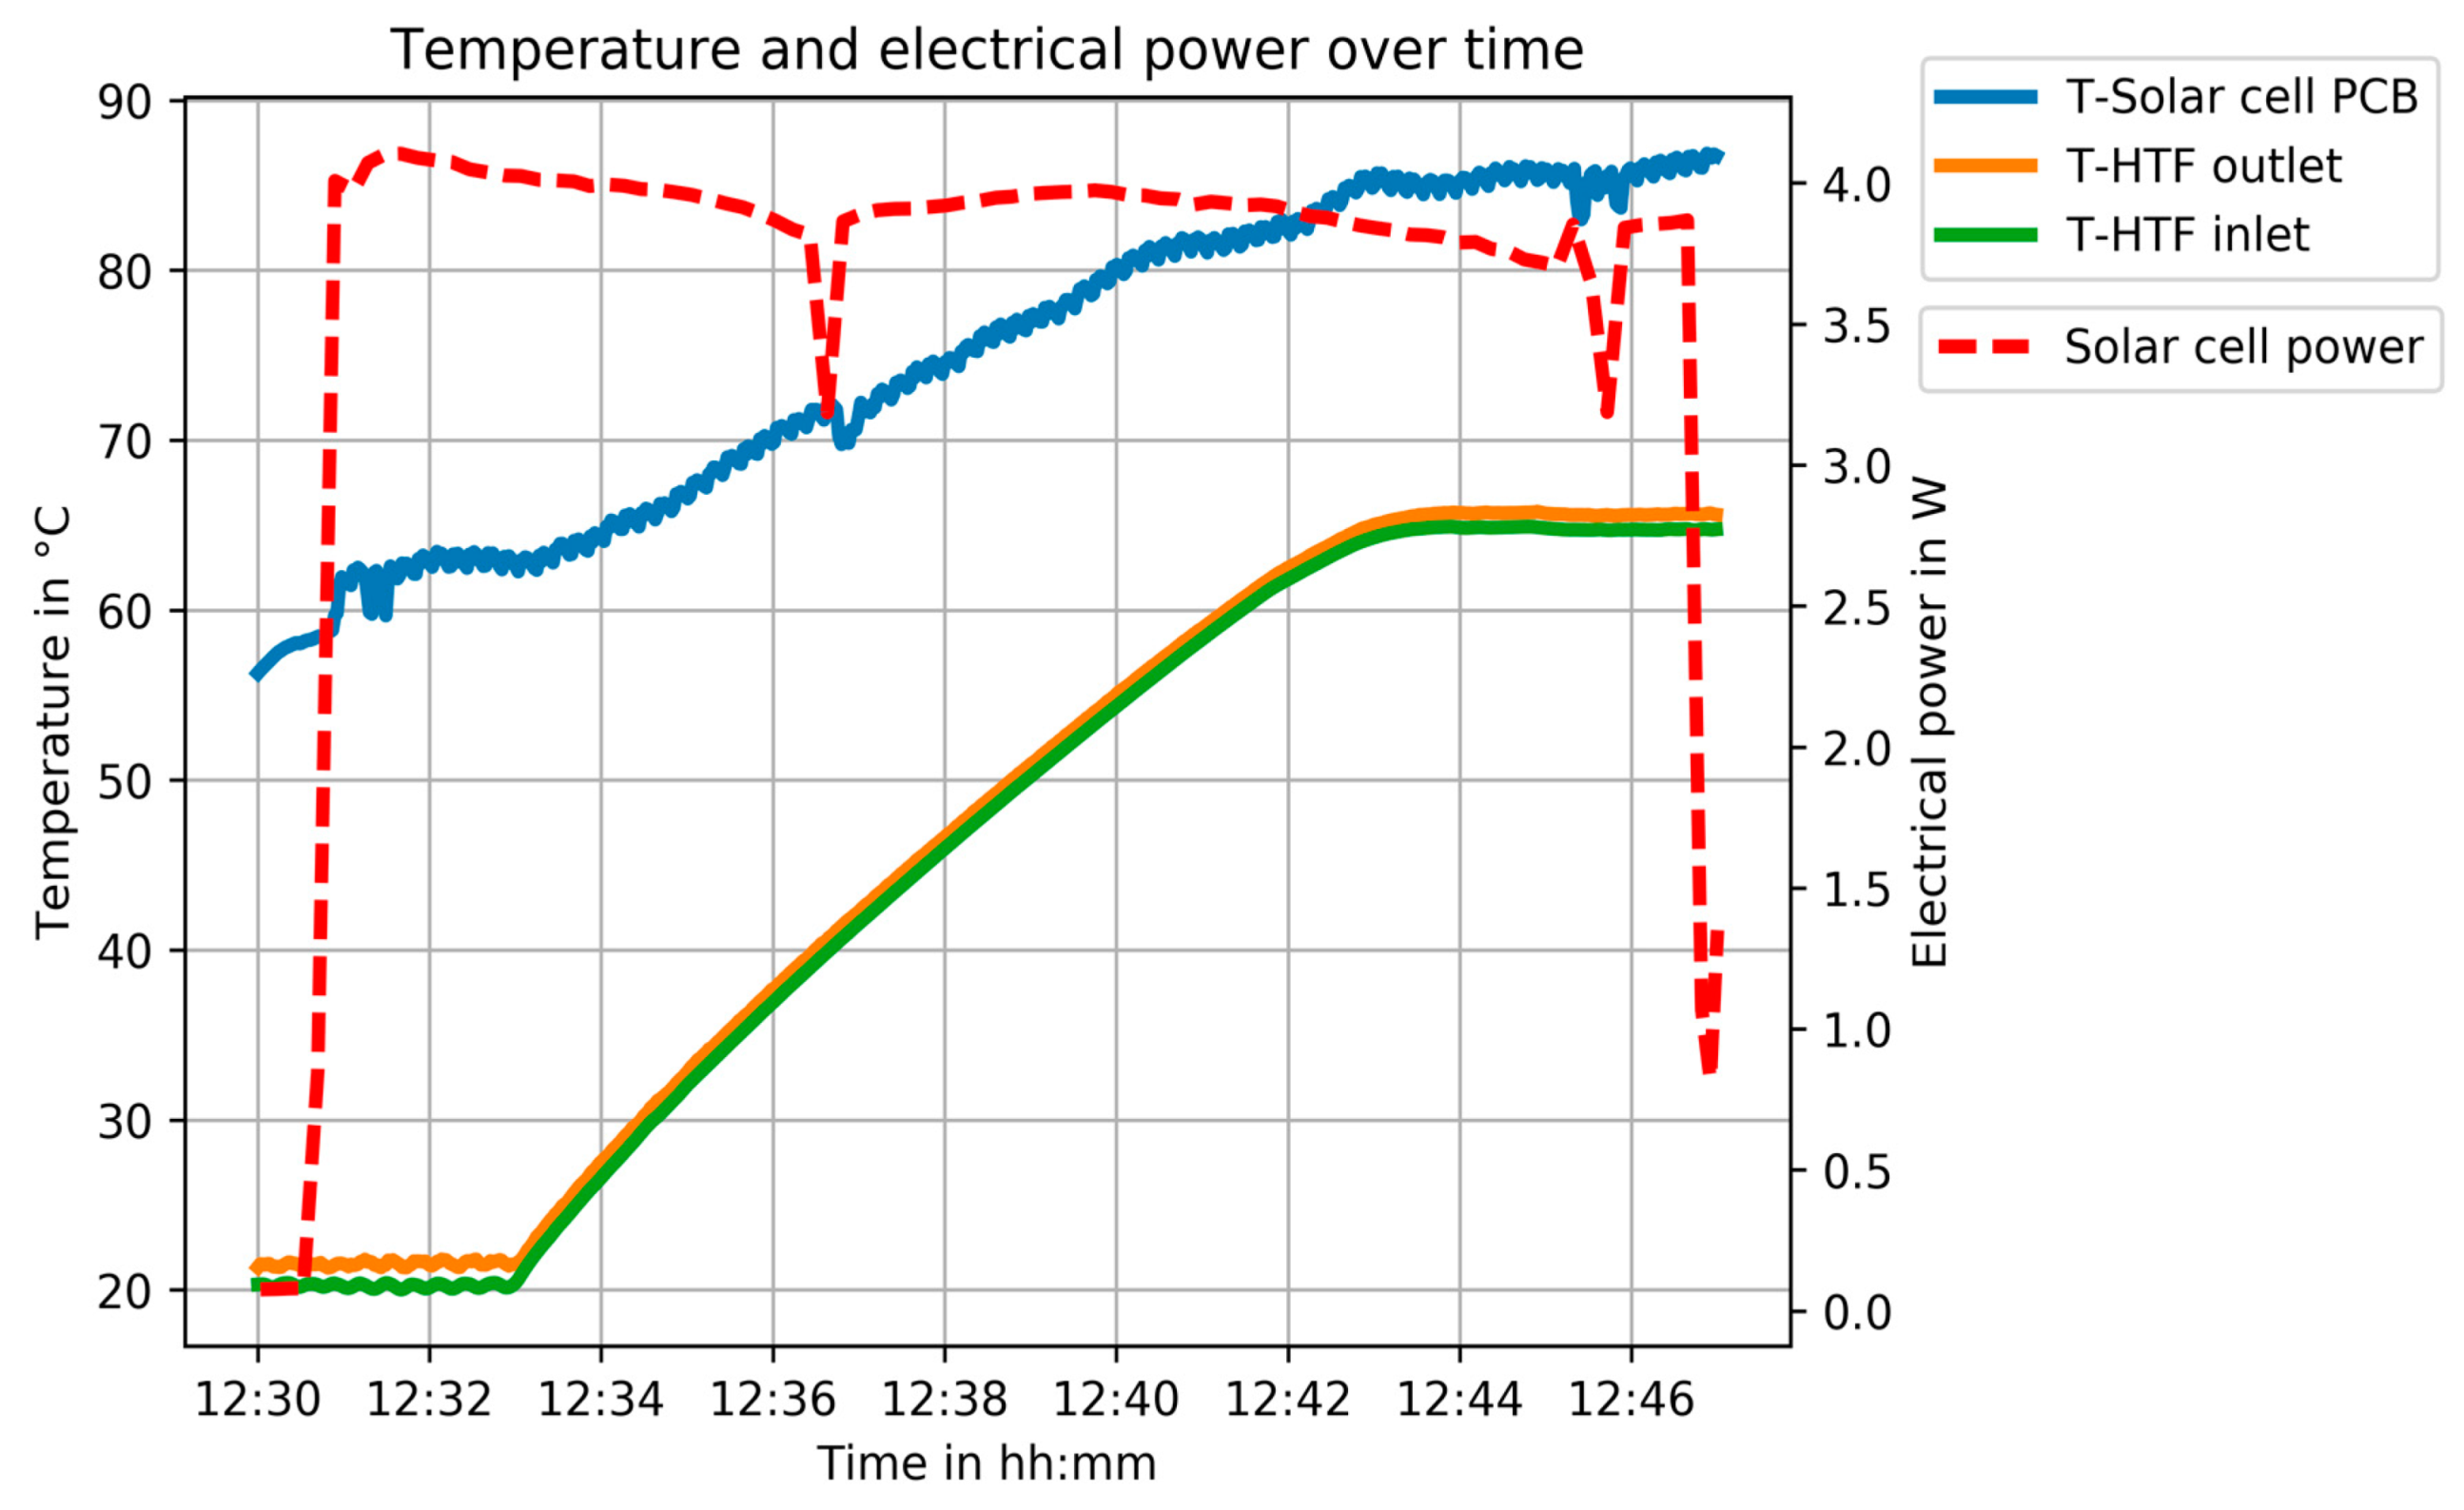
3.3. Effect of the Heat Transfer Fluid Temperature on Cell Efficiency
4. Conclusions and Outlook
Author Contributions
Funding
Conflicts of Interest
References
- International Energy Agency. Solar PV—Tracking Clean Energy Progress. 14 December 2018. Available online: https://www.iea.org/tcep/power/renewables/solar/ (accessed on 15 February 2019).
- Trieb, F.; Schillings, C.; O’Sullivan, M.; Pregger, T.; Hoyer-Klick, C. Global potential of concentrating solar power. In Proceedings of the SolarPaces Conference, Berlin, Germany, 15–18 September 2009. [Google Scholar]
- Butti, K.; Perlin, J. A Golden Thread: 2500 Years of Solar Architecture and Technology; Cheshire Books: Palo Alto, CA, USA, 1980. [Google Scholar]
- Ho, C.K.; Sims, C.A.; Christian, J.M. Evaluation of glare at the Ivanpah Solar Electric Generating System. Energy Procedia 2015, 69, 1296–1305. [Google Scholar] [CrossRef]
- Pérez-Higueras, P.; Fernández, E.F. High Concentrator Photovoltaics. In Fundamentals, Engineering and Power Plants; Springer: Cham, Switzerland, 2015. [Google Scholar]
- Azur Space Solar Power GmbH. Concentrator Triple Junction Solar Cell (Datasheet). 2016. Available online: http://www.azurspace.com/images/products/0004355-00-01_3C44_AzurDesign_10x10.pdf (accessed on 10 October 2020).
- Wiesenfarth, M.; Philipps, S.P.; Bett, A.W.; Horowitz, K.; Kurtz, S. Current Status of Concentrator Photovoltaik (CPV) Technology; U.S. Department of Energy: Washington, DC, USA, 2017.
- Nreal. Best Research-Cell Efficiency Chart. 2020. Available online: https://www.nrel.gov/pv/assets/pdfs/best-research-cell-efficiencies.20200925.pdf (accessed on 10 October 2020).
- Fraunhofer. Photovoltaics Report. 2020. Available online: https://www.ise.fraunhofer.de/content/dam/ise/de/documents/publications/studies/Photovoltaics-Report.pdf (accessed on 10 October 2020).
- Vannoni, C.; Battisti, R.; Drigo, S. Potential for Solar Heat in Industrial Processes. In IEA SHC Task 33 and SolarPaces Task IV: Solar Heat in Industrial Processes; CIEMAT: Madrid, Spain, 2008. [Google Scholar]
- Palenzuela, P.; Alarcón-Padilla, D.-C.; Zaragoza, G. Concentrating Solar Power and Desalination Plants—Engineering and Economics of Coupling Multi-Effect Distillation and Solar Plants; Springer: Cham, Switzerland, 2015. [Google Scholar]
- Al-Shammiri, M.; Safar, M. Multi-effect distillation plants: State of the art. Desalination 1999, 126, 45–59. [Google Scholar] [CrossRef]
- Mugnier, D.; Jakob, U. Status of solar cooling in the World: Markets and availableproducts. WIREs Energy Environ. 2015, 4, 229–234. [Google Scholar] [CrossRef]
- Weiss, W.; Spörk-Dür, M. Solar Heat Worldwide; Institute for Sustainable Technologies: Gleisdorf, Austria, 2018. [Google Scholar]
- Allouhi, A.; Fouih, Y.E.; Kousksou, T.; Jamil, A.; Zeraouli, Y.; Mourad, Y. Energy consumption and efficiency in buildings: Current status and future trends. J. Clean. Prod. 2015, 109, 118–130. [Google Scholar] [CrossRef]
- Thür, A.; Calabrese, T.; Streicher, W. Smart grid and PV driven ground heat pump as thermal battery in small buildings for optimized electricity consumption. Solar Energy 2018, 174, 273–285. [Google Scholar] [CrossRef]
- Selke, T.; Schlager, T.; Rennhofer, M.; Heinz, A.; Brandl, D.; Mach, T. Multifunctional Facade with PV for Solar Autonomous Cooling Applications. In Proceedings of the ISES Solar World Congress 2017 with IEA SHC International Conference on Solar Heating and Cooling for Buildings and Industry, Abu Dhabi, UAE, 29 October–2 November 2018. [Google Scholar]
- Euroheat & Power. Ecoheatcool: European Heating and Cooling Market Study. 2006. Available online: https://www.euroheat.org/our-projects/ecoheatcool-european-heating-cooling-market-study/ (accessed on 10 October 2020).
- Omar, M.; Sharaf, Z. Concentrated photovoltaic thermal (CPVT) solar collectorsystems: Part I—Fundamentals, design considerations and current technologie. Renew. Sustain. Energy Rev. 2015, 50, 1500–1565. [Google Scholar]
- Gibart, C. Study of and tests on a hybrid photovoltaic-thermal collector using concentrated sunlight. Solar Cells 1981, 4, 71–79. [Google Scholar] [CrossRef]
- Buffet, B.P. Hybrid thermal and photovoltaic concentration collector. In Proceedings of the EC Contractors’ Meeting, Brussels, Belgium, 16–17 November 1982. [Google Scholar]
- Rios, M.; Edenburn, M.W.; Allen, P.A. Cost effectiveness of concentrating photovoltaic-thermal (PVT) systems vs. side-by-side systems for two intermediate applications. In Proceedings of the IEEE 15th Photovoltaic Specialists Conference, Orlando, FL, USA, 11 May 1981. [Google Scholar]
- Coventry, J.S. Performance of a concentrating photovoltaic/thermal solar collector. Solar Energy 2005, 78, 211–222. [Google Scholar] [CrossRef]
- Del Col, D.; Bortolato, M.; Padovan, A.; Quaggia, M. Experimental and numerical study of a parabolic trough linear CPVT system. Energy Procedia 2014, 57, 255–264. [Google Scholar] [CrossRef]
- Bellini, E. Concentrating Photovoltaic-Thermal System with 91% Efficiency. Available online: https://www.pv-magazine.com/2020/10/06/concentrating-photovoltaic-thermal-system-with-91-efficiency/ (accessed on 15 October 2020).
- Riahia, A.; Ben, A.; Fadhel, A.; Guizani, A.; Balghouthi, M. Performance investigation of a concentrating photovoltaic thermal hybrid solar system combined with thermoelectric generators. Energy Convers. Manag. 2020, 205, 112377. [Google Scholar] [CrossRef]
- Yang, F.; Wang, H.; Zhang, X.; Tian, W.; Hua, Y.; Ding, T. Design and experimental study of a cost-effective low concentrating photovoltaic/thermal system. Solar Energy 2018, 160, 289–296. [Google Scholar] [CrossRef]
- George, M.; Pandey, A.K.; Rahim, N.A.; Saidur, R. Recent studies in concentrated photovoltaic system (CPV): A review. In Proceedings of the 5th IET International Conference on Clean Energy and Technology (CEAT2018), Kuala Lumpur, Malaysia, 5–6 September 2018; pp. 1–8. [Google Scholar]
- Tao, M. Terawatt Solar Photovoltaics—Roadblocks and Opportunities; Springer: London, UK, 2014; pp. 11–20. [Google Scholar]
- IXYS Korea Ltd. IXOLAR(TM) High Efficiency SolarBIT (Datasheet). IXYS Corporation. 2011. Available online: https://ixapps.ixys.com/DataSheet/KXOB22-04X3-DATA-SHEET-20110808.pdf (accessed on 10 October 2020).
- The National Renewable Energy Laboratory (NREL). Reference Air Mass 1.5 Spectra. Alliance for Sustainable Energy LLC. Available online: https://www.nrel.gov/grid/solar-resource/spectra-am1.5.html (accessed on 10 October 2020).
- Azur Space Solar Power GmbH. Products CPV—PV Solar Cells; AZUR SPACE Solar Power GmbH: Heilbronn, Germany. Available online: http://www.azurspace.com/index.php/en/products/products-cpv/cpv-solar-cells (accessed on 10 October 2020).
- Helmers, H.; Schachtner, M.; Bett, A.W. Investigations on the influence of temperature and concentration on solar cell performances. In Proceedings of the 9th International Conference on Concentrator Photovoltaic Systems (CPV 2013), Miyazaki, Japan, 15–17 April 2013; Available online: http://publica.fraunhofer.de/documents/N-279987.html (accessed on 20 October 2020).
- Yoon, S.; Garboushian, V. Reduced temperature dependence of high-concentration photovoltaic solar cell open-circuit voltage (Voc) at high concentration levels. In Proceedings of the 1994 IEEE 1st World Conference on Photovoltaic Energy Conversion—WCPEC (A Joint Conference of PVSC, PVSEC and PSEC), Waikoloa, HI, USA, 5–9 December 1994. [Google Scholar]
- Kost, C.; Mayer, J.N.; Thomsen, J.; Hartmann, N.; Senkpiel, C.; Philipps, S.; Nols, S.; Lude, S.; Saad, N.; Schlegl, T. Levelized Cost of Electricity—Renewable Energy Technologies; Fraunhofer Institute for Solar Energy Systems (ISE): Freiburg, Germany, 2013. [Google Scholar]
- Cooper, T.; Ambrosetti, G.; Malnati, F.; Pedretti, A. Experimental demonstration of high-concentration photovoltaics on a parabolic trough using tracking secondary optics. Prog. Photovolotaics Res. Appl. 2016, 24, 1410–1426. [Google Scholar] [CrossRef]
- Zentralanstalt für Meteorologie und Geodynamik (ZAMG). Meteorological Network. Zentralanstalt für Meteorologie und Geodynamik, Hohe Warte 3, 1190 Vienna. Available online: https://www.zamg.ac.at/cms/en/climate/meteorological-network (accessed on 10 October 2020).


| Authors | Year | Concentrator | Absorber Technology | Cell Type | Efficiency in % |
|---|---|---|---|---|---|
| Gibart [20] | 1981 | Parabolic trough | CPV-T | - | - |
| Rios et al. [22] | 1981 | Parabolic trough | CPV-T | - | - |
| Coventry [23] | 2003 | Parabolic trough | CPV-T | Si | 68% |
| Col et al. [24] | 2014 | Parabolic trough | CPV-T | Multijunction | 55–70% |
| Yang et al. [27] | 2018 | Quasi parabolic mirror | CPV-T | Si | 57% |
| Riahia et al. [26] | 2020 | Parabolic trough | CPV-T-TE | Si | 53% |
| Specification | Value | Unit |
|---|---|---|
| Length of facility | 26 | m |
| Aperture of mirror | 2.2 | m |
| Focal distance | 0.8 | m |
| Temperature range | 60–120 | °C |
| Heat transfer fluid | Water/Oil | - |
| Motor type | AC motor | - |
| Tracking system | 1-Axis (East to West) | - |
| Gear Ratio (whole system) | 97600 | - |
| Accuracy of the system in ° | 0.5 | ° |
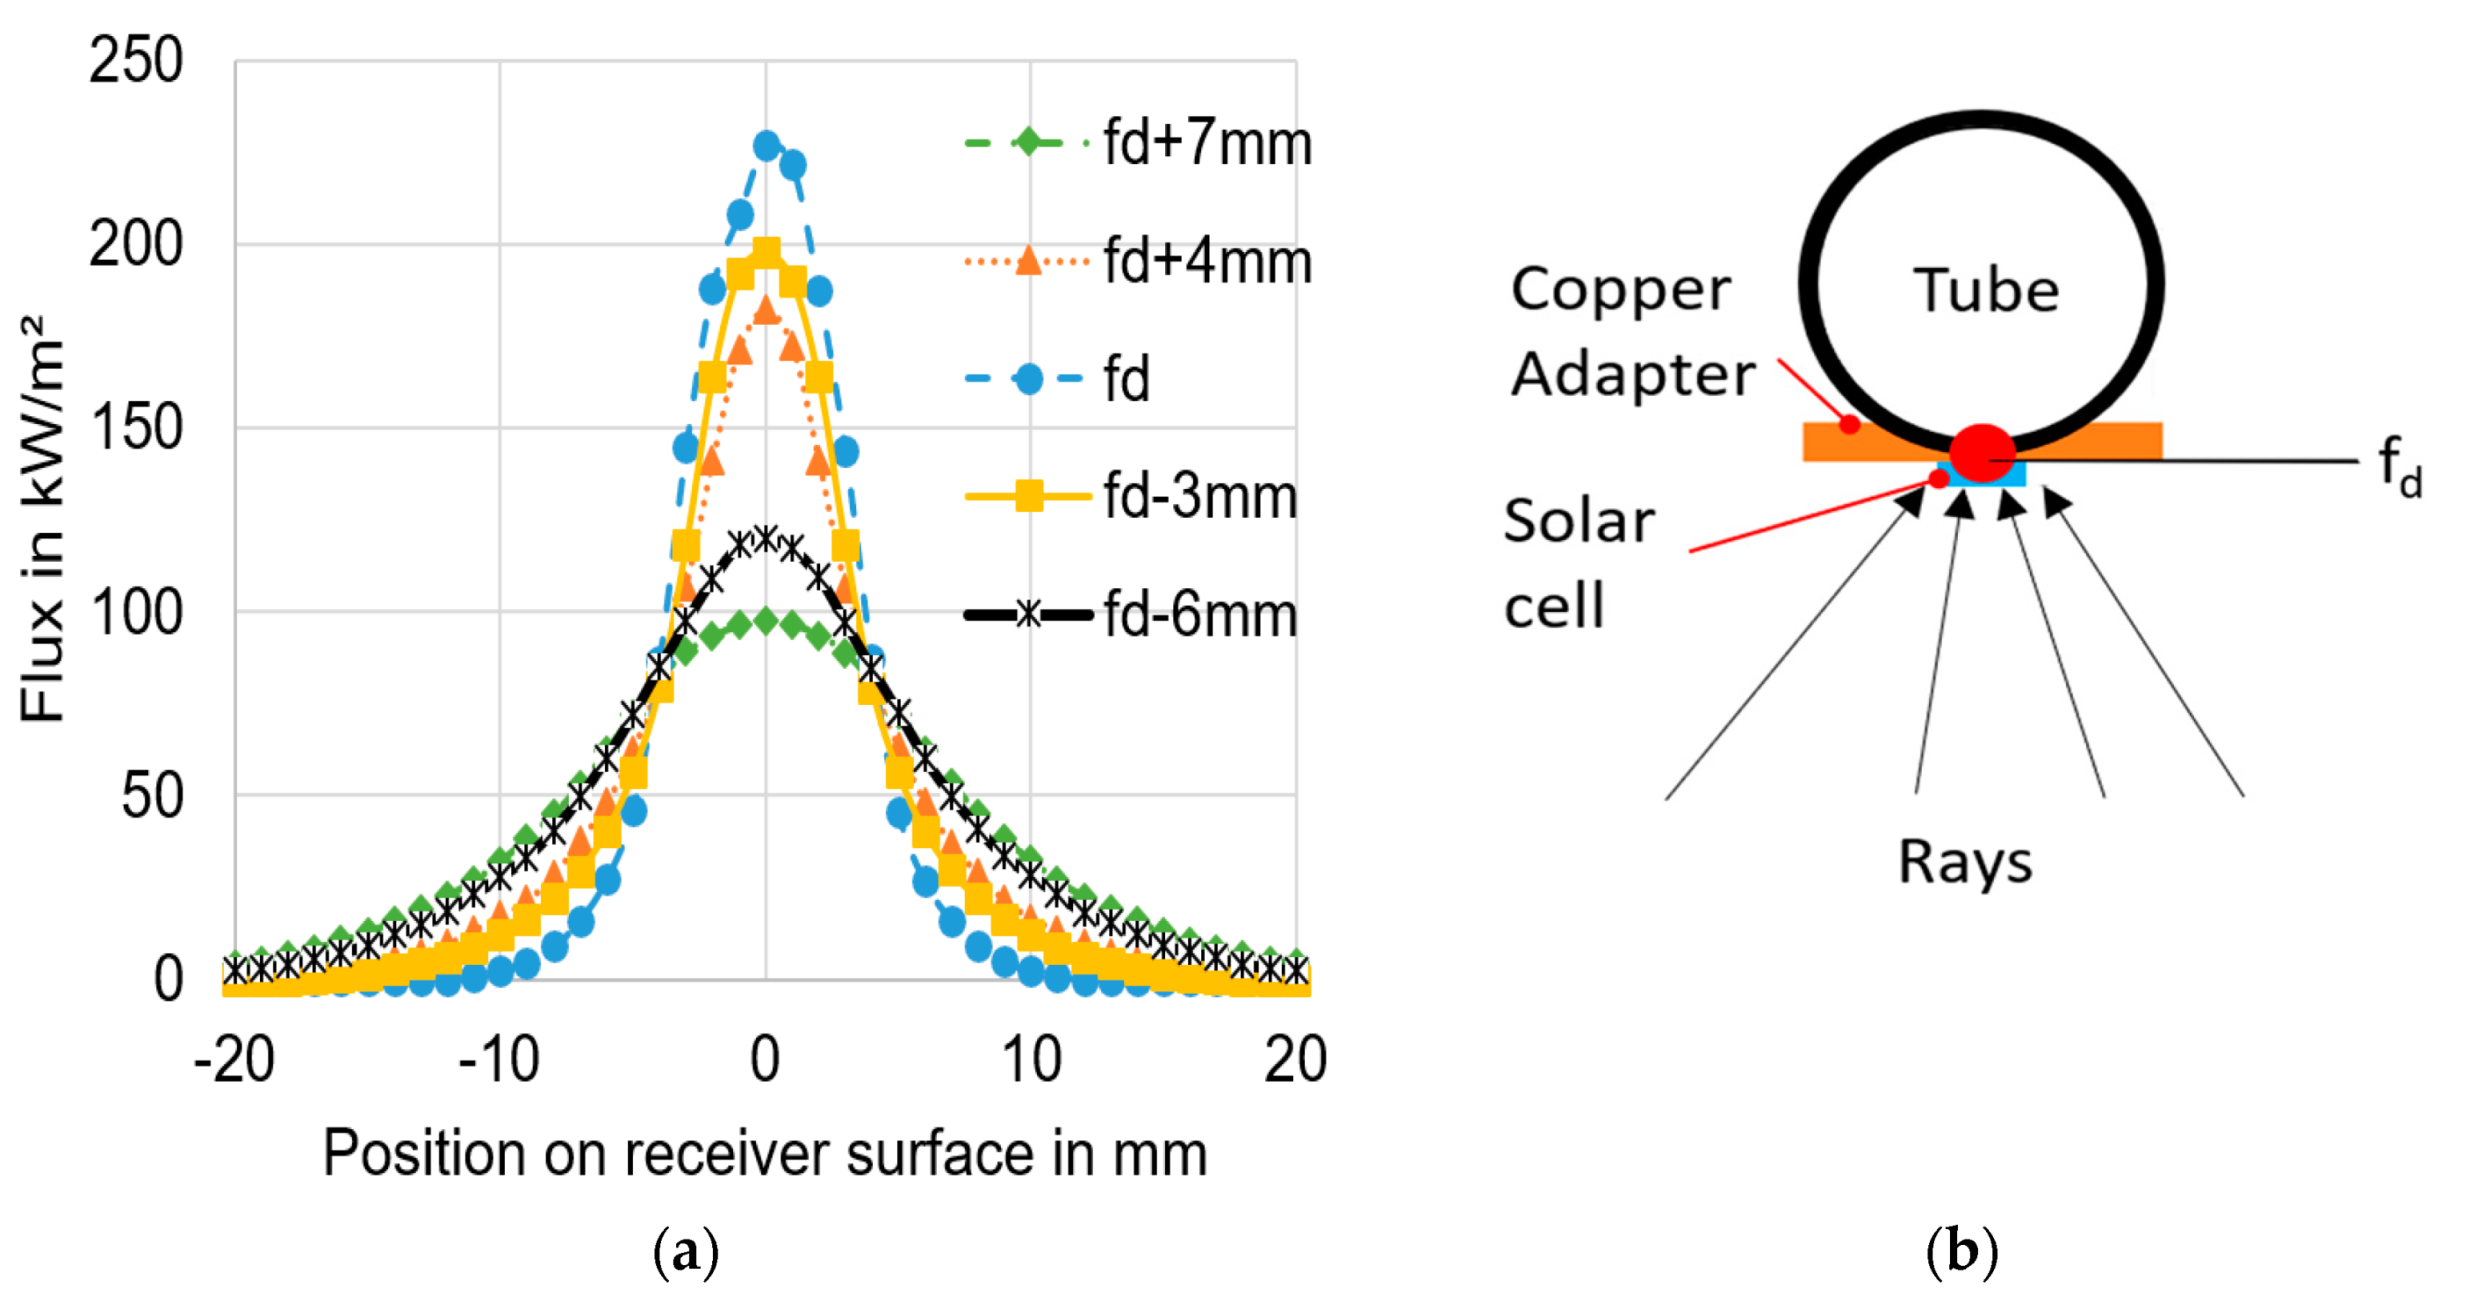
| Position in mm | Spatial Distribution: 40 mm Wide Absorber with 1 CPV Cell | Scale |
|---|---|---|
 |  | |
| fd + 7 mm |  | |
| fd + 4 mm |  | |
| fd |  | |
| fd − 3 mm |  | |
| fd − 6 mm |  |
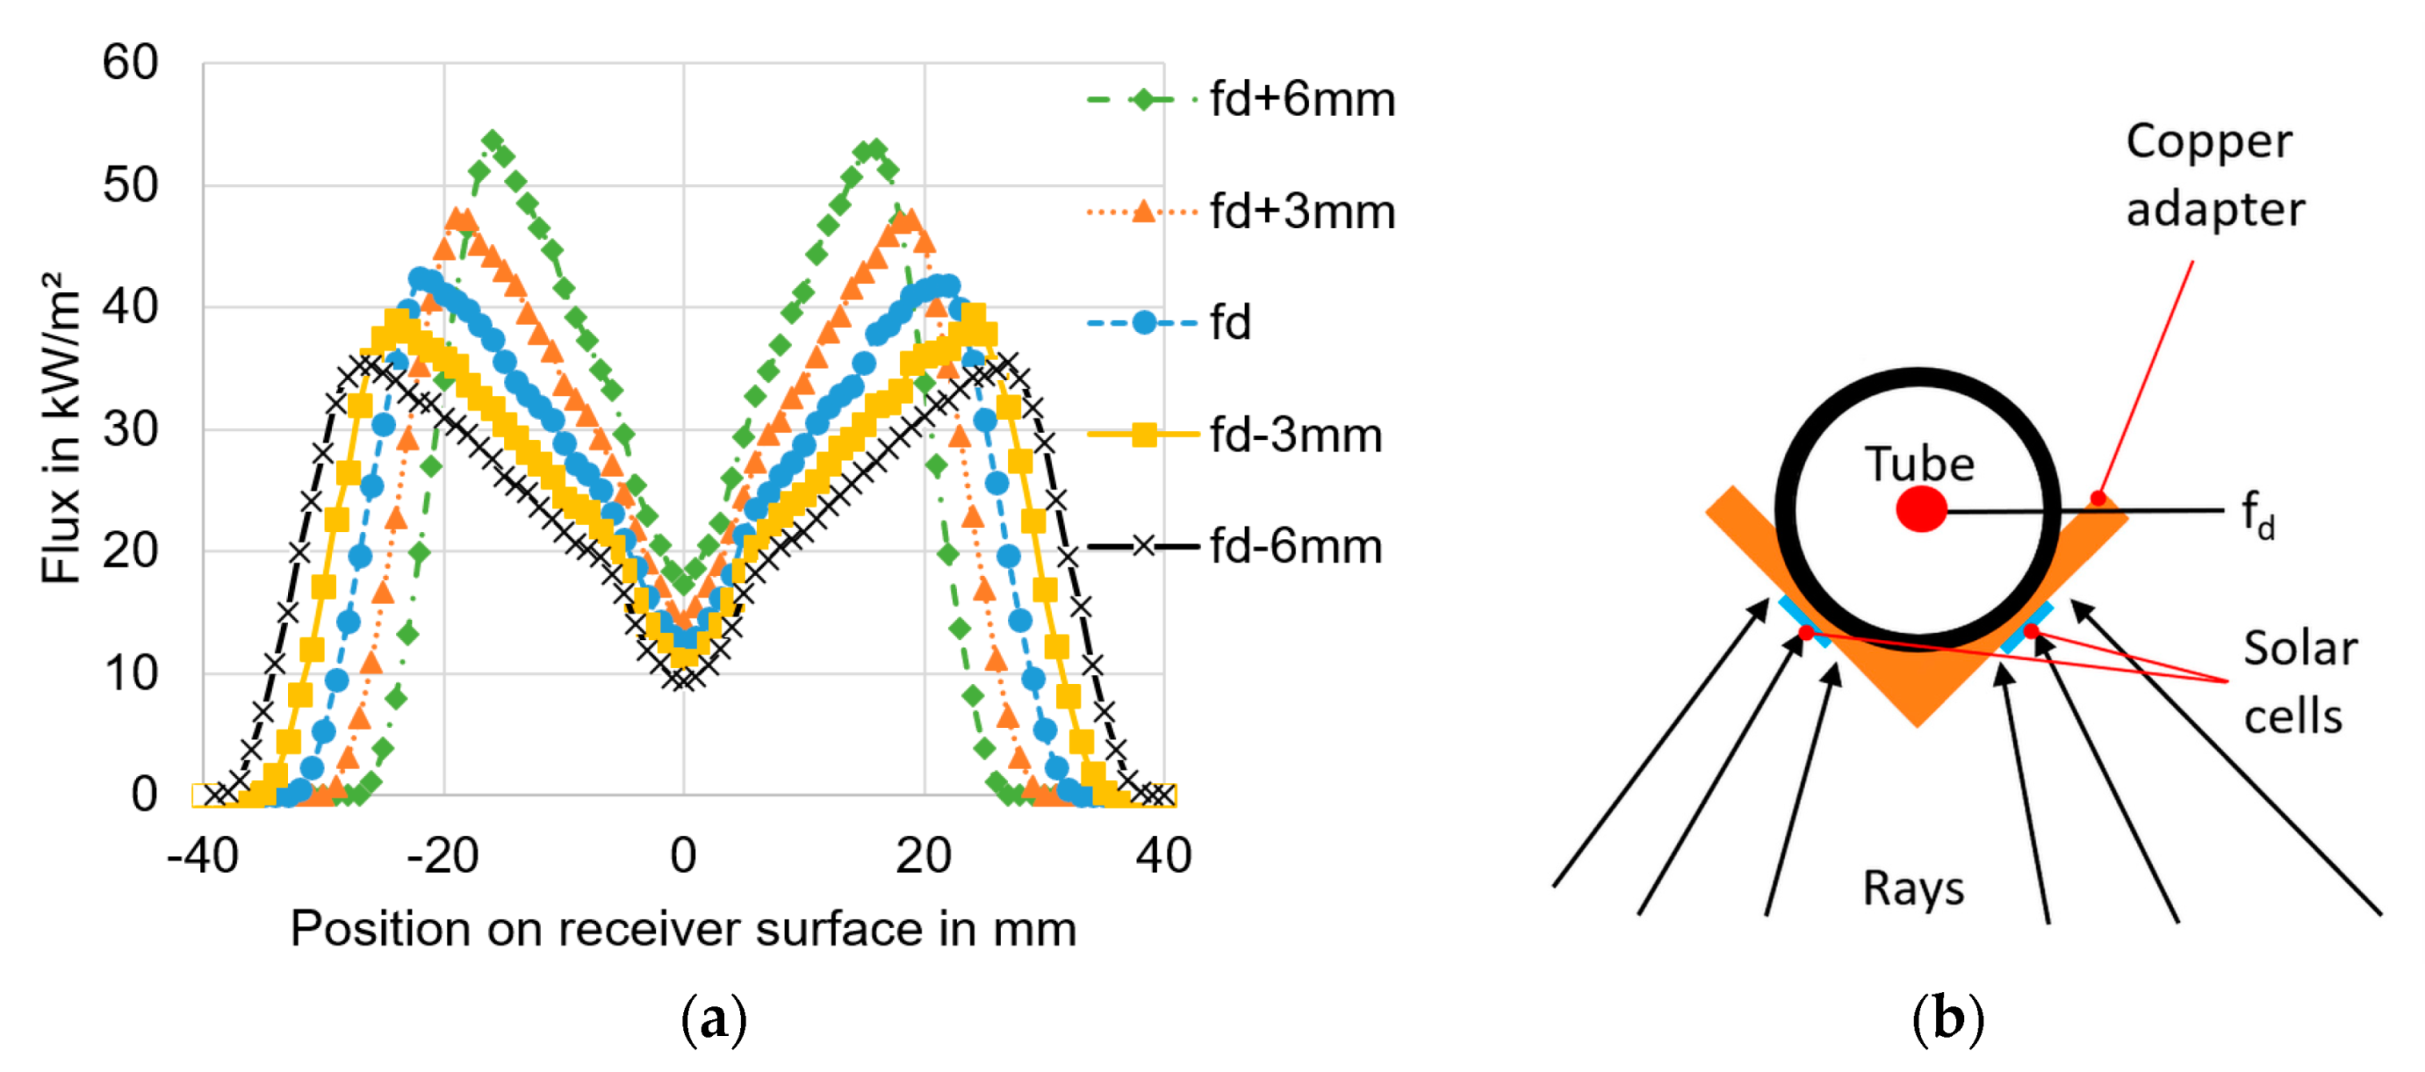
| Position in mm | Spatial Distribution: 80 mm Wide Absorber with 2 CPV Cells | Scale |
|---|---|---|
 |  | |
| fd + 6 mm |  | |
| fd + 3 mm |  | |
| fd |  | |
| fd − 3 mm |  | |
| fd − 6 mm |  |
| Time | T-HTF Outlet | T-Solar Cell PCB | ΔT | Pelectrical | ηGHI | ηDNI |
|---|---|---|---|---|---|---|
| hh:mm:ss | °C | °C | K | W | % | % |
| 15:02:30 | 70 | 89 | 19 | 2.85 | 18.5 | 20.8 |
| Time | T-HTF Outlet | T-Solar Cell PCB | ΔT | Pelectrical | ηGHI | ηDNI |
|---|---|---|---|---|---|---|
| hh:mm:ss | °C | °C | K | W | % | % |
| 12:31:36 | 21 | 62 | 41.0 | 4.10 | 25.0 | 28.1 |
| 12:46:34 | 65.5 | 86 | 20.5 | 3.87 | 23.6 | 26.5 |
Publisher’s Note: MDPI stays neutral with regard to jurisdictional claims in published maps and institutional affiliations. |
© 2020 by the authors. Licensee MDPI, Basel, Switzerland. This article is an open access article distributed under the terms and conditions of the Creative Commons Attribution (CC BY) license (http://creativecommons.org/licenses/by/4.0/).
Share and Cite
Felsberger, R.; Buchroithner, A.; Gerl, B.; Wegleiter, H. Conversion and Testing of a Solar Thermal Parabolic Trough Collector for CPV-T Application. Energies 2020, 13, 6142. https://doi.org/10.3390/en13226142
Felsberger R, Buchroithner A, Gerl B, Wegleiter H. Conversion and Testing of a Solar Thermal Parabolic Trough Collector for CPV-T Application. Energies. 2020; 13(22):6142. https://doi.org/10.3390/en13226142
Chicago/Turabian StyleFelsberger, Richard, Armin Buchroithner, Bernhard Gerl, and Hannes Wegleiter. 2020. "Conversion and Testing of a Solar Thermal Parabolic Trough Collector for CPV-T Application" Energies 13, no. 22: 6142. https://doi.org/10.3390/en13226142
APA StyleFelsberger, R., Buchroithner, A., Gerl, B., & Wegleiter, H. (2020). Conversion and Testing of a Solar Thermal Parabolic Trough Collector for CPV-T Application. Energies, 13(22), 6142. https://doi.org/10.3390/en13226142