1. Introduction
A large proportion of the world’s population has moved to urban areas in the last 100 years and this trend continues. It is predicted that urban residents will reach around 6 billion by 2045, requiring basic services, such as energy, infrastructure, decent and affordable housing, etc. [
1]. Despite cities only covering around 3% of the total world’s area, they have a significant effect on climate change being responsible for two thirds of the global energy consumption and more than 70% of greenhouse gas (GHG) emissions [
1]. The term ‘smart city’ emerged last decade as a utopian vision of urban integration and efficiency that can eventually result in GHG emissions reductions [
2]. According to the Smarter 2030 Report ‘ICT Solutions for 21st Century Challenges’, the digital economy could deliver approximately 12 GtCO
2e of emissions savings by 2030 as a result of smart logistics, grids and buildings [
3].
This paper describes an application of the “internet of things” (IoT) in an “Urban analytics” [
4] energy management monitoring system. The core concept of IoT is to automate monitoring without the need for human involvement and to gather data that allow our computers to know about our ‘things’ and greatly reduce waste, loss and cost [
5]. In this case, the ‘things’ are utility meters and public buildings. Automated meter reading (AMR) technology allows utility meters (such as water, gas, heat or electricity meters) to generate data automatically and transfer them to a central database where they are associated with device identifiers and made available to monitoring systems. Energy usage is often considered invisible. Monitoring systems make energy and water usage visible to organisations and allow them to improve evidence-based decision-making. Hereafter, reference to energy management, services and infrastructure includes energy and/or water.
Public sector building stock is often heterogeneous in terms of factors such as age and complexity of the technology deployed and the innumerable things that can (and often do) go wrong in such complicated systems. Energy infrastructure includes components at various nested scales from the macro (e.g., buildings, district heating systems, electricity and gas networks) to the meso (e.g., windows, HVAC systems and building energy management systems) and the micro (e.g., light bulbs, thermostatic radiator valves and laptops). The infrastructure is dynamic, it grows as new buildings are constructed and when buildings are refurbished or extended. It is also constantly being maintained as equipment is reconfigured, repaired or upgraded somewhere in the organisation every day by a veritable army of maintainers (HVAC technicians, facility managers, installers, caretakers, etc.). Management of the infrastructure has a fundamental impact on energy and water usage and is therefore a core element of energy management activities.
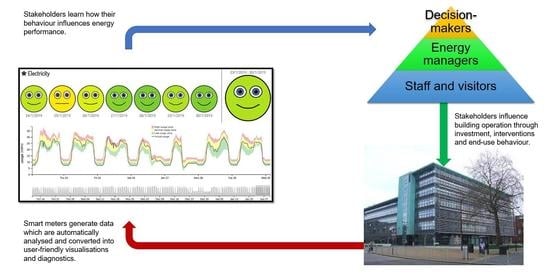
Responsibility for day-to-day operation and maintenance of the building infrastructure is typically dispersed across large numbers of individuals and impacts on even larger numbers of users. Thus, the population of stakeholders with an interest in the operation and development of such a dynamic infrastructure is large and diverse. These stakeholder groups can be broadly sub-divided into (1) building users, (2) energy professionals—those responsible for maintaining and operating energy/water infrastructure and (3) strategic managers—those responsible for strategic management of infrastructure. Individuals can be members of more than one group.
Researchers have proposed an epidemiological approach to energy end-use demand studies [
6], drawing a parallel with the complexity of biology. Energy management in public authorities can be viewed as a complex adaptive system using the framework developed by Axelrod and Cohen [
7]. Stakeholders use a variety of behavioural and technical strategies in patterned interaction with each other and with infrastructure to achieve their goals. Different stakeholder groups have diverse strategic options and experience different pressures associated with acting to support sustainable energy policy at the individual and collective level. The implementation of energy monitoring systems in this context is a socio-technical activity which can manifest itself in complex ways depending on how it is implemented and how the generated data interact with governance schemes [
8].
The role of public authority energy managers is complex, involving investigation, scenario building and development of interventions [
9]. The primary opportunities for influencing the environmental and financial costs of delivering energy services are through technical, behavioural and systemic interventions. Technical interventions impact on the infrastructure itself or its configuration (e.g., replacement components or control settings). Behavioural interventions impact on stakeholders’ behaviour to reduce waste (e.g., avoid lighting unoccupied rooms) and reorganise behaviour (e.g., holiday shutdown checklists). Systemic interventions may include both technical and behavioural change and are typically large-scale strategic transformations such as changing the way a department operates and/or moving into a new building.
The cost of energy efficiency interventions can range from major capital expenditure projects to low-cost or even no-cost measures such as adjusting existing control settings. However, identifying opportunities to make investments in energy efficiency interventions requires an investment of time and effort which is classified as a transaction cost [
10] of the intervention. To design an appropriate response and to coordinate any collective action necessary adds to these costs which are incurred before the costs of the intervention itself are factored in. For smaller interventions which may be very cheap to implement but costly to identify, the transaction costs can dominate the total cost. In these cases, the transaction costs are a major barrier to implementation. Monitoring systems reduce these transaction costs by automatically compiling salient information helping to identify and diagnose opportunities for intervention. Monitoring systems do not save energy or water directly, they improve the efficiency and effectiveness of energy management processes.
Energy saving behaviour is often as invisible as energy usage. If building users cannot see energy usage, then it is also not easy to see which behaviours and individuals are causing or mitigating wastage. High transaction costs provide a barrier to action at the individual level. The motivation for individuals to invest time and effort into developing energy or water saving behaviours is diminished further by the “free rider effect” [
11] leading to a “tragedy of the commons” [
12] situation where stakeholders allocate little to no attention to the issue. Monitoring systems are a kind of ‘public good’ in the context of the organisation, they introduce new information which has the potential to change the dynamics of the system dramatically if the information is made available in a way that can be readily used. Transparency of performance measures such as energy consumption and success criteria such as reduced consumption can drive the adaptive selection of strategies of stakeholders within and between buildings.
The aim of this paper is to explore two research questions: (1) how can utility data be integrated into urban management processes through the deployment of smart meter monitoring systems? and (2) what are the impacts of implementing a smart, urban analytics system on the dynamics of energy and water management in public authorities? The research is framed from three perspectives within large, multi-site, public sector organisations: the bottom-up micro-level (individual and local), the top-down macro-level (organisation-wide and strategic) and the intermediate meso-level (community-focused and operational), similar to the approaches to low carbon transitions in energy demand suggested by Janda and Parag [
13].
Two relevant components of smart monitoring systems relate to the capability of using metered data in energy management and how these data can support management and engagement with a wide range of stakeholders through energy feedback (described in
Section 1.1 and
Section 1.2).
Section 2 provides an overview of the urban analytics platform developed in the EU-funded Energy Data Innovation Network (EDI-Net) project. Evidence was elicited through interviews, focus groups and case studies following the methodology described in
Section 3.
Section 4 explains the institutional and social effects resulting from the use of the EDI-Net system in three European public authorities, followed by a discussion of the implications in energy management and stakeholder engagement in
Section 5. Conclusions are presented in
Section 6.
1.1. Metering Data in Energy Management
Monitoring systems traditionally provide technical information to energy professionals. Since they may be responsible for hundreds of buildings; energy management teams cannot easily conduct regular visits for energy surveys and audits. In many cases when a problem occurs (e.g., a control system failure or a water leak) it is not visible to building users. The longer such problems continue without being addressed, the greater the economic and environmental costs. There is potential for such problems to go unaddressed for months without a monitoring system in place.
Metered energy and water data have traditionally been a source of information that allows energy management teams to monitor usage remotely. Guidance on data analysis approaches for energy management has been published in the UK under The Energy Efficiency Best Practice Programme (EEBPP) since the 1990s [
14]. These guides formalise and standardise techniques such as simple regression analysis with degree days or CUSUM (cumulative sum) analysis used by energy professionals working with low-resolution, monthly data to establish ’normal’ patterns of usage and identify divergence from these patterns. The point of this data analysis is to trigger investigation. The energy management function in an organisation can allocate resources to an exploratory mode of problem verification and diagnosis which ultimately leads to interventions being designed and implemented. Data can be used to identify the nature of a problem, to pinpoint when it began and to verify the effectiveness of any attempts to mitigate the problem.
Modern smart meter technology can monitor thousands of buildings at high resolution. A standard utility meter in the UK generates a reading every thirty minutes, producing 17,520 data points in a normal year (compared to 12 data points per year in a monthly monitoring system). With smart meters being rolled-out across the EU [
15,
16], it is not unusual for these data to be available to the central energy management function of large public authorities. When many complex buildings are being monitored in this way, the value of a data-driven approach is clear.
Data analysis approaches using monthly data have been adapted for use with higher resolution data from smart meters [
17] and are still commonly used in industry [
18]. Inverse modelling refers to a statistical model which can be ‘fitted’ using a method such as ordinary least squares (OLS) to measured data. The model fitting process estimates model parameters that can then be used to predict dependent variables based on the values of independent variables (e.g., to predict gas usage for a given building based on outside air temperature). Inverse modelling approaches such as PRISM [
19] and the Inverse Modelling Toolkit [
20] allow for a highly structured and reproducible method for generating predictive energy usage models based on historical usage and weather data.
These models allow for a hypothesis testing approach where the null hypothesis is that a building is continuing to operate as ‘normal’ and that no special attention is required. By observing the pattern of consumption relative to the forecast produced by an inverse model it is possible to reject the null hypothesis if consumption patterns diverge in a statistically significant way. Such tools convert data into usable information.
1.2. Energy Feedback and Visualisation
Previous research has identified the effectiveness of energy feedback in changing behaviour by ‘making energy visible’ [
21,
22,
23]. In non-domestic buildings, energy consumption and its effects are largely invisible to building users if the space is comfortable, and equipment is working [
24]. In organisational settings, building users do not have direct financial incentives to reduce energy use as they do at home because they do not have to pay energy bills and they rarely have access to information regarding their consumption levels and patterns (relative to previous periods) [
25].
In operation, monitoring systems can provide non-technical users with on-demand access to up-to-date and reliable information relating to the performance of energy and water infrastructure in a form that is easy to absorb and is directly tied to objective measured data. This leads to more transparency and more opportunities for collaboration on technical and behavioural interventions for energy and water efficiency.
A closed feedback loop is achieved when information from a monitoring system is made available to stakeholders in a way that can influence their actions. When these actions impact on building performance and are fed back to the user via the monitoring system, the information is transformed into embodied knowledge. This kind of feedback loop can be established for building users only if the monitoring system is sensitive enough to detect the impact of the actions taken. Two critical aspects of a robust feedback loop are the effectiveness of the information uptake by users and its conversion into action. Energy data are transformed into information and presented in a form that is easy to absorb by the target audience. The selection and visualisation [
26,
27] of information will determine how accessible the system is and how persuasively it communicates to the user. Based on the clarity of the information provided (e.g., historical versus normative comparisons) [
28,
29,
30] and the ability of the user to process this information, the communication can prompt immediate thoughtful behavioural choices or long-term cognitive engagement and enduring behaviour change [
31,
32,
33].
Participating in a robust closed loop can enable building users and energy professionals to gain knowledge about how changes in their behaviour influence the building, to verify the effectiveness of their intentional actions and to observe otherwise invisible changes to the building performance. By using monitoring and feedback systems, highly engaged users can act as peer educators disseminating their knowledge on energy saving opportunities to colleagues [
25]. Formal and informal networks (communities of practice) can emerge introducing and diffusing new models, concepts and practices, so these can become part of the organisation’s culture [
34]. Social norms can be enhanced when users perceive competition of energy performance improvement between buildings [
35]. Competitive approaches (energy reduction competitions) and incentivisation models (gamification) can help to intensify knowledge exchange and participation among building users as well as promoting cooperative behaviour [
36]. In this way, embodied knowledge can be upgraded to a kind of collective wisdom that can anticipate issues and choose the correct actions instinctively.
2. The Energy Data Innovation Network
The three-year (2016–2019) EU-funded (Horizon 2020) EDI-Net project aimed to increase the capacity of European public authorities to use sub-hourly smart energy and water meter data to accelerate the implementation of sustainable energy policy, by introducing a step change in the quality and availability of building energy performance information. The EDI-Net system, developed in the project, was deployed in over 1300 buildings across three public authorities in Europe: Leicester (UK), Nuremberg (DE) and Generalitat of Catalonia (ES). The EDI-Net system was deployed in 1,056 buildings in Generalitat of Catalonia, 236 buildings in Leicester and 37 buildings in the city of Nuremberg during the project lifetime.
The EDI-Net system comprises three main tools: the dashboard, the benchmarking tool and the online forum. These systems were designed to meet three specific user requirements defined by the project: (1) to allow stakeholders to track energy performance and communicate this performance in a user-friendly way (dashboard), (2) to facilitate communication between stakeholders (online forum) and (3) to manage intervention plans for energy efficiency (benchmarking tool). In Leicester and Nuremberg, the dashboard was used for energy monitoring and for communication between stakeholders in mobilisation campaigns. In Catalonia and Leicester, the benchmarking tool was used was used for planning energy-related investments and managing intervention plans for energy efficiency.
The dashboard and the benchmarking tool are based on calculations conducted by a common data analytics engine. The modelling approach is described in detail in Stuart and Fleming [
37] The core of the calculation is an inverse model and a unitless performance indicator. The algorithm [
37] was originally developed from a prototype designed in the SmartSpaces EU project [
35]. Data are continually imported into the system, cleaned and mapped against local weather data drawn from open sources [
38]. For each building, the system estimates what is ’normal’ usage (gas, water, electricity, heat) from historic data. Each week, a new baseline model is fitted to the latest 12-months of data and used to generate a prediction of what usage would be expected if the building was behaving as it was during the baseline period. In order to reflect the uncertainty of the baseline model, the model residuals (errors) are analysed to give percentile values (10th, 25th, 75th and 90th) that, when added to the model prediction represent the ‘normal’ expected range.
2.1. EDI-Net Dashboard
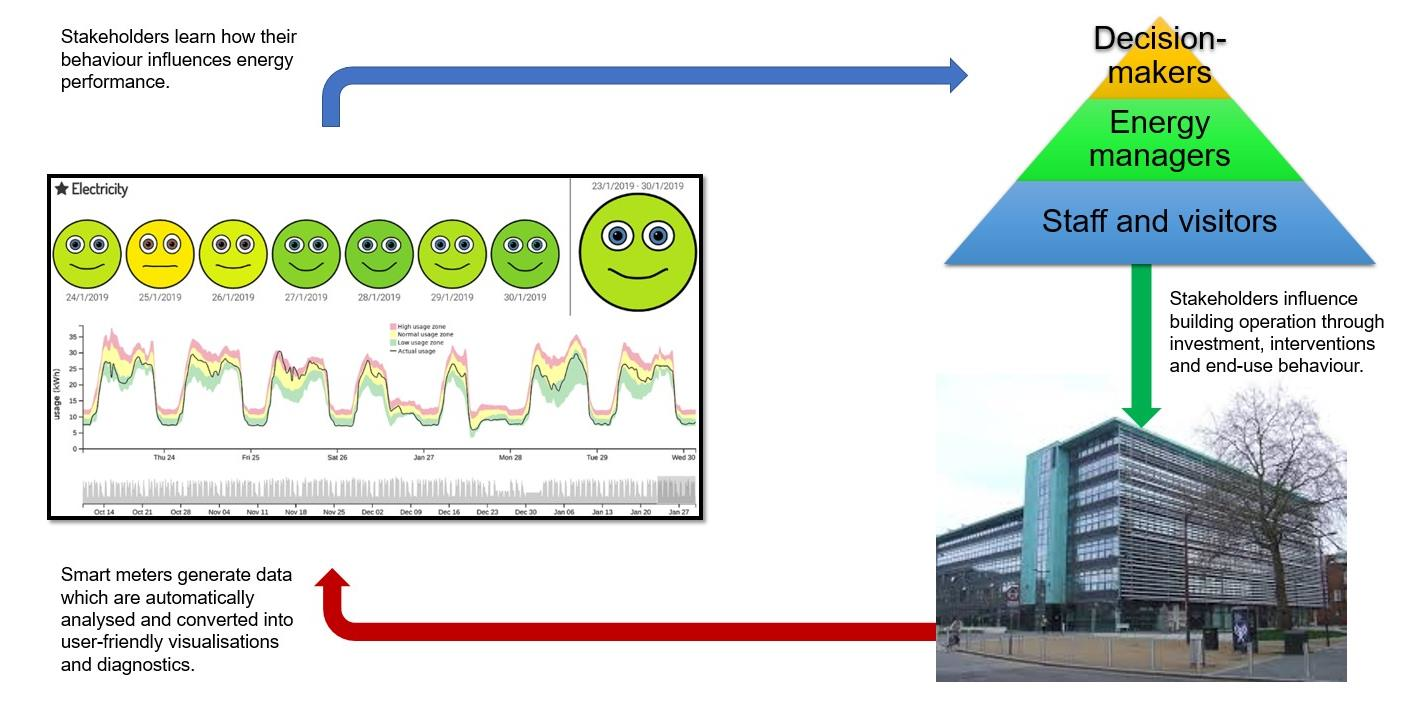
Figure 1 shows the diagnostic report provided by the EDI-Net dashboard as a tool for expert users (though it is available for all users). Actual measured usage is shown as a black line and the baseline model predictions are represented as coloured zones. When interpreting these reports, the key thing to note is where the black line falls relative to the coloured zones. If the black line is within the yellow ‘normal’ zone, then the building is operating as expected. If the black line persistently falls within or goes beyond the red or green zones, then there may be a problem worth investigating. With practice, this can be interpreted intuitively.
To present the data in an even more user-friendly way, the data are reduced to a unitless performance indicator. Each half-hourly value is compared to the model prediction and the percentile score of the difference is calculated with respect to the baseline model residuals. Details of the calculations can be found in Stuart and Fleming [
37].
The resulting score is unitless and bounded so is easily converted into a simple visualisation of user-friendly smiley faces. A score of zero represents usage below any experienced during the baseline period and is visualised as a green, happy face. A score of one represents usage above any experienced during the baseline period and is visualised as a red, sad face. A value of 0.5 represents the median expected usage and is visualised as a yellow, neutral face. In between, the face colour and features vary gradually so any value can be expressed. In addition, the indicator can be aggregated by averaging over time, so it is useful for generating daily and weekly summaries.
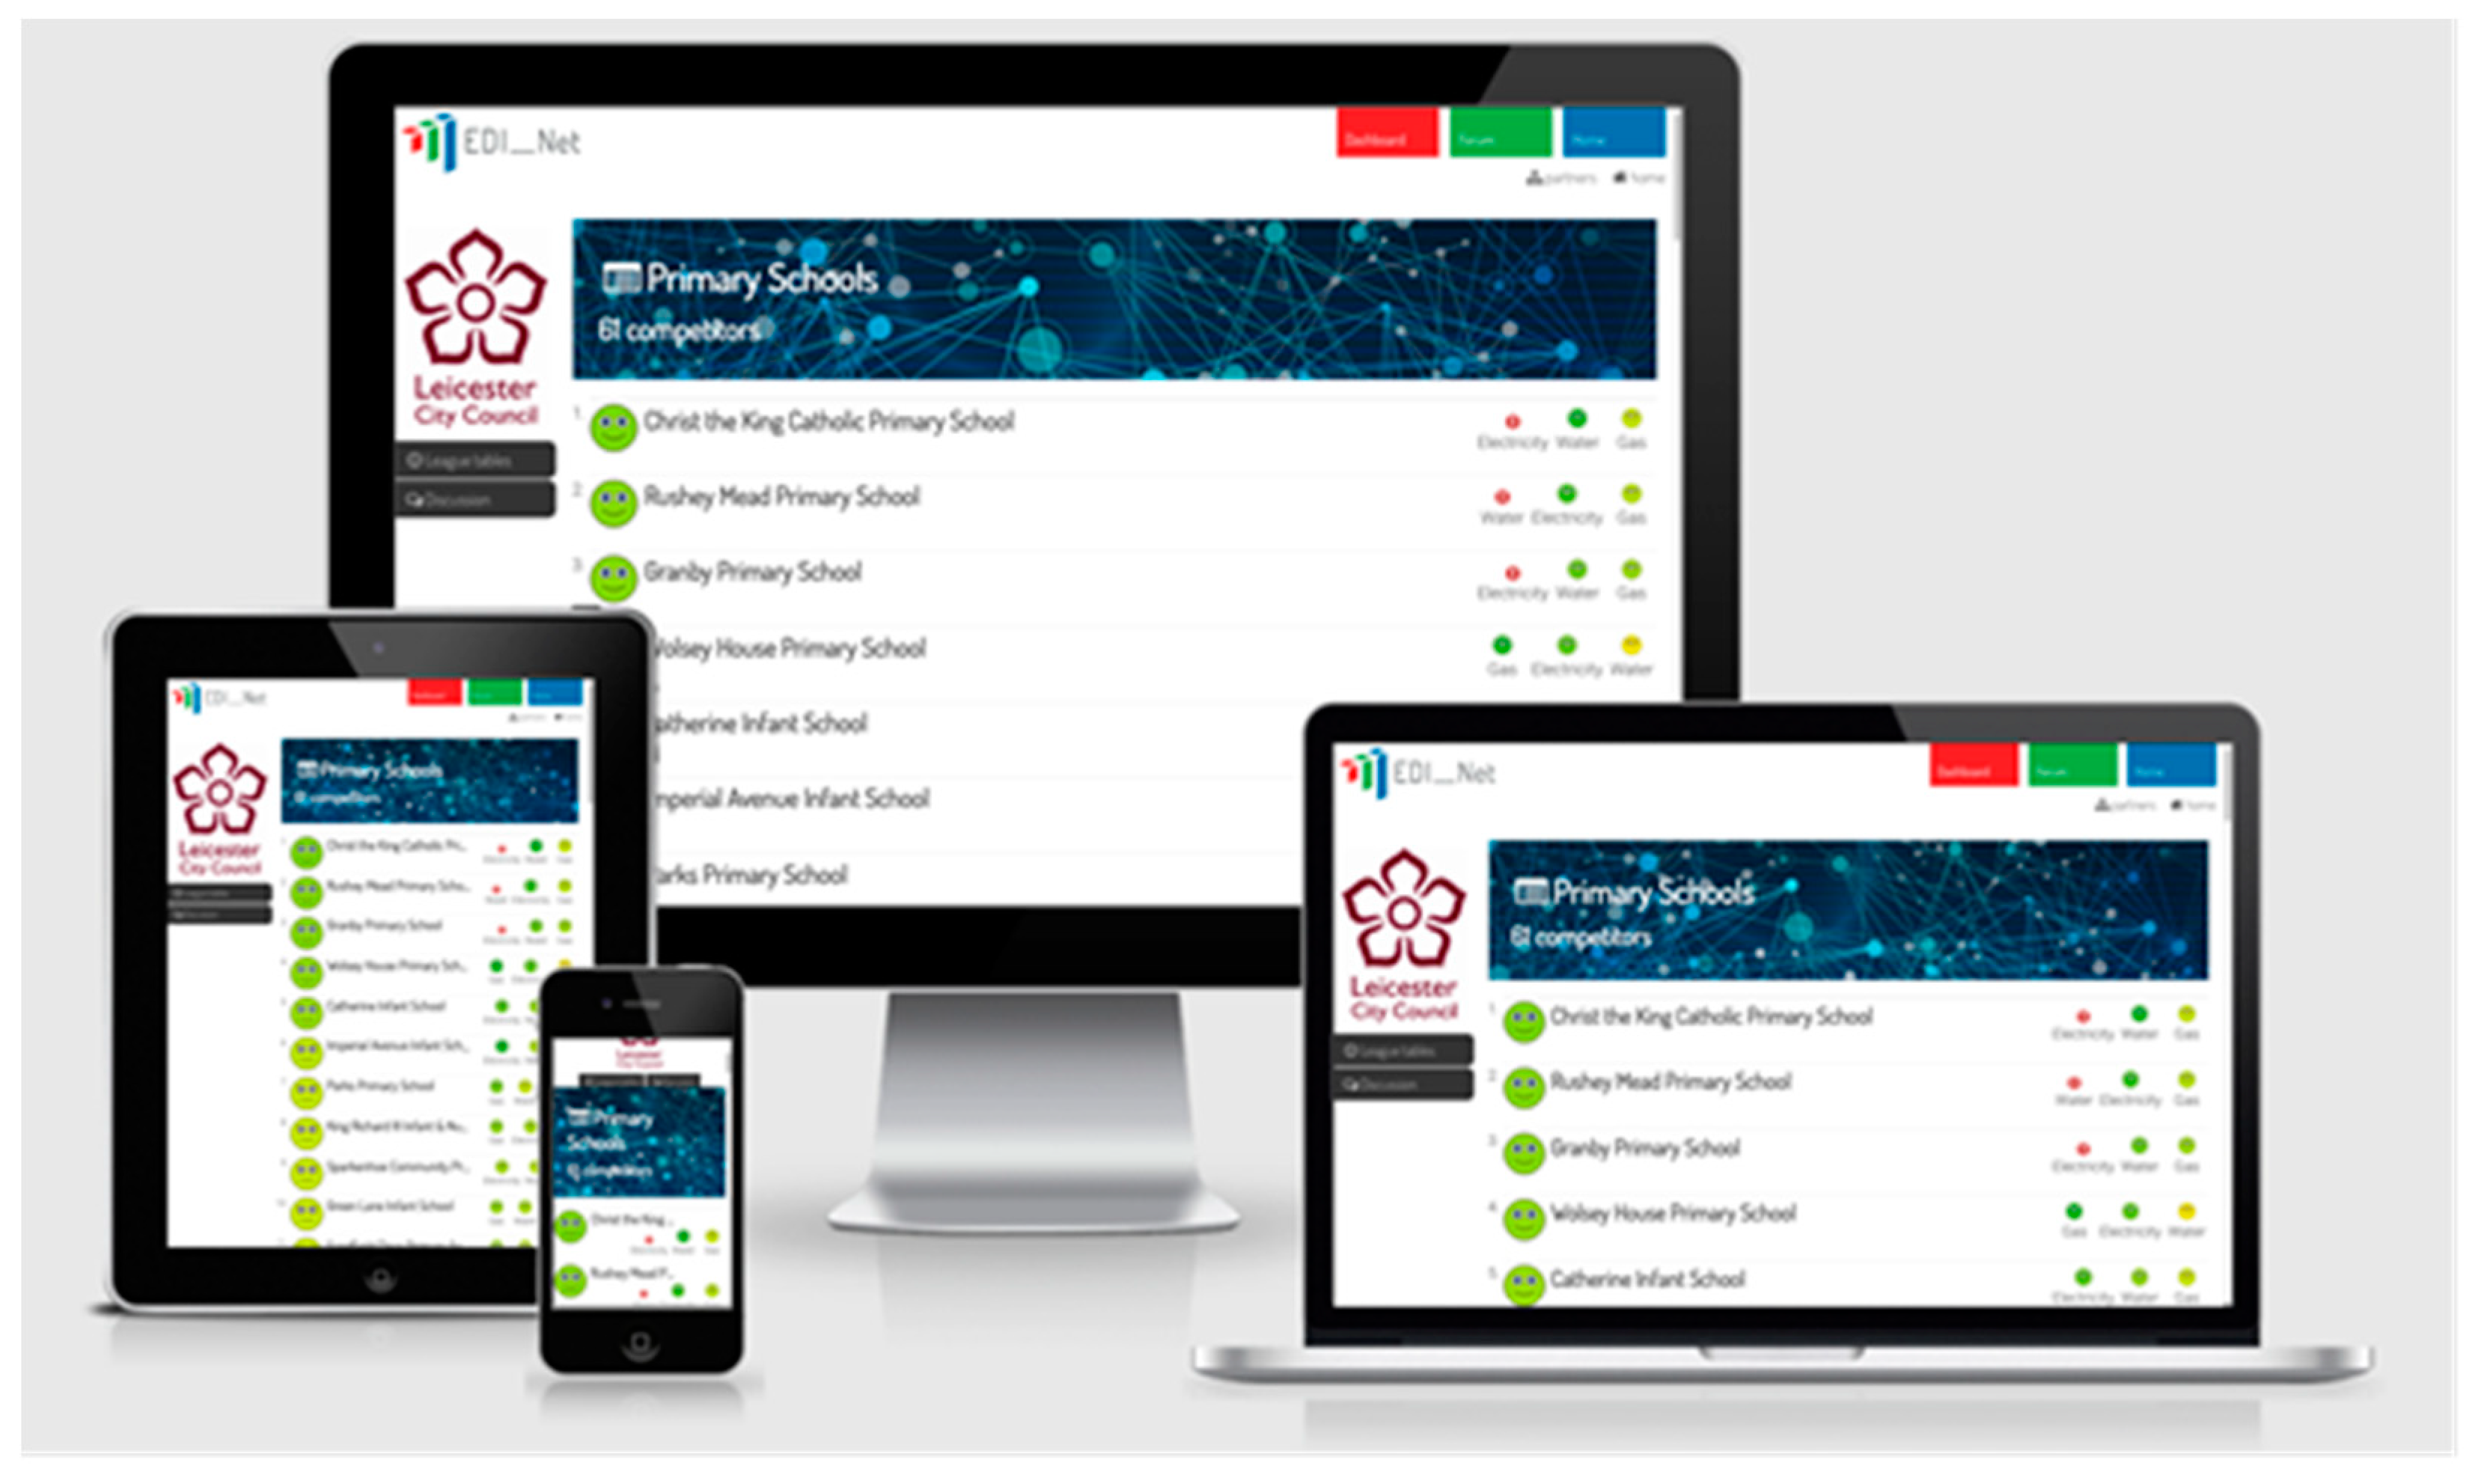
Figure 2 shows the top-level league table interface. League tables show a list of similar buildings (e.g., all primary schools) sorted according to the average value of the performance indicator over the latest 7 days. Each item shows the building name against smiley faces for each utility plus a larger face calculated by averaging the utilities (i.e., gas, water and electricity). This simple format provides users with an overview of current performance across their entire building portfolio and highlights buildings where consumption is higher or lower than past performance suggests is normal. Therefore, any building can move from the bottom to the top of the list by making realistic changes. If buildings are operating normally, all will show yellow, neutral faces.
In addition to the dashboard, the EDI-Net online forum allows participants to share their experiences, promote their successes and discuss their challenges.
2.2. EDI-Net Benchmarking Tool
The EDI-Net benchmarking tool provides a more strategic view of the energy consumed over time in a building portfolio. The tool records detailed building data as well as technical and systemic intervention data. The user interface provides a set of features for management and intervention planning, including key contextual factors (building typology, use typology, building location, inside or cross-organisation), baseline analysis, a list of existing interventions and associated investment data and future recommended measures based on data analytics. A detailed explanation of the data-driven approach and algorithms used in the benchmarking tool can be found in Grillone et al. [
39].
6. Conclusions
The EDI-Net system demonstrates an effective approach for integrating metered utility data into urban management processes via a smart meter monitoring system. When deployed in an organisation, the EDI-Net system automatically processes streams of high-resolution metered utility data from hundreds of buildings. Results are calculated every few hours and the results of analysis are available on demand via a web interface. The system is sensitive to small changes so if a building begins wasting energy, it will be reflected in the interface within hours.
Information is presented in an easy-to-interpret format on a public platform, allowing users to easily absorb and share basic information on related buildings. Expert users can extract further detail from diagnostic visualisations. Strategic managers can view up-to-date financial information, showing the impact of investment in energy management interventions. The system is updated regularly, enabling any engaged stakeholder to participate in a robust feedback loop with the infrastructure at any chosen scale (e.g., a single building, a cluster of buildings or the entire building portfolio).
Central energy managers can monitor the entire building portfolio by regularly checking the system, identifying which (if any) buildings need attention and coordinating a response with relevant building users. When a problem is detected, experts and engaged building users can begin an investigation to identify and diagnose the problem. Energy managers can implement exploratory actions and see the impact on usage within hours to quickly eliminate possibilities, identify the cause and develop an appropriate response. By providing a common reference point, the system improves communication between central and local experts and between all engaged stakeholders.
With information ‘at their fingertips’ building users are able to learn how their actions impact on energy performance. It is easy to know when a problem occurs and when the problem has been resolved. Details and can be discussed with experts. Locally, only a few engaged users are needed to feed this information back to the wider community as necessary. Furthermore, the transparent nature of the system and the competitive, gamified element encourages a reduction in the free-rider effect and helps to attribute social value to energy saving behaviours.
The EDI-Net system reduces the transaction costs associated with the identification and diagnosis of the causes of wastage to virtually zero across potentially hundreds of buildings. This has the effect of lowering barriers to action [
49], both individually and collectively within communities of building users. Designed with user engagement in mind, the EDI-Net system provides a wide range of users with the opportunity to directly engage with aspects of the infrastructure that were previously inaccessible. Direct access to utility data in formats that are accessible via a simple user interface has been shown to support an improvement in evidence-based decision-making in energy management collectively and at multiple levels. The combination of these improvements across different layers of an organisation has produced a systemic impact that is potentially greater than the sum of the parts.
Evidence of some cultural change (or at least the precursors to a cultural change) was identified through clear pathways for improved access to data, leading to systematic changes in behaviour. For example, operational practice within energy management has changed because a scan of the entire building stock is now possible in a few minutes. This introduces a new challenge since opportunities for swift intervention are presented more often. Therefore, passing this information on to stakeholders local to the building becomes an important strategy for centralised energy management to delegate/devolve the task of investigating the problem and developing a response.
By engaging with local stakeholders with no specific responsibility for energy performance such as teachers and pupils, it is possible to tap into significant enthusiasm for acting locally to support the central energy management function. By giving local stakeholders direct access to the EDI-Net system, these users can conduct their own regular checks on the data as part of local initiatives to keep their own buildings operating efficiently. This aligns well with communities of practice such as Eco-schools in Leicester which reinforce the local interest in data and further distribute the role of energy management across a wider range of stakeholders. There is evidence that the EDI-Net systems have encouraged peer-to-peer learning among building users through friendly competition, creating the conditions for adaptive practices to emerge at the local level.
With more engagement from building users in the energy management process, the centralised energy management function will need to adapt in turn perhaps by refocusing on providing technical support for intervention proposals developed locally. In order to support such a transition, urban analytics tools such as the EDI-Net system need to be ready to adapt to support new and emerging contexts. Integrating systems such as EDI-Net into public authority operations is critical to ensure they reach ambitious national and international greenhouse gas emissions reduction targets. It is key to develop new methodologies and business models, but fundamentally stronger policy frameworks mandating the drive for greater energy efficiency are required.
The evidence presented shows that the introduction of urban analytics systems such as EDI-Net can induce qualitative changes to processes at multiple levels, fostering the vision of smart cities where stakeholders are engaged with the services offered, integrating ‘hard infrastructure, social capital including local skills and communities and digital technologies’ [
50]. The integration of the EDI-Net system points towards a more distributed energy management function. We have observed a shifting of the dynamics to support meso-level communities of practice around clusters of buildings.
The EDI-Net system demonstrates the information hierarchy [
51] in action. We see a clear transition from data to information, through knowledge and finally wisdom. The innovative design of the data analytics, intuitive visualisations and simple user interface transform raw data into accessible information that can be readily absorbed by system users [
52]. This information informs action that supports stakeholder participation in feedback loops in which the information is embodied as knowledge of how the system reacts to different actions. The social impacts of transparency and gamification serve to magnify this effect and build collective knowledge via peer-to-peer learning which creates the conditions for wisdom to emerge. Wisdom, in this case refers to the collective ability of the heterogeneous community of stakeholders to act in a coherent way to predict and avoid wastage and to invest in appropriate technology. The development of wisdom of this kind is a prerequisite for the kind of transition of the energy infrastructure necessary for a sustainable future. Though information systems such as EDI-Net can be easily deployed, the specific details of how these impacts manifest within the wider dynamics of an organisation are difficult to predict and require further study.


