Factors That Contribute to Changes in Local or Municipal GHG Emissions: A Framework Derived from a Systematic Literature Review


Abstract
1. Introduction
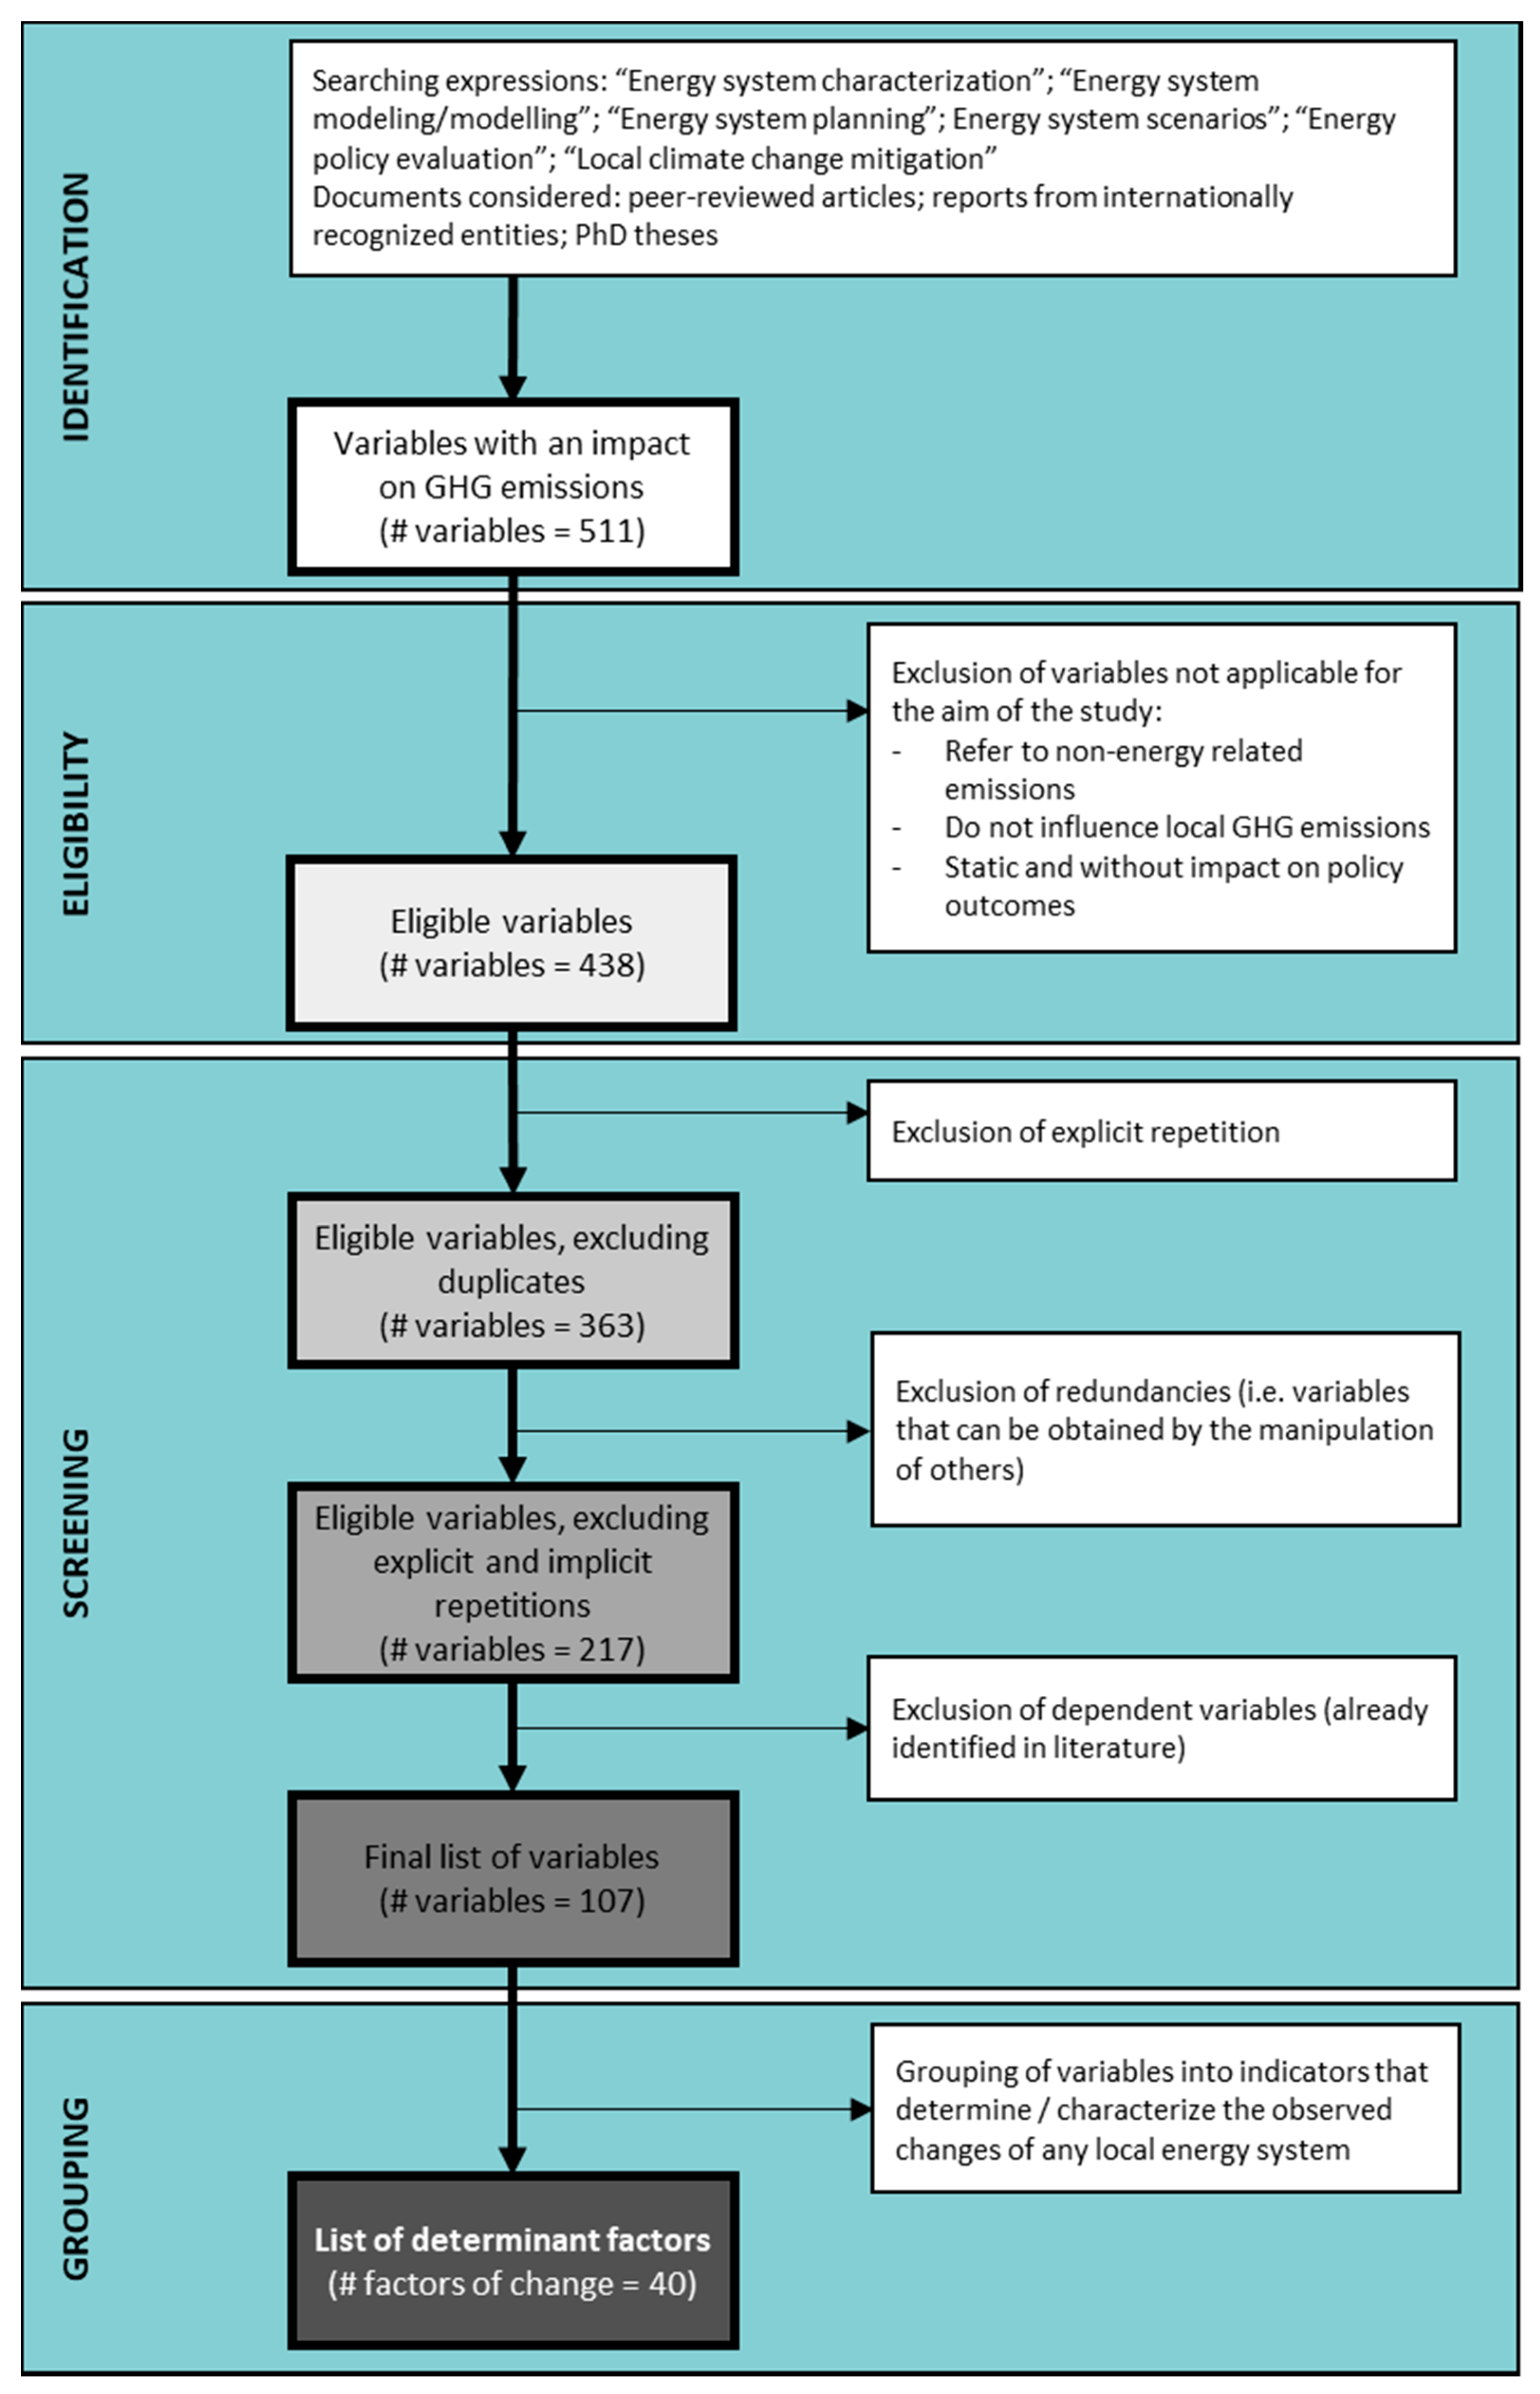
2. Methodology
3. Factors of Change of Local or Municipal GHG Emissions and Respective Characterization
3.1. Local Context
3.1.1. Local Inhabitants’ Characteristics
3.1.2. Local Authorities’ Characteristics
3.2. Local Socio-Economic and Cultural Changes
3.2.1. Demographic Evolution
3.2.2. Social Evolution
3.2.3. Economic Evolution
3.2.4. Climate Variability
3.3. Higher-Level Governance Framework
3.3.1. Technology Evolution
3.3.2. National and International Energy-Related Policies
3.4. Local Climate Change Mitigation Actions
4. Discussion
5. Conclusions
Author Contributions
Funding
Conflicts of Interest
Appendix A

| Document | Code | Variable |
|---|---|---|
| Auld et al. (2014) | 1.001 | Agenda setting processes |
| 1.002 | Favorable public opinion | |
| 1.003 | Favorable party platform | |
| 1.004 | Recent change in government | |
| 1.005 | Presence of champions | |
| 1.006 | Social appeal | |
| 1.007 | Availability of technology | |
| 1.008 | International processes | |
| 1.009 | Focusing events | |
| 1.010 | Action of feedback mechanism | |
| 1.011 | Timeframe | |
| 1.012 | Reporting nature | |
| 1.013 | Policy instruments | |
| 1.014 | State of activity | |
| 1.015 | Target of policy (actors) | |
| 1.016 | Source of authority at different stages (Hybrid or Government) | |
| 1.017 | Presence of flexibility mechanisms | |
| Boonekamp (2004) | 2.001 | GDP growth |
| 2.002 | Structure, main sectors | |
| 2.003 | Structure, subsectors | |
| 2.004 | Structure, final demand | |
| 2.005 | Savings, final demand | |
| 2.006 | Conversion efficiency end-users | |
| 2.007 | Co-generation end-users | |
| 2.008 | Fuel mix end-users | |
| 2.009 | Export | |
| 2.010 | Structure electricity production sectors | |
| 2.011 | Co-generation electricity production sectors | |
| 2.012 | Import | |
| 2.013 | Fuel mix electricity production sectors | |
| Boonekamp (2005) | 3.001 | Energy statistics (statistical figures) |
| 3.002 | Corrected statistics (corrections from trend breaks, etc.) | |
| 3.003 | Climate (degree-days and fraction room heating) | |
| 3.004 | GDP growth (GDP growth rate) | |
| 3.005 | Structure, main sectors (growth rate main sectors) | |
| 3.006 | Structure, subsectors (growth rate per subsector) | |
| 3.007 | Structure, final demand (Reference final demand per subsector) | |
| 3.008 | Savings, final demand (Actual final heat/electricity demand) | |
| 3.009 | Conversion efficiency end-users (Actual efficiency boilers, etc.) | |
| 3.010 | Cogeneration end-users (actual CHP figures) | |
| 3.011 | Fuel-mix end-users (Actual energy use) | |
| 3.012 | Export (Actual energy exports) | |
| 3.013 | Structure energy transformation sectors (reference use refineries/gas supply) | |
| 3.014 | Cogeneration energy transformation sectors (actual cogeneration figures) | |
| 3.015 | Efficiency energy transformation sectors (actual conversion efficiencies) | |
| 3.016 | Import (actual energy imports) | |
| 3.017 | Fuel-mix electricity production sectors (actual energy use) | |
| Broto and Bulkeley (2013) | 4.001 | Country |
| 4.002 | Urban area | |
| 4.003 | Population | |
| 4.004 | Density | |
| 4.005 | GDP | |
| 4.006 | GDP per capita | |
| 4.007 | World City Rank | |
| 4.008 | Annual population rank | |
| 4.009 | Location | |
| 4.010 | Dates | |
| 4.011 | Urban character | |
| 4.012 | Type of experiment | |
| 4.013 | Objectives | |
| 4.014 | Type of innovation | |
| 4.015 | Institutional factors | |
| 4.016 | Sector specific information | |
| 4.017 | Actors involved | |
| 4.018 | Funding | |
| 4.019 | Mode of governance | |
| 4.020 | Environmental justice | |
| 4.021 | Action targeted sectors | |
| 4.022 | Action type of schemes | |
| CoM (2010) | 5.001 | Overall CO2 reduction target |
| 5.002 | Vision | |
| 5.003 | Coordination and organizational structures created/assigned | |
| 5.004 | Staff capacity allocated | |
| 5.005 | Involvement of stakeholders and citizens | |
| 5.006 | Overall estimated budget for the Sustainable Energy Action Plan implementation | |
| 5.007 | Foreseen financing sources for the implementation | |
| 5.008 | Monitoring process | |
| 5.009 | Year | |
| 5.010 | Population | |
| 5.011 | Final energy consumption per sector and carrier | |
| 5.012 | Energy supply sources | |
| 5.013 | CO2 emissions per sector and carrier | |
| 5.014 | Date of approval | |
| 5.015 | Decision body approving the plan | |
| 5.016 | Business-as-usual projections | |
| 5.017 | Area of intervention | |
| 5.018 | Policy instrument | |
| 5.019 | Origin of the action (local or other) | |
| 5.020 | Responsible body | |
| 5.021 | Implementation timeframe | |
| 5.022 | Estimated implementation cost | |
| 5.023 | Energy savings | |
| 5.024 | Renewable energy production | |
| 5.025 | CO2 reduction | |
| 5.026 | Newest inventory year | |
| 5.027 | Population | |
| 5.028 | Final energy consumption per sector and carrier | |
| 5.029 | Energy supply sources | |
| 5.030 | CO2 emissions per sector and carrier | |
| 5.031 | Status implementation | |
| 5.032 | Implementation cost spent so far | |
| 5.033 | Renewable energy production from actions implemented so far | |
| 5.034 | CO2 reduction from actions implemented so far | |
| Corfee-Morlot et al. (2009) | 6.001 | Coherent multi-level policy framework (vertically and horizontally) |
| 6.002 | Existence of a dedicated institution/agency to deal with climate change mitigation actions/plans | |
| 6.003 | Local authority’s capacity and expertise on climate change mitigation | |
| 6.004 | Local authority’s ability to obtain funding | |
| 6.005 | Local authority’s responsibility and competences | |
| 6.006 | Support from central governments to local policies | |
| Farla and Blok (2000) | 7.001 | Total dwelling area |
| 7.002 | Average number of inhabitants | |
| 7.003 | Number of appliances per type | |
| 7.004 | Number of vehicle-kilometers of personal cars per fuel | |
| 7.005 | Number of passenger-kilometers per mode (except car) | |
| 7.006 | Number of vehicle-kilometers of freight road transportation | |
| 7.007 | Number of ton-kilometers per mode (other freight transportation) | |
| 7.008 | Number of employee-years | |
| 7.009 | Production of goods per type (piece, kg or m2) | |
| 7.010 | Cultivated land area | |
| 7.011 | Raising of cattle, pigs and chickens | |
| 7.012 | Volume index of production | |
| Fortes et al. (2014) | 8.001 | Gross domestic product (GDP) |
| 8.002 | Population | |
| 8.003 | Private consumption | |
| 8.004 | Gross value-added Agriculture | |
| 8.005 | Gross value-added Services | |
| 8.006 | Gross value-added Transports | |
| 8.007 | Gross value-added Industry | |
| Fortes et al. (2015) | 9.001 | Annual growth rate of the socio-economic indicator |
| 9.002 | Demand elasticity | |
| 9.003 | Autonomous efficiency improvement factor (industrial sectors) | |
| 9.004 | Energy and environmental policies | |
| 9.005 | Energy and environmental policy instruments | |
| 9.006 | Technical and costs evolution | |
| 9.007 | Availability and capacity limits | |
| 9.008 | Other information (discount rate, etc.) | |
| 9.009 | Endogenous resources potential and prices | |
| 9.010 | Import/export prices and boundaries | |
| Gustavsson et al. (2009) | 10.001 | Actors involved in local Climate Change mitigation |
| 10.002 | Formulation of the climate-policy strategy | |
| 10.003 | Results in terms of GHG emissions reduction | |
| 10.004 | Geography | |
| 10.005 | Business structure | |
| 10.006 | Physical circumstances | |
| 10.007 | Actors involvement | |
| Gysen et al. (2002) | 11.001 | Objectives |
| 11.002 | Instruments | |
| 11.003 | Means—Societal | |
| 11.004 | Means—Policy process | |
| 11.005 | Policy output | |
| 11.006 | Policy outcome | |
| 11.007 | Policy impact | |
| IAEA (2006) | 12.001 | Total population |
| 12.002 | Average annual growth rate of population | |
| 12.003 | Share of urban population | |
| 12.004 | Average household size in urban areas | |
| 12.005 | Average household size in rural areas | |
| 12.006 | Share of population of age 15–64 in total population | |
| 12.007 | Share of potential labor force actually working | |
| 12.008 | Share of population living in large cities | |
| 12.009 | GDP | |
| 12.010 | Average annual growth rate of GDP | |
| 12.011 | Distribution of GDP formation by kind of economic activity | |
| 12.012 | Distribution of sector gross value-added by subsectors | |
| 12.013 | Energy intensities in industry | |
| 12.014 | Penetration of energy carriers into useful thermal energy demand of the different sectors | |
| 12.015 | Average efficiencies of fuels for thermal uses per sector | |
| 12.016 | Share of transportation modes in the total demand for freight transportation | |
| 12.017 | Energy intensity of freight transportation modes | |
| 12.018 | Average intracity distance traveled per person per day | |
| 12.019 | Average load factor of intracity passenger transportation mode(s) | |
| 12.020 | Share of transportation mode(s) in the total demand for intracity passenger transportation | |
| 12.021 | Energy intensity of transportation mode(s) in intracity travel | |
| 12.022 | Average intercity distance traveled per person per day | |
| 12.023 | Inverse of car ownership ratio | |
| 12.024 | Average intercity distance driven per car per year | |
| 12.025 | Average load factor of intercity transportation mode(s) | |
| 12.026 | Share of car type(s) in the intercity transportation mode(s) | |
| 12.027 | Share of public transportation mode(s) in the intercity passenger travel by public modes | |
| 12.028 | Energy intensity of transportation mode(s) | |
| 12.029 | Fraction of urban dwellings in areas where space heating is required | |
| 12.030 | Degree days for urban dwellings | |
| 12.031 | Fraction of urban dwellings per type | |
| 12.032 | Average size of urban dwellings by type | |
| 12.033 | Fraction of floor area that is actually heated in urban areas per dwelling type | |
| 12.034 | Specific heat loss rate by urban dwelling type | |
| 12.035 | Share of urban dwellings with air conditioning, by dwelling type | |
| 12.036 | Specific cooling requirements by urban dwelling type | |
| 12.037 | Specific energy consumption for cooking in urban dwellings | |
| 12.038 | Share of urban dwellings with hot water facilities | |
| 12.039 | Specific energy consumption per urban dwelling for electric appliances | |
| 12.040 | Electricity penetration for appliances in urban households | |
| IAEA (2006) | 12.041 | Specific fossil fuel consumption per urban dwelling for lighting and non-electric appliances |
| 12.042 | Penetration of various energy forms into space heating in urban households | |
| 12.043 | Efficiency of various fuels use, relative to that of electricity use, for space heating in urban households | |
| 12.044 | Coefficient of performance of heat pumps for space heating in urban households | |
| 12.045 | Penetration of various energy forms into water heating in urban households | |
| 12.046 | Efficiency of various fuels use, relative to that of electricity use, for water heating in urban households | |
| 12.047 | Coefficient of performance of heat pumps for water heating in urban households | |
| 12.048 | Approximate share of water heating demand in urban households that can be met with solar installations | |
| 12.049 | Penetration of various energy forms into cooking in urban households | |
| 12.050 | Efficiency of various fuels use, relative to that of electricity, for cooking in urban households | |
| 12.051 | Approximate share of cooking demand in urban households that can be met with solar installations | |
| 12.052 | Share of air conditioning demand of urban households that can be met with electricity | |
| 12.053 | Coefficient of performance of electric air conditioning in urban households | |
| 12.054 | Coefficient of performance of non-electric air conditioning in urban households | |
| 12.055 | Fraction of rural dwellings in areas where space heating is required | |
| 12.056 | Degree days for rural dwellings | |
| 12.057 | Fraction of rural dwellings per type | |
| 12.058 | Average size of rural dwellings by type | |
| 12.059 | Fraction of floor area that is actually heated in rural areas per dwelling type | |
| 12.060 | Specific heat loss rate by rural dwelling type | |
| 12.061 | Share of rural dwellings with air conditioning, by dwelling type | |
| 12.062 | Specific cooling requirements by rural dwelling type | |
| 12.063 | Specific energy consumption for cooking in rural dwellings | |
| 12.064 | Share of rural dwellings with hot water facilities | |
| 12.065 | Specific energy consumption per rural dwelling for electric appliances | |
| 12.066 | Electricity penetration for appliances in rural households | |
| 12.067 | Specific fossil fuel consumption per rural dwelling for lighting and non-electric appliances | |
| 12.068 | Penetration of various energy forms into space heating in rural households | |
| 12.069 | Efficiency of various fuels use, relative to that of electricity use, for space heating in rural households | |
| 12.070 | Coefficient of performance of heat pumps for space heating in rural households | |
| 12.071 | Penetration of various energy forms into water heating in rural households | |
| 12.072 | Efficiency of various fuels use, relative to that of electricity use, for water heating in rural households | |
| 12.073 | Coefficient of performance of heat pumps for water heating in rural households | |
| 12.074 | Approximate share of water heating demand in rural households that can be met with solar installations | |
| IAEA (2006) | 12.075 | Penetration of various energy forms into cooking in rural households |
| 12.076 | Efficiency of various fuels use, relative to that of electricity, for cooking in rural households | |
| 12.077 | Approximate share of cooking demand in rural households that can be met with solar installations | |
| 12.078 | Share of air conditioning demand of rural households that can be met with electricity | |
| 12.079 | Coefficient of performance of electric air conditioning in rural households | |
| 12.080 | Coefficient of performance of non-electric air conditioning in rural households | |
| 12.081 | Share of service sector in the total active labor force | |
| 12.082 | Average floor area per employee in the Service sector | |
| 12.083 | Share of Service sector floor area requiring space heating | |
| 12.084 | Share of Service sector floor area requiring space heating that is actually heated | |
| 12.085 | Specific space heat requirements of Service sector floor area | |
| 12.086 | Share of air-conditioned Service sector floor area | |
| 12.087 | Specific cooling requirements in the Service sector | |
| 12.088 | Energy intensity of motor fuel use per Services’ subsector | |
| 12.089 | Energy intensity of electricity specific uses per Services’ subsector | |
| 12.090 | Energy intensity of thermal uses (except space heating) per Services’ subsector | |
| 12.091 | Penetration of various energy forms into space heating in Service sector | |
| 12.092 | Penetration of various energy forms into other thermal uses in the Service sector | |
| 12.093 | Efficiency of various fuels use, relative to that of electricity use, for thermal uses in Service sector | |
| 12.094 | Coefficient of performance of heat pumps in space heating in Service sector | |
| 12.095 | Share of low-rise buildings in the total Service sector floor area | |
| 12.096 | Approximate share of thermal uses in the Service sector that can be met by solar installations | |
| 12.097 | Share of air-conditioning that can be met with electricity | |
| 12.098 | Coefficient of performance of electric air conditioning in Service sector | |
| 12.099 | Coefficient of performance of non-electric air conditioning in Service sector | |
| IEA (2014) | 13.001 | Population |
| 13.002 | Floor area per capita | |
| 13.003 | Persons per household | |
| 13.004 | Appliances ownership per capita | |
| 13.005 | Heat per floor area | |
| 13.006 | Domestic how water energy per capita | |
| 13.007 | Cooking energy per capita | |
| 13.008 | Electricity for lighting per floor area | |
| 13.009 | Energy per appliance | |
| 13.010 | Passenger-kilometers | |
| 13.011 | Share of total passenger-kilometers by mode | |
| 13.012 | Energy per passenger-kilometer by mode | |
| 13.013 | Tons-kilometers | |
| 13.014 | Share of total ton-kilometers by mode | |
| 13.015 | Energy per ton-kilometer by mode | |
| 13.016 | Services value-added | |
| 13.017 | Energy per value-added (services) | |
| 13.018 | Industry subsectors value-added | |
| 13.019 | Share of total value-added by subsector | |
| 13.020 | Energy per value-added by subsector | |
| 13.021 | Agriculture value-Added | |
| 13.022 | Share of total value-added by subsector | |
| 13.023 | Energy per value-added by subsector | |
| 13.024 | Changes in CO2 intensity | |
| 13.025 | Changes in input coefficients | |
| 13.026 | Changes in the composition of final demand | |
| 13.027 | Changes in the level of final demand (economic growth) | |
| Jovanovic et al. (2010) | 14.001 | Population growth |
| 14.002 | Persons per household | |
| 14.003 | Share of the potential labor force | |
| 14.004 | Share of the population outside the community | |
| 14.005 | Share of rural population | |
| 14.006 | GDP | |
| 14.007 | GDP growth rate | |
| 14.008 | Monetary values per capita of the major sectors and subsectors | |
| 14.009 | Efficiency of appliances/vehicles | |
| 14.010 | Buildings insulation | |
| Kasperson et al. (1995) | 15.001 | Population growth |
| 15.002 | Migration | |
| 15.003 | Natural growth | |
| 15.004 | Irrigation development | |
| 15.005 | Mechanization | |
| 15.006 | Fertilization | |
| 15.007 | Pasture improvement | |
| 15.008 | Industrialization infrastructure | |
| 15.009 | Agricultural intensification | |
| 15.010 | Urbanization | |
| 15.011 | Poverty | |
| 15.012 | International market | |
| 15.013 | National market | |
| 15.014 | State policy | |
| 15.015 | Shift to commodity production | |
| 15.016 | Foreign debt, balance of trade | |
| 15.017 | Resource allocation rules and institutions | |
| 15.018 | Capital extraction | |
| 15.019 | Political corruption | |
| 15.020 | Frontier development | |
| 15.021 | Ethnic/religious views | |
| 15.022 | Mass-consuming view of nature | |
| 15.023 | Acceptance of corruption | |
| Lin et al. (2010) | 16.001 | Population |
| 16.002 | Population growth rate | |
| 16.003 | Size of households | |
| 16.004 | Number of households | |
| 16.005 | GDP | |
| 16.006 | Growth rate of GDP | |
| 16.007 | Measures and policies already promulgated | |
| 16.008 | Measure/Action | |
| 16.009 | Intensity of measure (degree of implementation) | |
| 16.010 | Competences of local authorities in implementation fields | |
| 16.011 | Investment costs | |
| 16.012 | Implementation experiences | |
| Millard-Ball (2012) | 17.001 | Population |
| 17.002 | Employment | |
| 17.003 | Average income | |
| 17.004 | Education | |
| 17.005 | Environmental voting | |
| 17.006 | Civic | |
| 17.007 | Non-residential building | |
| 17.008 | Latitude | |
| 17.009 | Ped/bike mode share | |
| 17.010 | Time | |
| 17.011 | Number of certified buildings | |
| 17.012 | Share of renewable energy sources electricity microgeneration | |
| 17.013 | Street lighting expenditure | |
| 17.014 | Use of soft modes | |
| Morlet and Keirstead (2013) | 18.001 | City power (EU, 2007) |
| 18.002 | City size (population) | |
| 18.003 | Legal structure and status | |
| 18.004 | Spending power | |
| 18.005 | Control over income | |
| 18.006 | Civic involvement (voting patterns) | |
| 18.007 | Herfindahl–Hirschman index (degree of competition in the national electricity system) | |
| 18.008 | Degree of electricity generated in combined heat and power systems | |
| 18.009 | City’s population | |
| 18.010 | Wealth (GDP per capita) | |
| 18.011 | Climate (Heating Degree Days) | |
| 18.012 | Price of energy (gas and electricity) and relative share of any taxes or levies—energy costs | |
| 18.013 | Carbon intensity of fuels | |
| 18.014 | Targets set by each city for GHG emissions reductions | |
| 18.015 | Annual energy demand | |
| 18.016 | Policy type (Financial/Non-financial) | |
| Murphy et al. (2012) | 19.001 | Policy instrument combinations |
| 19.002 | Obligating/Incentivizing balance | |
| 19.003 | Long-term program | |
| 19.004 | Non-generic instruments | |
| 19.005 | Primacy to energy efficiency | |
| 19.006 | Whole house/deep retrofit | |
| 19.007 | Energy sufficiency | |
| 19.008 | Policy theory associated with instruments applied | |
| 19.009 | Description of the impact of instruments (secondary sources and interviews) | |
| Nassen (2014) | 20.001 | Total consumption |
| 20.002 | Household size | |
| 20.003 | Age of occupants | |
| 20.004 | Education of occupants | |
| 20.005 | Dwelling type | |
| 20.006 | Urbanity | |
| Neji and Astrand (2006) | 21.001 | Changes in knowledge |
| 21.002 | Awareness and behavior of important actors | |
| 21.003 | Technology performance | |
| 21.004 | Price development | |
| 21.005 | Sales data | |
| 21.006 | Market share | |
| 21.007 | Changes in manufacturers assortment | |
| Praznik et al. (2013) | 22.001 | Surface area to volume ratio |
| 22.002 | Orientation of the facades’ transparent elements | |
| 22.003 | Thermal zoning of the building and the separation of its unheated parts from the thermal envelope | |
| 22.004 | Heated area per occupant | |
| Rai and Robinson (2015) | 23.001 | Attitude factors |
| 23.002 | Economic factors | |
| 23.003 | Social factors (impact on agents’ attitude) | |
| Schipper et al. (2001) | 24.001 | Population |
| 24.002 | Floor area per capita | |
| 24.003 | Persons per household | |
| 24.004 | Appliances ownership per capita | |
| 24.005 | Intensity for different uses | |
| 24.006 | Total passenger-kilometers | |
| 24.007 | Distribution of passenger-kilometers per mode | |
| 24.008 | Energy/passenger-kilometer per mode | |
| 24.009 | Distribution of value-added per subsector | |
| 24.010 | Average energy/value-added per subsector | |
| Sobrino and Monzon (2014) | 25.001 | Carbon intensity of road transport |
| 25.002 | Energy intensity of road transport | |
| 25.003 | Use intensity | |
| 25.004 | Motorization rate | |
| 25.005 | Job intensity | |
| 25.006 | Workers income intensity | |
| 25.007 | GDP | |
| Spyridaki and Flamos (2014) | 26.001 | Electricity market structure and design |
| 26.002 | Interconnection of domestic electricity markets in Europe | |
| 26.003 | Primary factor: labor, capital, conventional and non-conventional resources | |
| 26.004 | Supply and demand parameters | |
| 26.005 | Incumbent policy framework included in the reference scenario | |
| 26.006 | Different renewable energy sources penetration levels | |
| 26.007 | Renewable energy source potential | |
| 26.008 | Efficiency of the whole electricity system | |
| 26.009 | Emissions of other air pollutants | |
| 26.010 | Discount rate for investments | |
| 26.011 | Firm behavior | |
| 26.012 | Allowance trade patterns among regions | |
| 26.013 | Socio-demographic and lifestyle trends | |
| 26.014 | Interconnection of domestic electricity markets in Europe | |
| 26.015 | Political context in which policy instruments are imposed | |
| 26.016 | Supply and demand parameters | |
| 26.017 | Firm behavior | |
| 26.018 | Simplification in technology production options and load segments of electricity production | |
| 26.019 | Limited analysis of constraints in output | |
| 26.020 | Slope of demand and supply curves | |
| 26.021 | Electricity market structure and design | |
| 26.022 | Technology market failures and other externalities related to electricity generation design | |
| 26.023 | Trading options | |
| 26.024 | Banking of emissions | |
| 26.025 | Alternative compliance payments | |
| 26.026 | Distinctions between price based or quantity-based policy instruments with variations in prices and quotas for commodities | |
| 26.027 | Uniform/Differentiated feed in tariff rate | |
| 26.028 | Phase in of Renewable Portfolio Standard | |
| 26.029 | Annual digression rate of feed in tariff rate | |
| 26.030 | Limitation of the payment period | |
| 26.031 | Tariff reduction due to inflation | |
| 26.032 | Distinctions between price based or quantity-based policy instruments with variations in prices and quotas for commodities | |
| 26.033 | International emissions trading | |
| 26.034 | Uniform and unilateral imposition of carbon taxes across all EU-ETS regions | |
| 26.035 | Lump-sum treatment of additional tax revenues | |
| 26.036 | Stringency levels | |
| 26.037 | Different application scope | |
| 26.038 | Nature of targets, the target groups, the policy-implementing agents, the available budget, the available information on the initially expected energy-savings impact, and the cost effectiveness of the instrument | |
| Spyridaki and Flamos (2014) | 26.039 | Distinctions between price-based or quantity-based policy instruments |
| 26.040 | Different renewable energy sources and support design elements | |
| 26.041 | Variable scenarios in the short and long run for key policy parameters such as price of certificate, level of obligation, level of sales tax and the level of penalty | |
| 26.042 | Fixed-price policies and endogenous price policies | |
| 26.043 | Technology specific hurdle rates reflecting market barriers, consumer preferences and risk factors limiting purchase of new energy technologies | |
| 26.044 | Conditions for implementation and proper utilization of saving options (technology equipment availability, familiarity with the policy, overcoming barriers, motivation to invest) | |
| 26.045 | Specific implementation of policy instruments with regard to their funding | |
| 26.046 | Transaction costs | |
| 26.047 | Stability and credibility in policy regime | |
| 26.048 | Implementation period of the policy instrument | |
| 26.049 | Circumstances in which to apply a policy instrument (challenges in addressing different target groups, challenges in addressing different scopes, addressing a financial, knowledge barrier, internalizing externalities, addressing market competition, conditions under which a policy combination is required, conditions of policy redundancy) | |
| 26.050 | Implicit and explicit assumptions in the policy implementation process and mapping the cause-impact relationships | |
| 26.051 | Transaction costs related to the combined policy cycle | |
| 26.052 | Regulatory decisions on the additionality of energy savings from individual projects | |
| Tang et al. (2010) | 27.001 | Political will |
| 27.002 | State-level mandates concerning climate change (national) | |
| 27.003 | Wealth | |
| 27.004 | Coastal distance | |
| 27.005 | Population density | |
| 27.006 | Hazard damage | |
| 27.007 | Energy consumption | |
| 27.008 | Light transportation (soft modes and public transportation) | |
| 27.009 | Average commuting time | |
| 27.010 | Vehicular emission | |
| 27.015 | Concept of climate change or global warming | |
| 27.016 | Concept of GHG emission | |
| 27.017 | Effects and impact of climate change | |
| 27.018 | Long-term goals and detailed targets for GHG emissions | |
| 27.019 | Emissions inventory | |
| 27.020 | Base year emissions | |
| 27.021 | Emissions trend forecast | |
| 27.022 | Vulnerability assessment | |
| 27.023 | Cost estimates for GHG emissions reduction | |
| 27.024 | Using analysis tools | |
| 27.025 | Public awareness, education, and participation | |
| Tang et al. (2010) | 27.026 | Inter-organizational coordination procedures |
| 27.027 | GHG emissions reduction fee | |
| 27.028 | Establish a carbon tax | |
| 27.029 | Disaster resistant land use and building code | |
| 27.030 | Mixed use and compact development | |
| 27.031 | Infill development and reuse of remediated brownfield sites | |
| 27.032 | Green building and green infrastructure | |
| 27.033 | Low-impact design for impervious surface | |
| 27.034 | Control of urban service/growth boundaries | |
| 27.035 | Alternative transportation strategies | |
| 27.036 | Transit-oriented development and corridor improvements | |
| 27.037 | Parking standards adjustment | |
| 27.038 | Pedestrian/resident friendly, bicycle friendly, transit-oriented community design | |
| 27.039 | Renewable energy and solar energy | |
| 27.040 | Energy efficiency and energy stars | |
| 27.041 | Landfill methane capture strategies | |
| 27.042 | Zero waste reduction and high recycling strategy | |
| 27.043 | Creation of conservation zones or protected areas | |
| 27.044 | Watershed-based and ecosystem-based land management | |
| 27.045 | Vegetation protection | |
| 27.046 | Establish implementation priorities for actions | |
| 27.047 | Financial/budget commitment | |
| 27.048 | Identify roles and responsibilities among sectors and stakeholders | |
| 27.049 | Continuous monitoring, evaluation and update | |
| 27.050 | Overall energy efficiency gains | |
| 27.051 | Final intensity | |
| 27.052 | Primary intensity | |
| 27.053 | Energy efficiency gains | |
| 27.054 | Energy intensity (industry, manufacturing, chemicals, European Union structure) | |
| 27.055 | Specific consumption (steel, cement, paper) | |
| 27.056 | Energy efficiency gains | |
| 27.057 | Consumption per unit of traffic (road car equivalent, freight, air) | |
| 27.058 | Car efficiency (fleet average, new cars) | |
| 27.059 | Mobility in transport (public transport, freight) | |
| 27.060 | Energy efficiency gains | |
| 27.061 | Consumption per dwelling (total, electricity, scaled to European Union climate) | |
| 27.062 | Heating consumption (per dwelling, per m2) | |
| 27.063 | Energy consumption per employee (total, electricity) | |
| 27.064 | Energy intensity (total, electricity) |
| Code | Variable |
|---|---|
| 1.004 | Recent change in government |
| 1.005 | Presence of champions |
| 1.008 | International processes |
| 1.009 | Focusing events |
| 1.010 | Action of feedback mechanism |
| 4.007 | World City Rank |
| 4.009 | Location |
| 9.002 | Demand elasticity |
| 9.009 | Endogenous resources potential and prices |
| 9.010 | Import/export prices and boundaries |
| 10.003 | Results in terms of GHG emissions reduction |
| 10.004 | Geography |
| 10.005 | Business structure |
| 10.006 | Physical circumstances |
| 11.005 | Policy output |
| 11.006 | Policy outcome |
| 11.007 | Policy impact |
| 12.008 | Share of population living in large cities |
| 12.037 | Specific energy consumption for cooking in urban dwellings |
| 12.039 | Specific energy consumption per urban dwelling for electric appliances |
| 12.041 | Specific fossil fuel consumption per urban dwelling for lighting and non-electric appliances |
| 12.063 | Specific energy consumption for cooking in rural dwellings |
| 12.065 | Specific energy consumption per rural dwelling for electric appliances |
| 12.067 | Specific fossil fuel consumption per rural dwelling for lighting and non-electric appliances |
| 15.006 | Fertilization |
| 15.007 | Pasture improvement |
| 15.015 | Shift to commodity production |
| 15.016 | Foreign debt, balance of trade |
| 15.017 | Resource allocation rules and institutions |
| 15.018 | Capital extraction |
| 15.019 | Political corruption |
| 15.020 | Frontier development |
| 15.023 | Acceptance of corruption |
| 17.007 | Non-residential building |
| 17.008 | Latitude |
| 17.011 | Number of certified buildings |
| 17.013 | Street lighting expenditure |
| 18.007 | Herfindahl–Hirschman index (degree of competition in the national electricity system) |
| 18.013 | Carbon intensity of fuels |
| 18.015 | Annual energy demand |
| 20.001 | Total consumption |
| 21.007 | Changes in manufacturers assortment |
| 22.001 | Surface area to volume ratio |
| 22.002 | Orientation of the facades’ transparent elements |
| 22.003 | Thermal zoning of the building and the separation of its unheated parts from the thermal envelope |
| 22.004 | Heated area per occupant |
| 26.001 | Electricity market structure and design |
| 26.002 | Interconnection of domestic electricity markets in Europe |
| 26.003 | Primary factor: labor, capital, conventional and non-conventional resources |
| 26.004 | Supply and demand parameters |
| 26.005 | Incumbent policy framework included in the reference scenario |
| 26.007 | Renewable energy source potential |
| 26.009 | Emissions of other air pollutants |
| 26.011 | Firm behavior |
| 26.012 | Allowance trade patterns among regions |
| 26.014 | Interconnection of domestic electricity markets in Europe |
| 26.016 | Supply and demand parameters |
| 26.017 | Firm behavior |
| 26.019 | Limited analysis of constraints in output |
| 26.020 | Slope of demand and supply curves |
| 26.049 | Circumstances in which to apply policy instrument (challenges in addressing different target groups, challenges in addressing different scopes, addressing a financial, knowledge barrier, internalizing externalities, addressing market competition, conditions under which a policy combination is required, conditions of policy redundancy) |
| 26.050 | Implicit and explicit assumptions in the policy implementation process and mapping the cause-impact relationships |
| 26.051 | Transaction costs related to the combined policy cycle |
| 26.052 | Regulatory decisions on the additionality of energy savings from individual projects |
| 27.004 | Coastal distance |
| 27.006 | Hazard damage |
| 27.007 | Energy consumption |
| 27.019 | Emissions inventory |
| 27.020 | Base year emissions |
| 27.022 | Vulnerability assessment |
| 27.024 | Using analysis tools |
| 27.062 | Heating consumption (per dwelling, per m2) |
| 27.063 | Energy consumption per employee (total, electricity) |
| Code | Variable |
|---|---|
| 1.011 | Timeframe |
| 1.013 | Policy instruments |
| 1.015 | Target of policy (actors) |
| 1.016 | Source of authority at different stages (Hybrid or Government) |
| 2.002 | Structure, main sectors |
| 2.003 | Structure, subsectors |
| 2.004 | Structure, final demand |
| 2.005 | Savings, final demand |
| 2.006 | Conversion efficiency end-users |
| 2.007 | Co-generation end-users |
| 2.008 | Fuel mix end-users |
| 2.009 | Export |
| 2.010 | Structure electricity production sectors |
| 2.011 | Co-generation electricity production sectors |
| 2.012 | Import |
| 2.013 | Fuel mix electricity production sectors |
| 3.004 | GDP growth (GDP growth rate) |
| 4.003 | Population |
| 4.004 | Density |
| 4.005 | GDP |
| 4.010 | Dates |
| 4.011 | Urban character |
| 4.017 | Actors involved |
| 4.020 | Environmental justice |
| 5.010 | Population |
| 5.027 | Population |
| 7.002 | Average number of inhabitants |
| 9.001 | Annual growth rate of the socio-economic indicator |
| 9.008 | Other information (discount rate, etc.) |
| 11.001 | Objectives |
| 11.002 | Instruments |
| 12.009 | GDP |
| 12.010 | Average annual growth rate of GDP |
| 12.011 | Distribution of GDP formation by kind of economic activity |
| 12.013 | Energy intensities in industry |
| 13.001 | Population |
| 13.002 | Floor area per capita |
| 13.003 | Persons per household |
| 13.004 | Appliances ownership per capita |
| 13.016 | Services value-added |
| 13.018 | Industry subsectors value-added |
| 13.021 | Agriculture value-Added |
| 14.006 | GDP |
| 16.001 | Population |
| 16.002 | Population growth rate |
| 16.003 | Size of households |
| 16.005 | GDP |
| 16.006 | Growth rate of GDP |
| 16.011 | Investment costs |
| 17.001 | Population |
| 17.006 | Civic |
| 17.010 | Time |
| 17.014 | Use of soft modes |
| 18.002 | City size (population) |
| 18.009 | City’s population |
| 18.010 | Wealth (GDP per capita) |
| 18.016 | Policy type (Financial/Non-financial) |
| 20.004 | Education of occupants |
| 20.006 | Urbanity |
| 24.001 | Population |
| 24.003 | Persons per household |
| 24.006 | Total passenger-kilometers |
| 24.007 | Distribution of passenger-kilometers per mode |
| 24.008 | Energy/passenger-kilometer per mode |
| 24.009 | Distribution of value-added per subsector |
| 25.007 | GDP |
| 26.008 | Efficiency of the whole electricity system |
| 26.048 | Implementation period of the policy instrument |
| 27.008 | Light transportation (soft modes and public transportation) |
| 27.023 | Cost estimates for GHG emissions reduction |
| 27.047 | Financial/budget commitment |
| 27.049 | Continuous monitoring, evaluation and update |
| 27.059 | Mobility in transport (public transport, freight) |
| 27.061 | Consumption per dwelling (total, electricity, scaled to European Union climate) |
| Code | Variable |
|---|---|
| 1.003 | Favorable party platform |
| 1.007 | Availability of technology |
| 1.012 | Reporting nature |
| 3.005 | Structure, main sectors (growth rate main sectors) |
| 3.006 | Structure, subsectors (growth rate per subsector) |
| 4.001 | Country |
| 4.002 | Urban area |
| 4.006 | GDP per capita |
| 4.008 | Annual population rank |
| 4.013 | Objectives |
| 4.016 | Sector specific information |
| 4.022 | Action type of schemes |
| 5.005 | Involvement of stakeholders and citizens |
| 5.009 | Year |
| 7.001 | Total dwelling area |
| 7.003 | Number of appliances per type |
| 7.004 | Number of vehicle-kilometers of personal cars per fuel |
| 7.005 | Number of passenger-kilometers per mode (except car) |
| 7.006 | Number of vehicle-kilometers of freight road transportation |
| 7.007 | Number of ton-kilometers per mode (other freight transportation) |
| 7.008 | Number of employee-years |
| 8.002 | Population |
| 9.003 | Autonomous efficiency improvement factor (industrial sectors) |
| 10.002 | Formulation of the climate-policy strategy |
| 10.007 | Actors involvement |
| 11.003 | Means—Societal |
| 12.001 | Total population |
| 12.002 | Average annual growth rate of population |
| 12.004 | Average household size in urban areas |
| 12.005 | Average household size in rural areas |
| 12.006 | Share of population of age 15–64 in total population |
| 12.016 | Share of transportation modes in the total demand for freight transportation |
| 12.017 | Energy intensity of freight transportation modes |
| 12.020 | Share of transportation mode(s) in the total demand for intracity passenger transportation |
| 12.021 | Energy intensity of transportation mode(s) in intracity travel |
| 12.027 | Share of public transportation mode(s) in the intercity passenger travel by public modes |
| 12.028 | Energy intensity of transportation mode(s) |
| 12.029 | Fraction of urban dwellings in areas where space heating is required |
| 12.030 | Degree days for urban dwellings |
| 12.031 | Fraction of urban dwellings per type |
| 12.032 | Average size of urban dwellings by type |
| 12.033 | Fraction of floor area that is actually heated in urban areas per dwelling type |
| 12.034 | Specific heat loss rate by urban dwelling type |
| 12.036 | Specific cooling requirements by urban dwelling type |
| 12.038 | Share of urban dwellings with hot water facilities |
| 12.055 | Fraction of rural dwellings in areas where space heating is required |
| 12.056 | Degree days for rural dwellings |
| 12.057 | Fraction of rural dwellings per type |
| 12.058 | Average size of rural dwellings by type |
| 12.059 | Fraction of floor area that is actually heated in rural areas per dwelling type |
| 12.060 | Specific heat loss rate by rural dwelling type |
| 12.062 | Specific cooling requirements by rural dwelling type |
| 12.064 | Share of rural dwellings with hot water facilities |
| 13.019 | Share of total value-added by subsector |
| 13.022 | Share of total value-added by subsector |
| 13.024 | Changes in CO2 intensity |
| 13.025 | Changes in input coefficients |
| 13.026 | Changes in the composition of final demand |
| 13.027 | Changes in the level of final demand (economic growth) |
| 14.005 | Share of rural population |
| 14.007 | GDP growth rate |
| 14.008 | Monetary values per capita of the major sectors and subsectors |
| 14.009 | Efficiency of appliances/vehicles |
| 15.009 | Agricultural intensification |
| 15.010 | Urbanization |
| 16.004 | Number of households |
| 16.010 | Competences of local authorities in implementation fields |
| 17.009 | Ped/bike mode share |
| 17.012 | Share of renewable energy sources electricity microgeneration |
| 18.001 | City power (EU, 2007) |
| 18.008 | Degree of electricity generated in combined heat and power systems |
| 18.011 | Climate (Heating Degree Days) |
| 18.014 | Targets set by each city for GHG emissions reductions |
| 19.001 | Policy instrument combinations |
| 19.002 | Obligating/Incentivizing balance |
| 19.003 | Long-term program |
| 19.004 | Non-generic instruments |
| 19.005 | Primacy to energy efficiency |
| 19.006 | Whole house/deep retrofit |
| 19.007 | Energy sufficiency |
| 20.002 | Household size |
| 21.001 | Changes in knowledge |
| 21.002 | Awareness and behavior of important actors |
| 21.003 | Technology performance |
| 21.006 | Market share |
| 25.001 | Carbon intensity of road transport |
| 25.002 | Energy intensity of road transport |
| 25.003 | Use intensity |
| 25.006 | Workers income intensity |
| 26.018 | Simplification in technology production options and load segments of electricity production |
| 26.023 | Trading options |
| 26.024 | Banking of emissions |
| 26.025 | Alternative compliance payments |
| 26.026 | Distinctions between price based or quantity-based policy instruments with variations in prices and quotas for commodities |
| 26.027 | Uniform/Differentiated feed in tariff rate |
| 26.028 | Phase in of Renewable Portfolio Standard |
| 26.029 | Annual digression rate of feed in tariff rate |
| 26.030 | Limitation of the payment period |
| 26.031 | Tariff reduction due to inflation |
| 26.032 | Distinctions between price based or quantity-based policy instruments with variations in prices and quotas for commodities |
| 26.033 | International emissions trading |
| 26.034 | Uniform and unilateral imposition of carbon taxes across all EU-ETS regions |
| 26.035 | Lump-sum treatment of additional tax revenues |
| 26.036 | Stringency levels |
| 26.037 | Different application scope |
| 26.038 | Nature of targets, the target groups, the policy-implementing agents, the available budget, the available information on the initially expected energy-savings impact, and the cost effectiveness of the instrument |
| 26.039 | Distinctions between price-based or quantity-based policy instruments |
| 26.040 | Different renewable energy sources and support design elements |
| 26.041 | Variable scenarios in the short and long run for key policy parameters such as price of certificate, level of obligation, level of sales tax and the level of penalty |
| 26.042 | Fixed-price policies and endogenous price policies |
| 26.043 | Technology specific hurdle rates reflecting market barriers, consumer preferences and risk factors limiting purchase of new energy technologies |
| 26.044 | Conditions for implementation and proper utilization of saving options (technology equipment availability, familiarity with the policy, overcoming barriers, motivation to invest) |
| 26.045 | Specific implementation of policy instruments with regard to their funding |
| 27.002 | State-level mandates concerning climate change (national) |
| 27.010 | Vehicular emission |
| 27.018 | Long-term goals and detailed targets for GHG emissions |
| 27.021 | Emissions trend forecast |
| 27.025 | Public awareness, education, and participation |
| 27.026 | Inter-organizational coordination procedures |
| 27.027 | GHG emissions reduction fee |
| 27.028 | Establish a carbon tax |
| 27.029 | Disaster resistant land use and building code |
| 27.030 | Mixed use and compact development |
| 27.031 | Infill development and reuse of remediated brownfield sites |
| 27.032 | Green building and green infrastructure |
| 27.033 | Low-impact design for impervious surface |
| 27.034 | Control of urban service/growth boundaries |
| 27.035 | Alternative transportation strategies |
| 27.036 | Transit-oriented development and corridor improvements |
| 27.037 | Parking standards adjustment |
| 27.038 | Pedestrian/resident friendly, bicycle friendly, transit-oriented community design |
| 27.039 | Renewable energy and solar energy |
| 27.040 | Energy efficiency and energy stars |
| 27.041 | Landfill methane capture strategies |
| 27.042 | Zero waste reduction and high recycling strategy |
| 27.043 | Creation of conservation zones or protected areas |
| 27.044 | Watershed-based and ecosystem-based land management |
| 27.045 | Vegetation protection |
| 27.048 | Identify roles and responsibilities among sectors and stakeholders |
| 27.050 | Overall energy efficiency gains |
| 27.053 | Energy efficiency gains |
| 27.054 | Energy intensity (industry, manufacturing, chemicals, European Union structure) |
| 27.055 | Specific consumption (steel, cement, paper) |
| 27.057 | Consumption per unit of traffic (road car equivalent, freight, air) |
| 27.058 | Car efficiency (fleet average, new cars) |
| 27.060 | Energy efficiency gains |
| Code | Variable |
|---|---|
| 1.002 | Favorable public opinion |
| 1.006 | Social appeal |
| 3.001 | Energy statistics (statistical figures) |
| 3.007 | Structure, final demand (Reference final demand per subsector) |
| 3.008 | Savings, final demand (Actual final heat/electricity demand) |
| 3.009 | Conversion efficiency end-users (Actual efficiency boilers, etc.) |
| 4.015 | Institutional factors |
| 4.019 | Mode of governance |
| 7.009 | Production of goods per type (piece, kg or m2) |
| 7.010 | Cultivated land area |
| 7.011 | Raising of cattle, pigs and chickens |
| 7.012 | Volume index of production |
| 8.001 | Gross domestic product (GDP) |
| 11.004 | Means—Policy process |
| 12.014 | Penetration of energy carriers into useful thermal energy demand of the different sectors |
| 12.018 | Average intracity distance traveled per person per day |
| 12.019 | Average load factor of intracity passenger transportation mode(s) |
| 12.022 | Average intercity distance traveled per person per day |
| 12.024 | Average intercity distance driven per car per year |
| 12.025 | Average load factor of intercity transportation mode(s) |
| 12.026 | Share of car type(s) in the intercity transportation mode(s) |
| 12.035 | Share of urban dwellings with air conditioning, by dwelling type |
| 12.040 | Electricity penetration for appliances in urban households |
| 12.042 | Penetration of various energy forms into space heating in urban households |
| 12.043 | Efficiency of various fuels use, relative to that of electricity use, for space heating in urban households |
| 12.044 | Coefficient of performance of heat pumps for space heating in urban households |
| 12.045 | Penetration of various energy forms into water heating in urban households |
| 12.046 | Efficiency of various fuels use, relative to that of electricity use, for water heating in urban households |
| 12.047 | Coefficient of performance of heat pumps for water heating in urban households |
| 12.048 | Approximate share of water heating demand in urban households that can be met with solar installations |
| 12.049 | Penetration of various energy forms into cooking in urban households |
| 12.050 | Efficiency of various fuels use, relative to that of electricity, for cooking in urban households |
| 12.051 | Approximate share of cooking demand in urban households that can be met with solar installations |
| 12.052 | Share of air conditioning demand of urban households that can be met with electricity |
| 12.053 | Coefficient of performance of electric air conditioning in urban households |
| 12.054 | Coefficient of performance of non-electric air conditioning in urban households |
| 12.061 | Share of rural dwellings with air conditioning, by dwelling type |
| 12.066 | Electricity penetration for appliances in rural households |
| 12.068 | Penetration of various energy forms into space heating in rural households |
| 12.069 | Efficiency of various fuels use, relative to that of electricity use, for space heating in rural households |
| 12.070 | Coefficient of performance of heat pumps for space heating in rural households |
| 12.071 | Penetration of various energy forms into water heating in rural households |
| 12.072 | Efficiency of various fuels use, relative to that of electricity use, for water heating in rural households |
| 12.073 | Coefficient of performance of heat pumps for water heating in rural households |
| 12.074 | Approximate share of water heating demand in rural households that can be met with solar installations |
| 12.075 | Penetration of various energy forms into cooking in rural households |
| 12.076 | Efficiency of various fuels use, relative to that of electricity, for cooking in rural households |
| 12.077 | Approximate share of cooking demand in rural households that can be met with solar installations |
| 12.078 | Share of air conditioning demand of rural households that can be met with electricity |
| 12.079 | Coefficient of performance of electric air conditioning in rural households |
| 12.080 | Coefficient of performance of non-electric air conditioning in rural households |
| 12.081 | Share of service sector in the total active labor force |
| 12.082 | Average floor area per employee in the Service sector |
| 12.083 | Share of Service sector floor area requiring space heating |
| 12.084 | Share of Service sector floor area requiring space heating that is actually heated |
| 12.085 | Specific space heat requirements of Service sector floor area |
| 12.086 | Share of air-conditioned Service sector floor area |
| 12.087 | Specific cooling requirements in the Service sector |
| 12.088 | Energy intensity of motor fuel use per Services’ subsector |
| 12.089 | Energy intensity of electricity specific uses per Services’ subsector |
| 12.090 | Energy intensity of thermal uses (except space heating) per Services’ subsector |
| 12.091 | Penetration of various energy forms into space heating in Service sector |
| 12.092 | Penetration of various energy forms into other thermal uses in the Service sector |
| 12.093 | Efficiency of various fuels use, relative to that of electricity use, for thermal uses in Service sector |
| 12.094 | Coefficient of performance of heat pumps in space heating in Service sector |
| 12.095 | Share of low-rise buildings in the total Service sector floor area |
| 12.096 | Approximate share of thermal uses in the Service sector that can be met by solar installations |
| 12.097 | Share of air-conditioning that can be met with electricity |
| 12.098 | Coefficient of performance of electric air conditioning in Service sector |
| 12.099 | Coefficient of performance of non-electric air conditioning in Service sector |
| 13.009 | Energy per appliance |
| 13.013 | Tons-kilometers |
| 13.014 | Share of total ton-kilometers by mode |
| 13.020 | Energy per value-added by subsector |
| 14.001 | Population growth |
| 14.004 | Share of the population outside the community |
| 15.004 | Irrigation development |
| 15.005 | Mechanization |
| 15.008 | Industrialization infrastructure |
| 15.011 | Poverty |
| 15.014 | State policy |
| 15.022 | Mass-consuming view of nature |
| 16.007 | Measures and policies already promulgated |
| 16.012 | Implementation experiences |
| 17.003 | Average income |
| 17.005 | Environmental voting |
| 18.003 | Legal structure and status |
| 18.004 | Spending power |
| 18.005 | Control over income |
| 20.003 | Age of occupants |
| 20.005 | Dwelling type |
| 21.004 | Price development |
| 21.005 | Sales data |
| 23.001 | Attitude factors |
| 23.002 | Economic factors |
| 23.003 | Social factors (impact on agents’ attitude) |
| 24.010 | Average energy/value-added per subsector |
| 25.004 | Motorization rate |
| 25.005 | Job intensity |
| 26.006 | Different renewable energy sources penetration levels |
| 26.010 | Discount rate for investments |
| 26.013 | Socio-demographic and lifestyle trends |
| 26.015 | Political context in which policy instruments are imposed |
| 26.046 | Transaction costs |
| 26.047 | Stability and credibility in policy regime |
| 27.001 | Political will |
| 27.003 | Wealth |
| 27.005 | Population density |
| 27.051 | Final intensity |
| 27.052 | Primary intensity |
References
- Meeus, L.; Oliveira Fernandes, E.; Delarure, E.; Azevedo, I.; Leal, V.M.S.; Glachant, J.M. Smart Cities Initiative: How to Foster A Quick Transition towards Local Sustainable Energy Systems; THINK Project, EU 7th Framework Programme; European University Institute: Florence, Italy, 2011. [Google Scholar]
- Azevedo, I.; Leal, V.M.S. Methodologies for the evaluation of local climate change mitigation actions: A review. Renew. Sustain. Energy Rev. 2017, 79, 681–690. [Google Scholar] [CrossRef]
- Millard-Ball, A. Do city climate plans reduce emissions? J. Urban Econ. 2012, 71, 289–311. [Google Scholar] [CrossRef]
- Millard-Ball, A. The Limits to Planning: Causal Impacts of City Climate Action Plans. J. Plan. Educ. Res. 2012, 33, 5–19. [Google Scholar] [CrossRef]
- Azevedo, I.; Horta, I.; Leal, V.M.S. Analysis of the relationship between local climate change mitigation actions and greenhouse gas emissions-Empirical insights. Energy Policy 2017, 111, 204–2013. [Google Scholar] [CrossRef]
- Pullin, A.S.; Knight, T.M. Data credibility: A perspective from systematic reviews in environmental management. New Dir. Eval. 2009, 122, 65–74. [Google Scholar] [CrossRef]
- Auld, G.; Mallett, A.; Burlica, B.; Nolan-Poupart, F.; Slater, R. Evaluating the effects of policy innovations: Lessons from a systematic review of policies promoting low-carbon technology. Glob. Environ. Chang. 2014, 29, 444–458. [Google Scholar] [CrossRef]
- Boonekamp, P.G.M. Energy and emission monitoring for policy use-Trend analysis with reconstructed energy balances. Energy Policy 2004, 32, 969–988. [Google Scholar] [CrossRef]
- Boonekamp, P.G.M. Improved Methods to Evaluate Realised Energy Savings; Proefschrift Universiteit Utrecht: Utrecht, The Netherlands, 2005. [Google Scholar]
- Broto, V.C.; Bulkeley, H. A survey of urban climate change experiments in 100 cities. Glob. Environ. Chang. 2013, 23, 92–102. [Google Scholar] [CrossRef]
- Covenant of Mayors Office and Joint Research Centre of the European Commission. Reporting Guidelines on Sustainable Energy Action Plans; Publications Office of the European Union: Luxembourg, 2010.
- Corfee-Morlot, J.; Kamal-Chaoui, L.; Donovan, M.G.; Cochran, I.; Robert, A.; Teasdale, P.J. Cities, Climate Change and Multilevel Governance. OECD Environ. Work. Pap. 2009. [Google Scholar] [CrossRef]
- Farla, J.C.M.; Blok, K. The use of physical indicators for the monitoring of energy intensity development in the Netherlands, 1980–1995. Energy 2000, 25, 609–638. [Google Scholar] [CrossRef]
- Fortes, P.; Alvarenga, A.; Seixas, J.; Rodrigues, S. Long-term energy scenarios: Bridging the gap between socio-economic storylines and energy modeling. Technol. Forecast. Soc. Chang. 2015, 91, 161–178. [Google Scholar] [CrossRef]
- Fortes, P.; Pereira, R.; Pereira, A.M.; Seixas, J. Integrated technological-economic modelling platform for energy and climate policy analysis. Energy 2014, 73, 716–730. [Google Scholar] [CrossRef]
- Gustavsson, E.; Elander, I.; Lundmark, M. Multilevel governance, Networking cities, and the geography of climate-change mitigation: Two Swedish examples. Environ. Plan. C Gov. Policy 2009, 27, 59–74. [Google Scholar] [CrossRef]
- Gysen, J. The Modus Narrandi: A Methodology for Evaluating Effects of Environmental Policy. Evaluation 2006, 12, 95–118. [Google Scholar] [CrossRef]
- International Atomic Energy Agency (IAEA). Model for Analysis of Energy Demand (MAED-2)-User’s Manual. In Computer Manual Series; IAEA: Vienna, Austria, 2006. [Google Scholar]
- International Energy Agency (IEA). Energy Efficiency Indicators: Essentials for Policy Making. In Energy Efficiency Indicators; IEA: Paris, France, 2014. [Google Scholar]
- Jovanovic, M.; Afgan, N.; Bakic, V. An analytical method for the measurement of energy system sustainability in urban areas. Energy 2010, 35, 3909–3920. [Google Scholar] [CrossRef]
- Kasperson, J.X.; Kasperson, R.E.; Turner, B.L. Regions at Risk: Comparison of Threatened Environments; United Nations University Press: Tokyo, Japan, 1995. [Google Scholar]
- Lin, J.; Cao, B.; Cui, S.; Wang, W.; Bai, X. Evaluating the effectiveness of urban energy conservation and GHG mitigation measures: The case of Xiamen city, China. Energy Policy 2010, 38, 5123–5132. [Google Scholar] [CrossRef]
- Morlet, C.; Keirstead, J. A comparative analysis of urban energy governance in four European cities. Energy Policy 2013, 61, 852–863. [Google Scholar] [CrossRef]
- Murphy, L.; Meijer, F.; Visscher, H. A qualitative evaluation of policy instruments used to improve energy performance of existing private dwellings in the Netherlands. Energy Policy 2012, 45, 459–468. [Google Scholar] [CrossRef]
- Nässén, J. Determinants of greenhouse gas emissions from Swedish private consumption: Time-series and cross-sectional analyses. Energy 2014, 66, 98–106. [Google Scholar] [CrossRef]
- Neij, L.; Åstrand, K. Outcome indicators for the evaluation of energy policy instruments and technical change. Energy Policy 2006, 34, 2662–2676. [Google Scholar] [CrossRef]
- Praznik, M.; Butala, V.; Zbašnik Senegačnik, M. Simplified evaluation method for energy efficiency in single-family houses using key quality parameters. Energy Build. 2013, 67, 489–499. [Google Scholar] [CrossRef]
- Rai, V.; Robinson, S.A. Agent-based modeling of energy technology adoption: Empirical integration of social, behavioral, economic, and environmental factors. Environ. Model. Softw. 2015, 70, 163–177. [Google Scholar] [CrossRef]
- Schipper, L.; Unander, F.; Murtishaw, S.; Ting, M. Indicators of Energy Use and Carbon Emissions: Explaining the Energy Economy Link. Annu. Rev. Energy Environ. 2001, 26, 49–81. [Google Scholar] [CrossRef]
- Sobrino, N.; Monzon, A. The impact of the economic crisis and policy actions on GHG emissions from road transport in Spain. Energy Policy 2014, 74, 486–498. [Google Scholar] [CrossRef]
- Spyridaki, N.A.; Flamos, A. A paper trail of evaluation approaches to energy and climate policy interactions. Renew. Sustain. Energy Rev. 2014, 40, 1090–1107. [Google Scholar] [CrossRef]
- Tang, Z.; Brody, S.D.; Quinn, C.; Chang, L.; Wei, T. Moving from agenda to action: Evaluating local climate change action plans. J. Environ. Plan. Manag. 2010, 53, 41–62. [Google Scholar] [CrossRef]
- Wilbanks, T.J.; Kates, R.W. Global change in local places: How scale matters. Clim. Chang. 1999, 43, 601–628. [Google Scholar] [CrossRef]


| Objective | Identify and Characterize Factors of Change of Local Energy Systems |
|---|---|
| Documents Selection | |
| Search expressions | “Energy system characterization” |
| “Energy system modeling/modelling” | |
| “Energy system planning” | |
| “Energy system scenarios” | |
| “Energy policy evaluation” | |
| “Local climate change mitigation” | |
| Type of documents | Peer-reviewed articles |
| Reports and working papers from internationally reputed entities | |
| PhD theses | |
| Type of content | Factors that lead to changes in GHG emissions |
| Characterizing variables of those factors | |
| Information on the relation between factors of change and local GHG emissions |
| Code | Study | Authors | Year | Topic/Theme | Doc. Type | Ref. |
|---|---|---|---|---|---|---|
| 1 | “Evaluating the effects of policy innovations: Lessons from a systematic review of policies promoting low-carbon technology” | Auld, G., Mallet, A., Burlica, B., Nolan-Poupart, F., Slater, R. | 2014 | Policy Evaluation | JP | [7] |
| 2 | “Energy and emission monitoring for policy use—Trend analysis with reconstructed energy balances” | Boonekamp, P.G.M. | 2004 | Policy Evaluation | JP | [8] |
| 3 | “Improved methods to evaluate realized energy savings” | Boonekamp, P.G.M. | 2005 | Policy Evaluation | PhD | [9] |
| 4 | “A survey of urban climate change experiments in 100 cities” | Broto, C.B., Bulkeley, H. | 2013 | Multilevel governance | JP | [10] |
| 5 | “Reporting Guidelines on Sustainable Energy Action Plan and Monitoring” | Covenant of Mayors (European Union) | 2010 | Policy Evaluation | PR | [11] |
| 6 | “Cities, Climate Change and Multilevel Governance” | Corfee-Morlot, J., Kamal-Chaoui, L., Robert, A., Teasdale, P.J. | 2009 | Multilevel governance | WP | [12] |
| 7 | “The use of physical indicators for the monitoring of energy intensity developments in the Netherlands, 1980–1995” | Farla, J.C.M., Blok, K. | 2000 | Energy use | JP | [13] |
| 8 | “Long-term energy scenarios: Bridging the gap between socio-economic storyline and energy modeling” | Fortes, P., Alvarenga, A., Seixas, J., Rodrigues, S. | 2015 | Energy planning | JP | [14] |
| 9 | “Integrated technological-economic modelling platform for energy and climate policy” | Fortes, P., Pereira, R., Pereira, A., Seixas J. | 2014 | Energy planning | JP | [15] |
| 10 | “Multilevel governance, networking cities, and the geography of climate-change mitigation: two Swedish examples” | Gustavsson, E., Elander, I., Lundmark, M. | 2009 | Multilevel governance | JP | [16] |
| 11 | “Evaluating the effectiveness of environmental policy: A analysis of conceptual and methodological issues” | Gysen, J, Bachus, K., Bruyninckx, H. | 2002 | Policy evaluation | CP | [17] |
| 12 | “Model for Analysis of Energy Demand (MAED-2)—Computer Manual Series N° 18” | International Atomic Energy Agency | 2006 | Energy use | TR | [18] |
| 13 | “Energy Efficiency Indicators: Essentials for Policy Making” | International Energy Agency | 2014 | Energy planning | PR | [19] |
| 14 | “An analytical method for the measurement of energy system sustainability in urban areas” | Jovanovic, M., Afgan, N., Bakic, V. | 2010 | Energy use | JP | [20] |
| 15 | “Regions at Risk: Comparisons of Threatened Environments” | Kasperson, J.X., Kasperson, R.E, Turner, B.L. | 1995 | Policy Evaluation | Bk | [21] |
| 16 | “Evaluating the effectiveness of urban energy conservation and GHG mitigation measures: The case of Xiamen city, China” | Lin, J., Cao, B., Cui, S., Wang, W., Bai, X. | 2010 | Policy evaluation | JP | [22] |
| 17 | “Do city climate plans reduce emissions?” | Millard-Ball, A. | 2012 | Policy evaluation | JP | [3] |
| 18 | “A comparative analysis of urban energy governance in four European cities” | Morlet, C., Keirstead, J. | 2013 | Multilevel governance | JP | [23] |
| 19 | “A qualitative evaluation of policy instruments used to improve energy performance of existing private dwellings in the Netherlands” | Murphy, L., Meijer, F., Visscher, H. | 2012 | Policy evaluation | JP | [24] |
| 20 | “Determinants of greenhouse gas emissions from Swedish private consumption: Time-series and cross-sectional analyses” | Nassen, J. | 2014 | Energy use | JP | [25] |
| 21 | “Outcome indicators for the evaluation of energy policy instruments and technical change” | Neij, L., Astrand, K. | 2006 | Policy evaluation | JP | [26] |
| 22 | “Simplified evaluation method for energy efficiency in single-family houses using key quality parameters” | Praznik, M., Butala, V., Senegacnik, M.Z. | 2013 | Energy use | JP | [27] |
| 23 | “Agent-based modeling of energy technology adoption: Empirical integration of social, behavioral, economic, and environmental factors” | Rai, V., Robinson, S.A. | 2015 | Energy planning | JP | [28] |
| 24 | “Indicators of Energy Use and Carbon Emissions: Explaining the Energy Economy Link” | Schipper, L., Unander, F., Murtishaw, S., Ting, M. | 2001 | Energy use | JP | [29] |
| 25 | “The impact of the economic crisis and policy actions on GHG emissions from road transport in Spain” | Sobrino, N., Monzon, A. | 2014 | Policy evaluation | JP | [30] |
| 26 | “A paper trail of evaluation approaches to energy and climate policy interactions” | Spyridaki, N.A., Flamos, A. | 2014 | Policy evaluation | JP | [31] |
| 27 | “Moving from agenda to action: evaluating local climate change action plans” | Tang, Z., Brody, S.D., Quinn, C., Chang, L., Wei, T. | 2010 | Policy evaluation | JP | [32] |
| 28 | “Global change in local places: How scale matters” | Wilbanks, T.J., Kates, R.W. | 1999 | Multilevel governance | JP | [33] |
| Factor of Change | Variables Identified in the Literature Review | ||
|---|---|---|---|
| Statistical differences | 3.002 | Corrected statistics | |
| Local inhabitants’ characteristics | Educational level | 17.004 | Education |
| Cultural diversity | 15.021 | Ethnic/religious views | |
| Willingness to act | 18.006 | Civic involvement (voting patterns) | |
| 27.015 | Concept of climate change (awareness of) | ||
| 27.016 | Concept of GHG emissions (awareness of) | ||
| 27.017 | Effects and impact of CC (awareness of) | ||
| Local administration characteristics | Competences | 6.0005 | Local authority’s responsibilities and competences |
| Qualified personnel | 6.002 | Existence of a dedicated institution/agency to deal with CC mitigation actions/plans | |
| 6.003 | Local authority’s capacity and expertise on CC mitigation | ||
| Economic situation | 6.004 | Local authority’s ability to obtain funding | |
| Ratio between income and expenses | |||
| Climate variability | 3.003 | Climate (degree-days) | |
| Demographic evolution | Population growth/change | 15.002 | Natural growth |
| 15.003 | Migration | ||
| Migration to urban areas | 12.003 | Share of urban population | |
| Age pyramid | 14.003 | Share of potential labor force | |
| Social evolution | Household conditions | 14.002 | Persons per household |
| 24.002 | Floor area per capita | ||
| 24.004 | Heat per floor area | ||
| 13.005 | Appliances ownership per capita | ||
| 13.006 | DWH energy per capita | ||
| 13.007 | Cooking energy per capita | ||
| 13.008 | Lighting per floor area | ||
| Commuting needs and transportation habits | 13.010 | Pkm | |
| 12.023 | Inverse of car ownership ratio | ||
| 13.011 | Share of total pkm by mode | ||
| 27.009 | Average commuting time | ||
| Economic evolution | Overall local economy | 2.001 | GDP growth |
| Structure of local economy | 8.004 | GVA agriculture | |
| 8.005 | GVA services | ||
| 8.006 | GVA transports | ||
| 8.007 | GVA industry | ||
| 12.012 | Distribution of sectors GVA by subsectors | ||
| Economic situation of individuals | 17.002 | Employment | |
| 8.003 | Private consumption | ||
| Technology evolution | Market drivers/barriers | 26.022 | Technology market failures and other externalities related to electricity generation design |
| 9.006 | Technical and costs evolution | ||
| 9.007 | Availability and capacity limits (technology) | ||
| Technical evolution | 12.015 | Average efficiencies of fuels for thermal uses per sector | |
| 27.064 | Energy intensity | ||
| Technical evolution (Buildings) | 14.010 | Buildings insulation | |
| 24.005 | Intensity for different uses | ||
| 13.017 | Energy per value-added (services) | ||
| Technical evolution (Transports) | 13.012 | Energy per pkm by mode | |
| 13.015 | Energy per tkm by mode | ||
| Technical evolution (Agriculture) | 13.023 | Energy per value-added by subsector | |
| Electricity generation and other energy transformation processes | 3.010 | Cogeneration end-users | |
| 3.011 | Fuel-mix end-users (actual energy use) | ||
| 3.012 | Export (actual energy exports) | ||
| 3.013 | Structure e-sectors (reference use refineries/gas supply) | ||
| 3.014 | Cogeneration e-sectors | ||
| 3.015 | Efficiency e-sectors (actual conversion efficiencies) | ||
| 3.016 | Import (actual energy imports) | ||
| 3.017 | Fuel-mix e-sectors | ||
| State and international governance framework | Existing policies | 9.004 | Energy and environmental policies |
| 15.012 | International market | ||
| 15.013 | National market | ||
| Energy costs | 18.012 | Price of energy and relative share of any taxes or levies (energy costs) | |
| Synergies with local-level actions | 6.001 | Coherent multi-level policy framework (vertically and horizontally) | |
| 6.006 | Support from central governments to local policies | ||
| Actors involved | SEAP preparation | 5.015 | Decision body approving the plan |
| 5.003 | Coordination and organizational structures created/assigned | ||
| 5.004 | Staff capacity allocated | ||
| SEAP implementation | 10.001 | Actors involved in local CC mitigation | |
| 5.019 | Origin of the action (local or other) | ||
| 5.020 | Responsible body | ||
| Timeframe | 5.014 | Date of approval | |
| 5.021 | Implementation timeframe | ||
| Targets | 5.001 | Overall CO2 reduction target | |
| 5.002 | Vision | ||
| Current implementation status | 1.014 | State of activity | |
| 5.026 | Newest inventory year | ||
| 5.031 | Status implementation | ||
| 5.006 | Overall estimated budget for the SEAP implementation | ||
| Estimated impact | Base year inventory | 5.011 | Final energy consumption per sector and carrier |
| 5.012 | Energy supply sources | ||
| 5.013 | CO2 emissions per sector and carrier | ||
| BAU projections | 5.016 | BAU projections | |
| Overall estimated impact | 5.023 | Energy savings | |
| 5.024 | Renewable energy production | ||
| 5.025 | CO2 reduction | ||
| Mid-term inventory | 5.028 | Final energy consumption per sector and carrier | |
| 5.029 | Energy supply sources | ||
| 5.030 | CO2 emissions per sector and carrier | ||
| Mid-term estimated impact | 5.033 | Renewable energy production from actions implemented so far | |
| 5.034 | CO2 reduction from actions implemented so far | ||
| 5.009 | Description of the impact of instruments | ||
| Budget | Overall | 5.022 | Estimated implementation costs |
| Spent so far | 5.032 | Implementation cost spent so far | |
| Financing sources | 4.018 | Funding | |
| 5.007 | Foreseen financing sources for the implementation | ||
| Actions characterization | Area of intervention | 5.017 | Area of intervention |
| Technical measure | 4.021 | Action targeted sectors | |
| 16.008 | Measure/action | ||
| 16.009 | Intensity of measure (degree of implementation) | ||
| Instruments | 4.012 | Type of experiment | |
| 4.014 | Type of innovation | ||
| 1.017 | Presence of flexibility mechanisms | ||
| 19.008 | Policy theory associated with instruments applied | ||
| 5.018 | Policy instrument | ||
| Other process characteristics | 1.001 | Agenda setting process | |
| 27.046 | Establish implementation priorities for action | ||
| 5.008 | Monitoring process | ||
| Factor of Change | Characterizing (and Quantifiable) Indicator | Unit | |
|---|---|---|---|
| Local inhabitants’ characteristics | Education level | Distribution of local population per education level | Dimensionless (%) |
| Cultural diversity | Valid permits by reason per 1000 inhabitants | # permits/1000 inhab. | |
| Willingness to act | |||
| Awareness | Share of waste that is separated previous to collection (recycling) | Dimensionless (%) | |
| Civic involvement | Number of environmental nonprofits per 1000 inhabitants | # groups/1000 inhab. | |
| Local authority characteristics | Legal competences | Level of autonomy (High, Medium, Low) | Nominal variable |
| Qualified personnel | |||
| Dedicated institution/agency for CC mitigation | Y/N (or Number of people assigned to CC mitigation issues) | # people | |
| Previous experiences related with CC mitigation | Y/N | n.a. | |
| Economic situation | |||
| Ability to obtain funding | Global ranking of the municipalities’ financial situation | Dimensionless | |
| Relation between income and expenses | Ratio between income and expenses | Dimensionless | |
| Factor of Change | Characterizing (and Quantifiable) Indicator | Unit | |
|---|---|---|---|
| Climate variability | Heating Degree Days | HDD | |
| Cooling Degree Days | CDD | ||
| Demographic evolution | Population growth | Change of overall population | # inhabitants |
| Migration to urban areas | Share of rural population | Dimensionless (%) | |
| Age pyramid | Share of active population | Dimensionless (%) | |
| Social evolution | Household conditions | Persons per household | Person/household |
| Floor area per person | m2/cap | ||
| Commuting needs | Average commuting needs | km/person.day | |
| Transportation habits | Car ownership | cars/cap | |
| Economic evolution | Overall growth of local economy | Local GDP change | € |
| Structure of local economy | GVA per sector (or number of employees) | € | |
| Economic situation of households: | |||
| Employment | Unemployment rate | Dimensionless (%) | |
| Private consumption | Private Purchase Power | €/cap | |
| Factor of Change | Characterizing (and Quantifiable) Indicators | Unit | |
|---|---|---|---|
| Technology Evolution | Technical evolution | National average energy intensity per sector | kWh/€ |
| Market evolution: | |||
| Technology costs | Over cost of A++ appliances compared to B equivalent | € | |
| Market barriers | Energy efficiency gap | ||
| Energy supply sector: | |||
| Fuel-mix of electricity and heat generation | Share of renewable energy sources (RES) | Dimensionless (%) | |
| Efficiency of energy transformation sector | Overall efficiency and losses | Dimensionless (%) | |
| National and international energy-related policies | Existing policies | Public and private investments on environmental management and protection per economic activity (cumulative values) | € |
| Energy costs | Average energy cost for final consumer | €/kWh | |
| Coherence with local policies | Alignment between different scales objectives? | (Y/N) | |
| Support of local action | Initiatives to promote local action (Number) | # initiatives | |
| Factor of Change | Characterizing (and Quantifiable) Indicators | Unit | |
|---|---|---|---|
| Actors involvement | Action plan preparation | Groups of actors involved | Nominal variable |
| Action plan implementation | Groups of actors involved | Nominal variable | |
| Timeframe | Study | Base Year and Time Horizon | Year |
| Action plan implementation | Beginning and End of action plan implementation | Year | |
| Targets | Vision | Other goals besides GHG emissions reduction | (Y/N) |
| GHG emissions reduction | ton CO2 eq. | ||
| Current implementation status | Overall | Share of the overall plan already implemented | Dimensionless (%) |
| Per action | Share of the individual measure already implemented | Dimensionless (%) | |
| Estimated impact | Base year inventory | In terms of final energy and GHG emissions reduction (measured) | GWh/a |
| ton CO2 eq./a | |||
| BAU projections | In terms of final energy and GHG emissions reduction (predicted) | GWh/a | |
| ton CO2 eq./a | |||
| Latest inventory | In terms of final energy and GHG emissions reduction (measured) | GWh/a | |
| ton CO2 eq./a | |||
| Budget | Overall | € | |
| Spent so far | € | ||
| Financing sources | Entity(s) responsible | Entities financing local actions (per category) | Nominal variable |
| Share of overall investment costs | Fraction of overall investment that is financed by each entity | Dimensionless (%) | |
| Actions characterization | Area of intervention | Sector and subsector targeted | |
| Technical measure: | |||
| Measure | Building retrofit, modal shift in transports, led street lights, etc. | Nominal variable | |
| Level of implementation | Share of the sector/subsector impacted by the action | Dimensionless (%) | |
| Estimated impact | In terms of final energy and GHG emissions reduction | GWh/a | |
| ton CO2 eq./a | |||
| Policy instrument: | |||
| Type | Regulation, incentive, education, etc. | Nominal Variable | |
| Level of support | Share of financing provided by the instrument | Dimensionless (%) | |
| Stakeholders involvement | Nominal variable | ||
© 2020 by the authors. Licensee MDPI, Basel, Switzerland. This article is an open access article distributed under the terms and conditions of the Creative Commons Attribution (CC BY) license (http://creativecommons.org/licenses/by/4.0/).
Share and Cite
Azevedo, I.; Leal, V. Factors That Contribute to Changes in Local or Municipal GHG Emissions: A Framework Derived from a Systematic Literature Review. Energies 2020, 13, 3205. https://doi.org/10.3390/en13123205
Azevedo I, Leal V. Factors That Contribute to Changes in Local or Municipal GHG Emissions: A Framework Derived from a Systematic Literature Review. Energies. 2020; 13(12):3205. https://doi.org/10.3390/en13123205
Chicago/Turabian StyleAzevedo, Isabel, and Vítor Leal. 2020. "Factors That Contribute to Changes in Local or Municipal GHG Emissions: A Framework Derived from a Systematic Literature Review" Energies 13, no. 12: 3205. https://doi.org/10.3390/en13123205
APA StyleAzevedo, I., & Leal, V. (2020). Factors That Contribute to Changes in Local or Municipal GHG Emissions: A Framework Derived from a Systematic Literature Review. Energies, 13(12), 3205. https://doi.org/10.3390/en13123205