Analyzing the Energy Consumption, GHG Emission, and Cost of Seawater Desalination in China


Abstract

1. Introduction
2. Seawater Desalination in China
3. Methodology
3.1. Energy Consumption
3.2. GHG Emissions
3.3. Unit Product Cost
Capital Cost
Operating Cost
4. Results
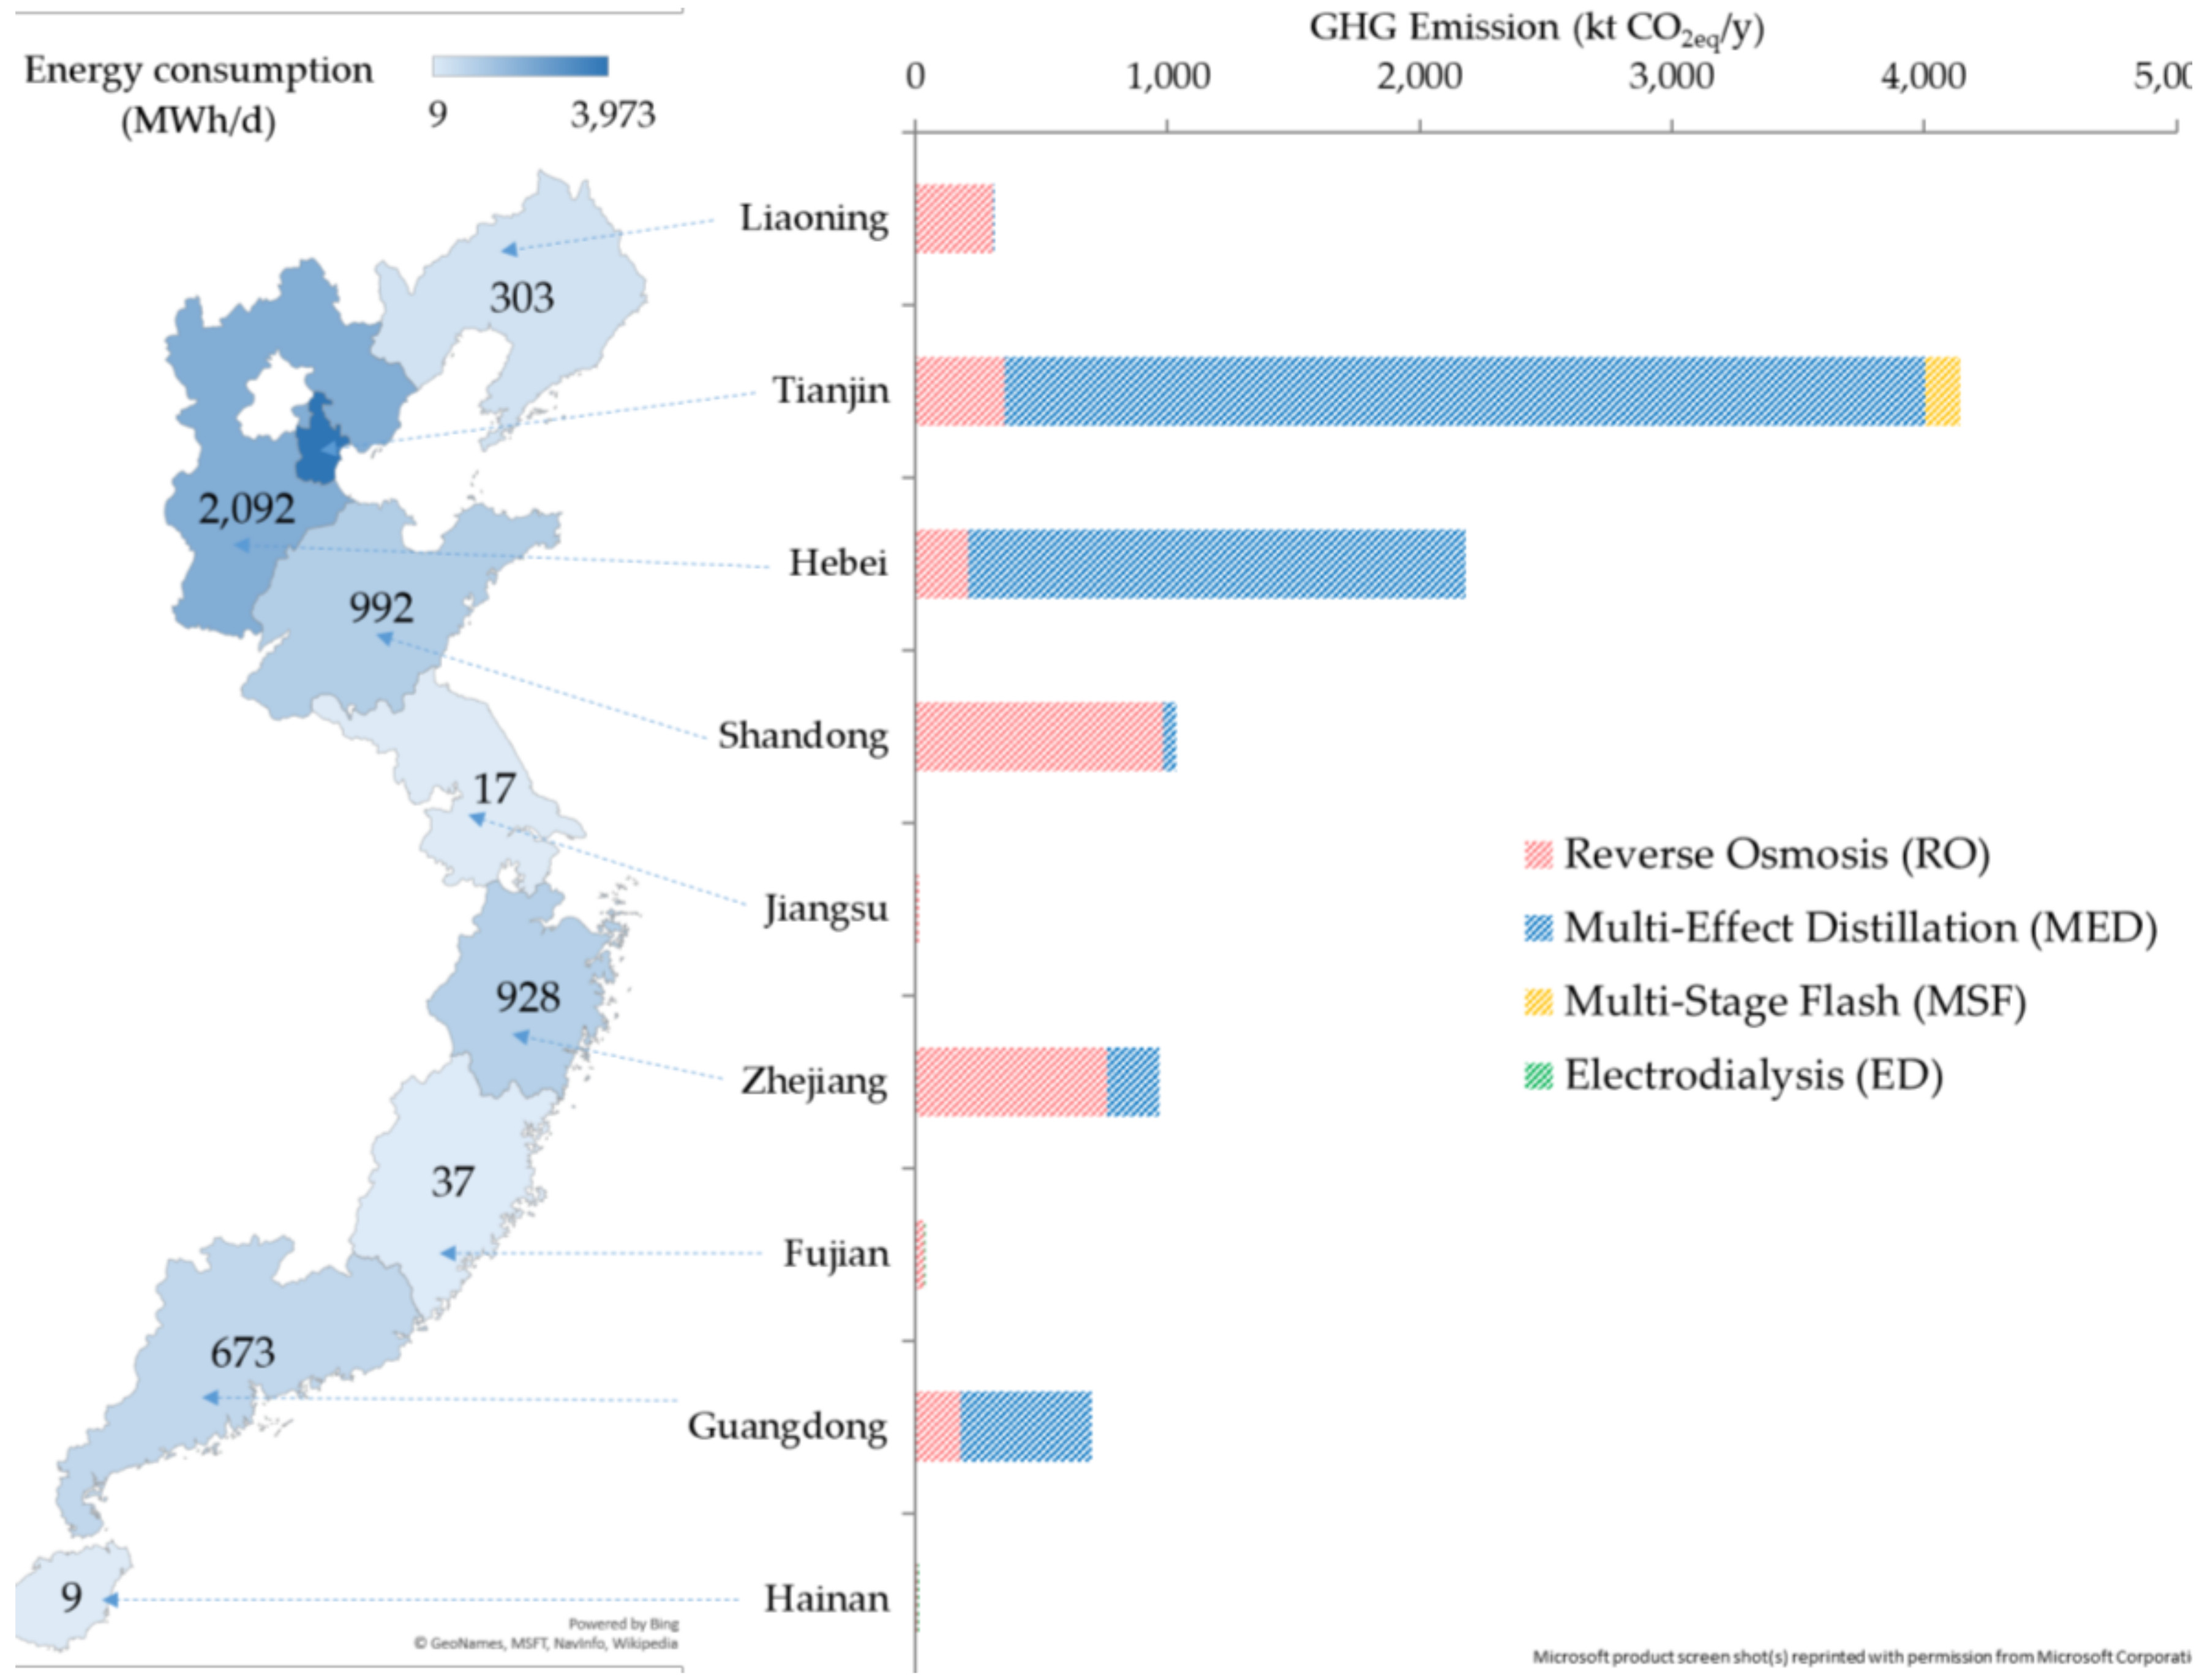
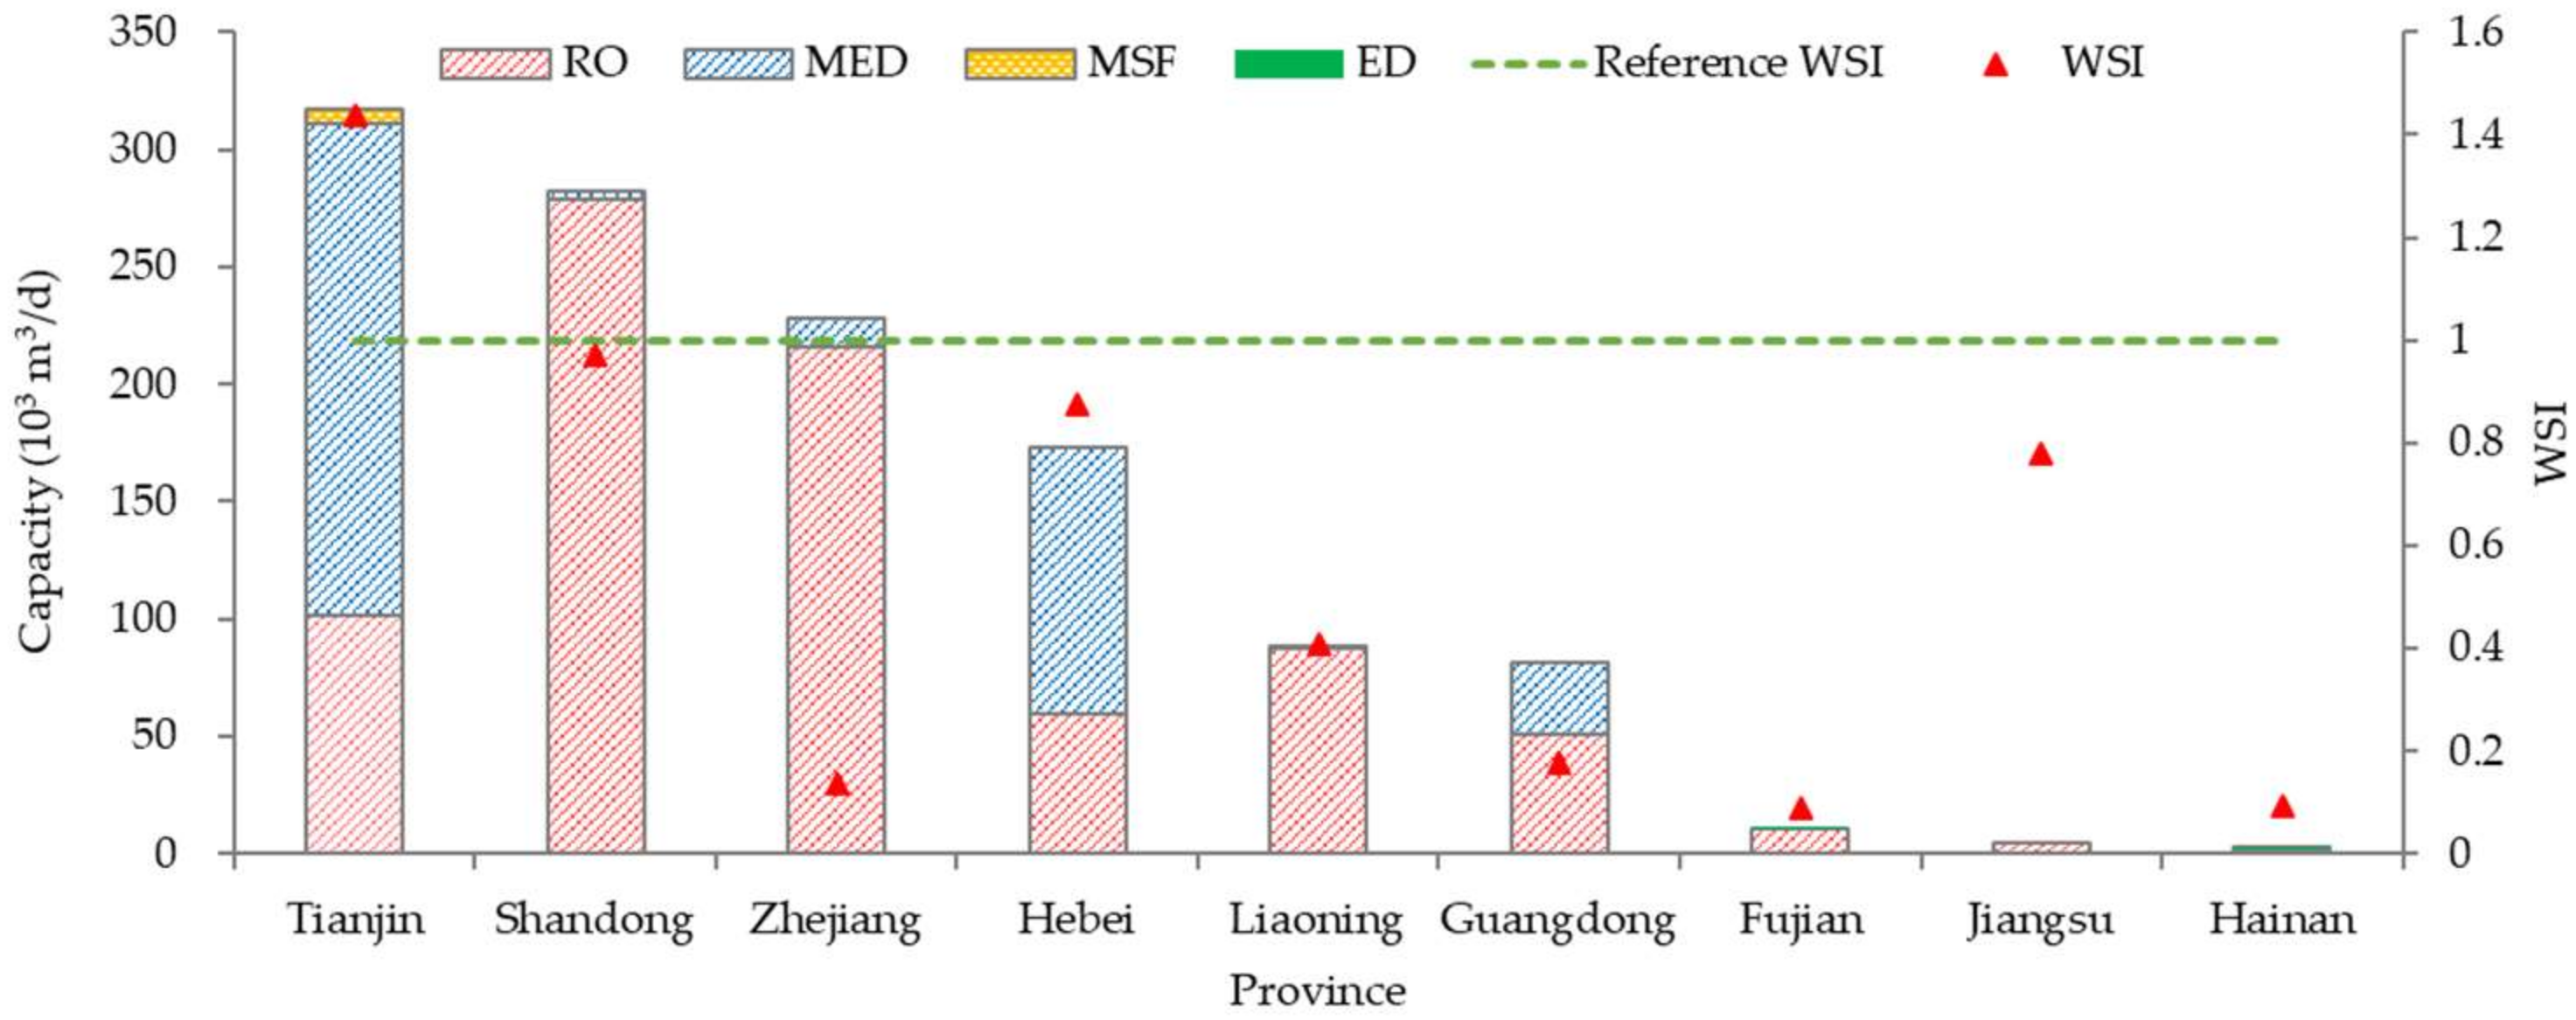
4.1. Energy Consumption and GHG Emissions
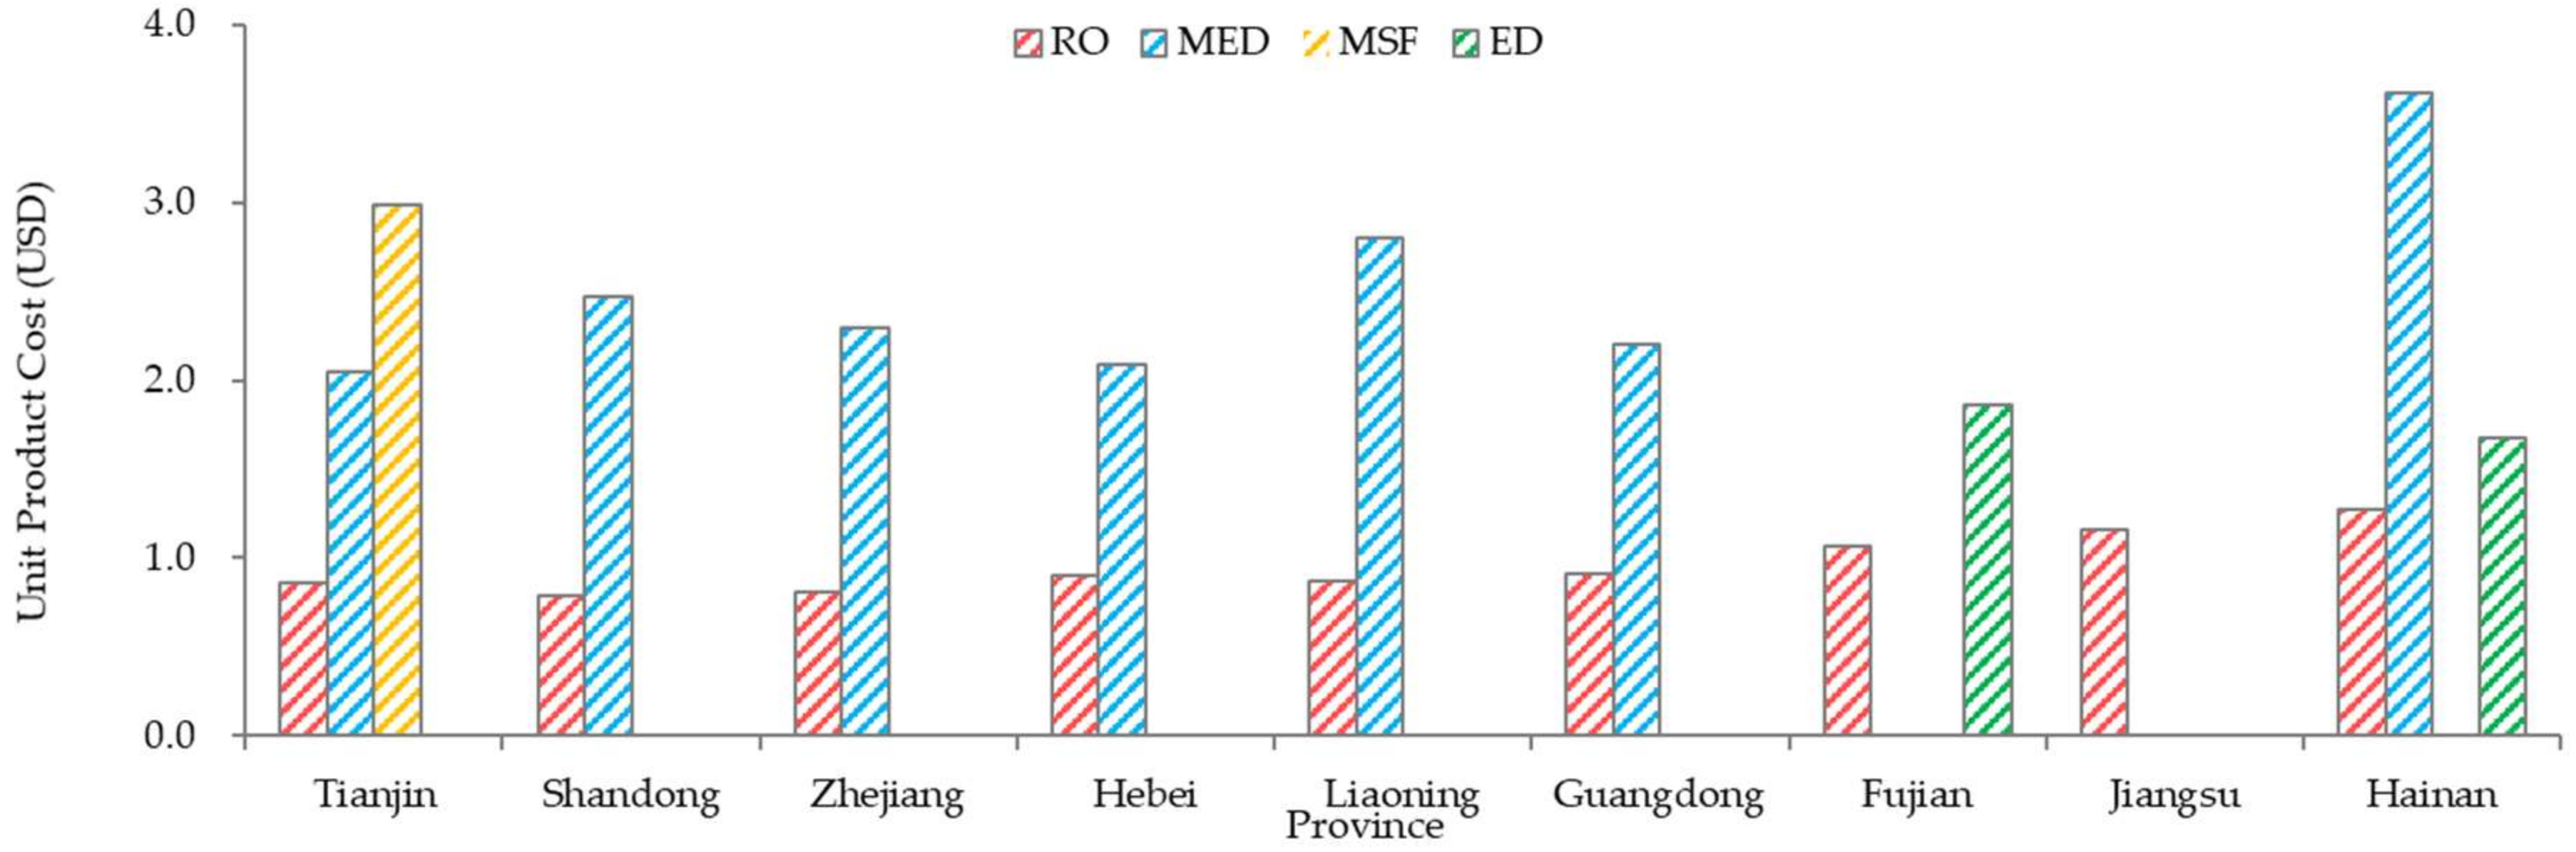
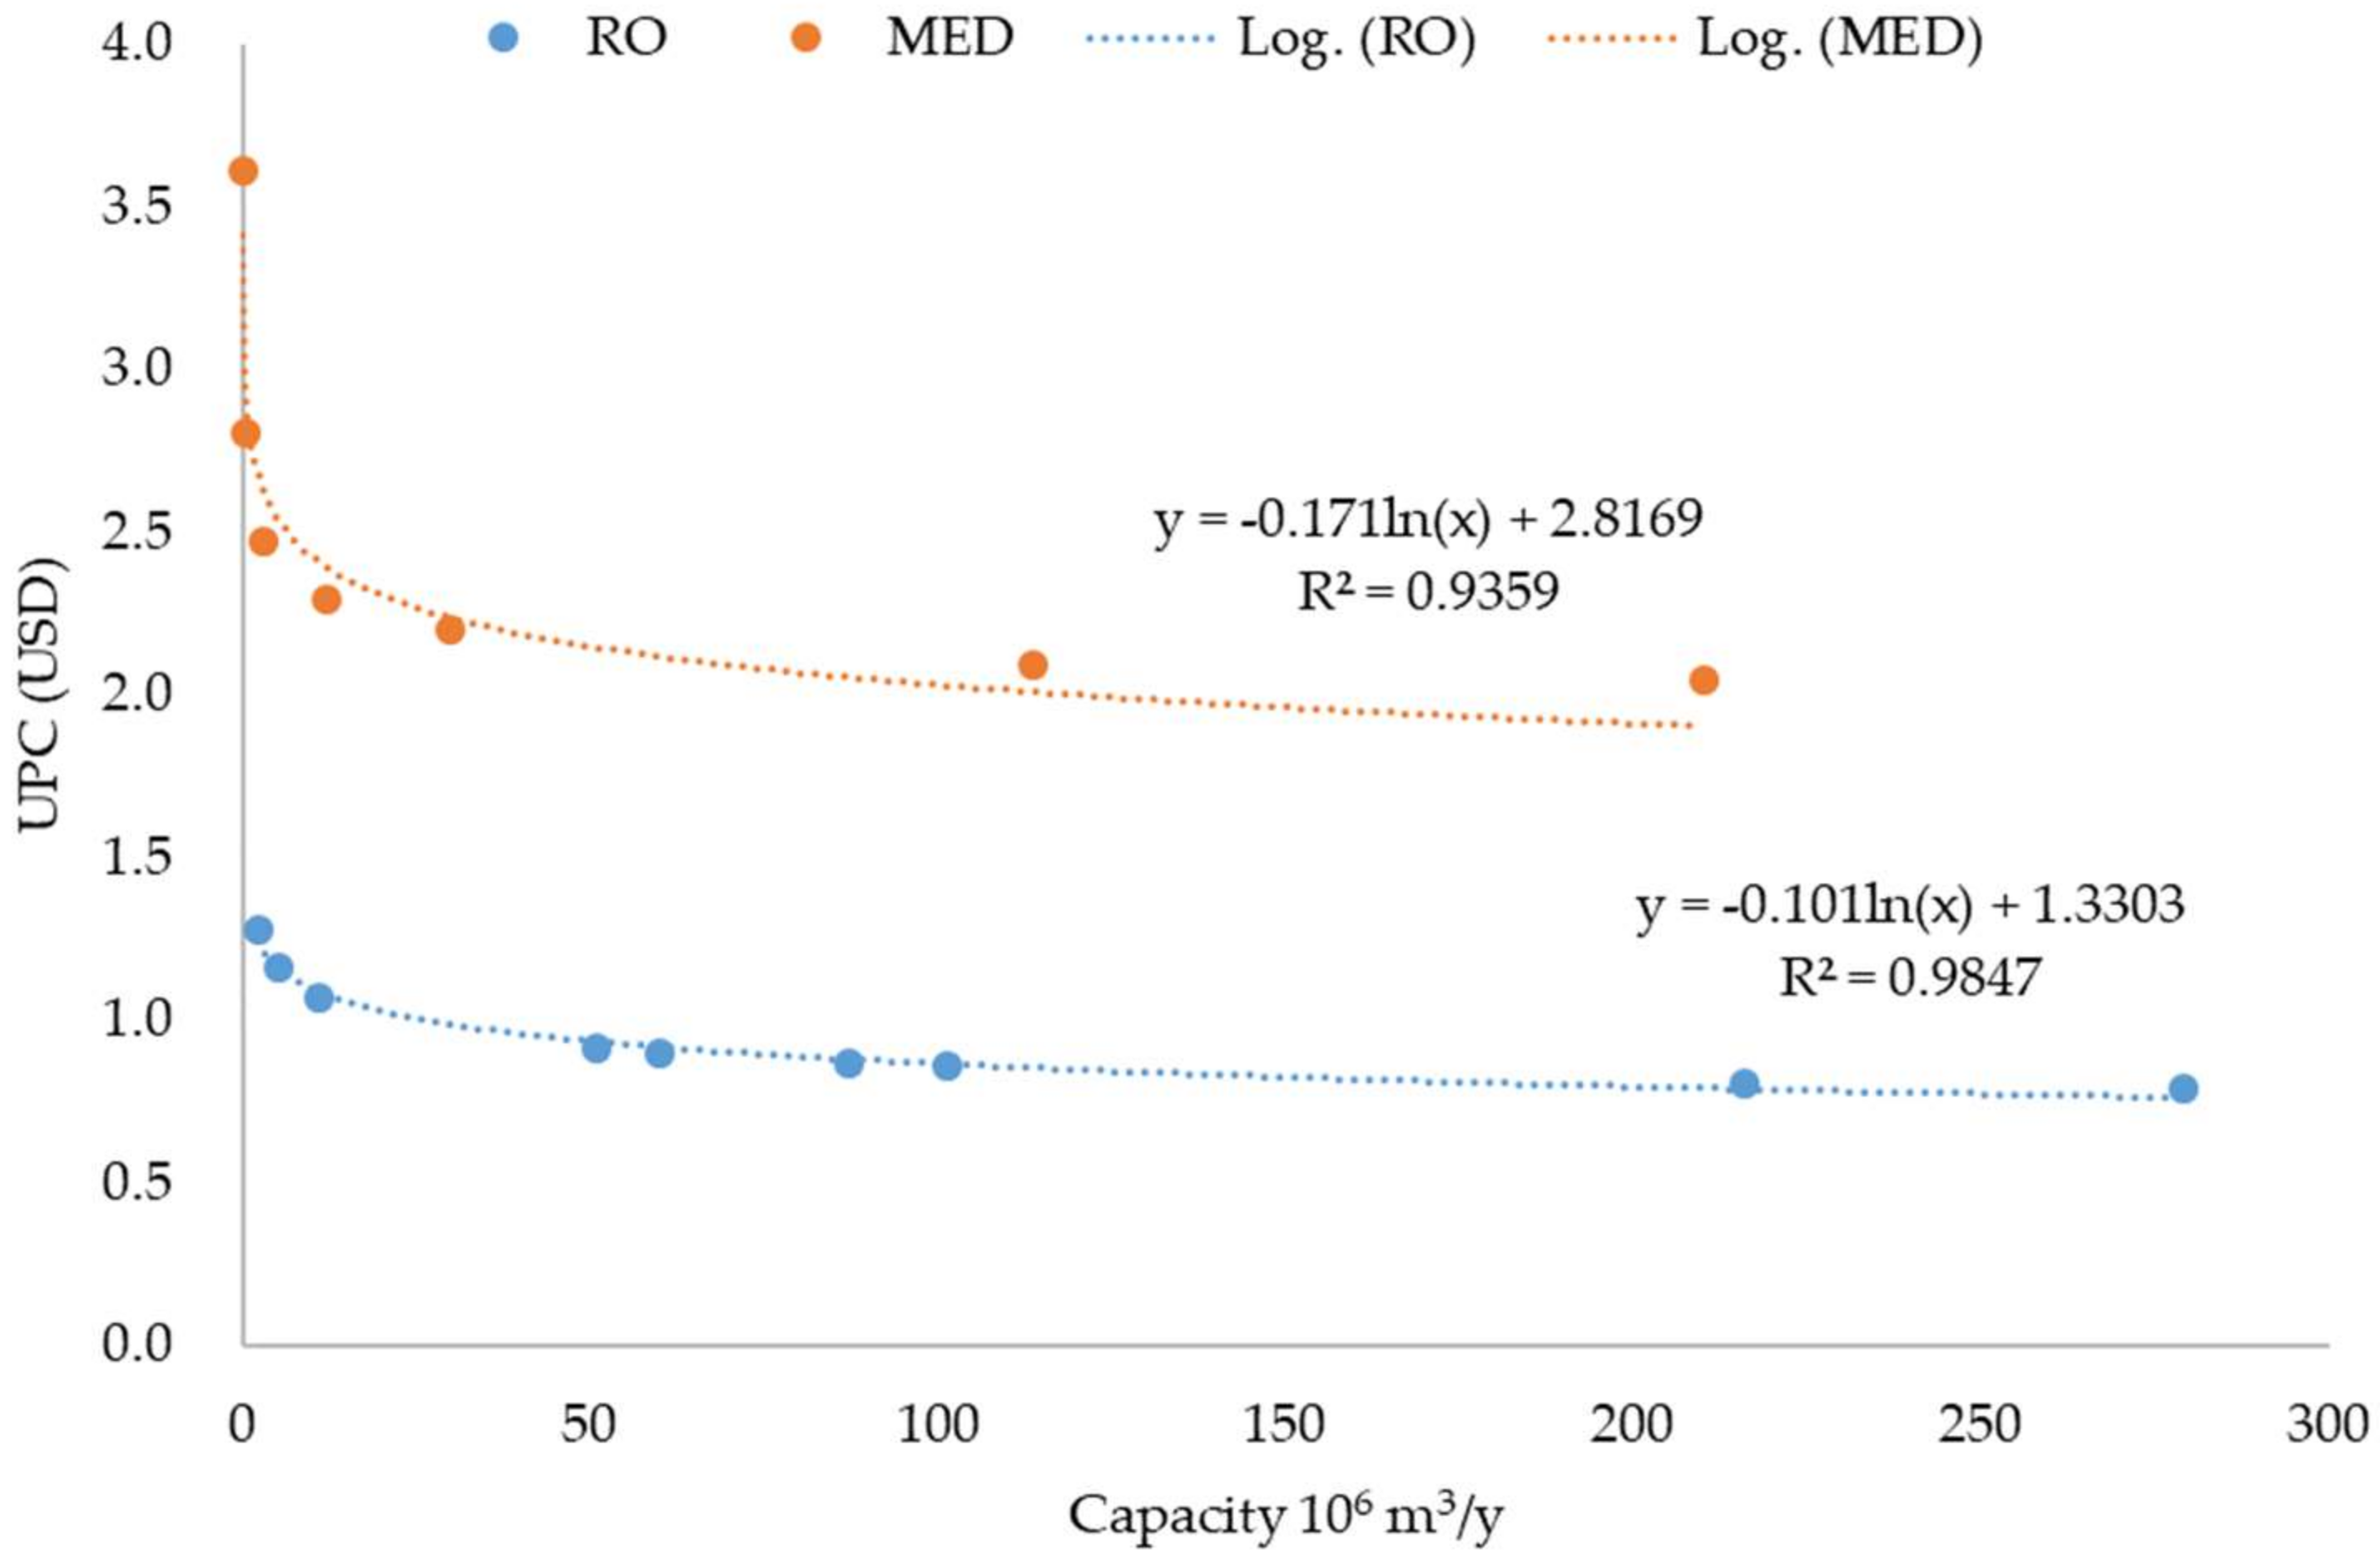
4.2. Unit Product Cost
5. Discussion and Future Directions
5.1. Discussion
5.2. Future Works
6. Conclusions
- (1)
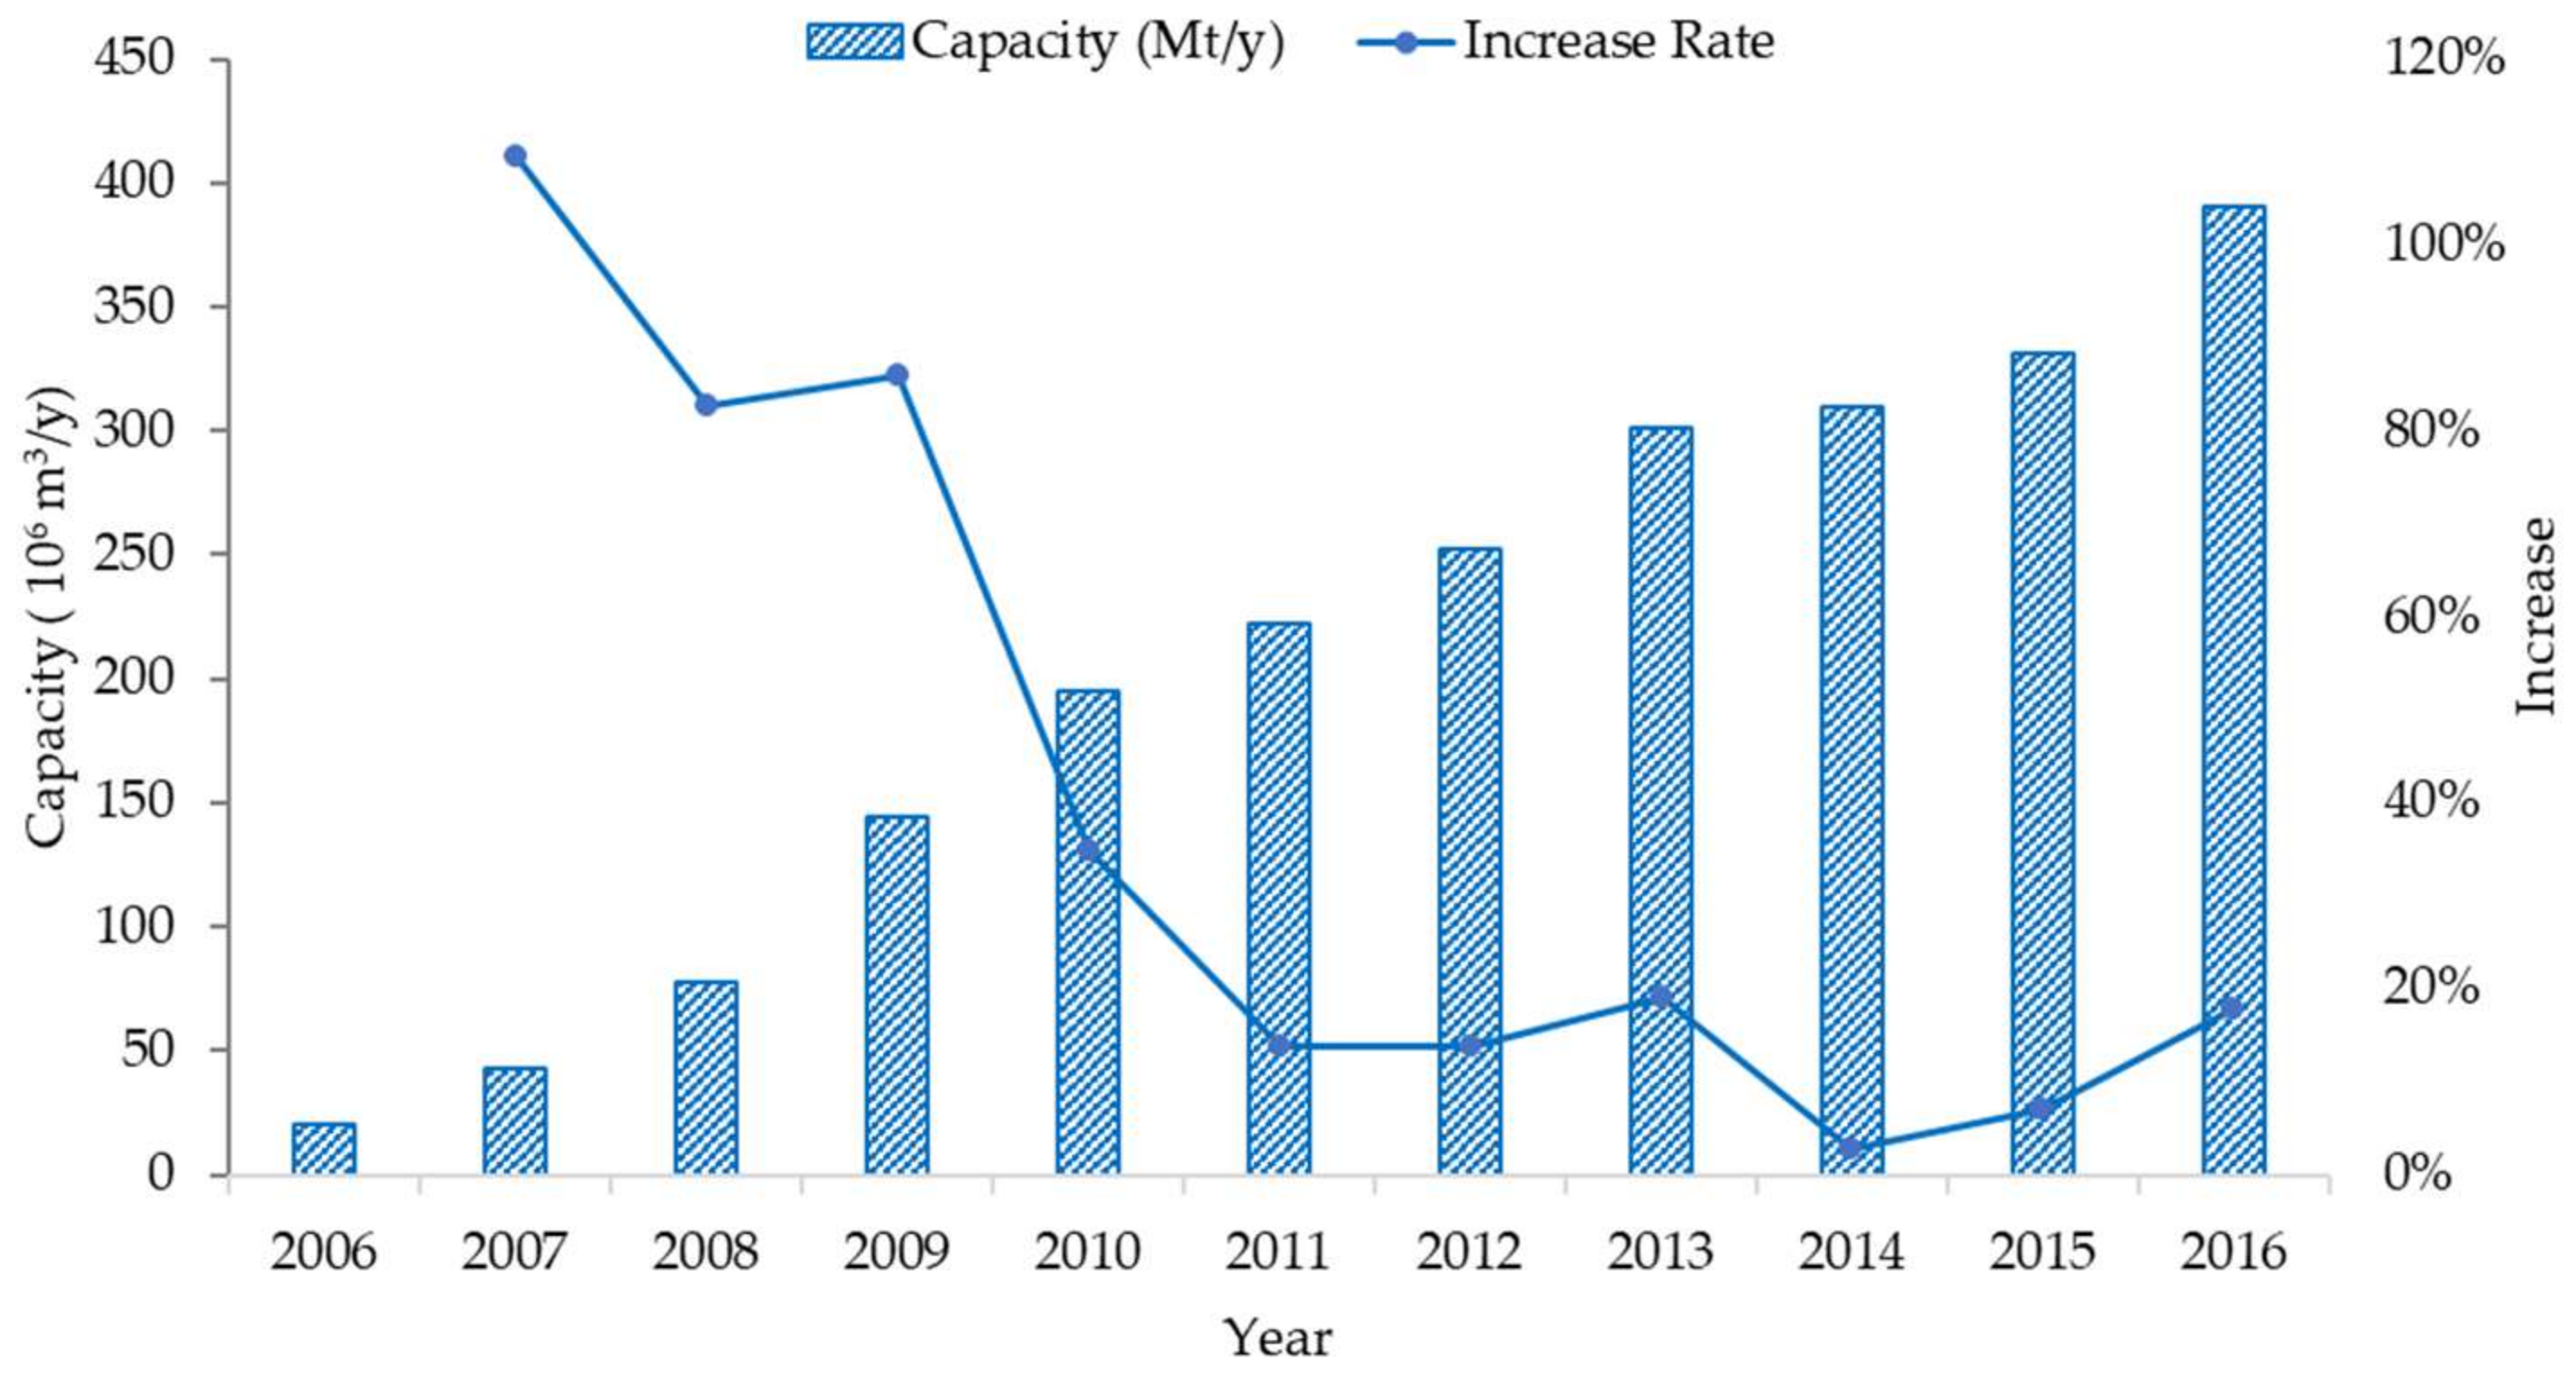
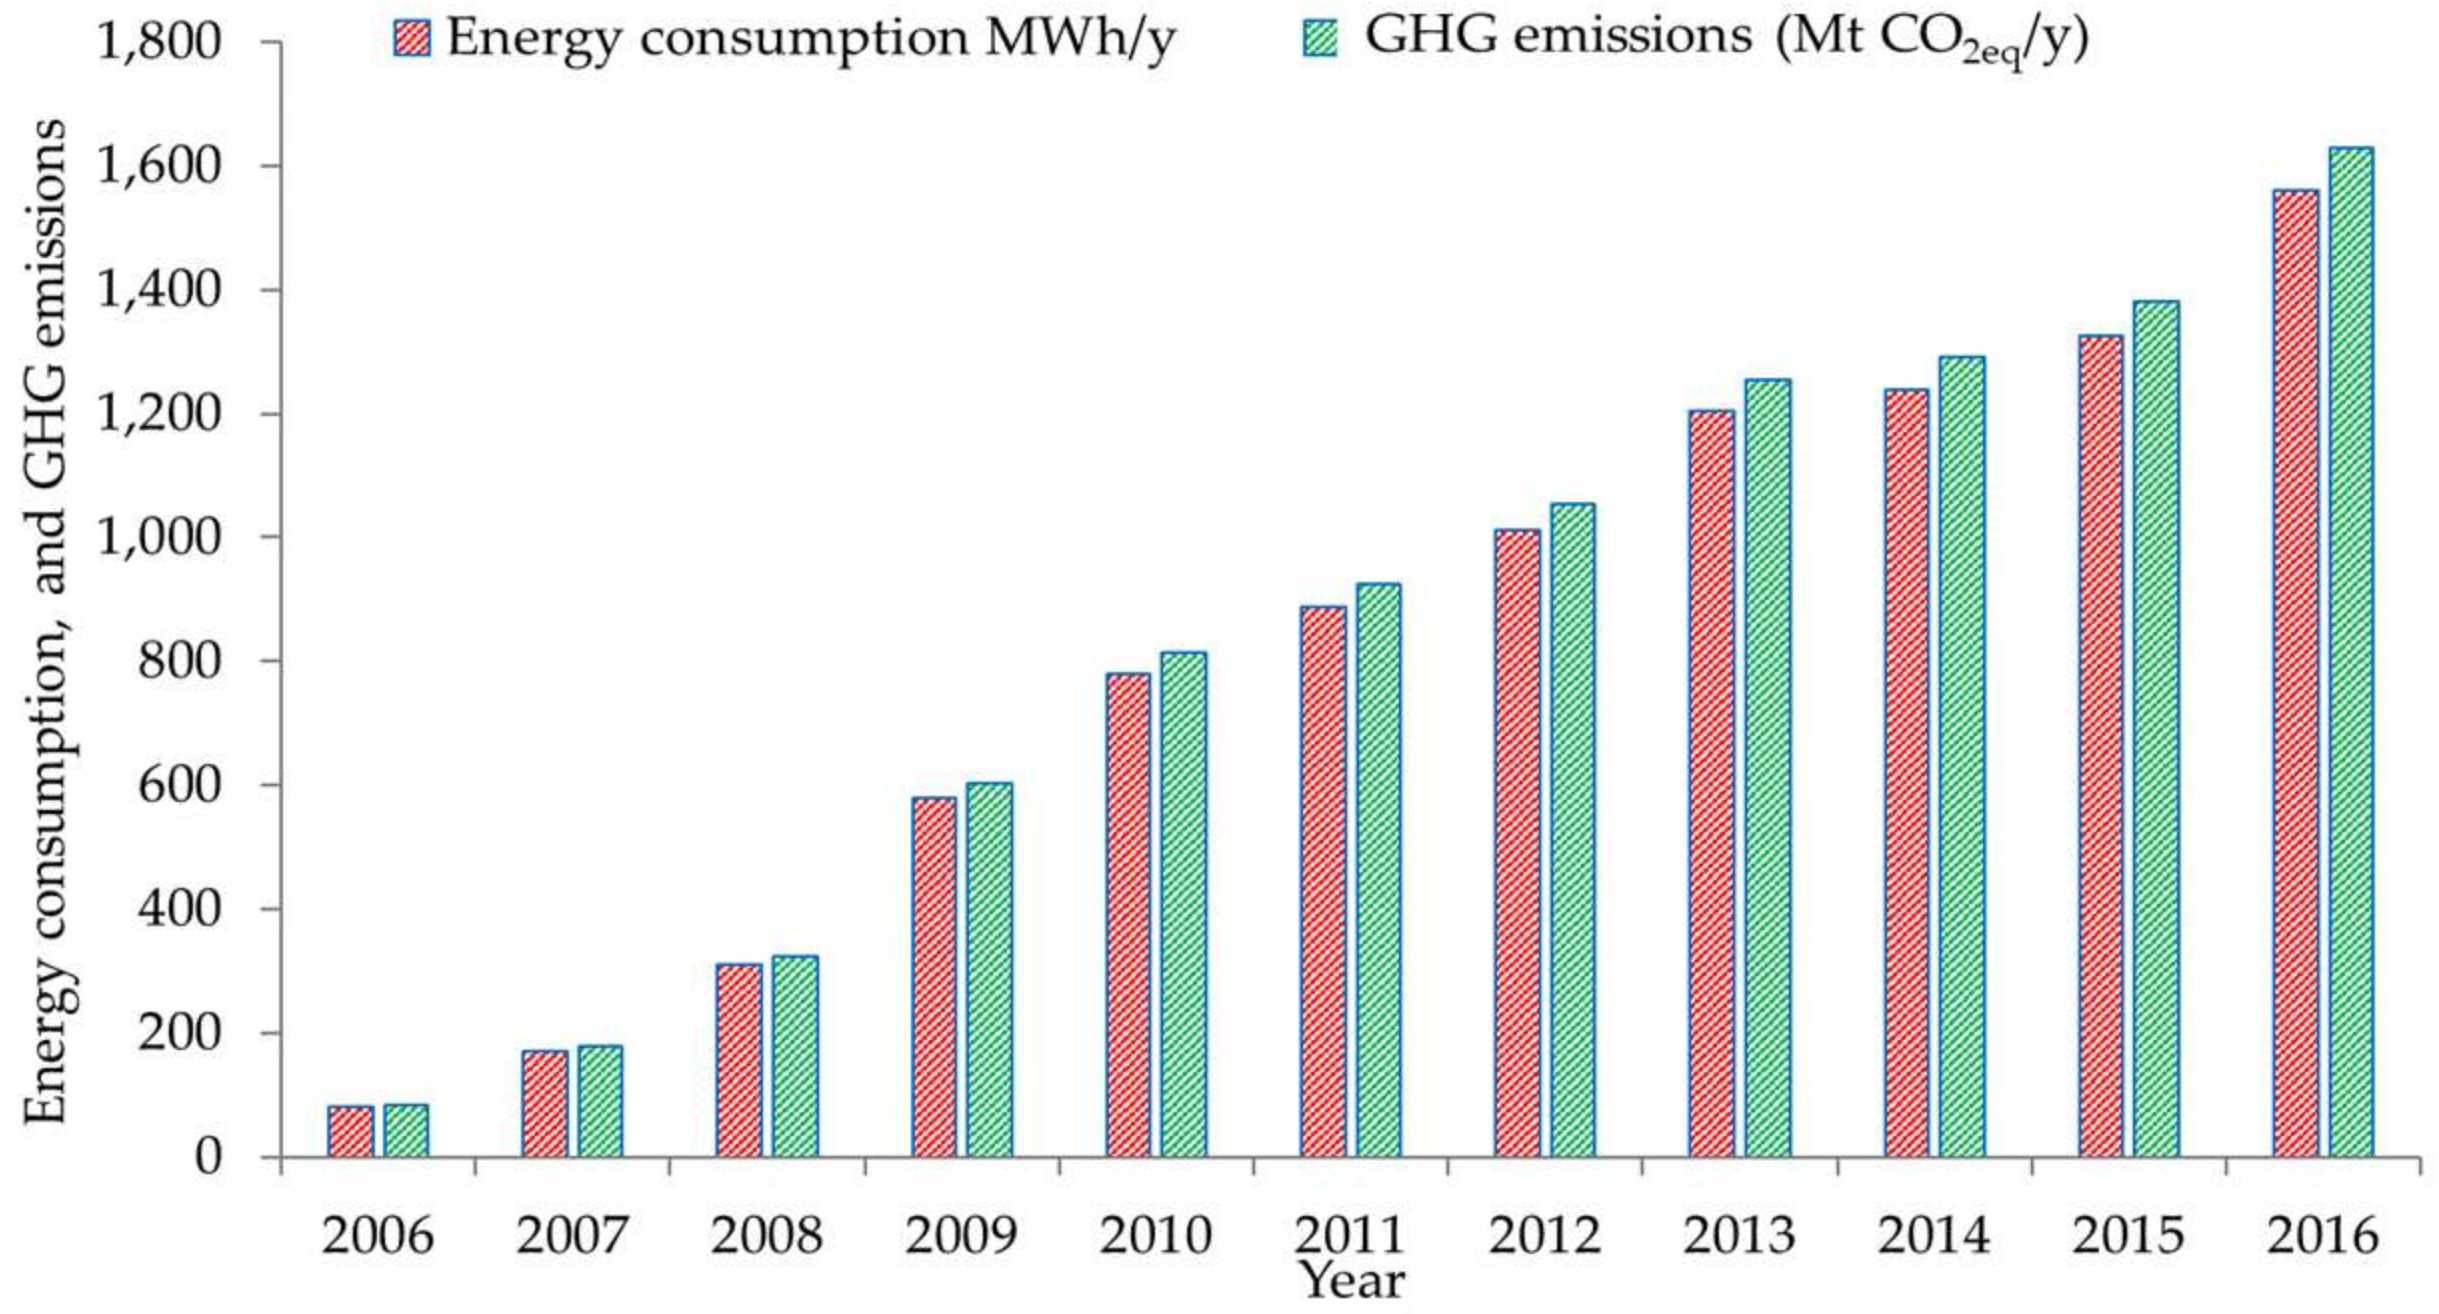
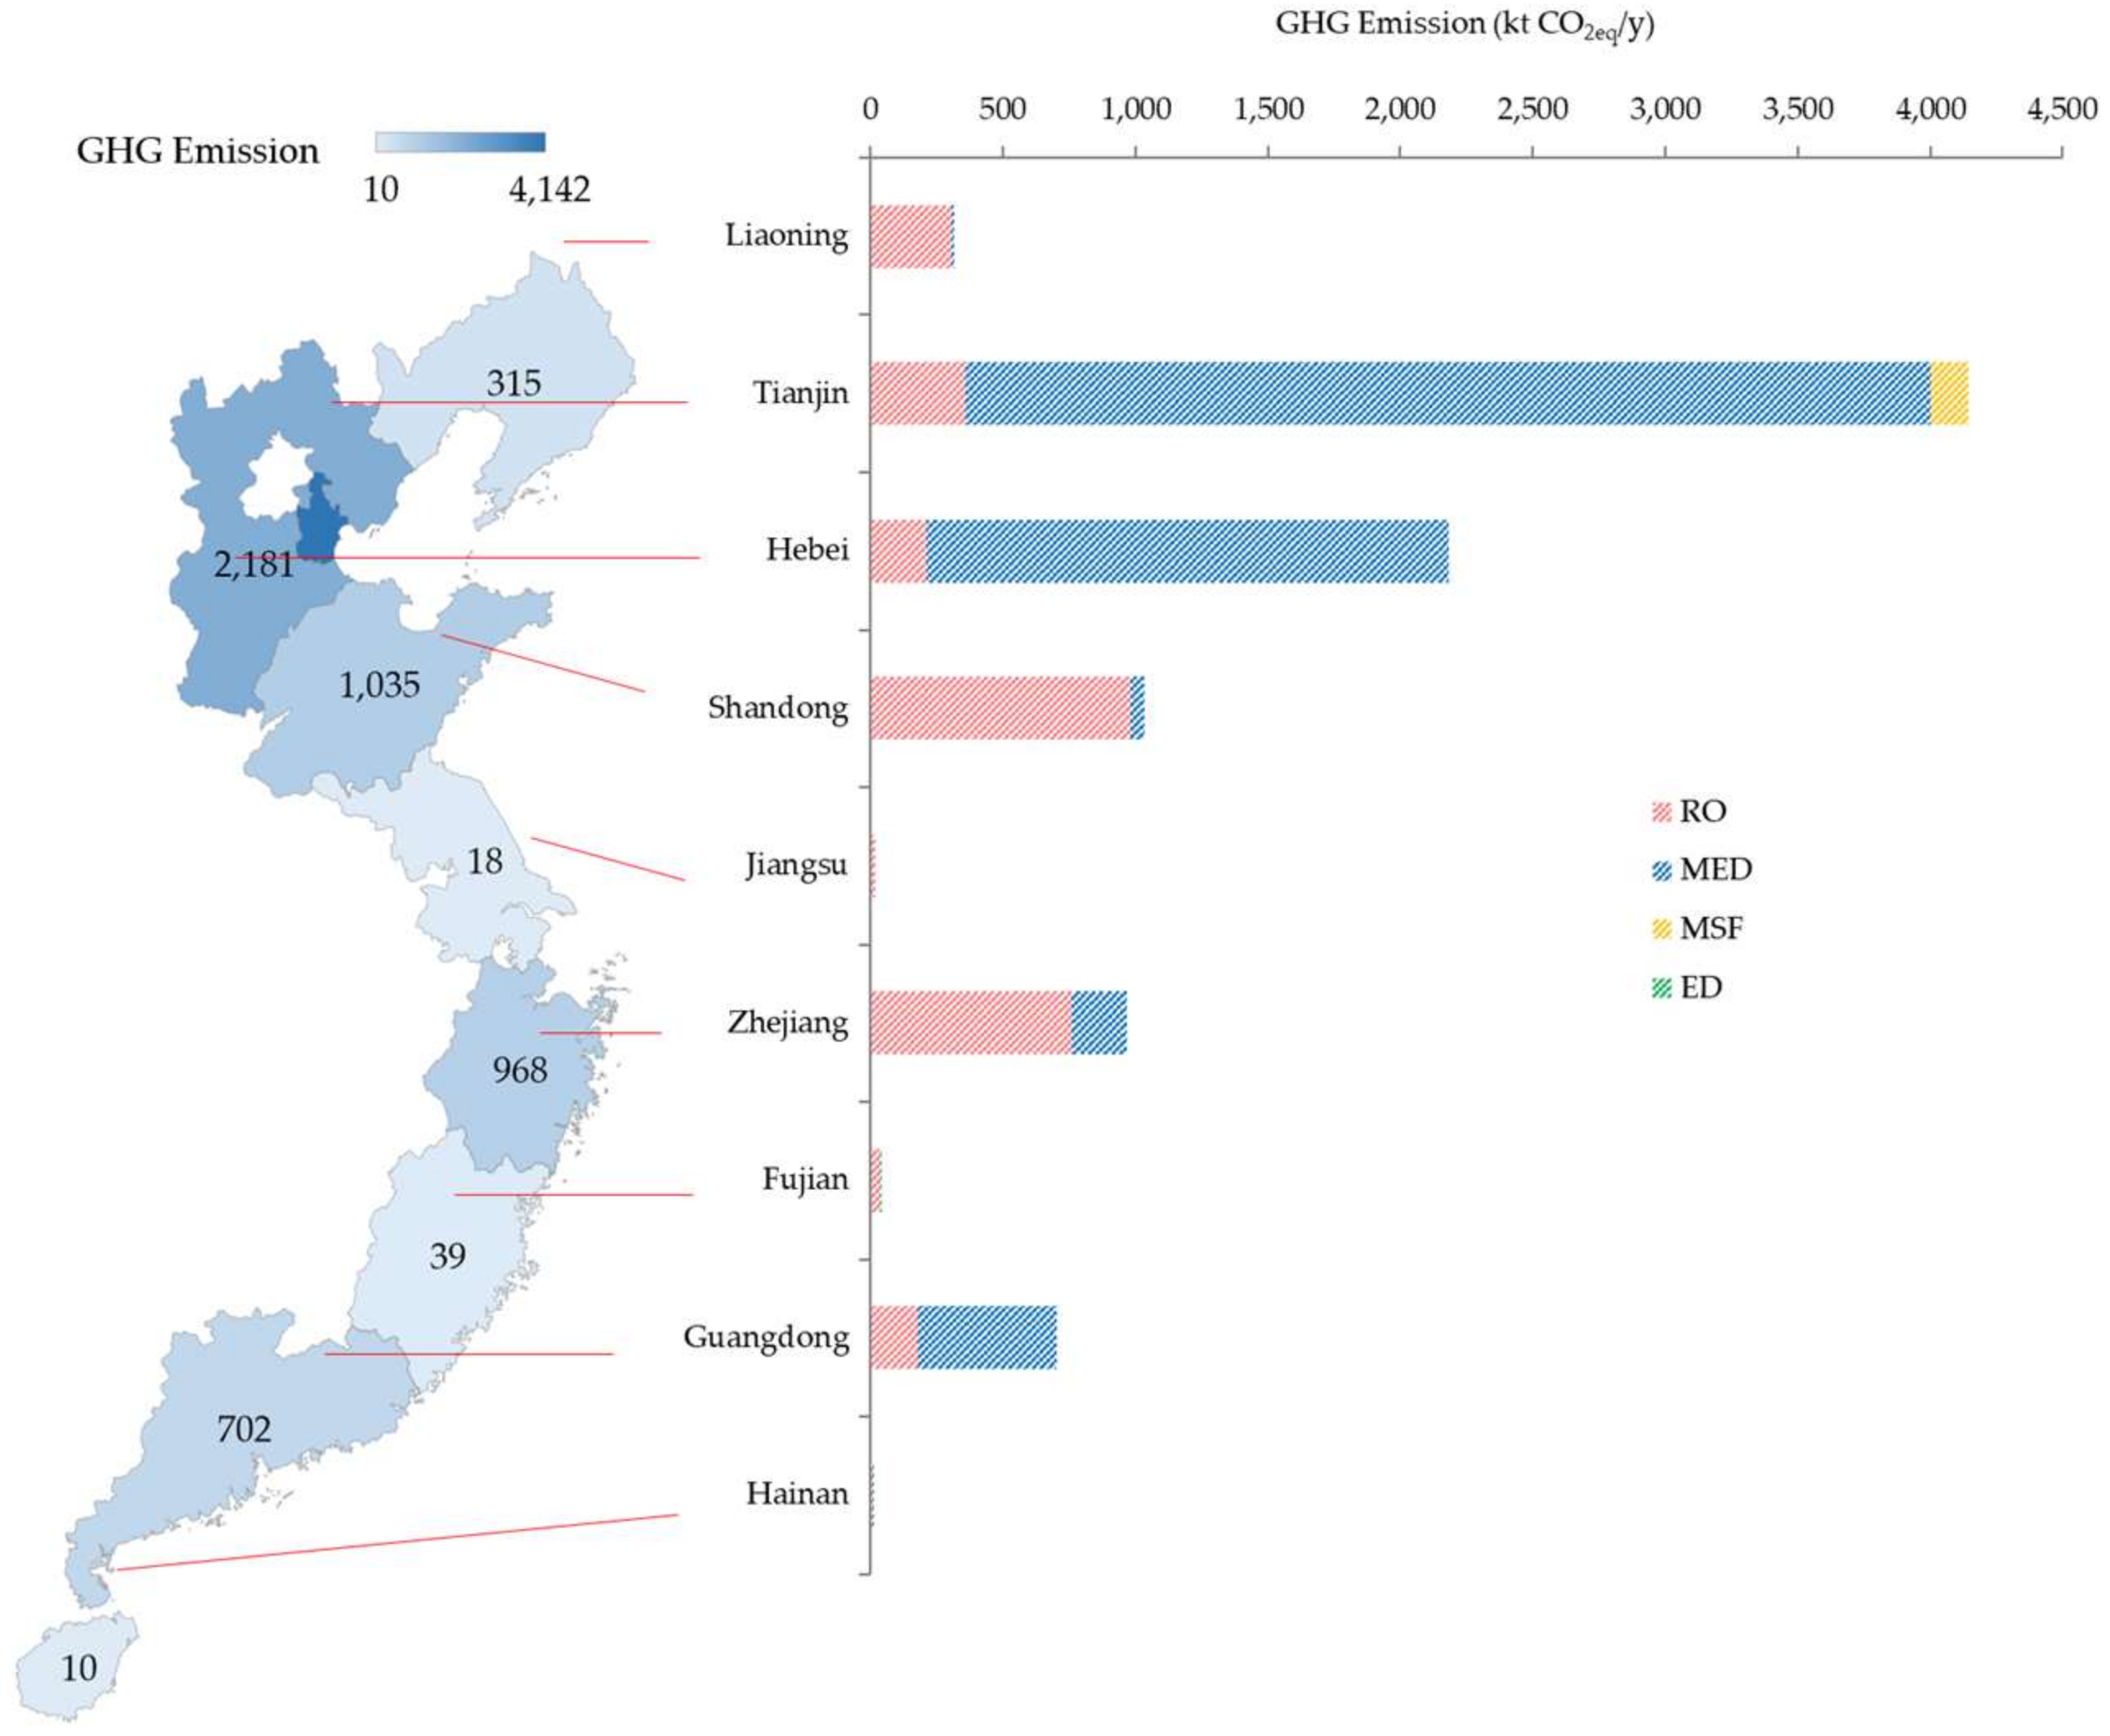
- With the increasing installed capacity of seawater desalination from 2006 to 2016, the energy consumption and GHG emission increased from 81 MWh/y to 1,561 MWh/y during the 11 years. The overall GHG emission increase from 85 Mt CO2eq/y to 1,628 Mt CO2eq/y, with an increasing rate of 180%. Tianjin has the largest GHG emissions, followed by Hebei and Shandong, with emissions of 4.1 MtCO2eq/y, 2.2 MtCO2eq/y. and 1.0 MtCO2eq/y.
- (2)
- The unit product cost (UPC) of seawater desalination is higher than other water supply alternatives, and it differentiates the desalination processes. The UPC of the RO process varies from 0.8 USD to 1.3 USD in 2016, and the UPC of MED, MSF, and ED are 2.0 USD–3.6 USD, 3.0 USD, and 1.7 USD to 1.9 USD. Tianjin which has the largest overall seawater desalination capacity has the relatively lowest UPC for RO and MED.
- (3)
- Seawater desalination is now being highly encouraged and developed in China and is becoming a critical water supply alternative for cities with serious water scarcity. The cost, energy demand and GHG emissions are still considerably higher than surface water supply. There is potential for energy consumption, GHG emission and cost reduction with the application of energy recovery units, the integration of desalination plants and renewable energies or low potential heat, as well as the development of new technologies.
Author Contributions
Funding
Conflicts of Interest
Nomenclature
| Ca | The capacity of the plant, MUSD. Subscript x and rf represents the capacity of the studied plant and the reference plant |
| CC | Capital cost of the plant over the lifespan, USD; Subscript x and rf represents the capital cost of the studied plant and the reference plant |
| Ci | Capacity of the desalination plants with process i, m3/d |
| CO2 | Carbon Dioxide |
| ECa | Annual energy consumption, kWh/y |
| ECe | Annual energy consumption of process i, kWh/m3 |
| Eco | The cost due to energy consumption, MUSD |
| ED | Electrodialysis |
| Ef | Emission factors of per unit electricity, t CO2eq/kWh |
| EMe | Emissions of energy consumption, tCO2eq/y |
| EMin | Emissions of material inputs, tCO2eq/y |
| EOP | Ratio of energy cost and operating cost, % |
| Ge | Annual GHG emissions, tCO2eq/y |
| KSA | Kingdom of Saudi Arabia |
| MED | Multiple-effect distillation |
| MSF | Multi-stage flash |
| OPa | The annual operating cost; MUSD |
| Pa | Availability of the plant, % |
| Pe | The price of the electricity supplied for seawater desalination plant, USD |
| Pl | The plant life, y |
| RO | Reverse osmosis |
| SEC | Specific energy consumption, kWh/m3 desalinated water |
| UAE | United Arab Emirates |
| UPC | Unit Product Cost, USD/m3 |
| WSI | Water Stress Index |
References
- Boulay, A.-M.; Bare, J.; Benini, L.; Berger, M.; Lathuillière, M.J.; Manzardo, A.; Margni, M.; Motoshita, M.; Núñez, M.; Pastor, A.V.; et al. The WULCA consensus characterization model for water scarcity footprints: Assessing impacts of water consumption based on available water remaining (AWARE). Int. J. Life Cycle Assess. 2018, 23, 368–378. [Google Scholar] [CrossRef]
- International Desalination Association. IDA Desalination Yearbook 2016–2017; International Desalination Association: Topsfield, MA, USA, 2017. [Google Scholar]
- Attarde, D.; Jain, M.; Singh, P.K.; Gupta, S.K. Energy-efficient seawater desalination and wastewater treatment using osmotically driven membrane processes. Desalination 2017, 413, 86–100. [Google Scholar] [CrossRef]
- Al-Karaghouli, A.; Kazmerski, L.L. Energy consumption and water production cost of conventional and renewable-energy-powered desalination processes. Renew. Sustain. Energy Rev. 2013, 24, 343–356. [Google Scholar] [CrossRef]
- Čuček, L.; Klemeš, J.J.; Kravanja, Z. A Review of Footprint analysis tools for monitoring impacts on sustainability. J. Clean. Prod. 2012, 34, 9–20. [Google Scholar] [CrossRef]
- Cornejo, P.; Santana, M.; Hokanson, D.; Mihelcic, J.R.; Zhang, Q. Carbon footprint of water reuse and desalination: A review of greenhouse gas emissions and estimation tools. J. Water Reuse Desalin. 2014, 4, 238–252. [Google Scholar] [CrossRef]
- Shrestha, E.; Ahmad, S.; Johnson, W.; Shrestha, P.; Batista, J.R. Carbon footprint of water conveyance versus desalination as alternatives to expand water supply. Desalination 2011, 280, 33–43. [Google Scholar] [CrossRef]
- Li, J.; Liu, Z.; He, C.; Yue, H.; Gou, S. Water shortages raised a legitimate concern over the sustainable development of the drylands of northern China: Evidence from the water stress index. Sci. Total Environ. 2017, 590–591, 739–750. [Google Scholar] [CrossRef]
- National Data: Resource and Environment. Available online: Data.stats.gov.cn/easyquery.htm?cn=C01 (accessed on 3 December 2018).
- Renewable Internal Freshwater Resources Per Capita (Cubic Meters)|Data. Available online: https://data.worldbank.org/indicator/ER.H2O.INTR.PC?view=chart (accessed on 3 December 2018).
- Regional Data by Provinces-Beijing-Resource and Environment. Available online: Data.stats.gov.cn/english/easyquery.htm?cn=E0103 (accessed on 3 December 2018).
- Where Is Earth’s Water? USGS Water-Science School. Available online: https://water.usgs.gov/edu/earthwherewater.html (accessed on 3 December 2018).
- Sheng, J.; Webber, M. Incentive-compatible payments for watershed services along the Eastern Route of China’s South-North Water Transfer Project. Ecosyst. Serv. 2017, 25, 213–226. [Google Scholar] [CrossRef]
- Annual Report for China Desalination. Available online: www.soa.gov.cn/zwgk/hygb/hykjnb_2186/201707/t20170719_57029.html (accessed on 3 December 2018).
- Hua, W.; Lijin, Z.; Xiaotian, F.; Spooner, S. Water-Energy Nexus in the Urban Water Source Selection: A Case Study from Qingdao; World Resources Institute Report; Water Resources Institute: Beijing, China, 2014; pp. 49–78. [Google Scholar]
- Soares, C.G. Advances in Renewable Energies Offshore: Proceedings of the 3rd International Conference on Renewable Energies Offshore (RENEW 2018), October 8–10, 2018, Lisbon, Portugal; CRC Press: Boca Raton, FL, USA, 2018; ISBN 978-0-429-99955-0. [Google Scholar]
- Zuo, L.; Ding, L.; Chen, J.; Zhou, X.; Xu, B.; Liu, Z. Comprehensive study of wind supercharged solar chimney power plant combined with seawater desalination. Sol. Energy 2018, 166, 59–70. [Google Scholar] [CrossRef]
- Li, G.; Law, W.-C.; Cheung Chan, K. Floating, highly efficient, and scalable graphene membranes for seawater desalination using solar energy. Green Chem. 2018, 20, 3689–3695. [Google Scholar] [CrossRef]
- Liu, S.Y.; Zhang, G.X.; Han, M.Y.; Wu, X.D.; Li, Y.L.; Chen, K.; Meng, J.; Shao, L.; Wei, W.D.; Chen, G.Q. Freshwater costs of seawater desalination: Systems process analysis for the case plant in China. J. Clean. Prod. 2018, 212, 677–686. [Google Scholar] [CrossRef]
- Raluy, G.; Serra, L.; Uche, J. Life cycle assessment of MSF, MED and RO desalination technologies. Energy 2006, 31, 2361–2372. [Google Scholar] [CrossRef]
- Karabelas, A.J.; Koutsou, C.P.; Kostoglou, M.; Sioumiddleoulos, D.C. Analysis of specific energy consumption in reverse osmosis desalination processes. Desalination 2018, 431, 15–21. [Google Scholar] [CrossRef]
- Pfister, S.; Koehler, A.; Hellweg, S. Assessing the Environmental Impacts of Freshwater Consumption in LCA. Environ. Sci. Technol. 2009, 43, 4098–4104. [Google Scholar] [CrossRef] [PubMed]
- Wilson, M.C.; Li, X.-Y.; Ma, Y.-J.; Smith, A.T.; Wu, J. A Review of the Economic, Social, and Environmental Impacts of China’s South-North Water Transfer Project: A Sustainability Perspective. Sustainability 2017, 9, 1489. [Google Scholar] [CrossRef]
- Caldera, U.; Bogdanov, D.; Breyer, C. Local cost of seawater RO desalination based on solar PV and wind energy: A global estimate. Desalination 2016, 385, 207–216. [Google Scholar] [CrossRef]
- Wittholz, M.K.; O’Neill, B.K.; Colby, C.B.; Lewis, D. Estimating the cost of desalination plants using a cost database. Desalination 2008, 229, 10–20. [Google Scholar] [CrossRef]
- Riedel, S. ISCC 205 Greenhouse Gas Emissions. In Greenhouse Gas Emissions; ISCC: Köln, Germany, 2017. [Google Scholar]
- Brander, M.; Sood, A.; Wylie, C.; Haughton, A.; Lovell, J. Technical Paper|Electricity-Specific Emission Factors for Grid Electricity. Ecometrica 2011, 22, 1–22. [Google Scholar]
- Zhou, Y.; Tol, R.S.J. Implications of desalination for water resources in China—An economic perspective. Desalination 2004, 164, 225–240. [Google Scholar] [CrossRef]
- Electricity Price for Water Desalination Plants in Shandong. Available online: www.sdwj.gov.cn/ggfw/jggl/zls/11/171295.shtml (accessed on 6 December 2018).
- Pinto, F.S.; Marques, R.C. Desalination projects economic feasibility: A standardization of cost determinants. Renew. Sustain. Energy Rev. 2017, 78, 904–915. [Google Scholar] [CrossRef]
- Zarzo, D.; Prats, D. Desalination and energy consumption. What can we expect in the near future? Desalination 2018, 427, 1–9. [Google Scholar] [CrossRef]
- Water Technology—Tuaspring Desalination and Integrated Power Plant. Available online: www.water-technology.net/projects/tuaspring-desalination-and-integrated-power-plant/ (accessed on 9 January 2019).
- Water Technology—Tuas Seawater Desalination Plant. Available online: www.water-technology.net/projects/tuas-seawater-desalination/ (accessed on 9 January 2019).
- Grubert, E.A.; Stillwell, A.S.; Webber, M.E. Where does solar-aided seawater desalination make sense? A method for identifying sustainable sites. Desalination 2014, 339, 10–17. [Google Scholar] [CrossRef]
- Wang, Y.; Lior, N. Thermoeconomic analysis of a low-temperature multi-effect thermal desalination system coupled with an absorption heat pump. Energy 2011, 36, 3878–3887. [Google Scholar] [CrossRef]
- Dai, J.Y.; Wu, L.Y.; Zhang, Y.G.; Tang, Z.X. Brief analysis on environmental influence and comprehensive utilization of brine from thermal desalination. Guangdong Chem. Ind. 2018, 365, 48–51. (In Chinese) [Google Scholar]


| Item | Description | Value |
|---|---|---|
| Quantity | Number of plants | 131 |
| Capacity | Total Project capacity | 1.19 × 10⁶ m3/d |
| Plants capacity > 104 m3/d | Number of plants: 36, Total capacity 106 m3/d | |
| Plants capacity (1–104 m3) | Number of plants: 38, Total capacity 118 × 103 m3/d | |
| Plants capacity < 103 km3 | Number of plants: 57, Total capacity 11 × 103 m3/d | |
| Benefits | The added value of seawater desalination plants | 1.5 × 10⁹ CNY/y |
| Process | Specific Energy Consumption kWh/m3 |
|---|---|
| RO (seawater) | 5.0 |
| MED | 17.9 |
| MSF | 23.4 |
| ED | 4.1 |
| Parameters | Value | Units |
|---|---|---|
| Total capacity | 204,390 | m3/d |
| Feedwater TDS | 34,500 | mg/L |
| Process | RO 4 stages | - |
| Capital cost of the plant | 537 M | USD |
| Process | Fixed Cost Contribution | Operating Contribution | Energy Cost Contribution in Operating Cost | EOP |
|---|---|---|---|---|
| RO (seawater) | 35% | 65% | 35% | 54% |
| RO (brackish water) | 35% | 65% | 30% | 46% |
| MED | 40% | 60% | 45% | 75% |
| MSF | 40% | 60% | 45% | 75% |
| Water Supplies | Energy Demand (kWh/m3) | Water Supply Potential (Mm3) |
|---|---|---|
| Surface water | 0.43 | 980 |
| Water transfer from Yellow River | 0.70 | 1090 |
| Groundwater | 0.78 | 1700 |
| Reclaimed water | 0.82 | 2100 |
| Water transfer from Yangtze river | 1.14 | 2410 |
| Brackish water desalination | 1.40 | 2470 |
| Seawater desalination (RO) [24] | 4.34 | 2650 |
© 2019 by the authors. Licensee MDPI, Basel, Switzerland. This article is an open access article distributed under the terms and conditions of the Creative Commons Attribution (CC BY) license (http://creativecommons.org/licenses/by/4.0/).
Share and Cite
Jia, X.; Klemeš, J.J.; Varbanov, P.S.; Wan Alwi, S.R. Analyzing the Energy Consumption, GHG Emission, and Cost of Seawater Desalination in China. Energies 2019, 12, 463. https://doi.org/10.3390/en12030463
Jia X, Klemeš JJ, Varbanov PS, Wan Alwi SR. Analyzing the Energy Consumption, GHG Emission, and Cost of Seawater Desalination in China. Energies. 2019; 12(3):463. https://doi.org/10.3390/en12030463
Chicago/Turabian StyleJia, Xuexiu, Jiří Jaromír Klemeš, Petar Sabev Varbanov, and Sharifah Rafidah Wan Alwi. 2019. "Analyzing the Energy Consumption, GHG Emission, and Cost of Seawater Desalination in China" Energies 12, no. 3: 463. https://doi.org/10.3390/en12030463
APA StyleJia, X., Klemeš, J. J., Varbanov, P. S., & Wan Alwi, S. R. (2019). Analyzing the Energy Consumption, GHG Emission, and Cost of Seawater Desalination in China. Energies, 12(3), 463. https://doi.org/10.3390/en12030463