Article

Research on Coal Pillar Malposition Distance Based on Coupling Control of Three-Field in Shallow Buried Closely Spaced Multi-Seam Mining, China

1
School of Energy Engineering, Xi’an University of Science and Technology, Xi’an 710054, Shaanxi, China
2
Key Laboratory of Western Mine Exploitation and Hazard Prevention of Ministry of Education, Xi’an University of Science and Technology, Xi’an 710054, Shaanxi, China
*
Authors to whom correspondence should be addressed.
Energies 2019, 12(3), 462; https://doi.org/10.3390/en12030462
Submission received: 28 December 2018 / Revised: 26 January 2019 / Accepted: 29 January 2019 / Published: 31 January 2019
(This article belongs to the Section B: Energy and Environment)

Abstract

:
In order to explore the rational coal pillar malposition distance (CPMD) based on coupling control of stress field, displacement field and fracture field (three-field) in shallow buried closely spaced multi-seam (SBCSM-S) mining, and realize coupling control of underground concentrated stress and ground surface fractures, taking the No. 1–2 and No. 2–2 coal seams mining in the northward east area of Ningtiaota coal mine as background, through physical simulation and theoretical analysis, the three-field evolution in SBCSM-S mining was analysed, the effect of different CPMD on coal pillar concentrated stress, ground surface subsidence and fractures development was revealed, and the rational CPMD based on coupling control of three-field was put forward. The results show that the concentrated fractures and concentrated stress are due to the strata’s uneven subsidence by coal pillars. Rational arrangement of CPMD can avoid the superposition of vertical stress caused by upper and lower coal pillars and reduce the development of ground fractures and uneven subsidence. Two theoretical models were established: one was based on the control of a concentrated stress field, the other on the control of the displacement and fracture fields. These results will be applied in a follow-up arrangement at the Ningtiaota coal mine, and can provide a new way for safe and green mining in SBCSM-S.

1. Introduction

The Jurassic Coalfield in northern Shaanxi, China, is one of the world’s seven largest coalfields (location is depicted in Figure 1). It has shallow coal seam reserves and mining conditions are attractive. It is characterized by small inter-burden strata thickness between two coal seams (no more than 40 m), and three to five coal seams mainly mined; overall, it is categorized as SBCSM-S mining [1]. Engineering practice has revealed two major problems: the concentrated stress caused by coal pillars, resulting in difficult lower roadway support, and serious ground surface fractures caused by repetitive mining; the surface has an uneven subsidence [2]. Consequently realizing scientized mining, characterized by safe, efficient and environmental protection, is a significant problem that needs solving [3,4,5].
Three-field evolution in SBCSM-S mining is the basis for the control of underground pressure and ground surface damage. Scholars have carried out lots of research on stress, displacement and fracture fields. Firstly, studies on stress field have gained enough attention. They were put forward based on single seam mining [6,7,8,9]. However, in relation to spaced multi-seam mining, Bai et al. [10] studied the mechanism of mining-induced stress evolution and support accidents by theoretical analysis and numerical simulation. Kong et al. [11] analysed the destroyed floor depth of upper seams, and revealed the stress distribution under the upper coal pillar. Zhang et al. [12] explored the mining-induced localized stress concentration and the interlayer rock failure behavior. Liu et al. [13] analysed stress evolution characteristics of surrounding rocks in closely spaced multi-seam mining. Zhao et al. [14] studied the stress at the bottom of the upper pillar and deformation of surrounding rock in lower roadways; the size of the coal pillar and coal pillar malposition distance was given.
Studies referring to displacement fields and ground surface subsidence characteristics in shallow seam mining have been indicated by physical simulation and observation stations [15,16,17,18,19,20,21]. Based on interferometric synthetic aperture radar, Yang et al. [22] proposed the probability integral method (PIM) to predict the horizontal and vertical displacements induced by mining. Zhou et al. [23] studied the internal mechanism behavior and characteristics of the surface subsidence in coal mining areas with thick alluvium, and classified the surface subsidence into four parts. B. Ghabraie et al. [24] found that the panel configurations of the two seams have a significant impact on multi-seam subsidence development. It showed that the multi-seam mine area can be divided into different zones, and the characterisation of subsidence was proposed. Zuo et al. [25] obtained the real-time stress distribution and evolution of rock strata movement during the mining process.
In addition, other studies about fracture fields were carried out. Huang et al. [26,27] revealed that the fractures of overlying strata induced by mining are mainly composed of “upwards fractures” and “downward fractures”. Based on this, water resisting criterion were put forward, and the calculation model of fracture development height in shallow coal seam strip-filling mining was established. Xue et al. [28] observed the fracture evolution law in shallow buried seam mining, and analysed the formation mechanism of stepped shearing-induced failure. Huang et al. [29] indicated fracture development in multi-seam mining, and discussed the height of the water flowing fractured zone. Through field survey and remote sensing interpretation, Fan et al. [30] summarized the development characteristics of ground fractures in Yushenfu Coalfield.
In a study referring to three-field evolution characteristics, Sun et al. [31] analyzed the stress redistribution and fracture growth caused by mining, and two models were presented to study the vertical stress and fracture growth in the floor strata, respectively. Yang et al. [32] proposed the mechanical model of “cantilever beam and elastic foundation beam” to calculate the stress distribution and fracture initiation angle of the overlying strata, studying the fracture propagation direction. Chen et al. [33] studied the evolution characteristics of mining stress and fracture in superimposed mining. Guo et al. [34] revealed longwall mining-induced strata movements, stress changes, fractures, and gas flow dynamics in a deep underground coal mine, analyzing a three-dimensional annular-shaped overlying zone along the perimeter of the longwall panel. Through similar material simulation experiments, Li et al. [35] pointed out the distribution and evolution rules of displacement, fracture and stress of overlying strata under the conditions of single coal seam mining and multi-seam mining. The studies can provide helpful references for this paper. While, based on SBCSM-S mining conditions, CPMD has an obvious effect on three-field evolution, three-field evolution characteristics and the methods to realize coupling control of three-field are still to be studied.
This paper took SBCSM-S mining in Ningtiaota coal mine as the background. Combining it with physical simulation and theoretical analysis, the three-field evolution law based on different CPMD was revealed, and theoretical models of realizing three-field coupling control were established. Finally, a rational CPMD was determined. The research results will be applied in a follow-up arrangement with the mine. In the long run, it can provide a basis for safety and green mining.

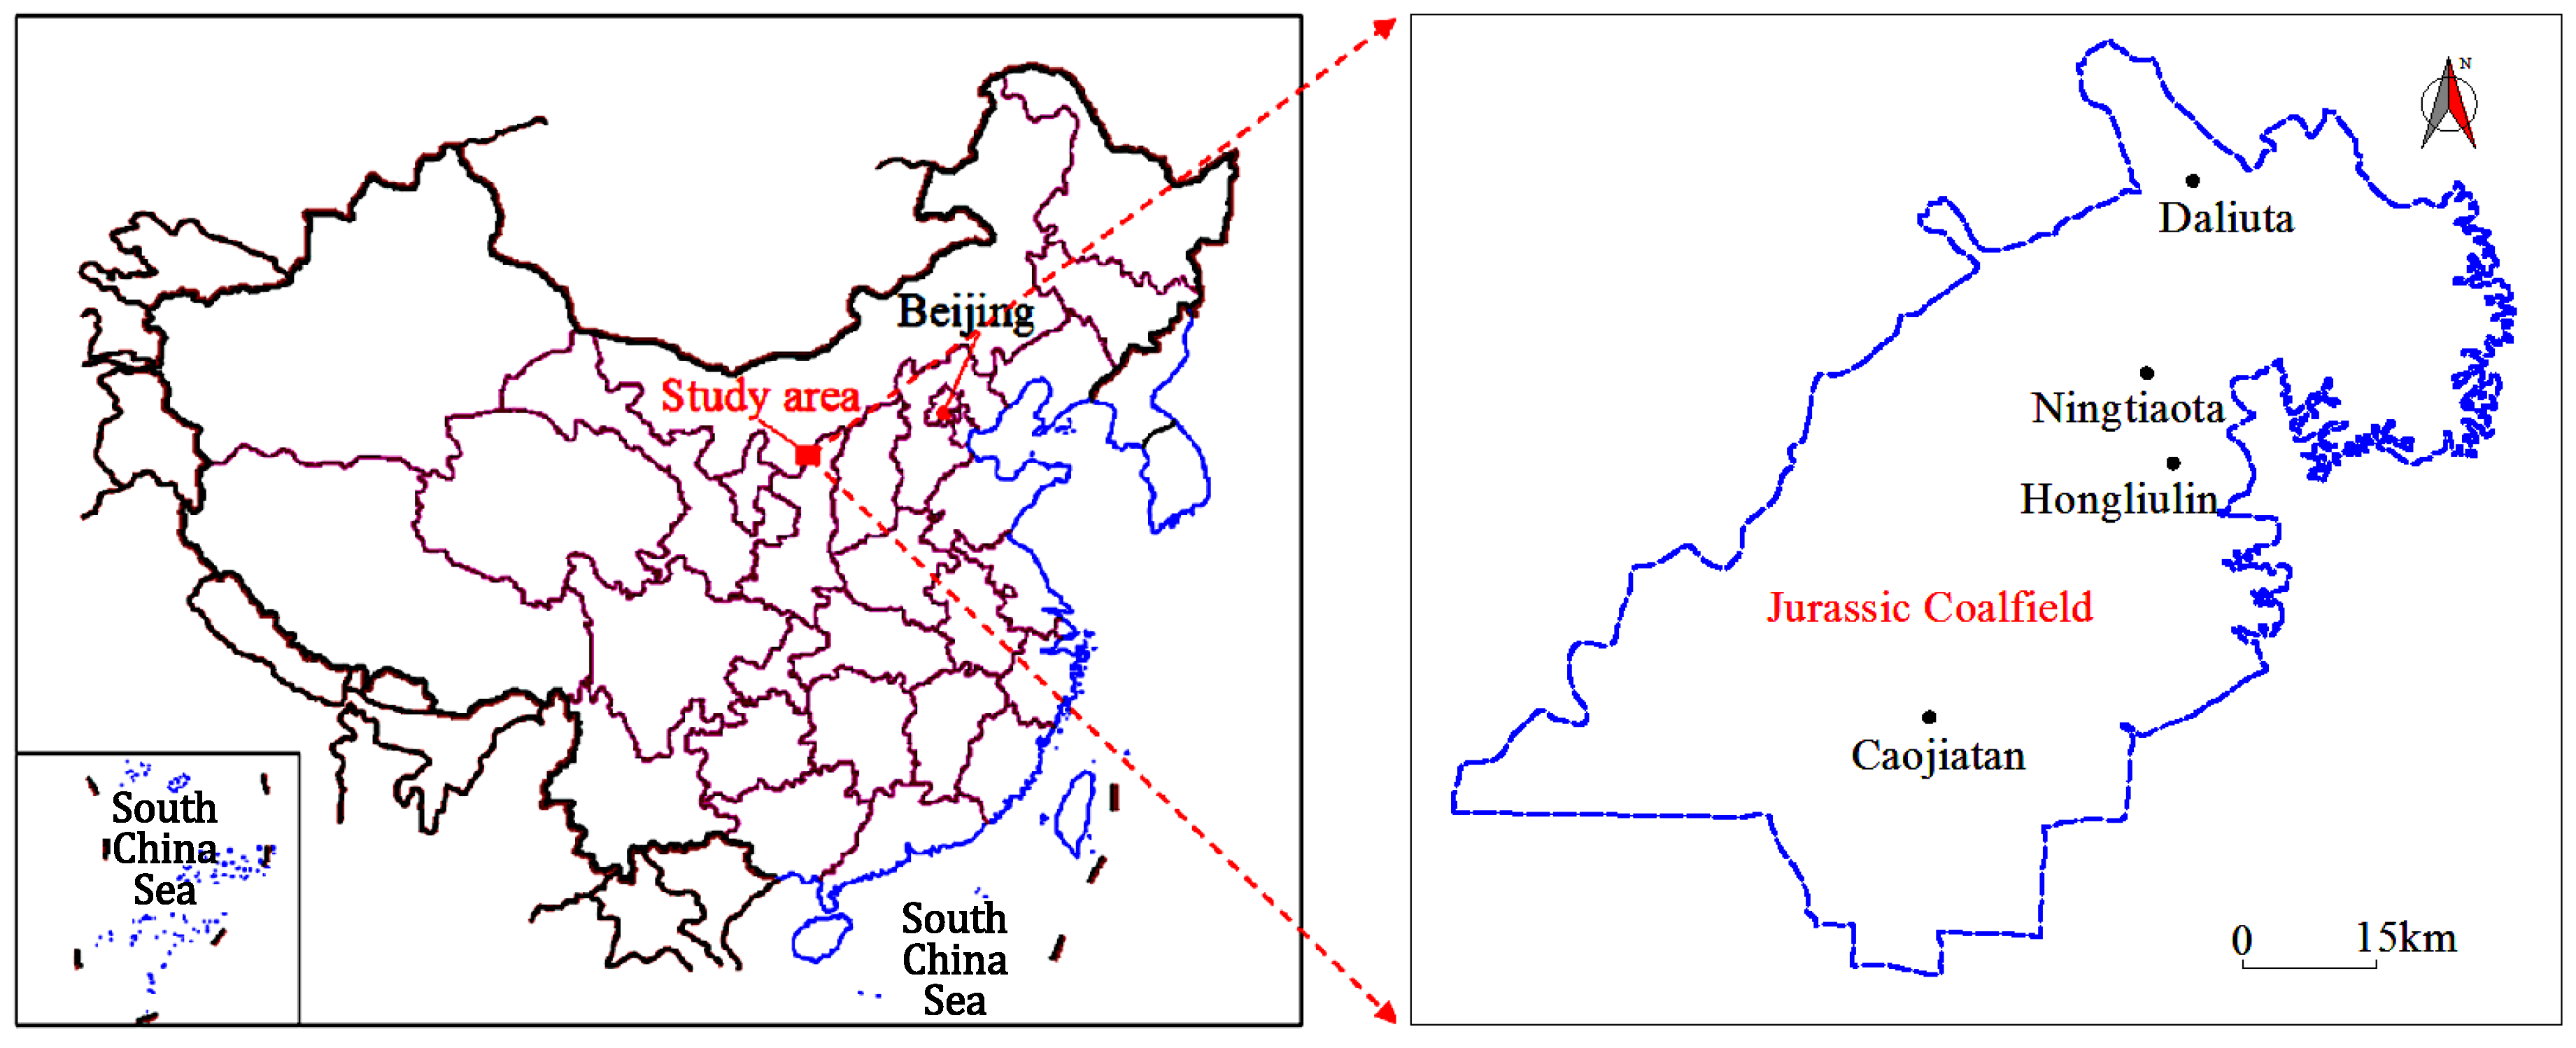
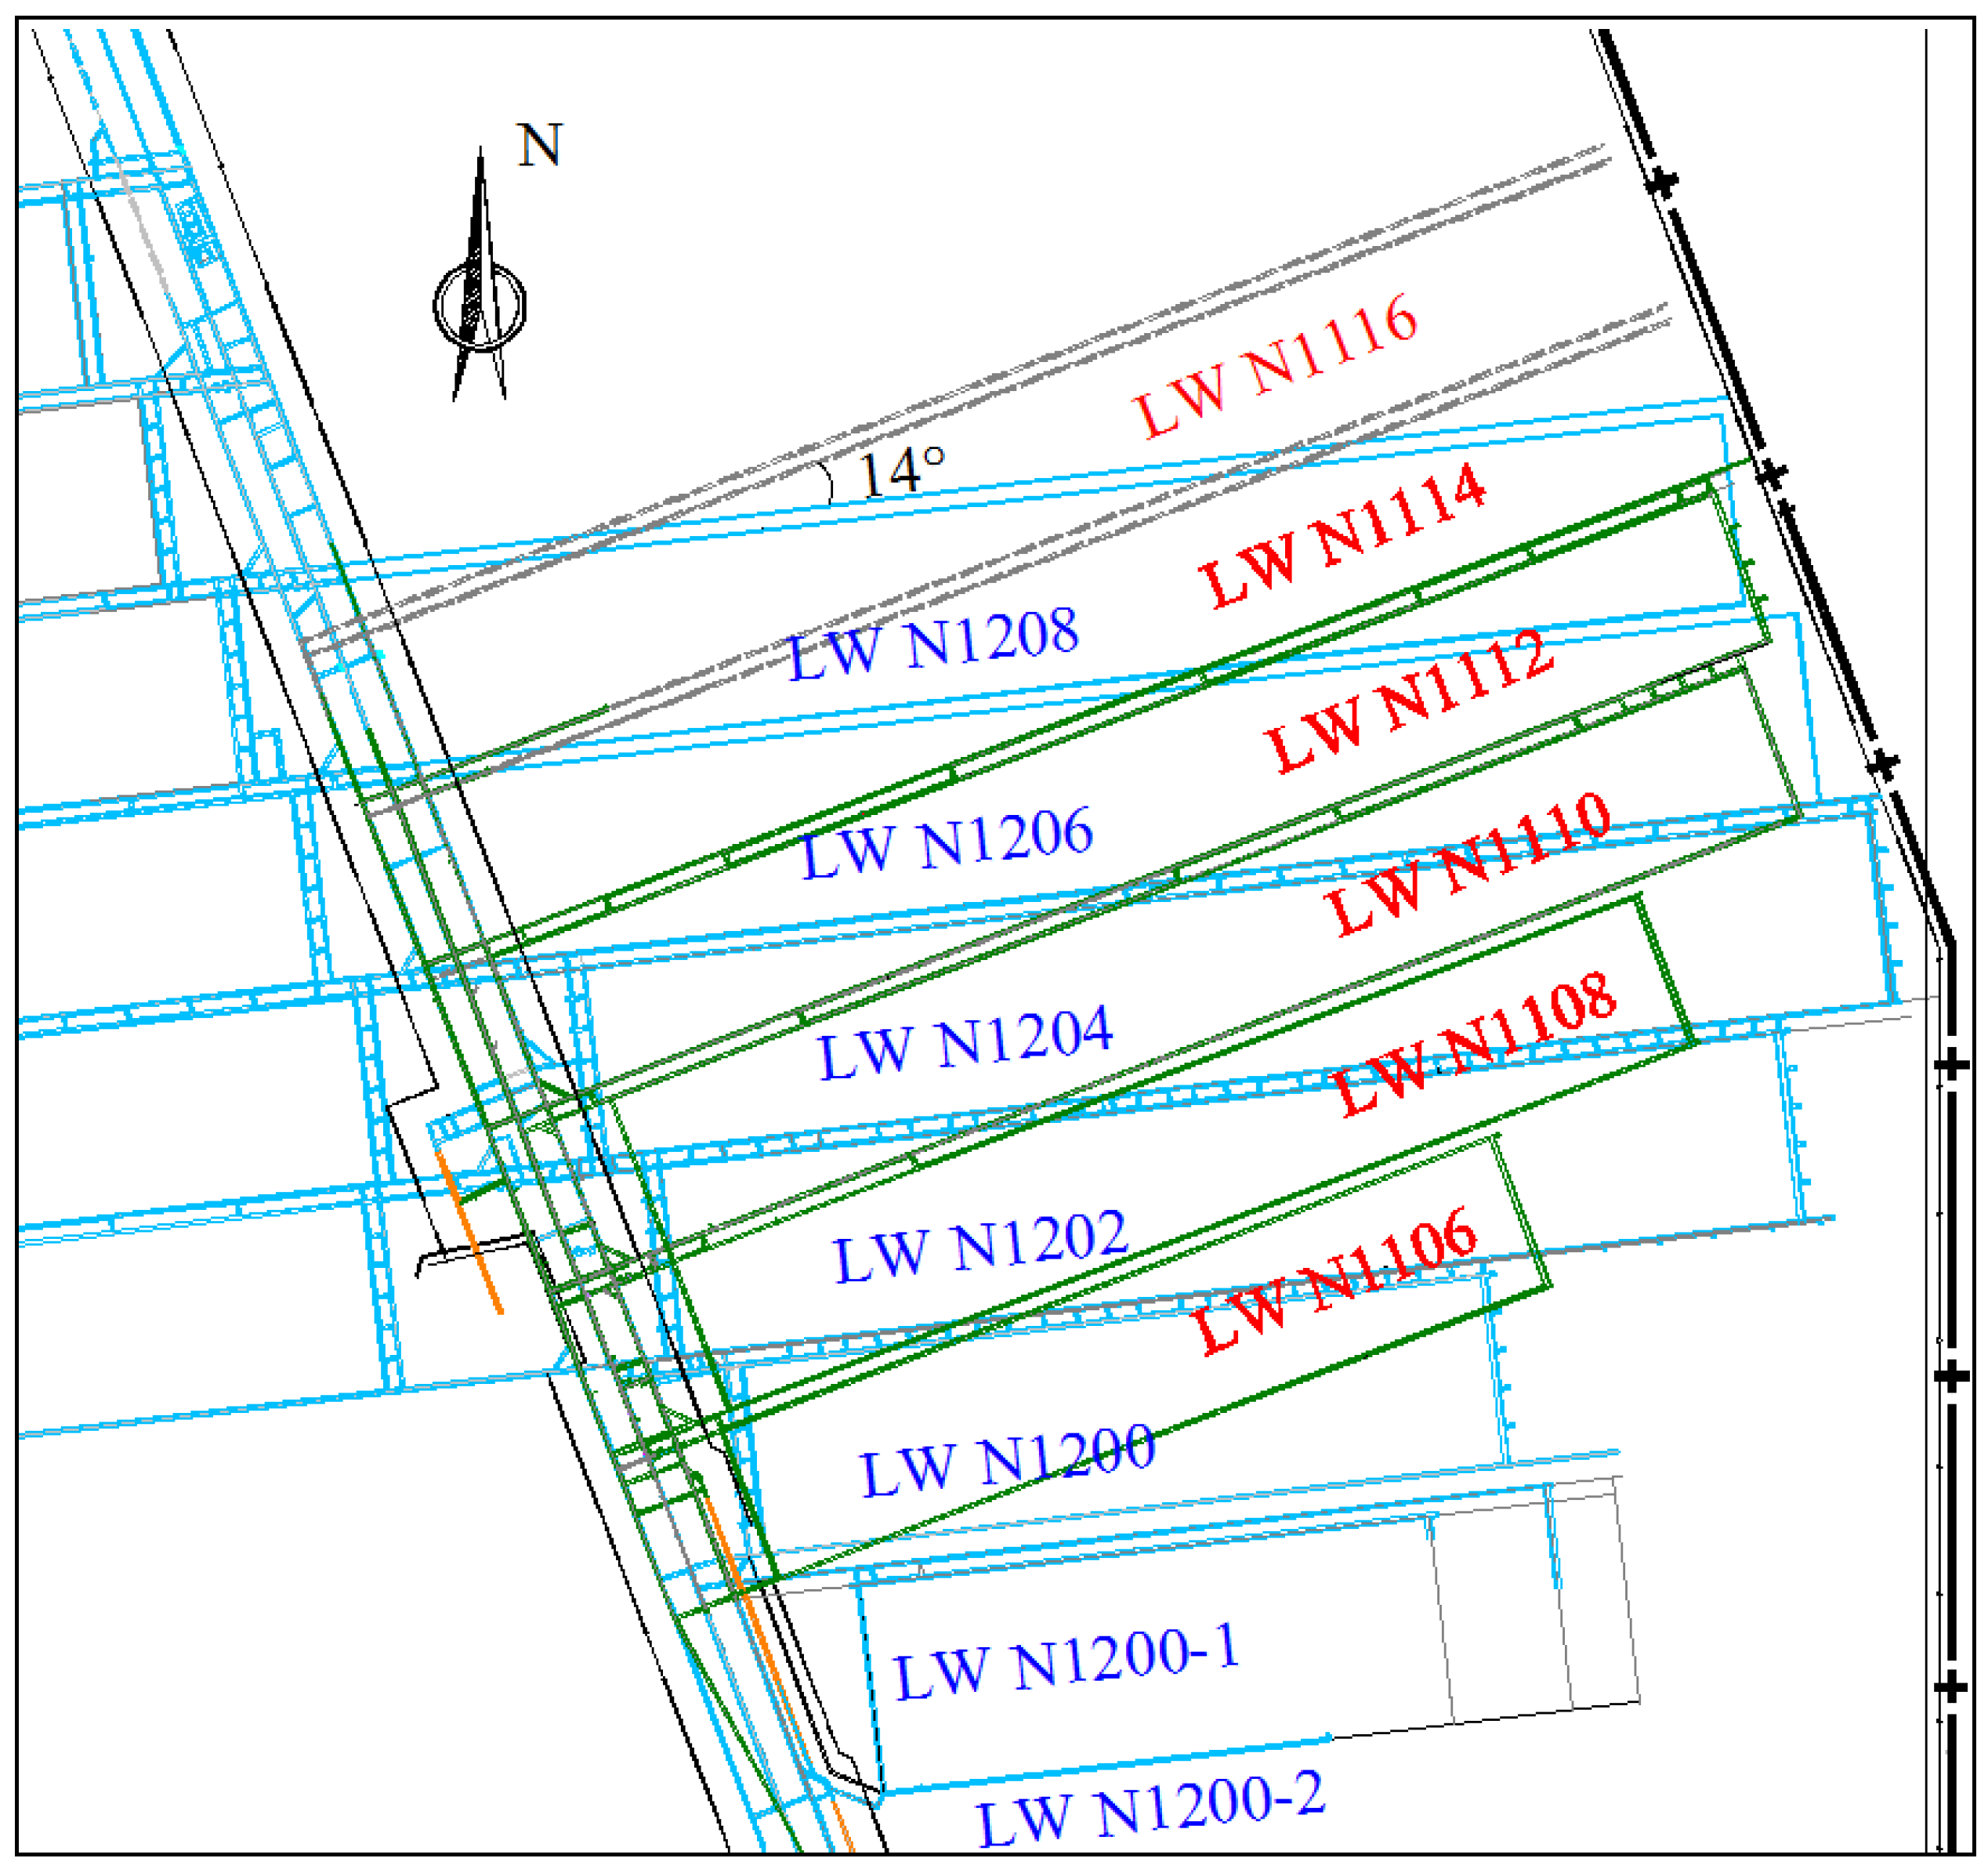
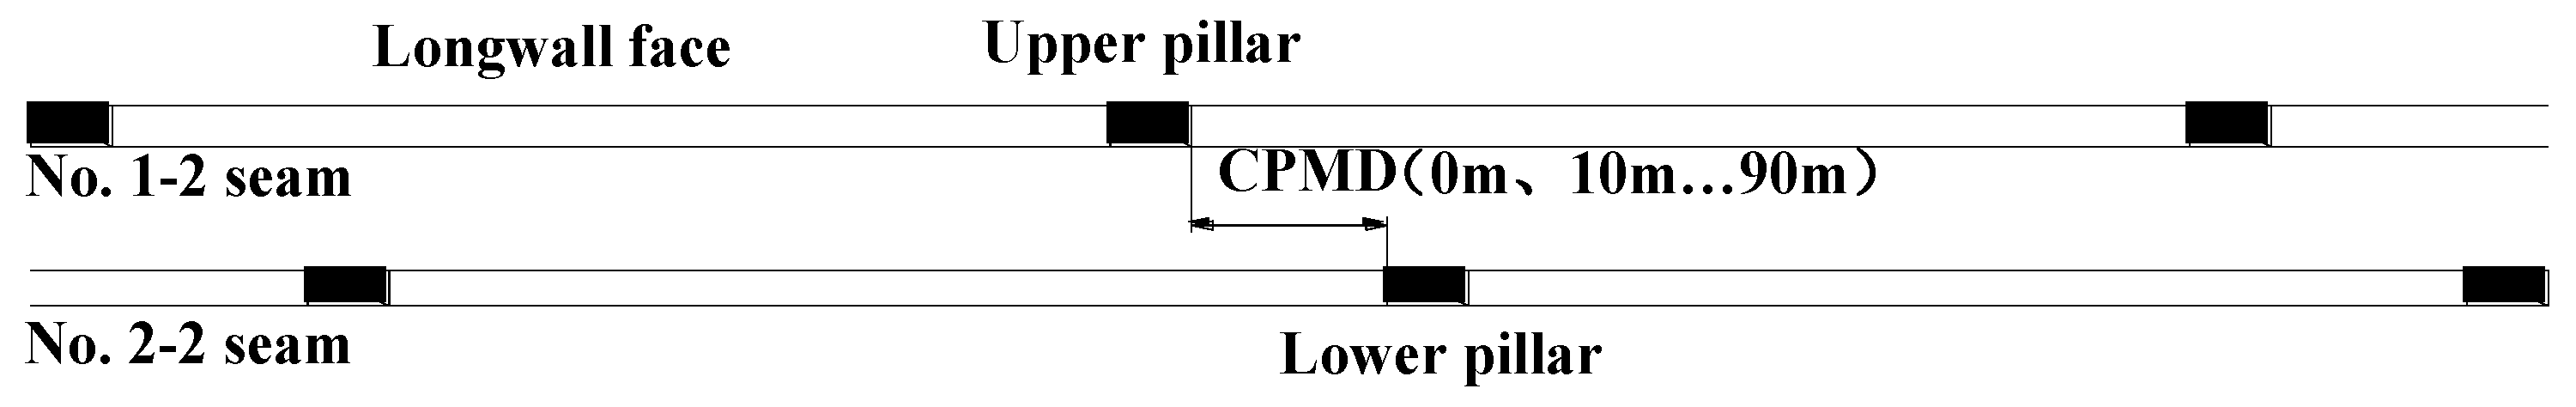
2. Engineering Background

2.1. Geological Conditions

The Ningtiaota coal mine is located in the Shennan coal mining area. The northward east area mainly mines No. 1–2 (upper seam) and No. 2–2 (lower seam) coal seams. The mining height of No. 1–2 seam is 1.84 m on average, and it mines 110 m deep. The mining height of No. 2–2 seam is 5 m on average, the longwall face width of the two seams is 245 m, the interburden strata thickness is 35 m on average, and the coal pillar width of the two seams are 20 m. Its geological conditions are generally characterized by a simple geological structure, flat coal seams, shallow buried, thin bedrock and thick alluvium soil; consequently, it belongs to the SBCSM-S mining category.
According to drillhole NBK26, the thickness of bedrock roof above the No. 1–2 seam is 70 m on average, while the alluvium (red soil) thickness is 94.7 m. Parameters of the coal, its roof and floor are listed in Table 1, and Figure 2 shows the longwall face arrangement.

2.2. Main Problems

There are two main problems in SBCSM-S mining. On the one hand, longwall faces in No. 1–2 and No. 2–2 seams form an angle of 14° (Figure 2), in particular, every longwall face mining in No. 2–2 seam usually passes through three longwall face goafs in No. 1–2 seam, which leads to a complicated position relationship of longwall faces in the two seams during No. 2–2 seam mining. After No. 1–2 seam mining, due to the concentrated stress induced by its coal pillars, the concentrated stress of No. 2–2 seam coal pillars is relatively larger, which causes unclear stress distribution of interburden strata, and the lower roadway support becomes more difficult.
On the other hand, under SBCSM-S mining conditions, affected by upper and lower coal pillars, the ground surface subsidence is uneven. Meanwhile, ground surface fractures develop, and the coal mine environment is already damaged (Figure 3).

3. Physical Simulation

3.1. Experimental Design

(1) Experimental model and monitoring method
The physical simulation model was built with the following dimensions: 5 m long × 0.2 m wide × 1.35 m high. The major similarity coefficients were chosen as follows: geometric ratio α l is 1:200, bulk density ratio α γ is 1:1.5, and strength ratio α R is 1:300. The selection of raw materials for rock strata simulation determines the correctness of the experiment results. Considering the lithology and raw material property, during model set up, sand (granular loose material, bulk density is 1600 kg/m3) was used as the aggregate, gypsum and calcium carbonate were adopted as cementitious materials, and mica powder (diameter is 1.4–5 mm) was applied to simulate tectonic fissure. Figure 4 shows the experimental model; material ratio is listed in Table 2.
The experimental monitoring system can be divided into three parts:
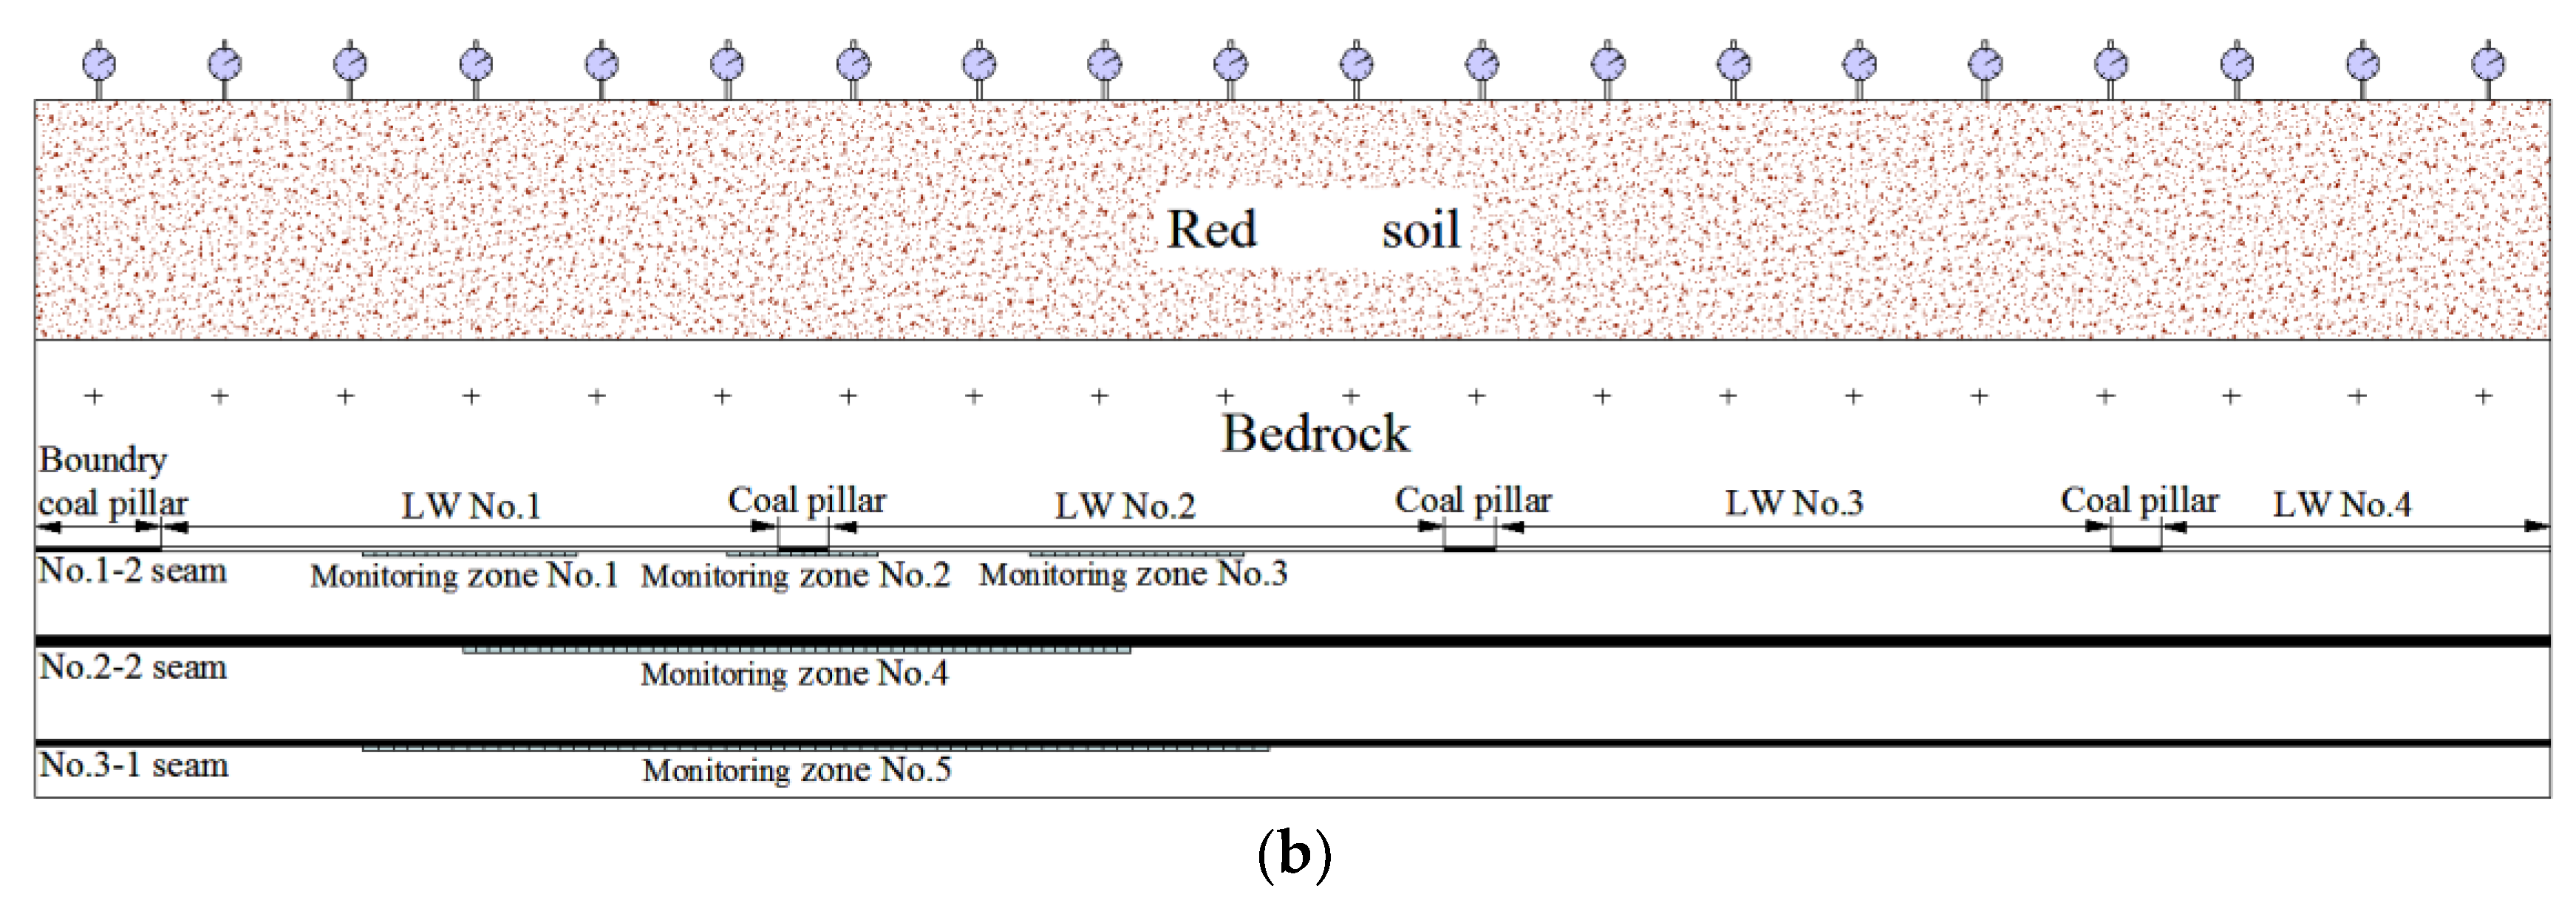
  • Stress monitoring: In order to acquire the stress distribution of goaf and coal pillars after No. 1–2 seam mining, and analyse the stress distribution of two seams mining, the CL-YB-152 force test sensors were adopted with dimensions of 20 cm long × 2.5 cm wide × 1 cm high. They were located under the coal seams and divided into four monitoring zones (Figure 4b).
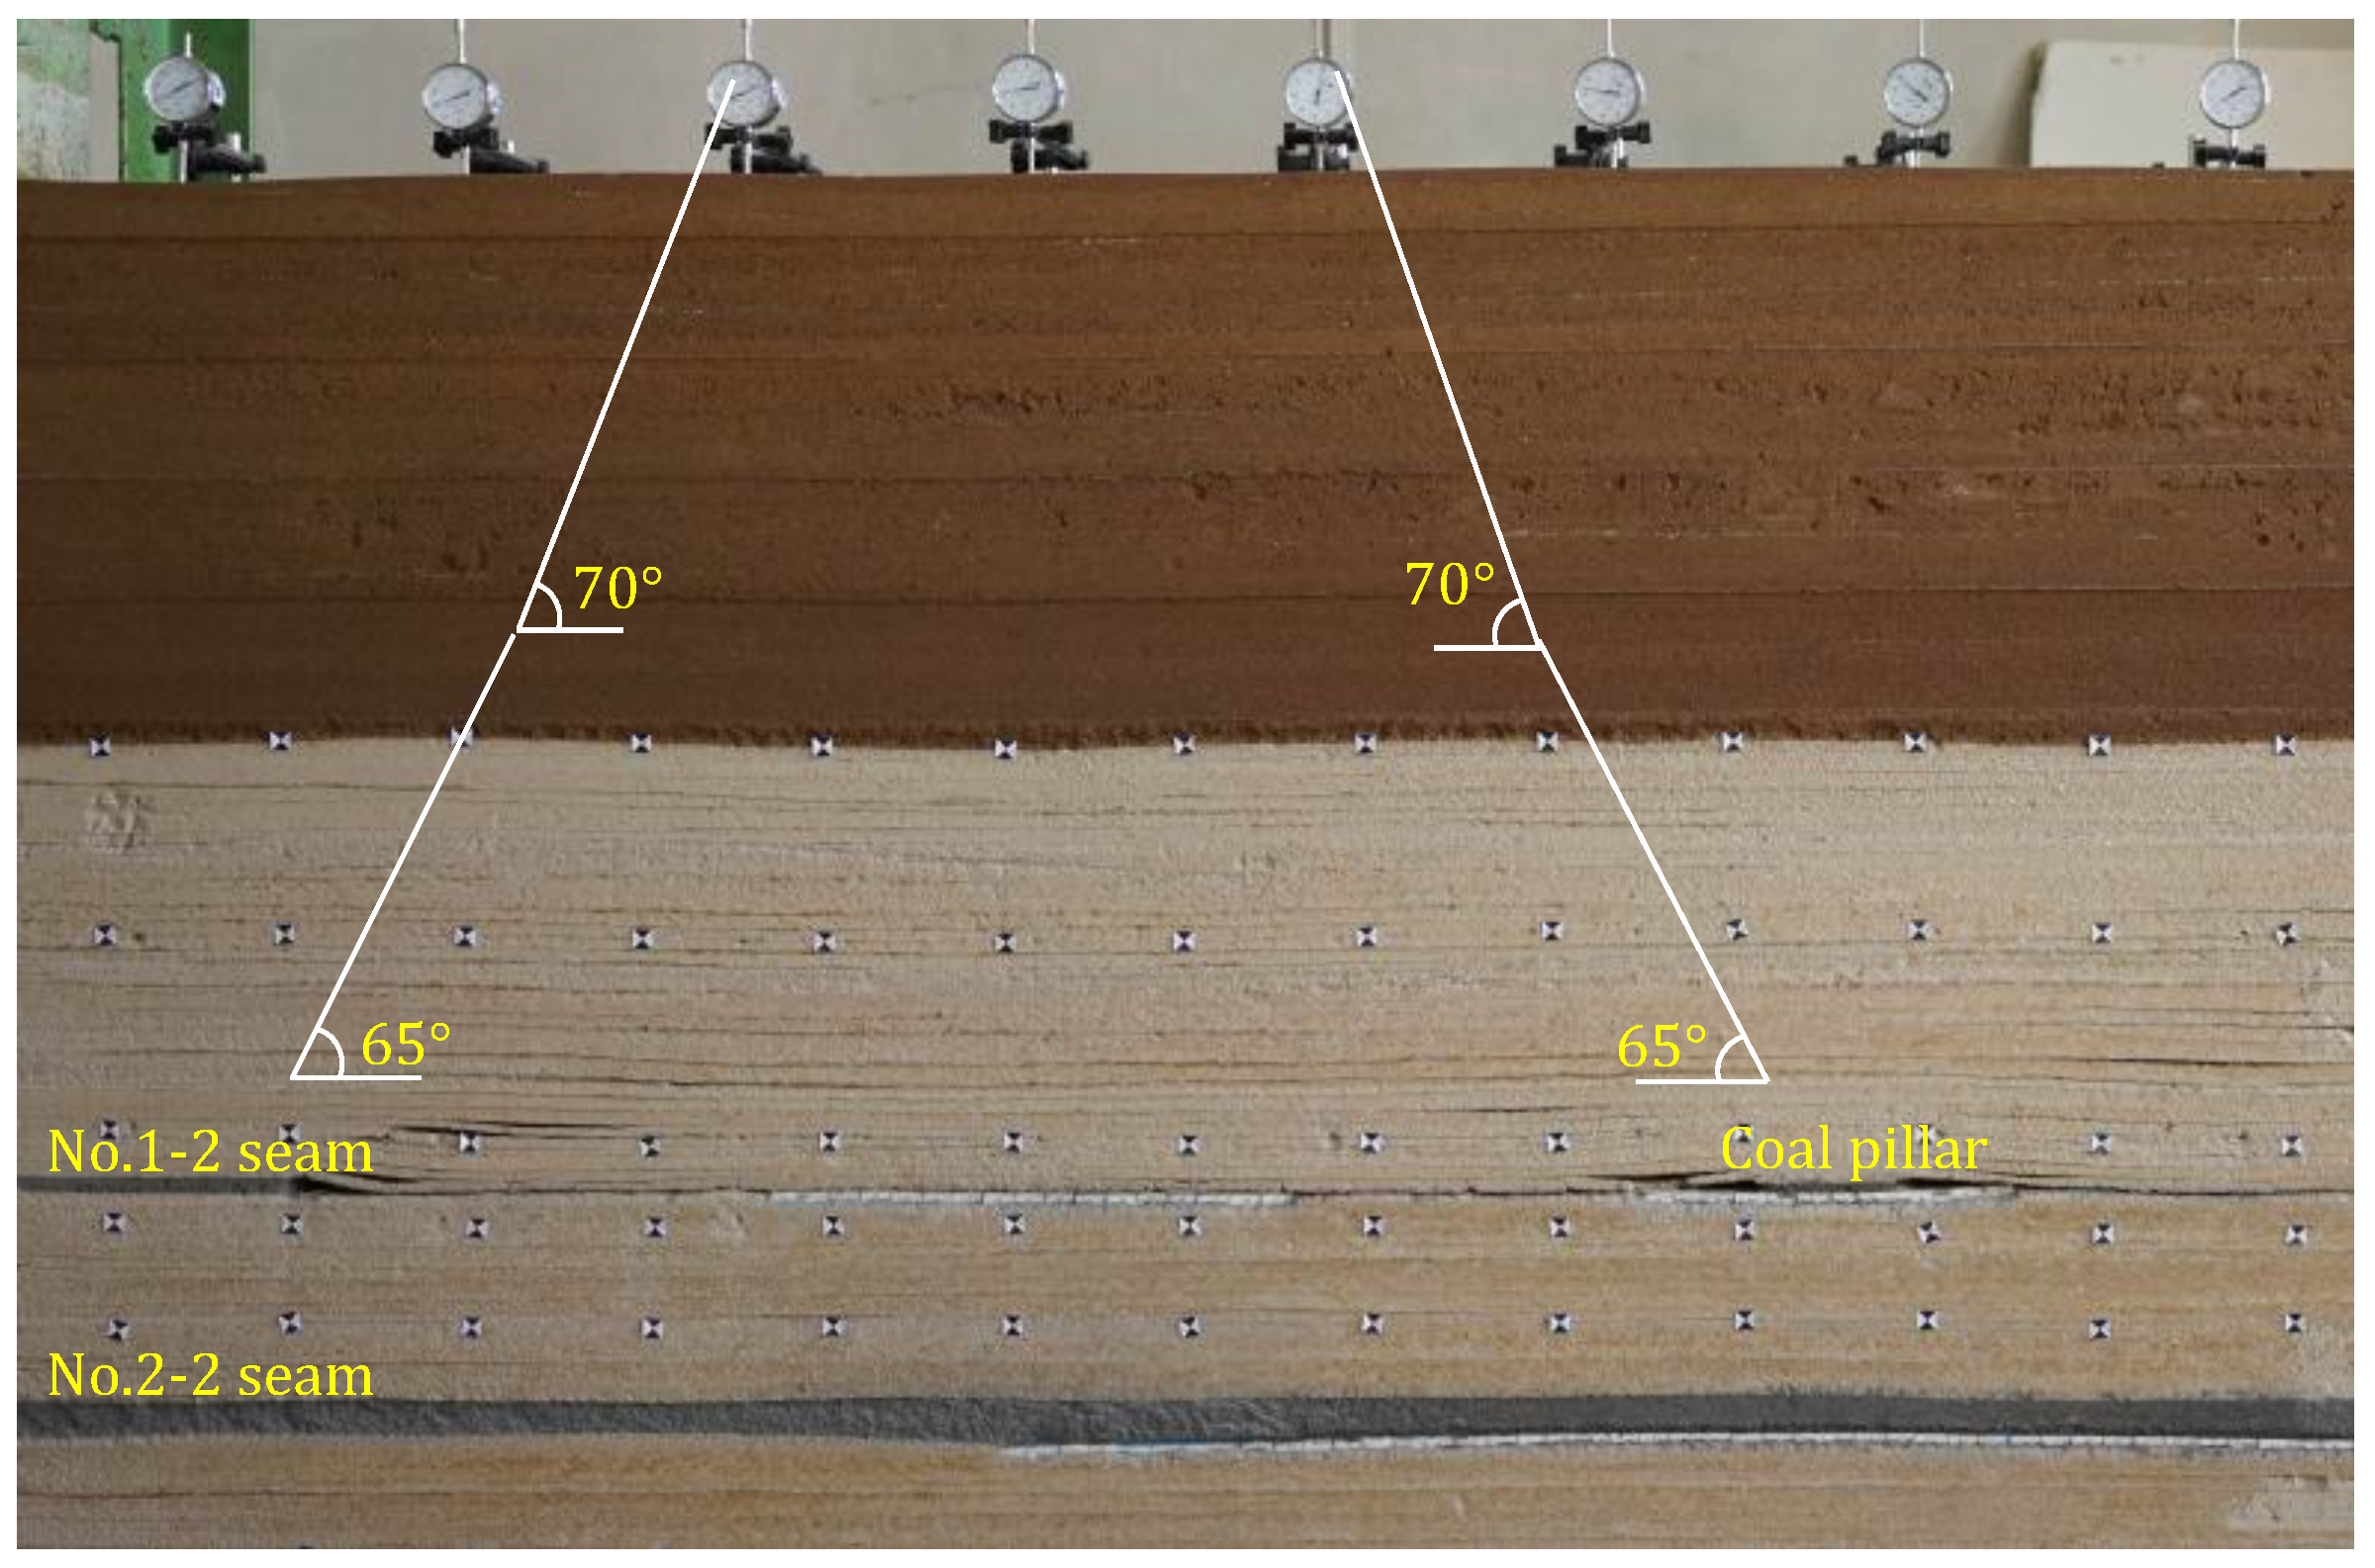
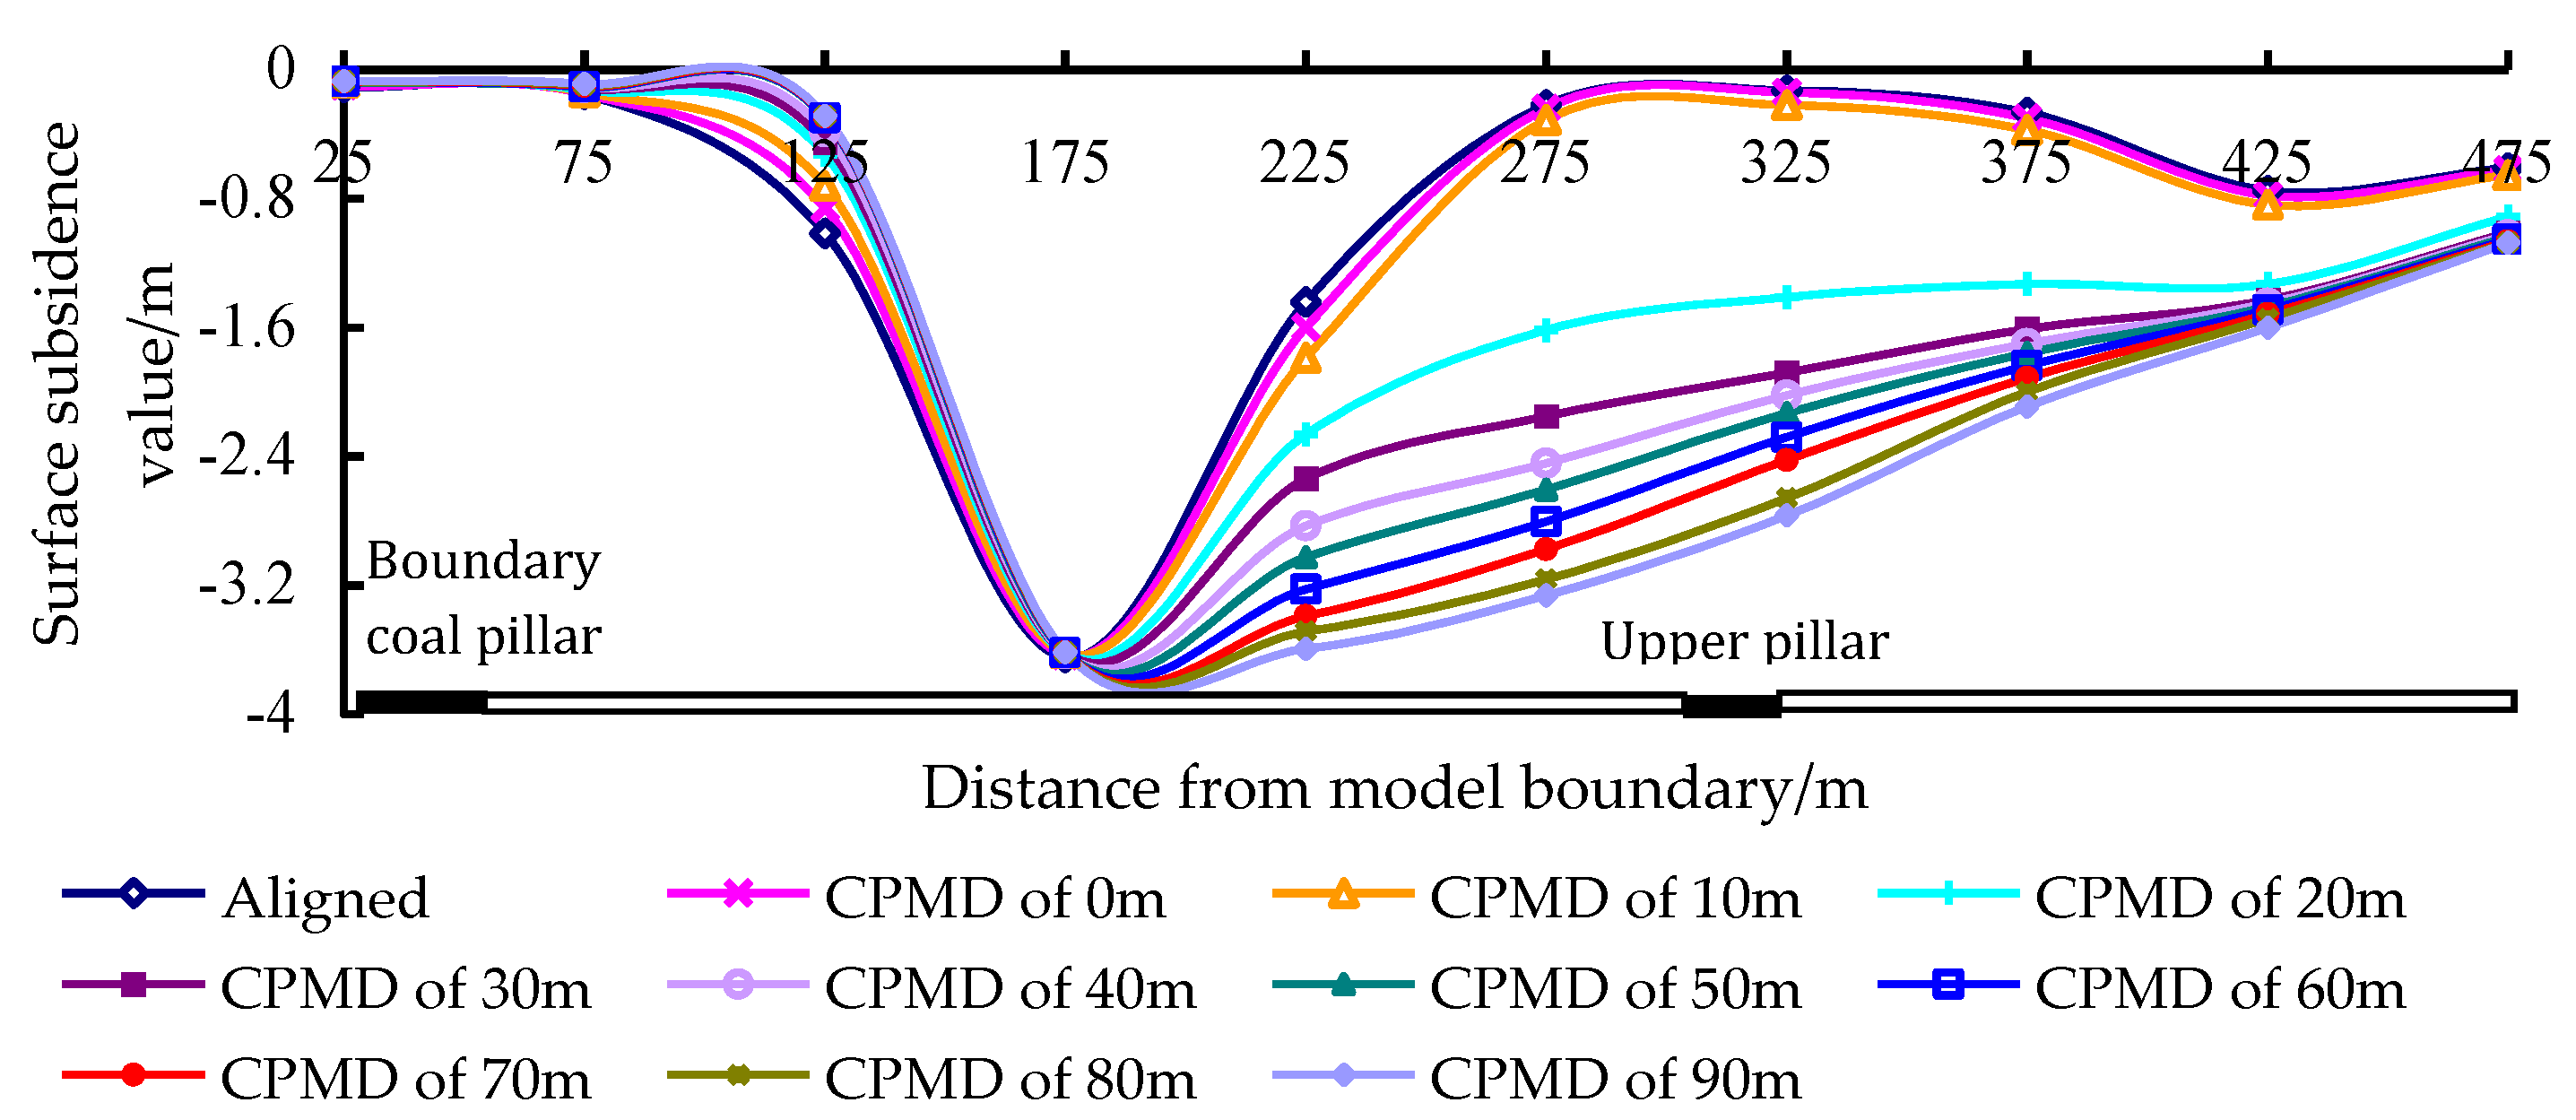
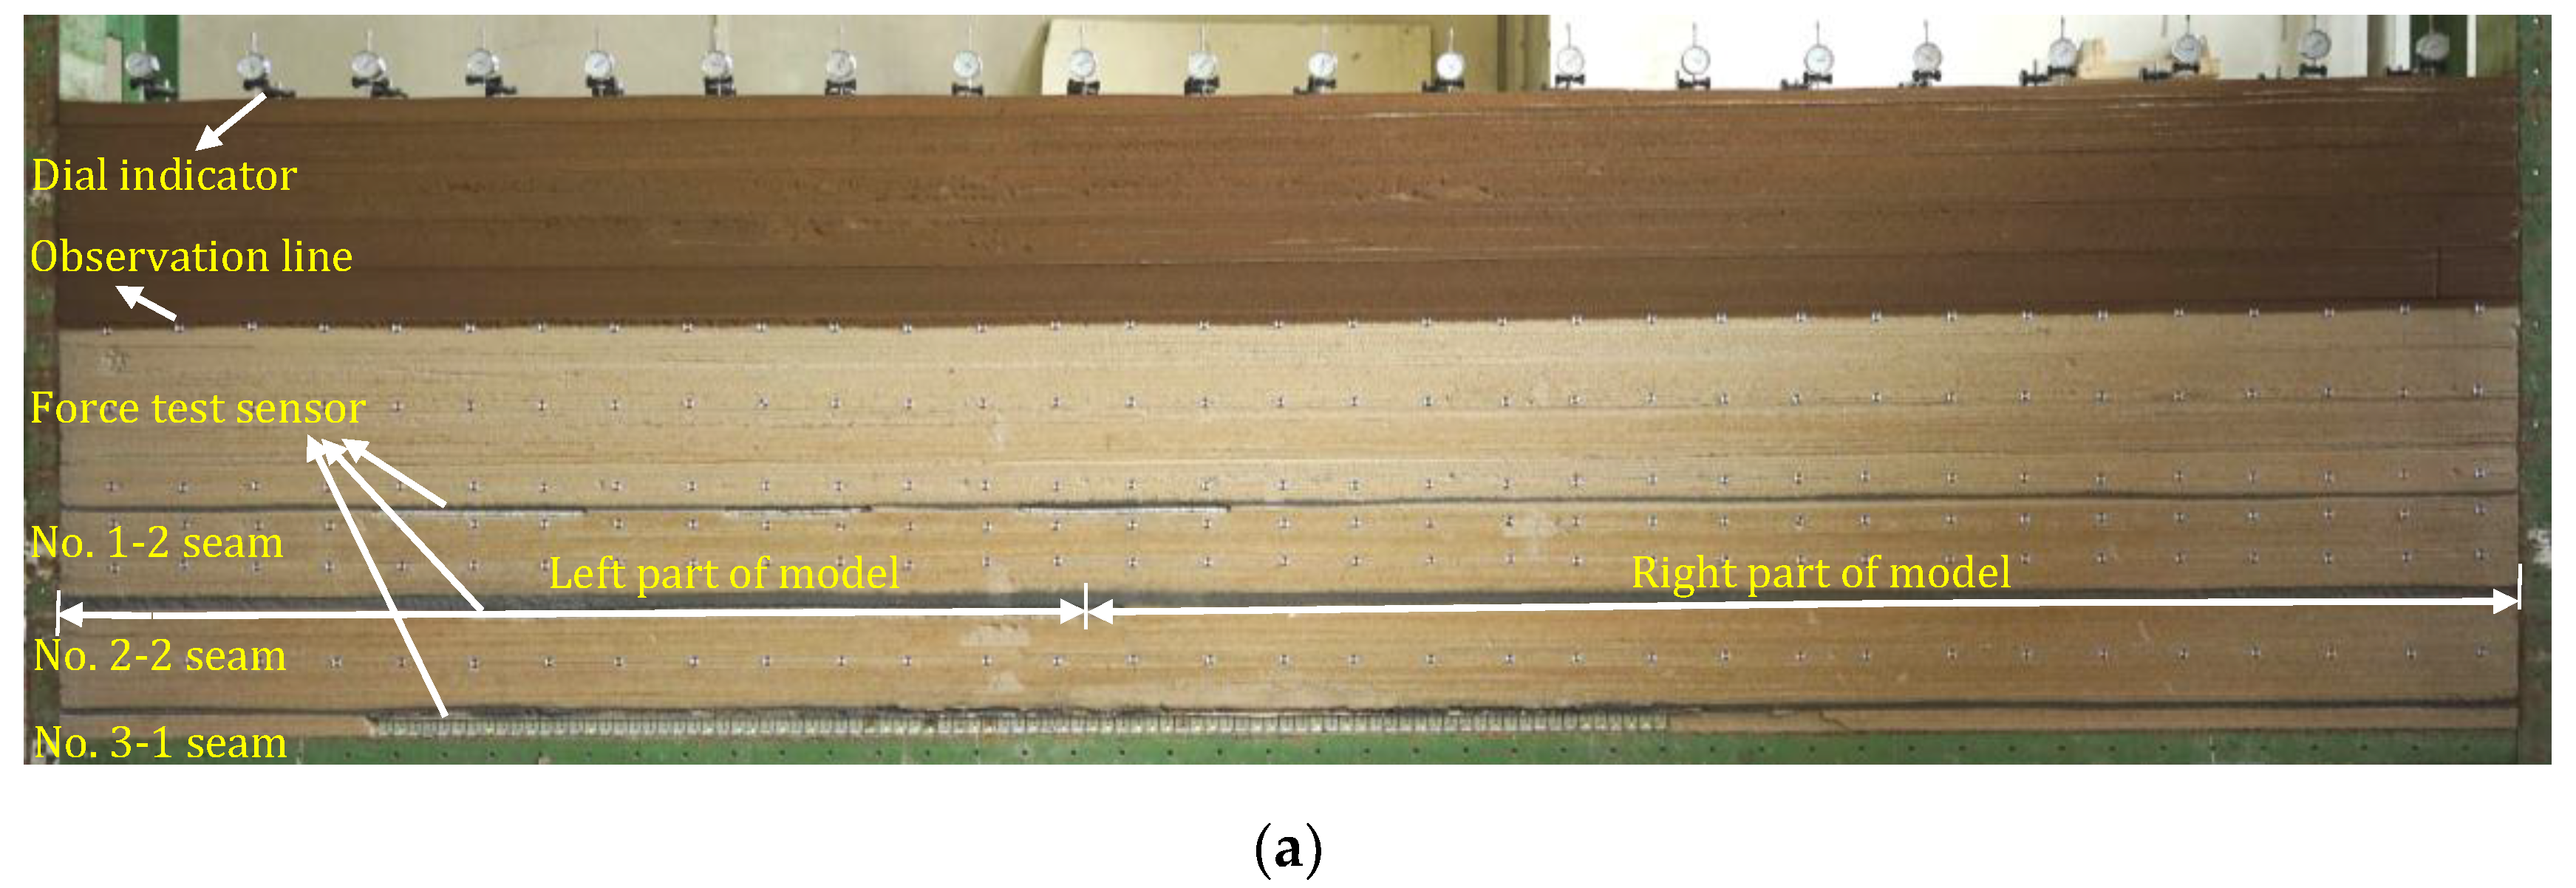
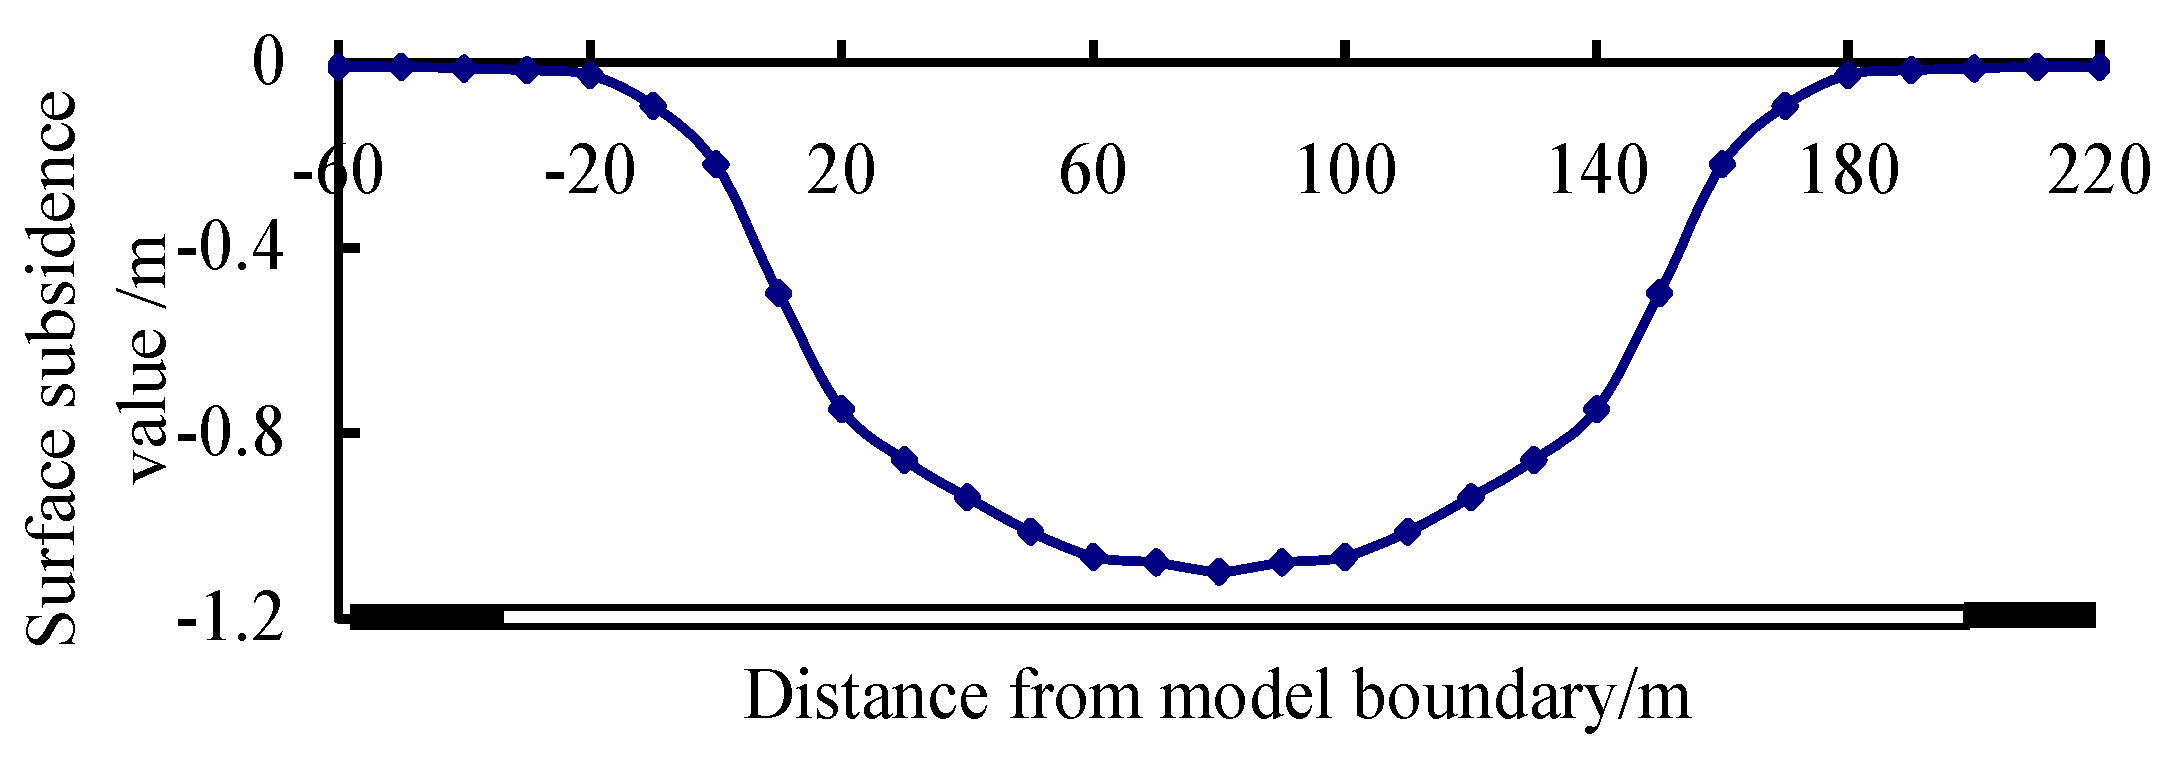
  • Displacement monitoring: Seven observation lines were established, and electronic total station was used to monitor the overlying strata displacement. The position of observation lines is shown below: Three observation lines are 4 cm, 20 cm and 40 cm from the roof of No. 1–2 seam, respectively; two observation lines are 6 cm and 15 cm from the roof of No. 2–2 seam, respectively; and the other two observation lines are 2 cm and 10 cm from the roof of No. 3–1 seam, respectively. Meanwhile, in order to monitor the ground surface subsidence, 20 dial indicators were adopted and its interval was 25 cm.
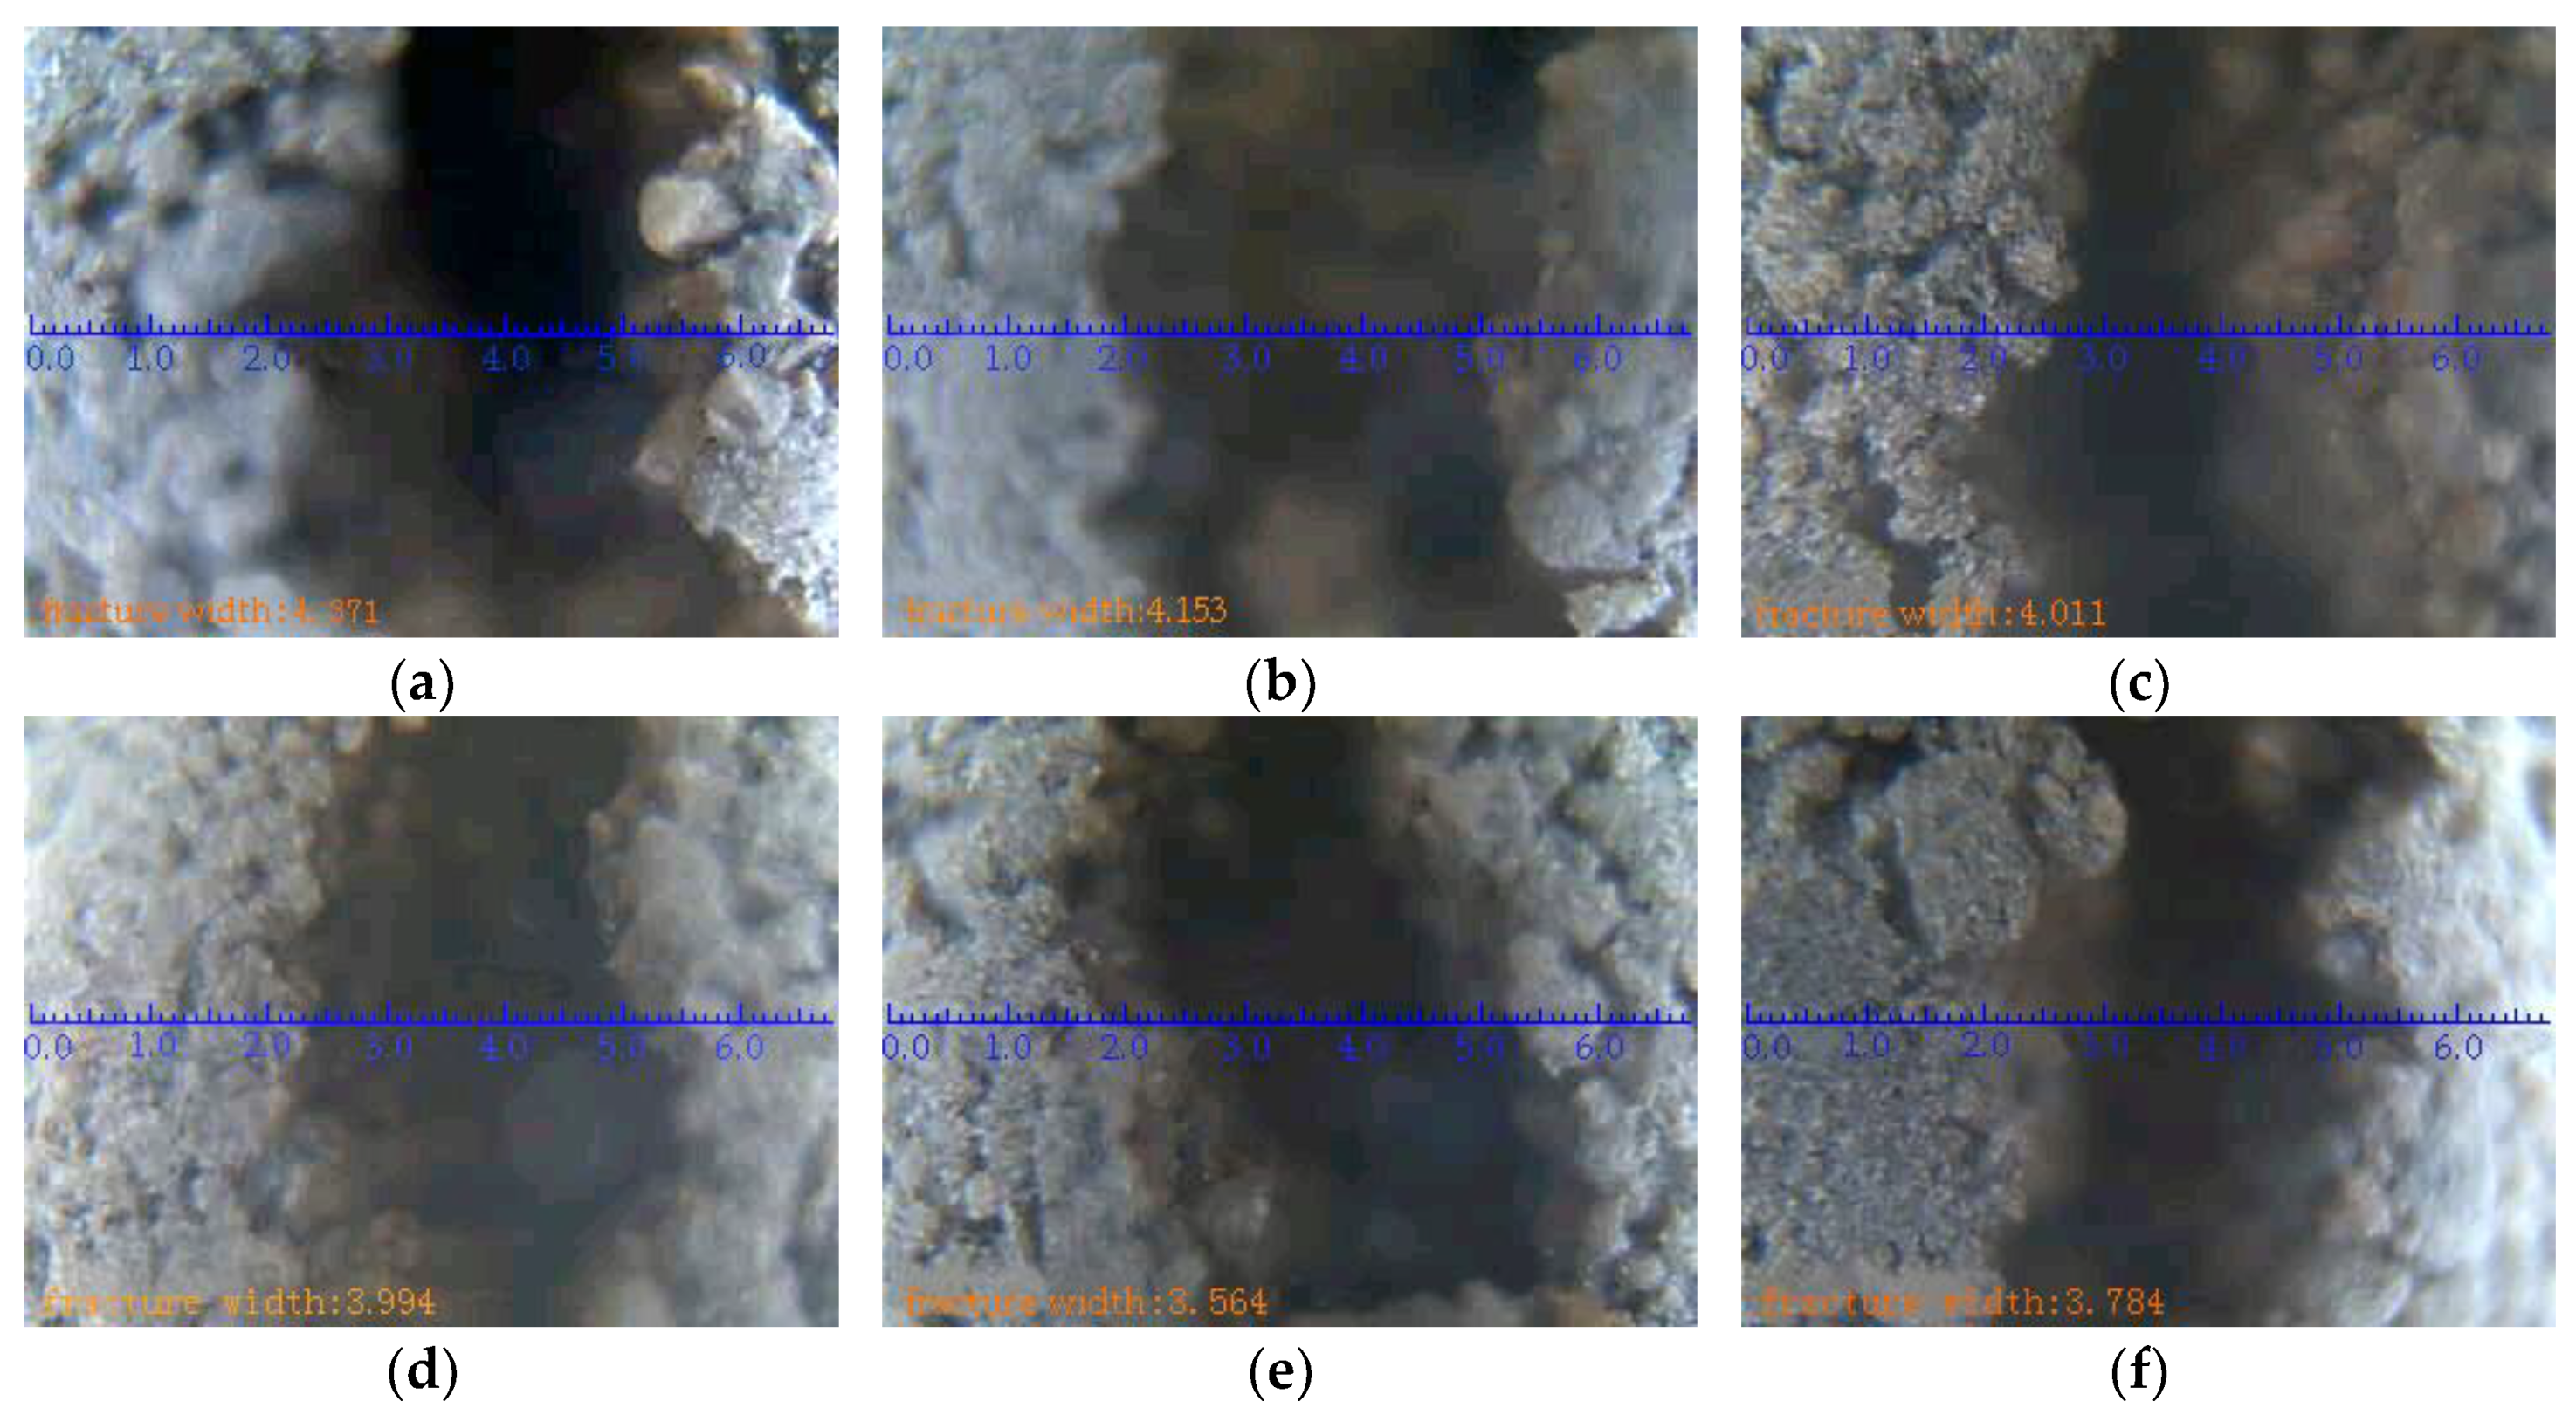
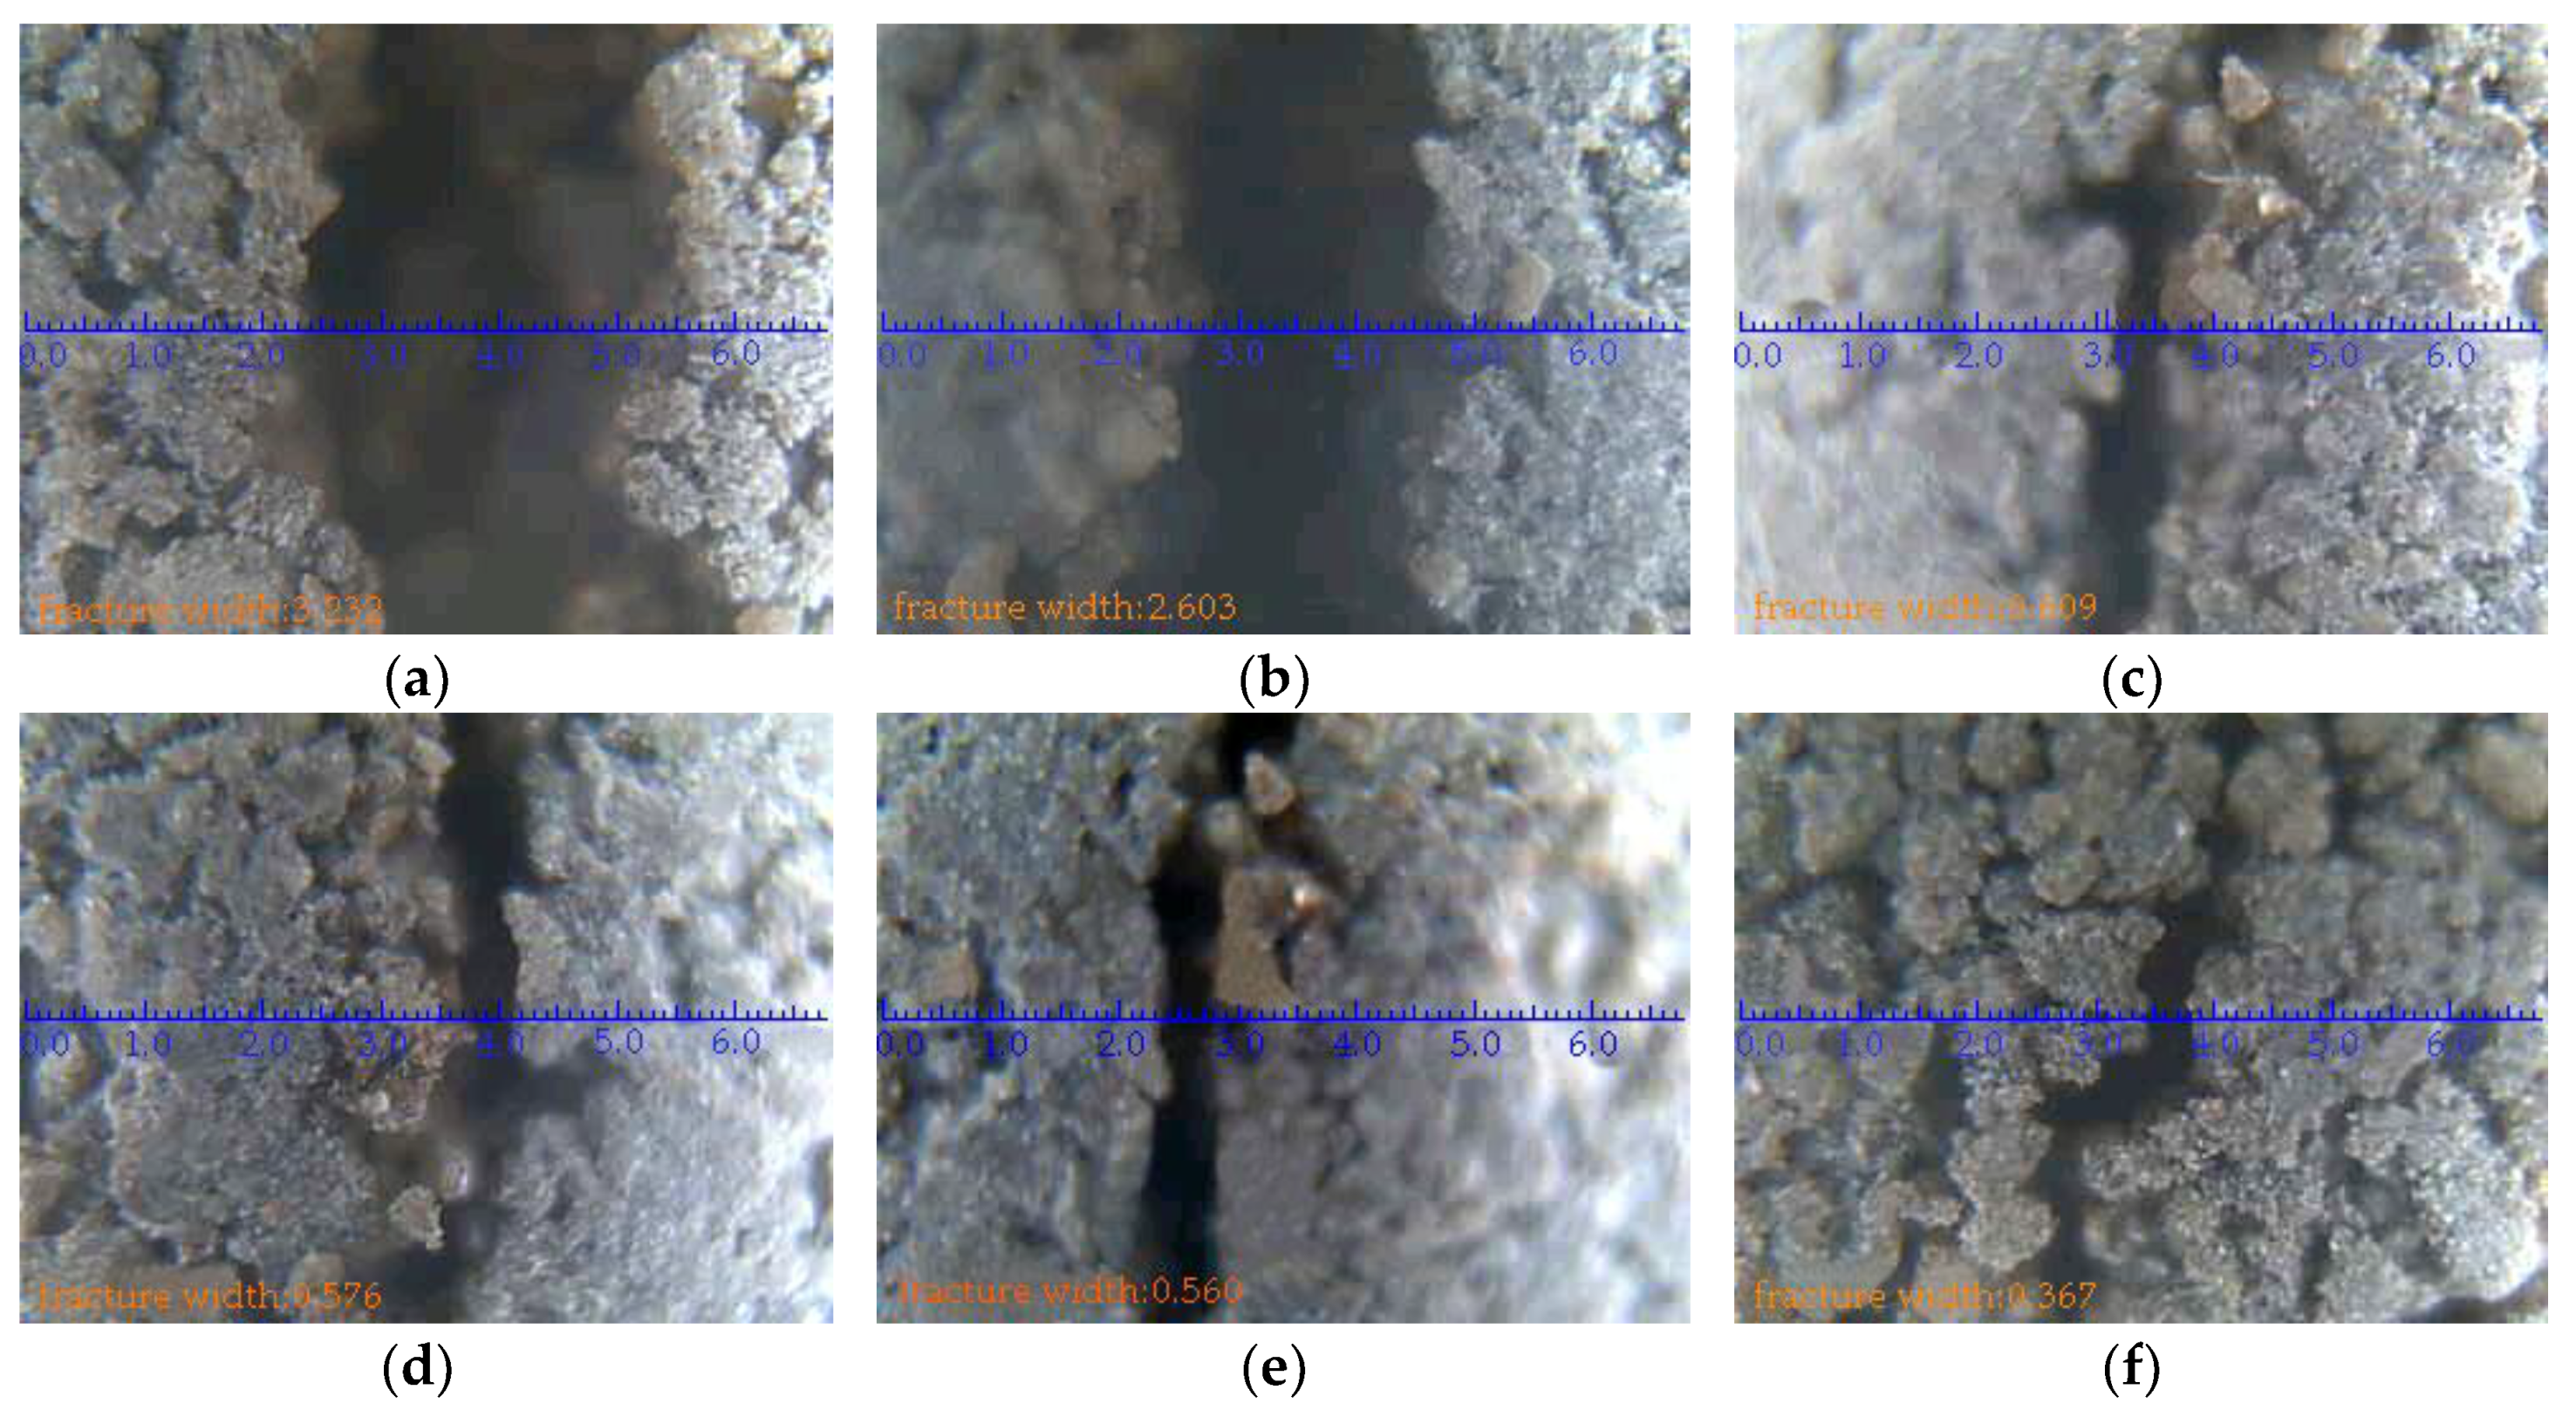
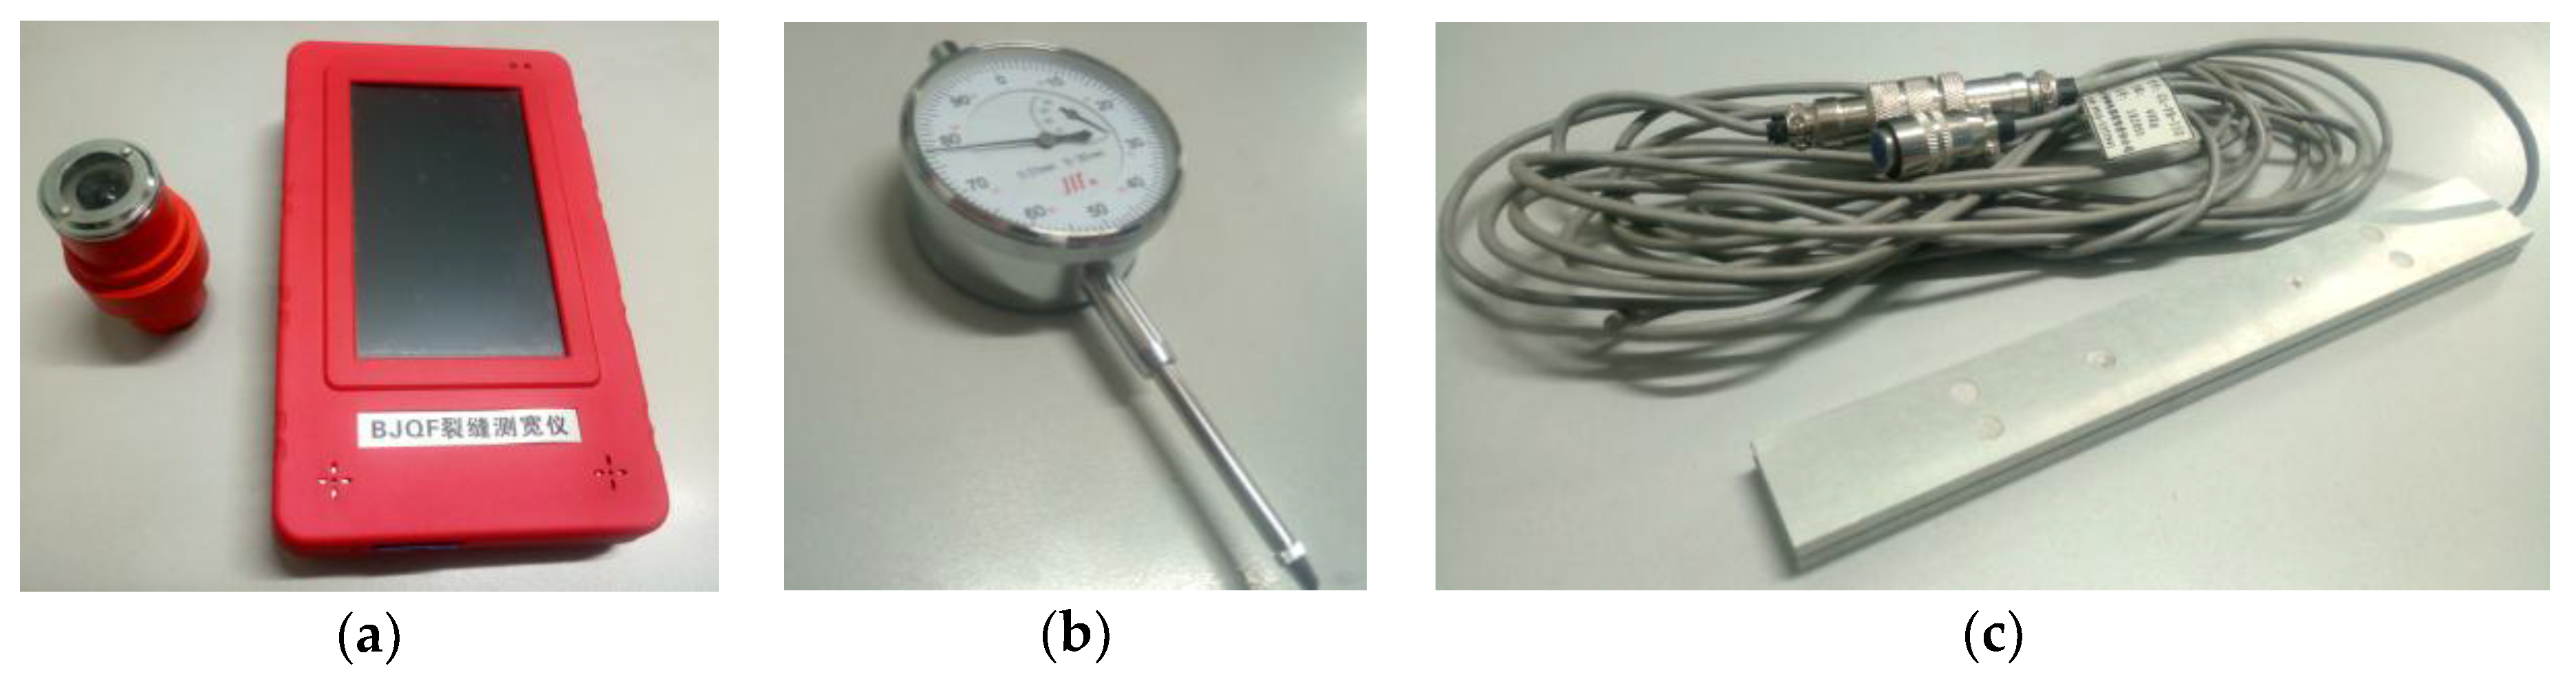
  • Fracture monitoring: A Nikon camera and BJQF-1 fracture width gauge were applied to monitor the mining-induced overlying strata width and ground surface fractures’ width; Figure 5 shows part of the experimental monitoring equipment.
(2) Excavation of experimental model
Firstly, No. 1–2 seam was excavated. It included three complete longwall faces (Figure 4b: ongwall face (LW) No.1, LW No.2 and LW No.3), and there were pillars (upper pillar) between the longwall faces. Their width is 245 m and that of the coal pillars is 20 m. Then, No. 2–2 seam was excavated; longwall face width and coal pillar (lower pillar) width is the same as No. 1–2 seam. By changing the CPMD of the two seams (from 0 m to 90 m), the three-field evolution characteristics based on different CPMD can be revealed. The CPMD of coal seams is shown in Figure 6.

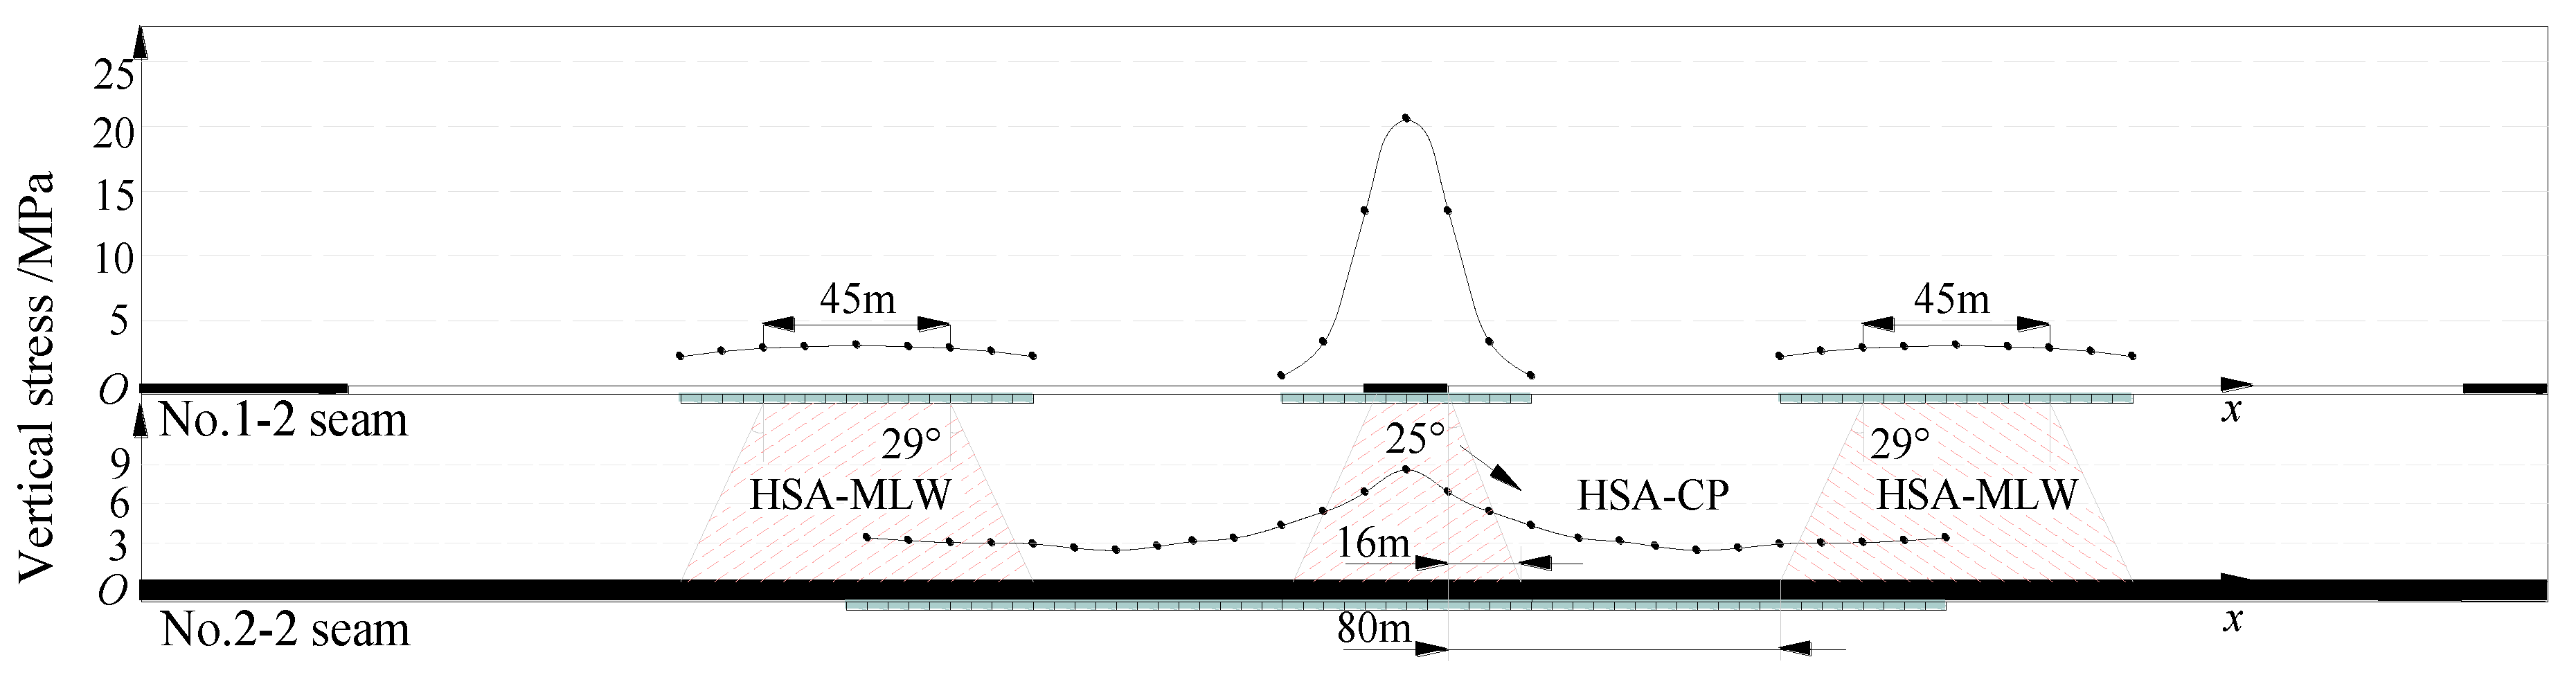
3.2. Stress Field Evolution of SBCSM-S Mining

(1) Stress transfer characteristics of No. 1–2 seam mining
After mining of No. 1–2 seam, according to the data monitored in monitoring zones No. 1–4, the stress distribution characteristics of No. 1–2 and No. 2–2 seams are shown in Figure 7. The results show that the maximum vertical stress, concentrated at the center of upper pillar, is 20.56 MPa, and it is about 5.7 times the virgin in-situ stress, whereas, it gradually decreases to two sides. In addition, due to complete subsidence of the overlying strata, the vertical stress in the middle area (45 m) of the longwall face is also higher than the other position of goaf.
Affected by transmission stress of the upper pillar and goaf, the vertical stress of No. 2–2 seam is redistributed. According to the experiment, the maximum vertical stress of No. 2–2 seam, 8.61 MPa, is exactly concentrated under the upper pillar, and is also gradually decreased to two sides. The stress area under the upper pillar and larger than virgin in-situ stress (4.5 MPa) can be called a high stress area of coal pillar (HSA-CP). Figure 7 shows that the lower seam boundary of HSA-CP is 16 m (horizontal distance) from the upper pillar, and the stress transfer angle is 25°. If calculated with a roadway width of 5 m, the minimum CPMD avoiding HSA-CP is 21 m (Figure 8a).
In addition, the stress area under the upper range of 45 m is relatively larger than the other position, except HSA-CP, and it is named a high stress area in the middle of the longwall face (HSA-MLW). The lower seam boundary of HSA-MLW is 80 m from the upper pillar, and the stress transfer angle is 29° (Figure 7). If calculated with a roadway width of 5 m and pillar width of 20 m, consequently, the maximum CPMD avoiding HSA-MLW is 55 m (Figure 8b).
According to the analysis above, the rational CPMD avoiding the upper seam mining-induced HSA-CP and HSA-MLW is 21–55 m.
(2) Stress field evolution characteristics of SBCSM-S mining
Through the simulation of No. 1–2 and No. 2–2 seams mining, and CPMD varying from 0 m to 90 m, Figure 9 shows the relationship between the maximum vertical stress evolution of the lower pillar and different CPMD.
The results show that when the upper and lower coal pillars are aligned, the vertical stress of the lower pillar, 24.97 MPa, is the largest, and is caused by the concentrated stress superposition of the upper and lower pillars; the lower pillar is located at HSA-CP. When the CPMD varies from 20 m to 50 m, the concentrated stress field caused by the upper and lower pillars is gradually separated; consequently, the maximum vertical stress of the lower pillar is relatively smaller. When the CPMD is larger than 50 m, the maximum vertical stress of the lower pillar represents a slow increase; the lower pillar enters HSA-MLW. Therefore, the rational CPMD for decreasing concentrated stress of the lower pillar is 20–50 m.
Based on the stress field evolution of single seam and closely spaced multi-seam mining, the rational CPMD based on control of stress field is 21–50 m.

3.3. Displacement Field Evolution of SBCSM-S Mining

Figure 10 shows the overlying strata movement of No. 1–2 seam mining, and Figure 11 shows the surface subsidence curve. The caving angle of bedrock on both sides of the longwall face is 65°, whereas the caving angle of red soil is 70°; the largest surface subsidence value occurring above the center of the longwall face is 1.09 m.
Figure 12 shows the surface subsidence curves of different CPMD. When the upper and lower pillars are aligned, or the CPMD is less than 10 m, the surface represents an obvious uneven subsidence, and the largest surface subsidence value of 3.648 m occurs above the center of No. 1–2 seam longwall face. The surface subsidence values occurring above the upper pillar are 0.128 m, 0.14 m and 0.218 m, respectively (aligned, CPMD of 0 m and 10 m); therefore, the largest subsidence drop height is 3.52 m. Based on the analysis above, when the CPMD is smaller than 10 m, the upper pillar is located at the support structure area of the lower pillar, and consequently results in smaller subsidence above the upper pillar, whereas the uneven subsidence drop height is large.
When the CPMD is larger than 20 m, interburden strata between the upper and lower pillars is gradually broken as CPMD increases. Meanwhile, the upper pillar rotates and subsides, which causes a gradual increase of surface subsidence above the pillar. When the CPMD is 40 m, the upper pillar represents complete subsidence; surface subsidence value above the upper pillar is over 2 m, and the subsidence drop height obviously decreases. Therefore, the rational CPMD based on control of the displacement field and reducing uneven subsidence should be larger than 40 m.

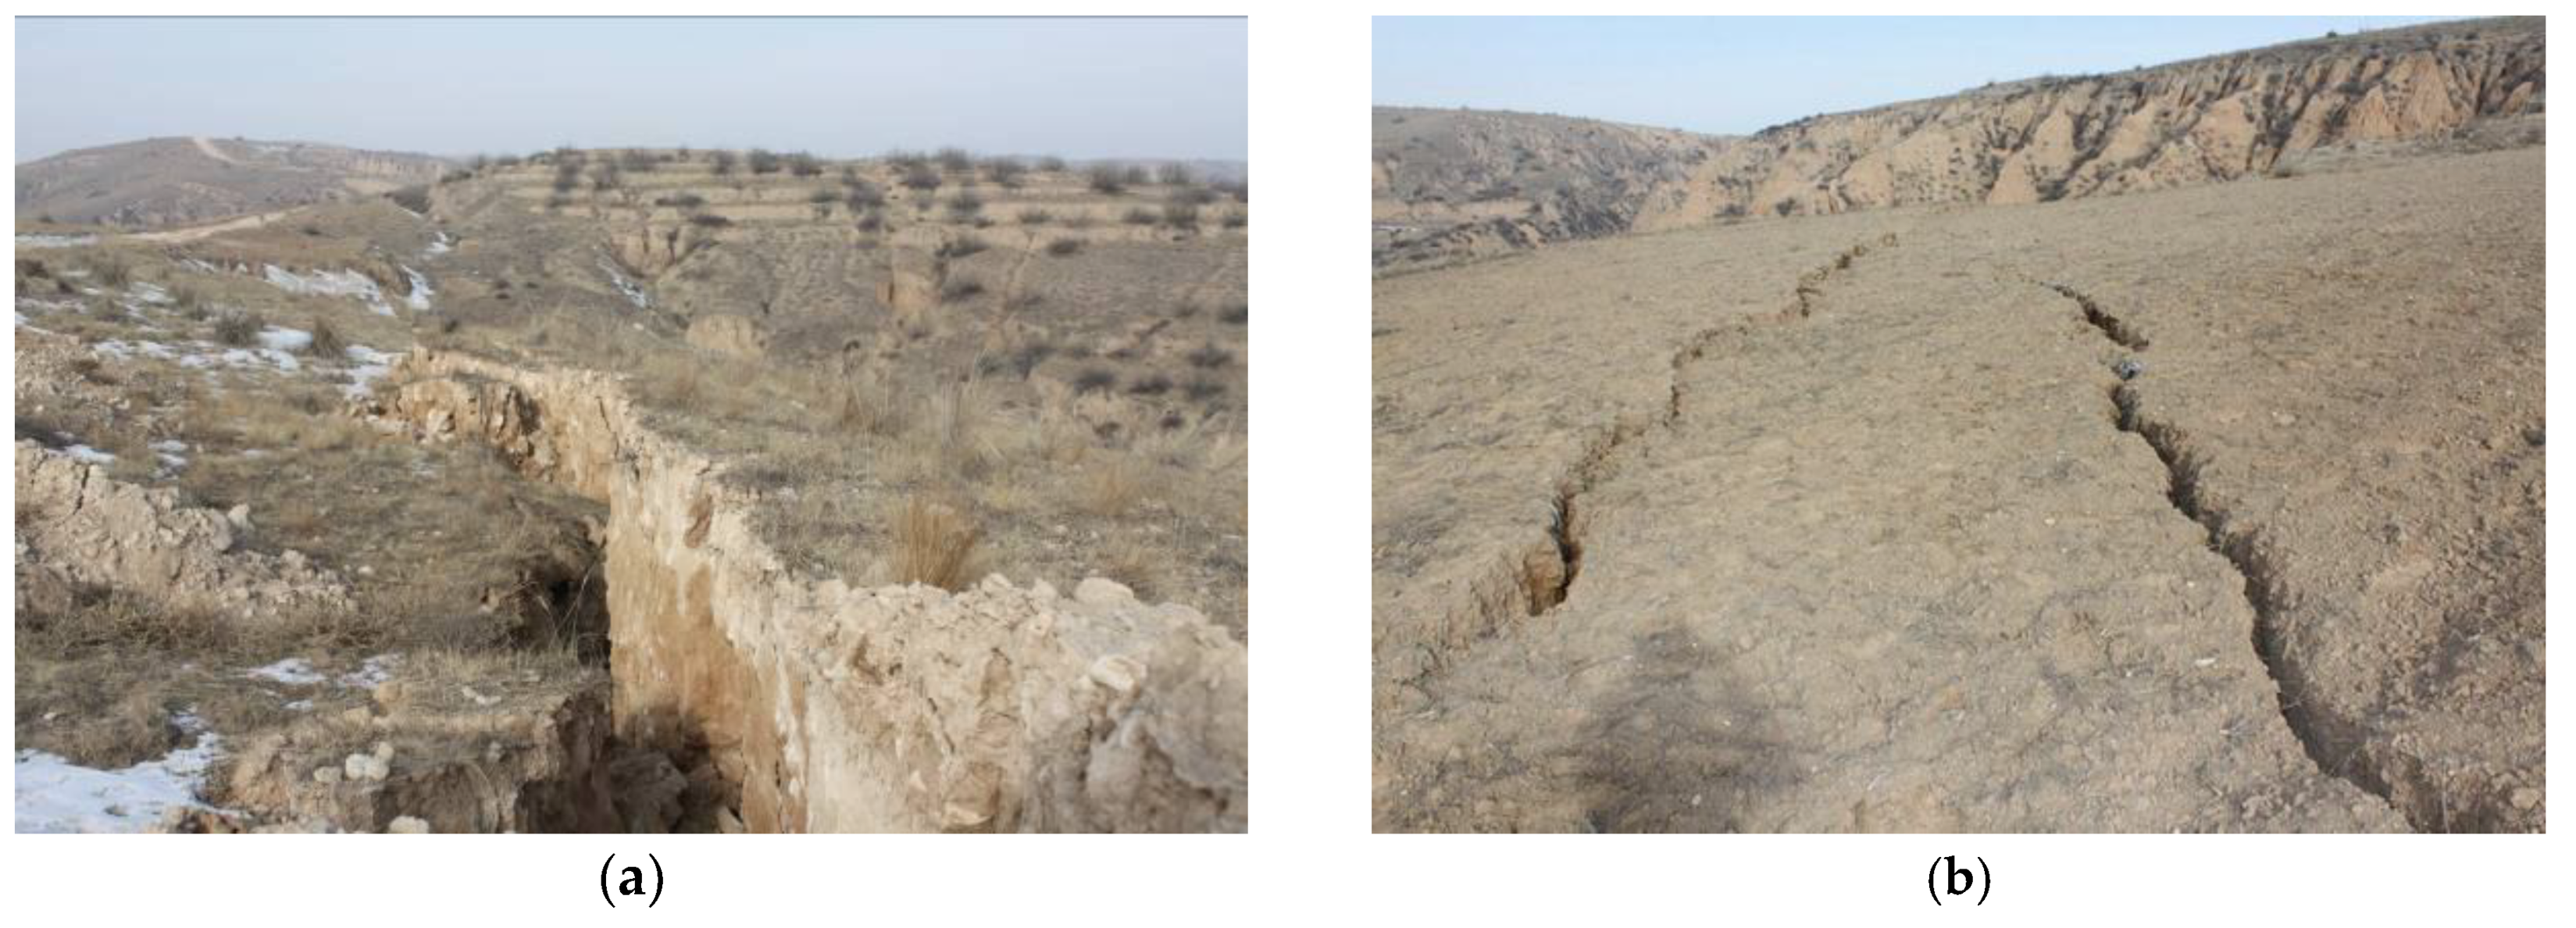
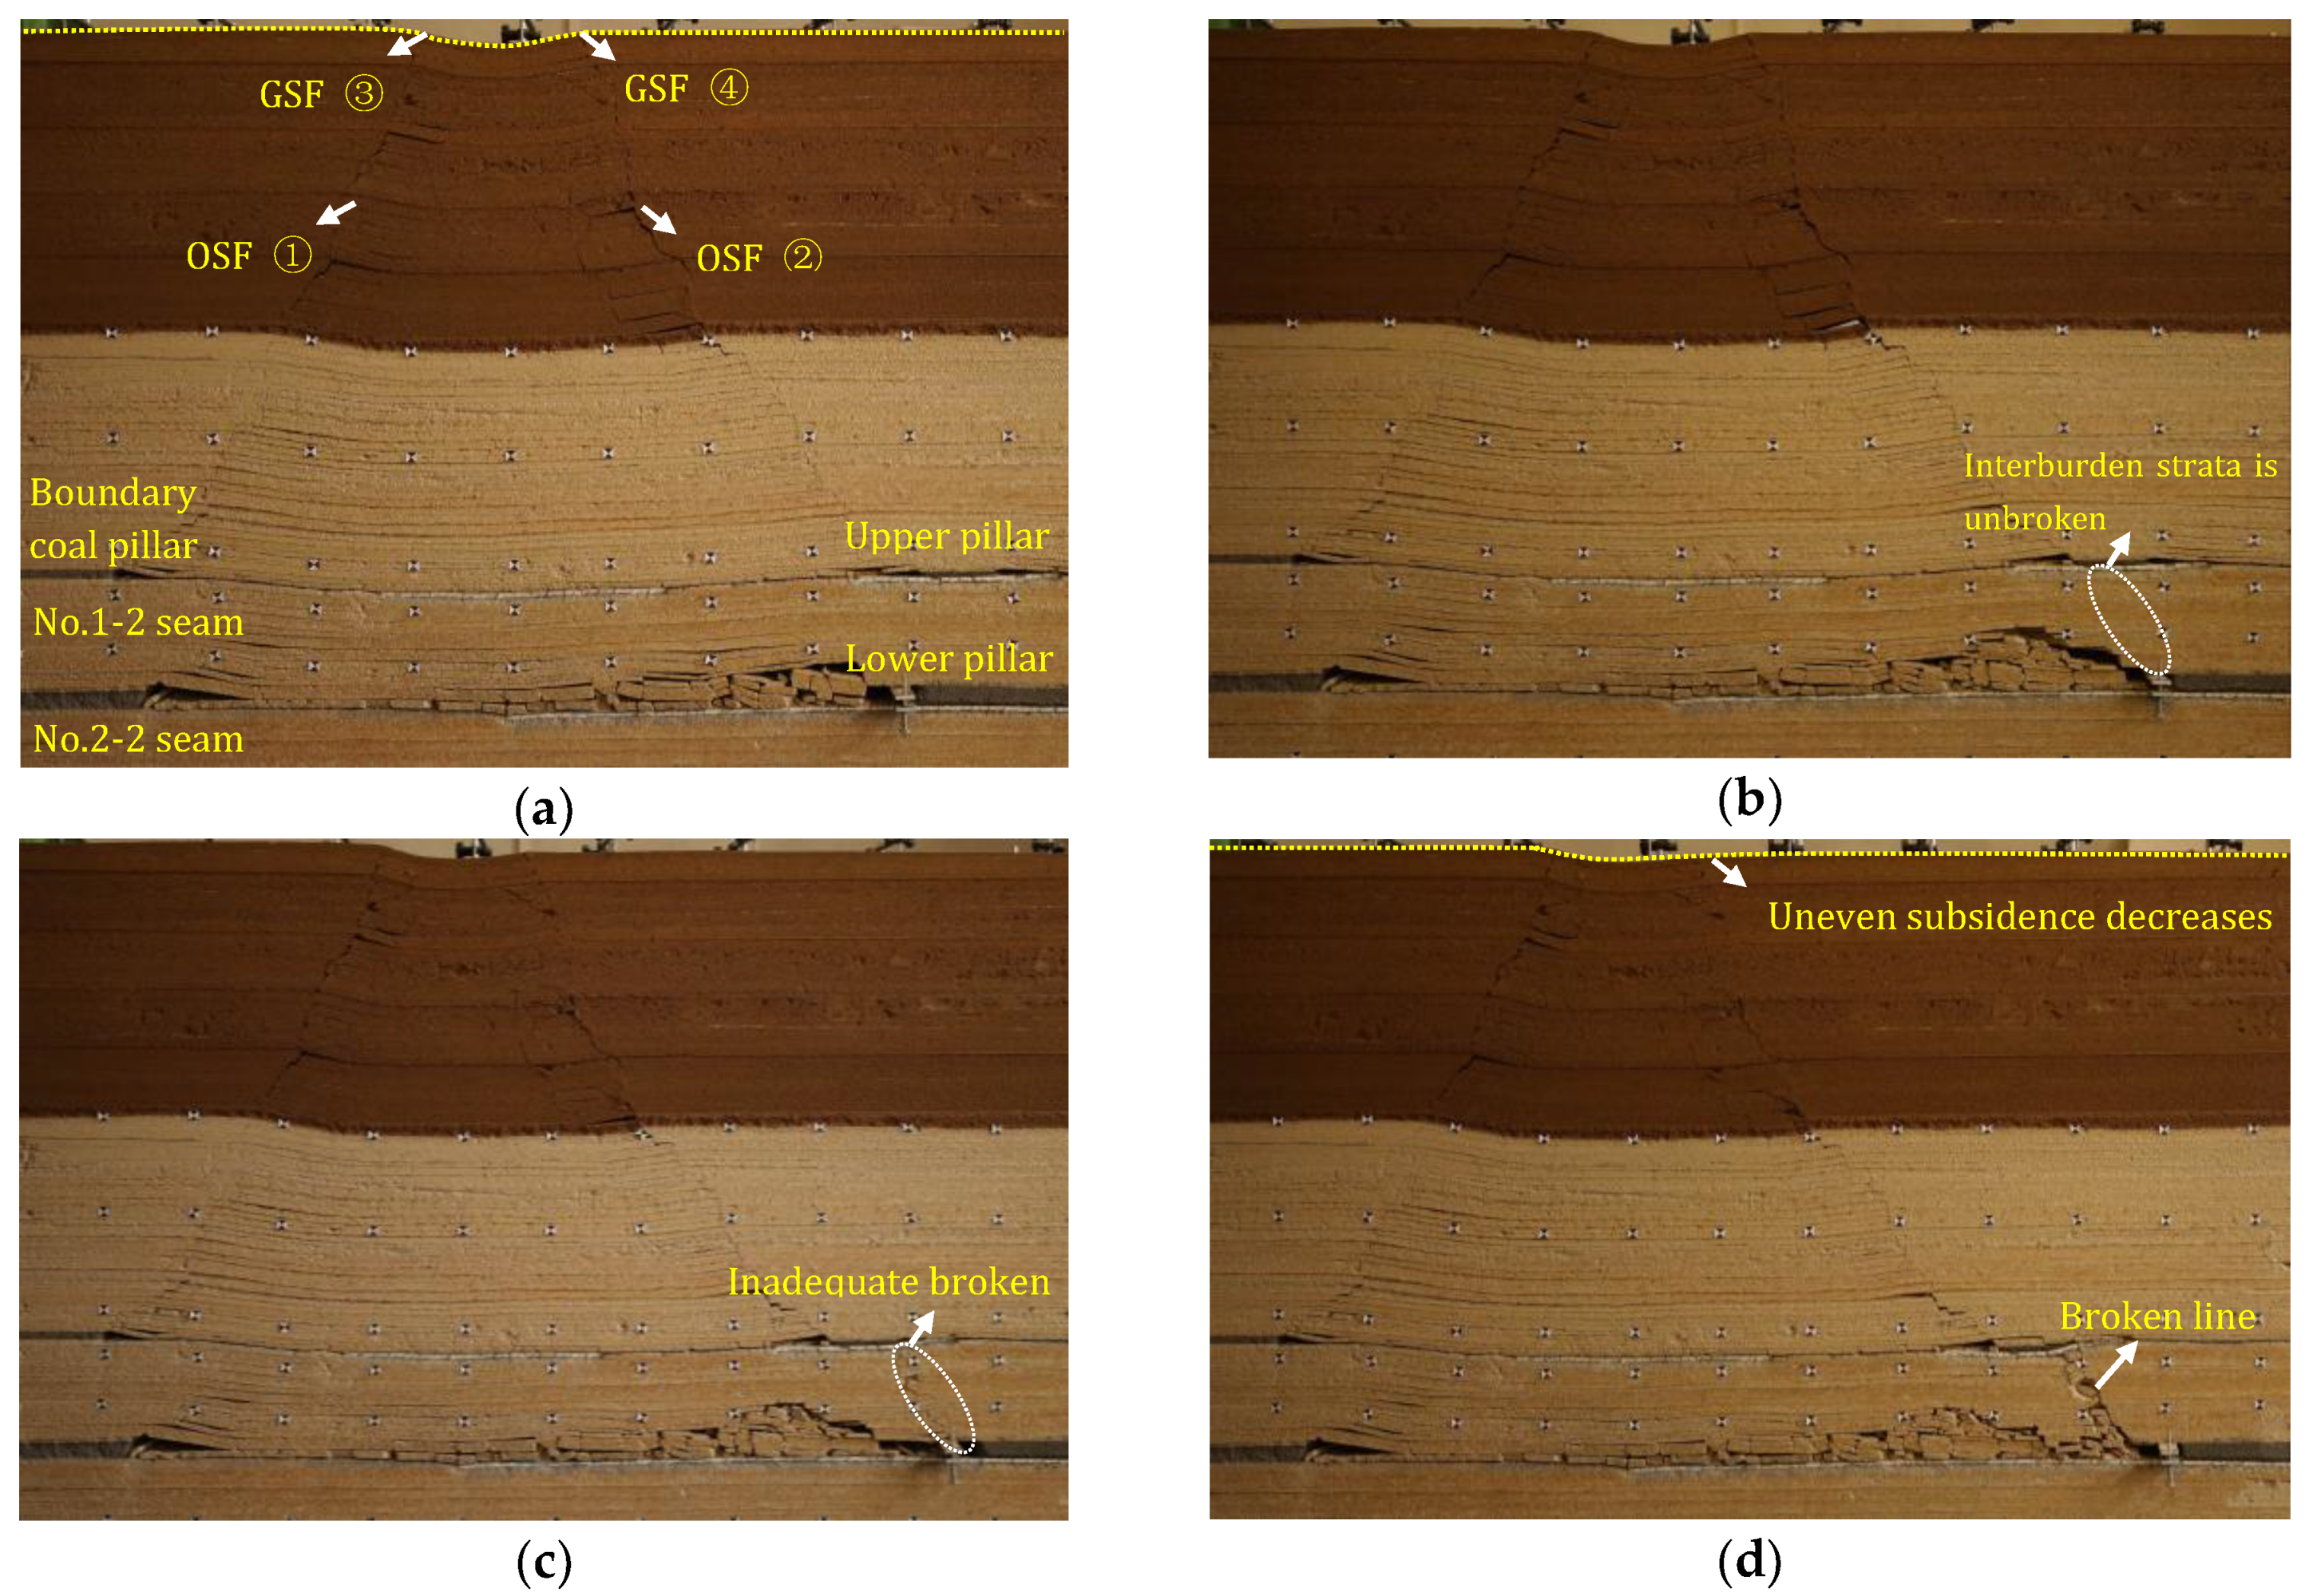
3.4. Fracture Field Evolution of SBCSM-S Mining

Figure 13 shows the fracture field evolution of different CPMD. The overlying strata fracture (OSF ① and ②), and the ground surface fracture (GSF ③ and ④) are defined. OSF ① and GSF ③ are above the boundary coal pillar, whereas, OSF ② and GSF ④ are above the coal pillar between the longwall face. When the CPMD is smaller than 10m, interburden strata between the upper and lower pillars is unbroken; OSF and GSF develops seriously, and the ground surface shows obvious uneven subsidence (Figure 13a,b). When the CPMD is 30 m, interburden strata is inadequately broken (Figure 13c). When the CPMD is larger than 40 m, the upper pillar subsides completely along the broken line (Figure 13d); OSF ② and GSF ④ obviously decrease, as does the uneven surface subsidence.
GSF ③ and ④ evolution characteristics, monitored by fracture width gauges with different CPMD, are shown in Figure 14 and Figure 15. Converting the experimental values into site values, Figure 16 shows the OSF width and GSF width evolution characteristics. The conclusions can be summarized as below:
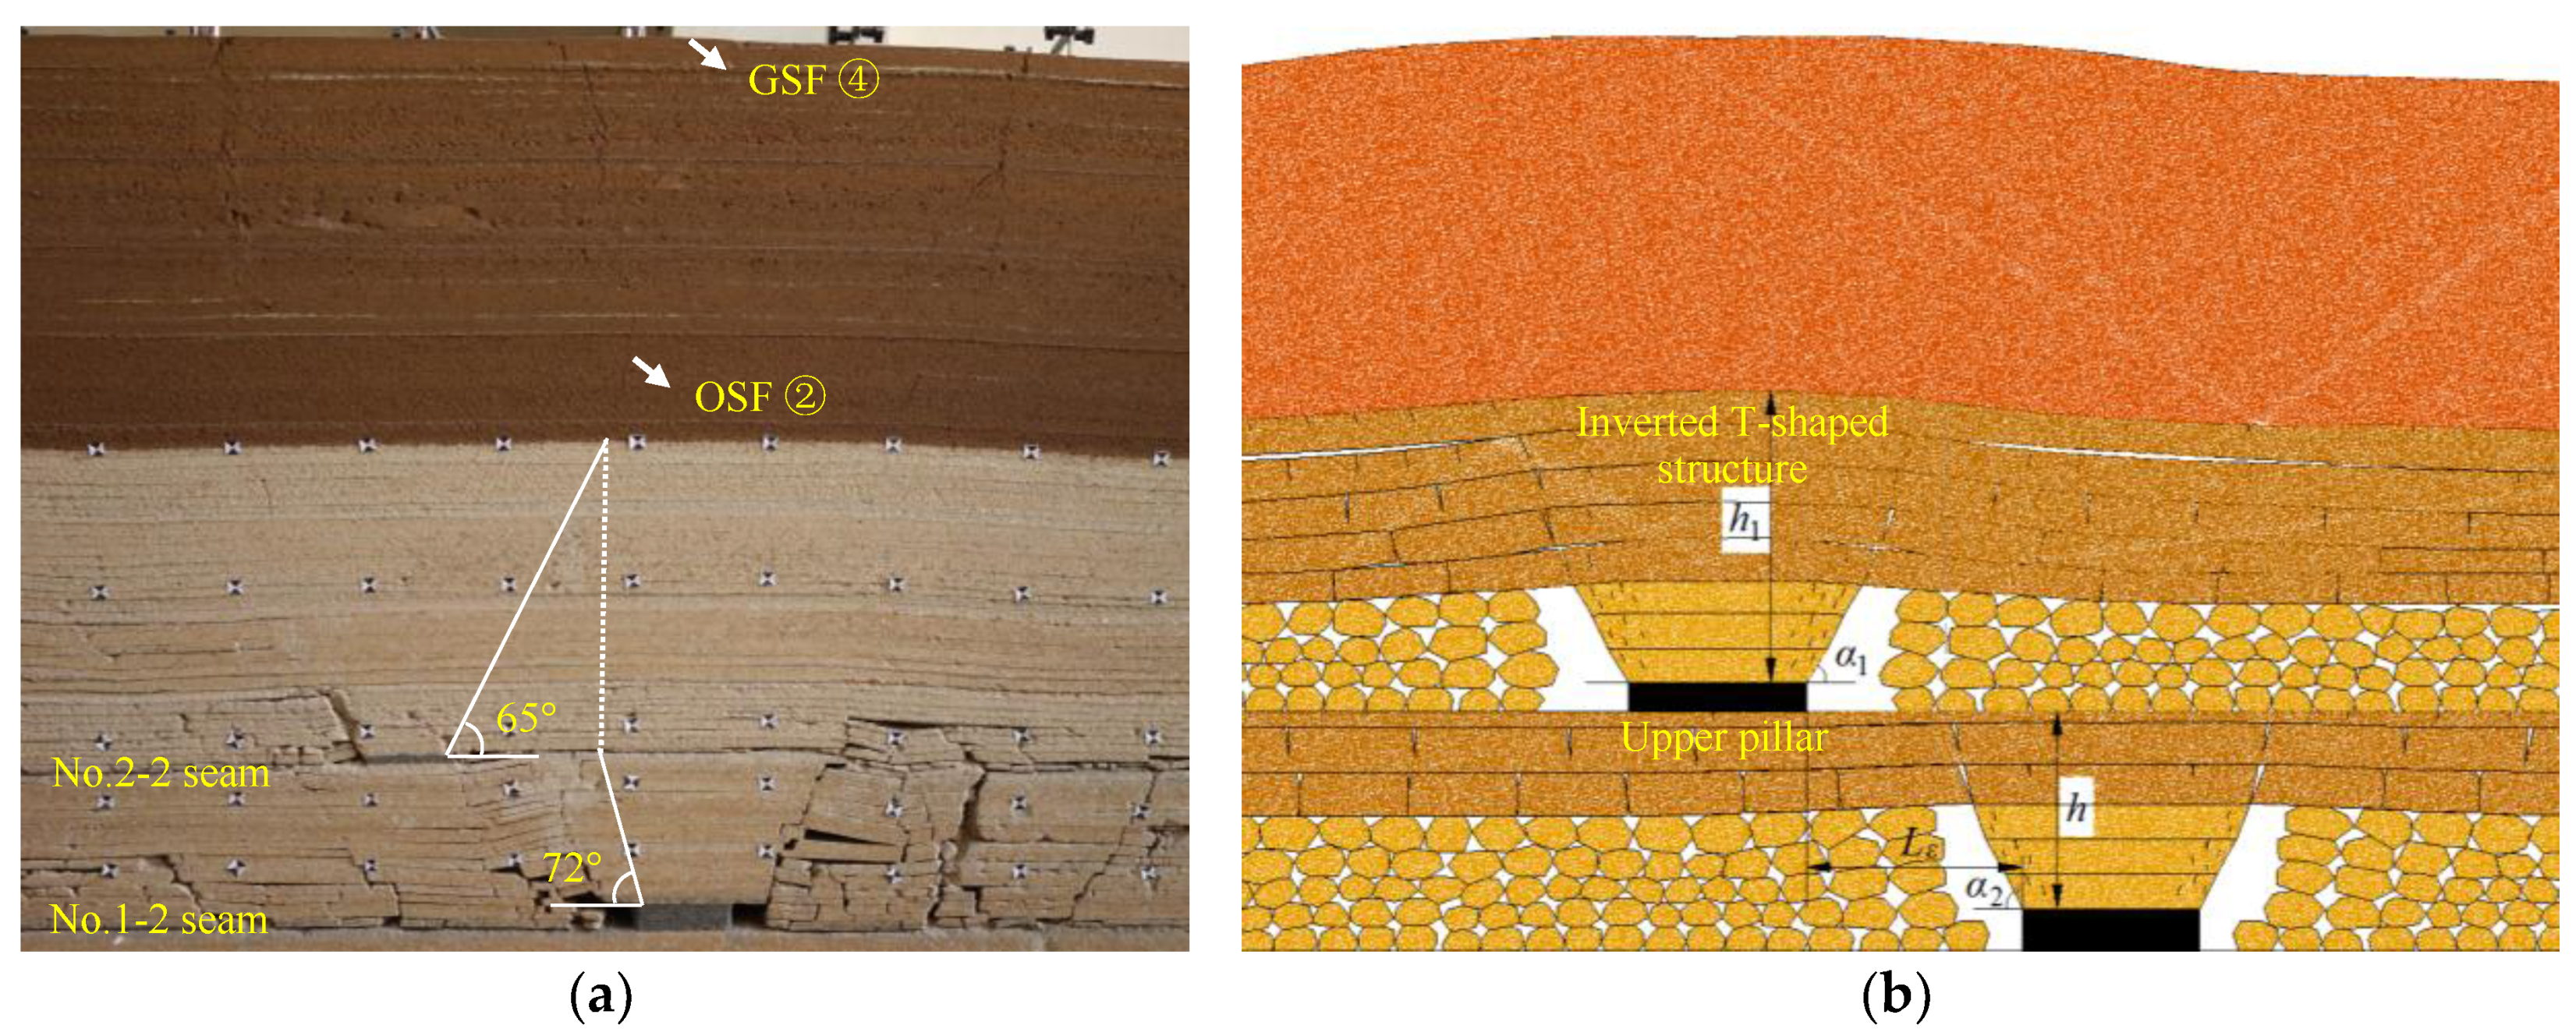
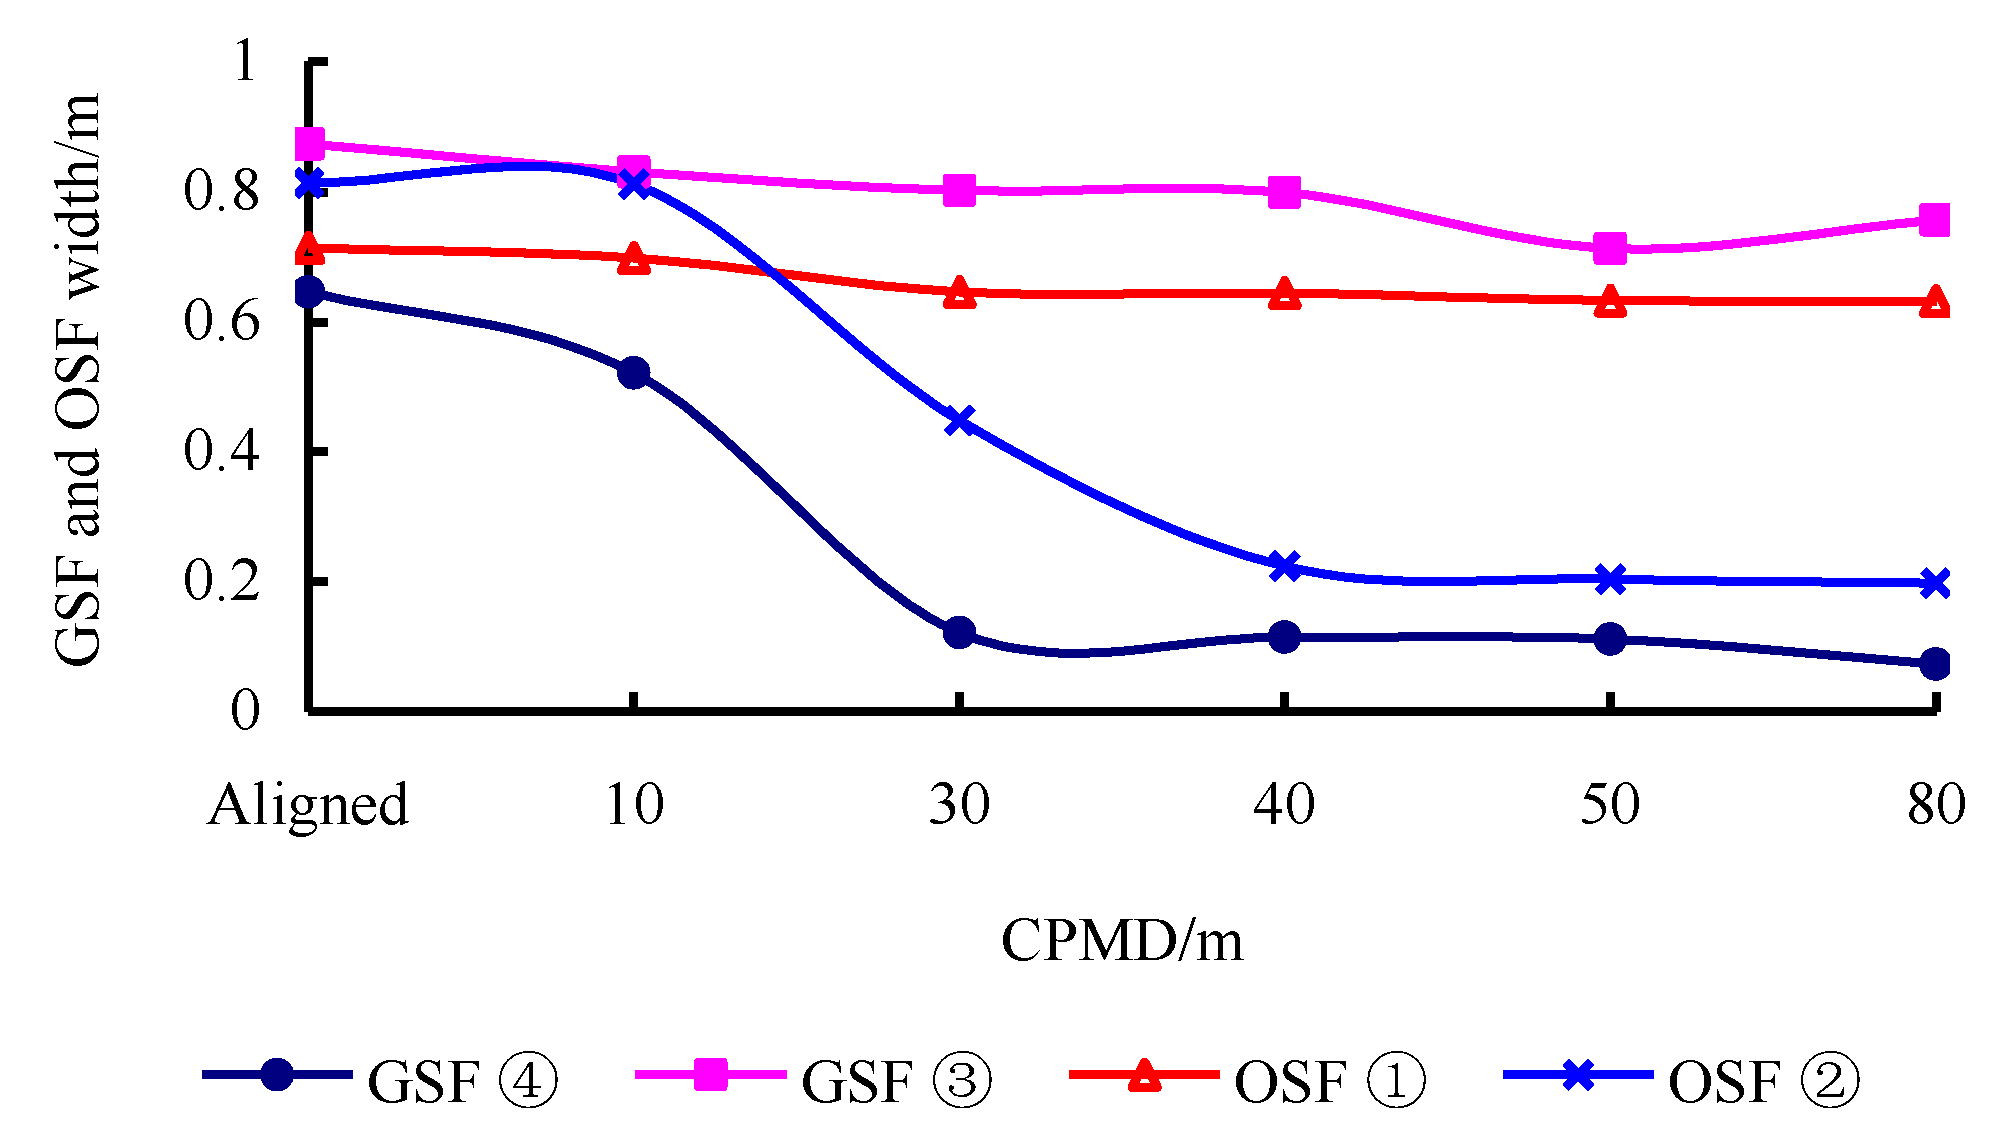
  • According to Figure 14, the width of GSF ③ is 0.796 m on average, and is basically invariable as CPMD increases; consequently, they belong to permanent fractures.
  • The width of GSF ④ decreases gradually as the CPMD increases; its largest width is 0.646 m, occurring when the upper and lower pillars are aligned. When the CPMD is larger than 30 m, the width of GSF ④ obviously decreases; thereafter, its width is basically invariable as CPMD changes—0.106 m on average, decreasing by 83.6% compared with the arrangement of aligned pillars. Consequently, GSF ④ belongs to controllable fractures; rational arrangement of CPMD can help realize control of GSF ④.
  • The width of OSF ① is 0.661 m on average; it is also basically invariable as CPMD increases. However, the width of OSF ② decreases as the CPMD increases; when the coal pillars are aligned, its width is the largest (0.814 m). When the CPMD is larger than 40 m, the width of OSF ② is invariable as CPMD changes—0.209 m on average, and it decreases by 74.3% compared with the arrangement of the aligned pillars. Similarly, OSF ② belongs to controllable fractures, and the CPMD to control OSF ② should be larger than 40 m.
GSF has a significant effect on the ground surface environment, and OSF plays a key role in water conservation mining. According to the analysis above, OSF ② and GSF ④ are the main fractures in SBCSM-S mining; through rational arrangement of CPMD, OSF ② and GSF ④ can be controlled. In the Ningtiaota coal mine, rational CPMD of No. 1–2 and No. 2–2 seams mining based on control of fracture field should be larger than 40 m.

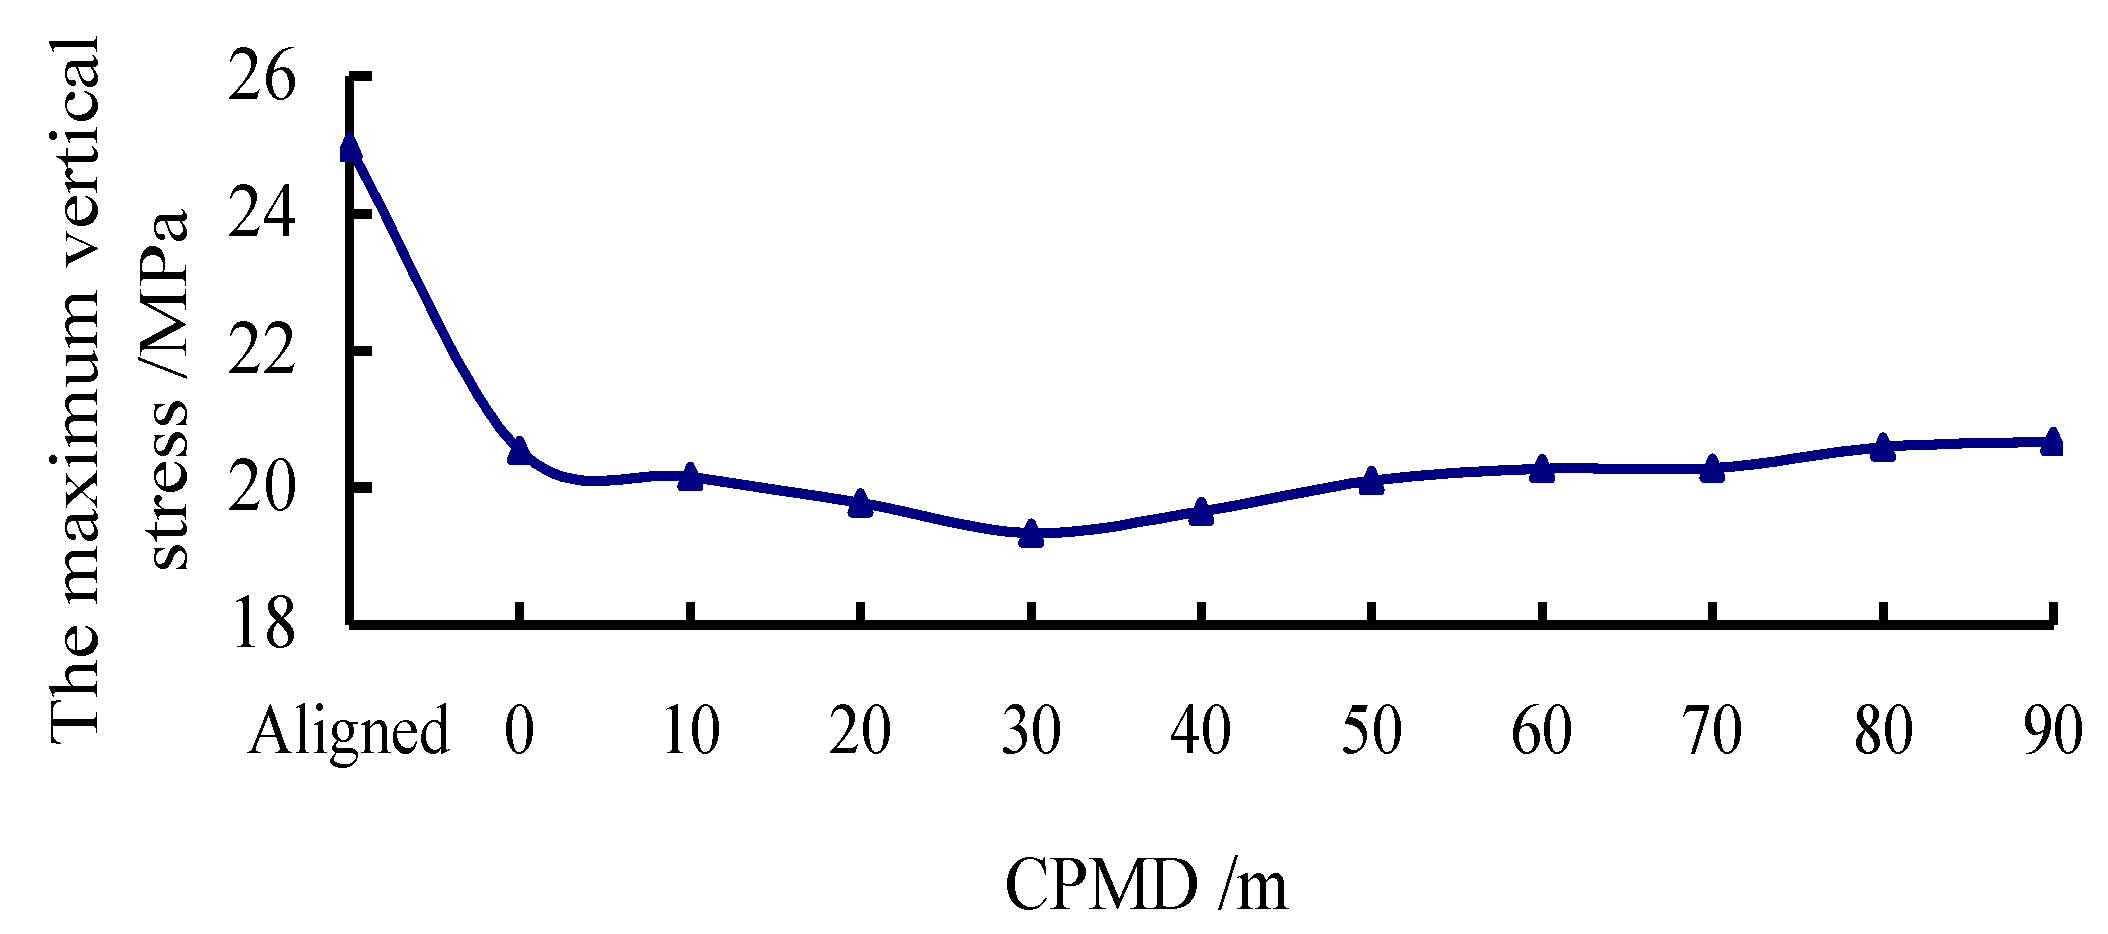
4. Theoretical Models Based on Three-Field Coupling Control

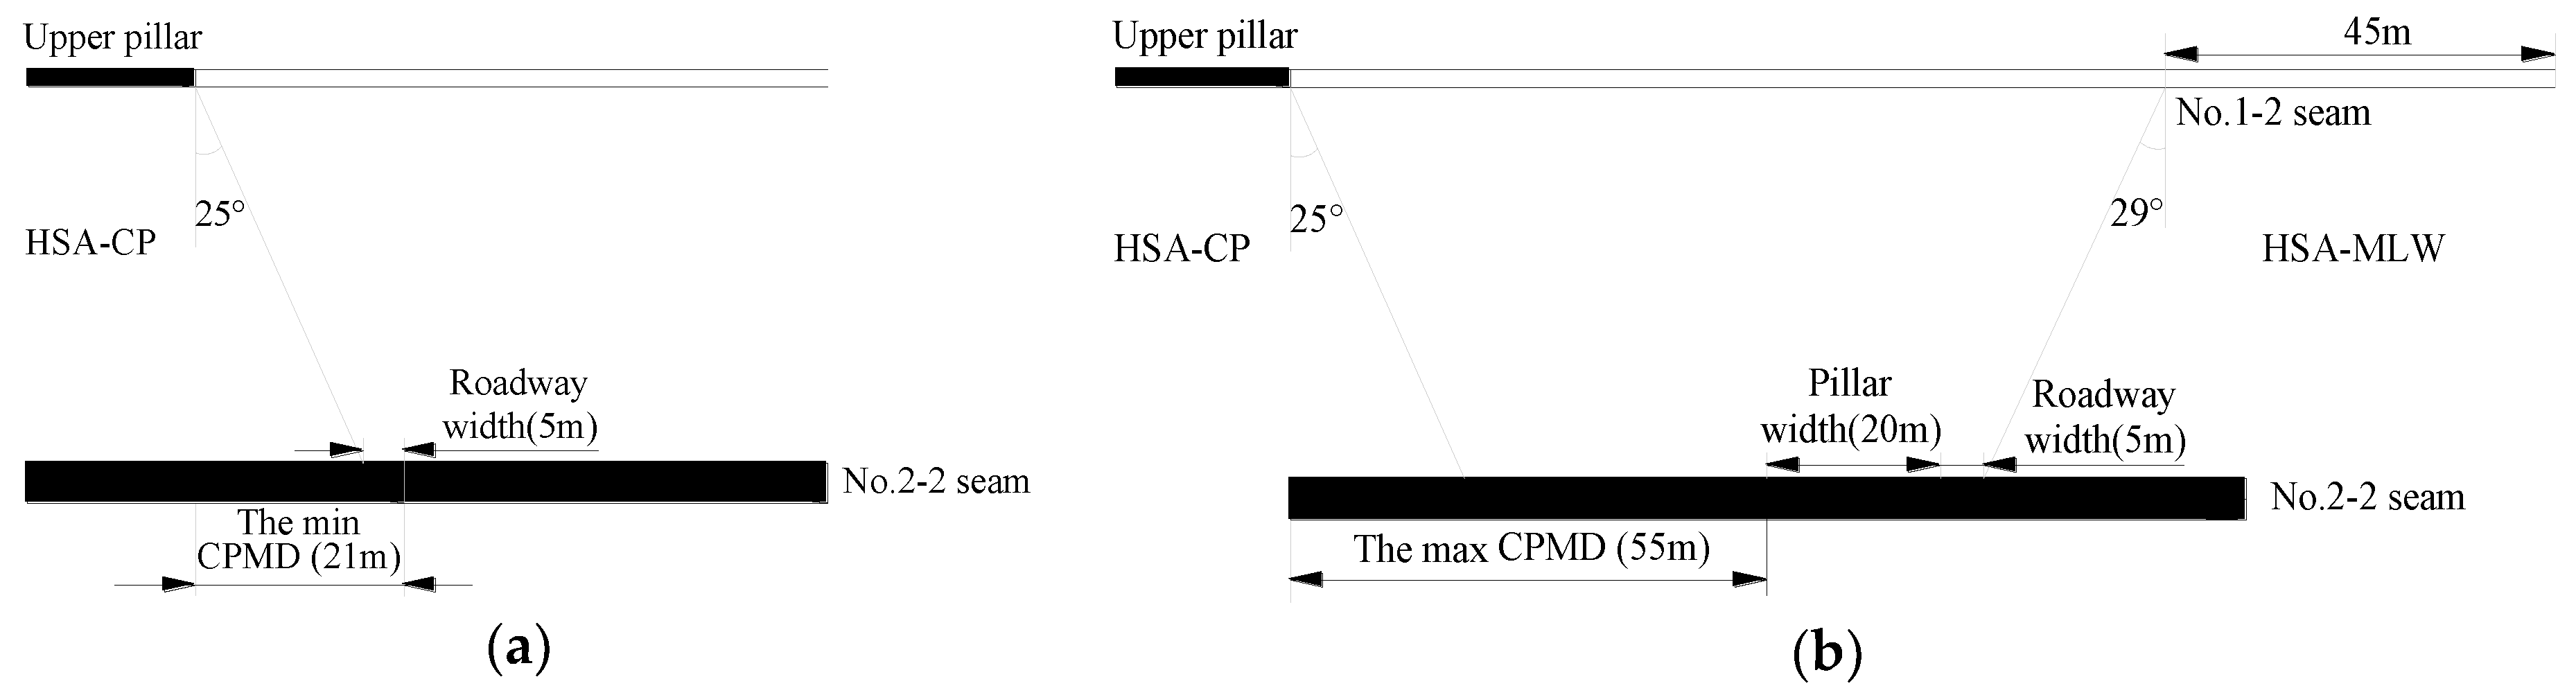
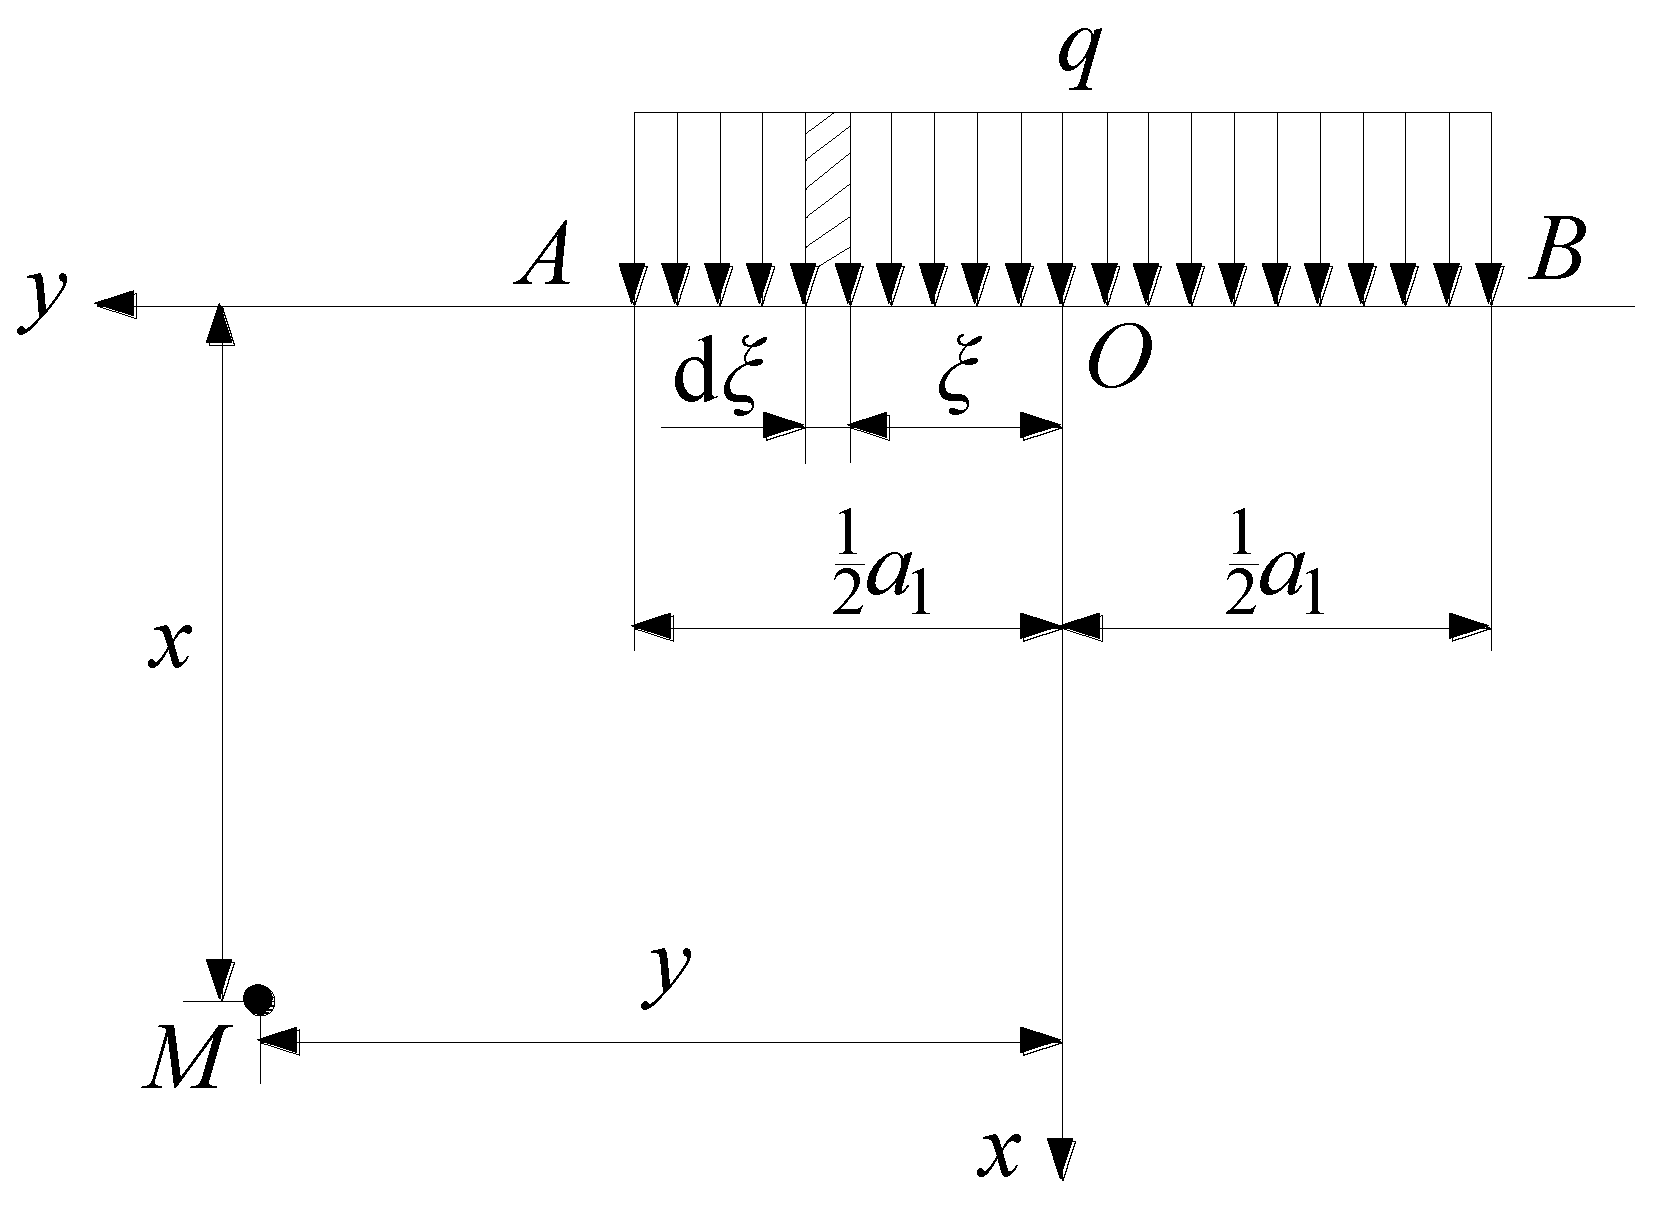
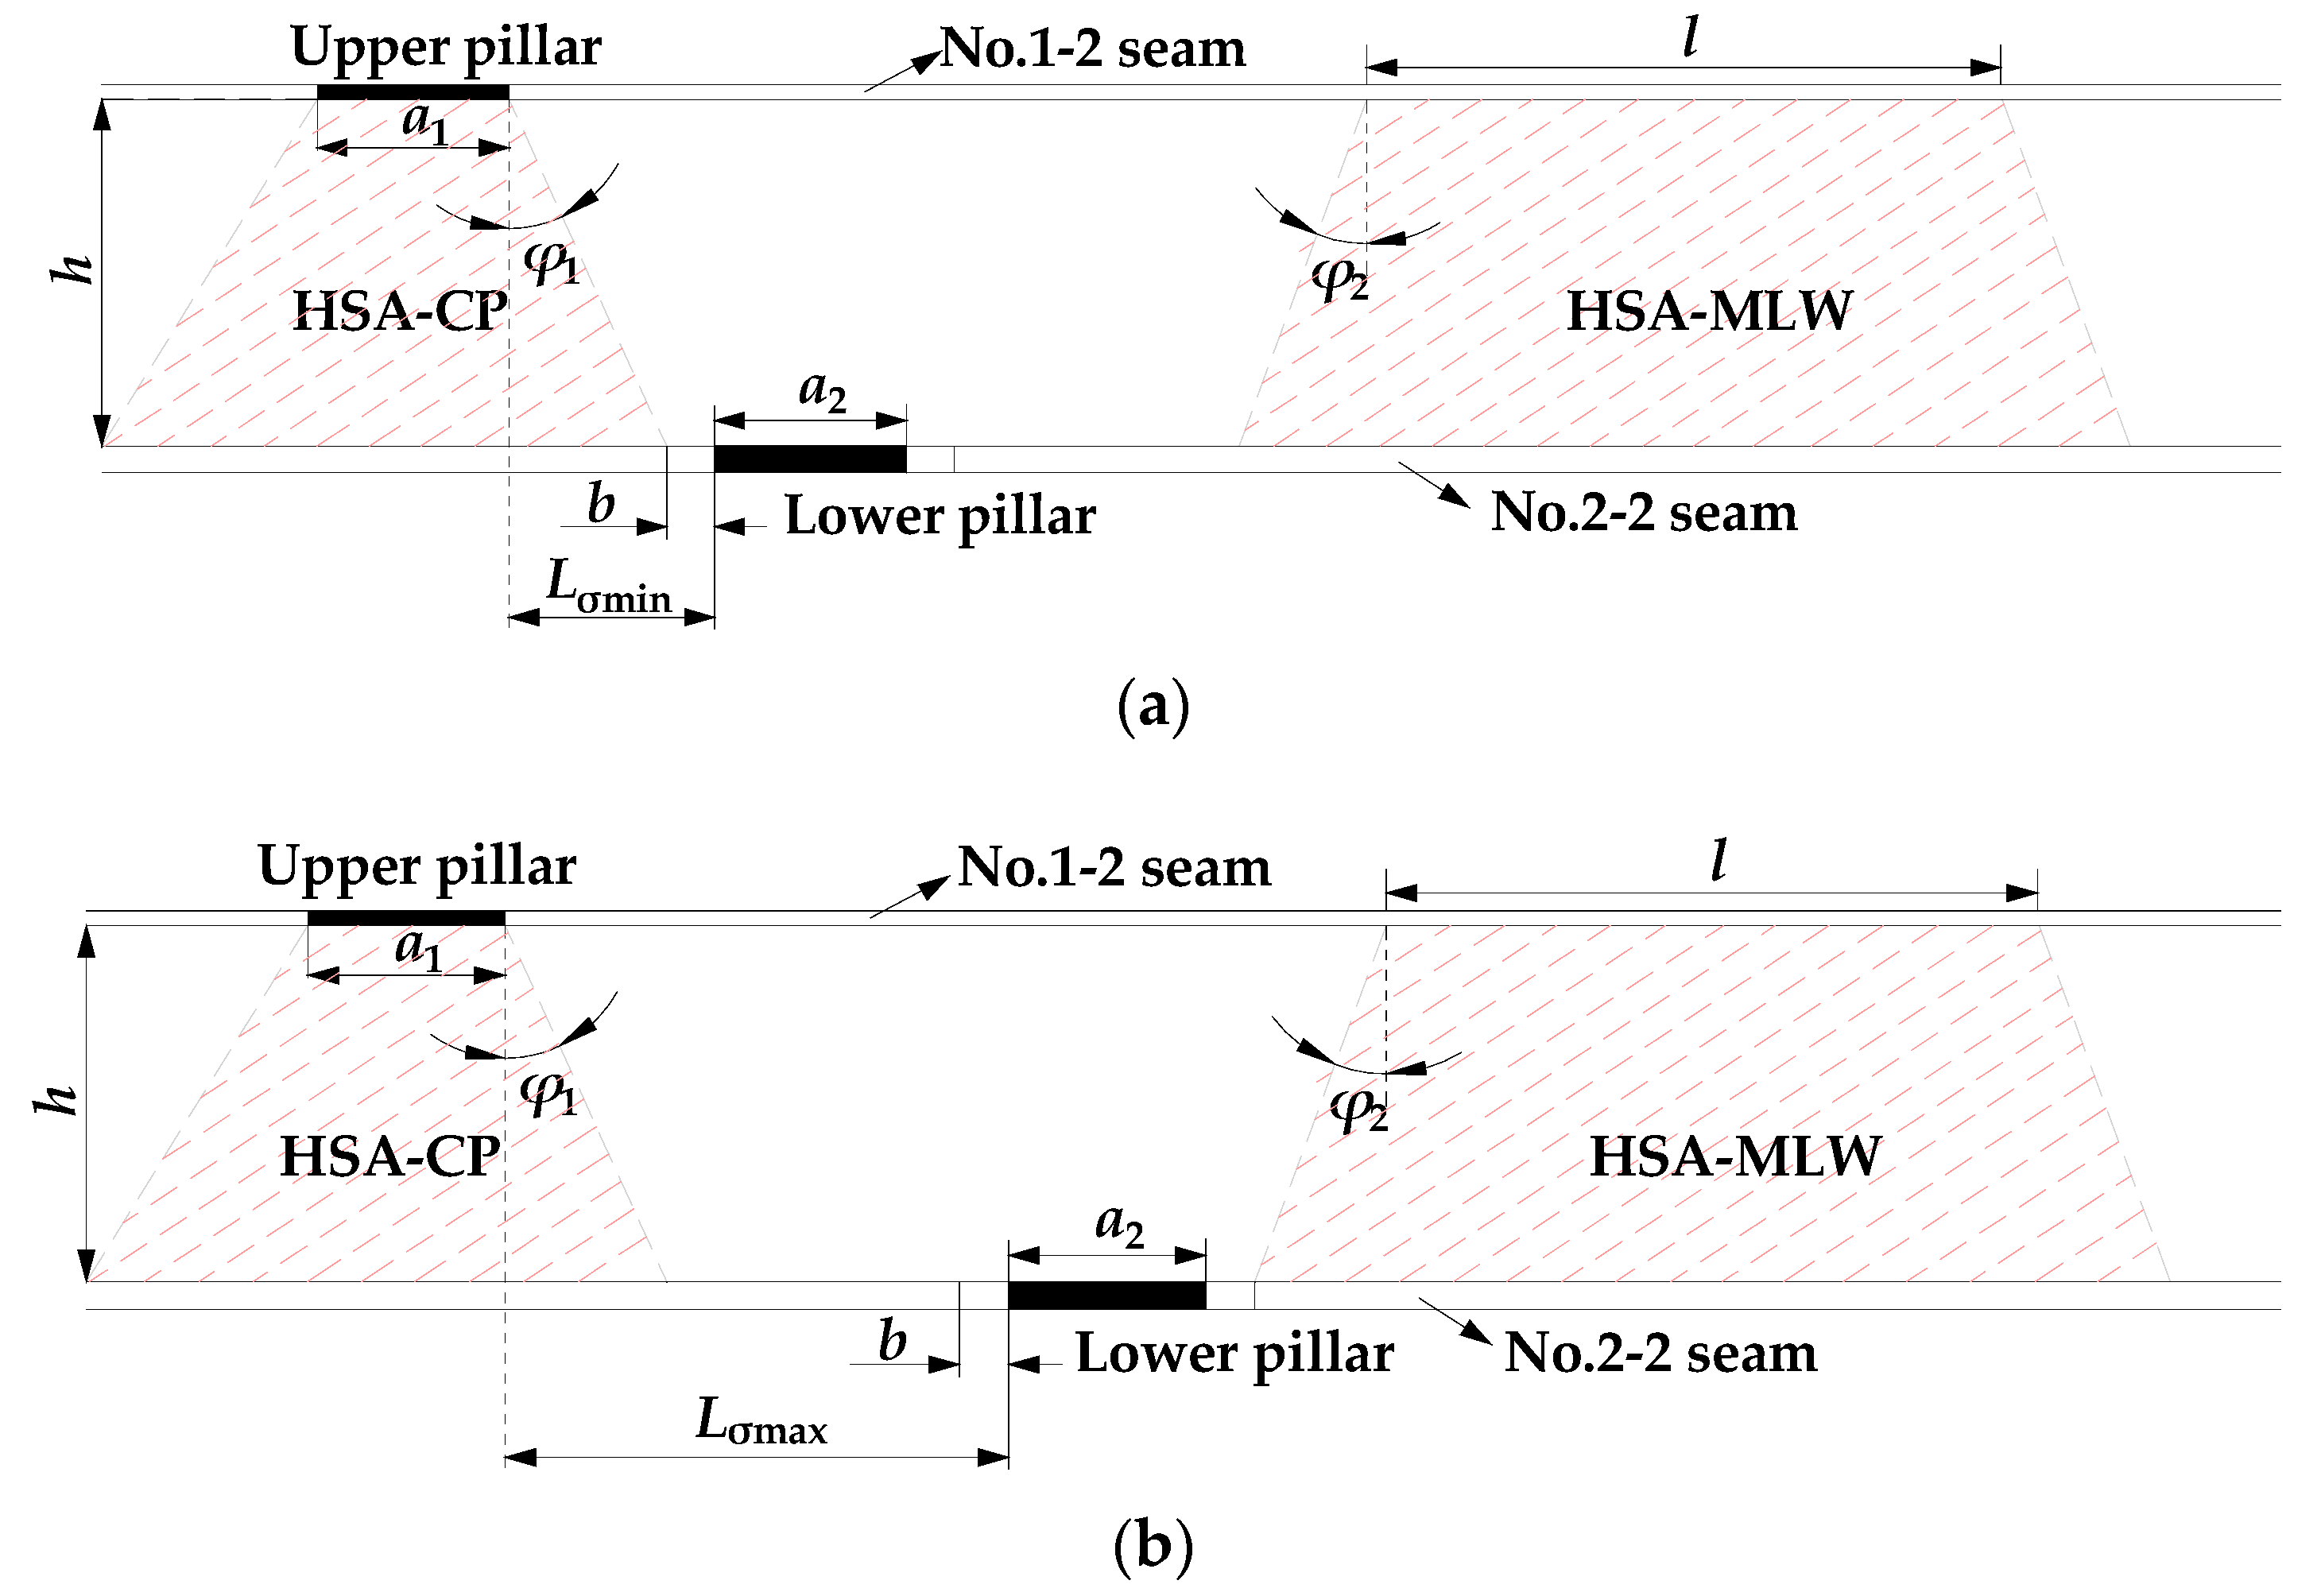
4.1. Theoretical Model Based on Control of Concentrated Ctress Field

(1) Calculation model of CPMD based on physical simulation
Based on physical simulation, stress field evolution in SBCSM-S mining was analysed above. Rational CPMD should simultaneously avoid HSA-CP and HSA-MLW. Therefore, a model of CPMD is established in Figure 17. Where, Lσmin is the minimum CPMD for controlling concentrated stress, m; Lσmax is the maximum CPMD, m; h is the thickness of interburden strata, m; a1 is upper pillar width, m; a2 is lower pillar width, m; b is the lower roadway width, m; φ1 is the stress transfer angle of HSA-CP, (°); φ2 is the stress transfer angle of HSA-MLW, (°); l is the range of HSA-MLW in No. 1–2 seam.
The arrangement of lower roadway should avoid HSA-CP and HSA-MLW; consequently, the minimum and maximum CPMD are, respectively:
L σ min = h tan ϕ 1 + b
L σ max = 1 2 ( L l ) h tan ϕ 2 b a 2
where, L is the longwall face width of No. 1–2 seam, m.
Therefore, the rational CPMD Lσ based on control of concentrated stress field is:
L σ min L σ L σ max
According to the mining conditions and physical simulation, calculating parameters are shown below.
h = 35 m, φ1 = 25°, φ2 = 29°, b = 5 m, L = 245 m, l = 45 m, a2 = 20 m, combining with Equations (1)–(3) and parameters above, the rational CPMD Lσ is:
21.32 m ≤ Lσ ≤ 55.59 m
(2) Calculation model of CPMD based on elasticity
Through theoretical analysis by elasticity, concentrated stress transfer characteristics under the upper pillar is studied. If the thickness of the interburden strata is known, stress distribution of the lower seam affected by upper pillar can be revealed. The interburden strata (floor of upper seam) affected by upper pillar can be regarded as the effect of distributed stress on the semi-planar body. Based on this, a mechanical model is established as Figure 18. The origin point of coordinate system is denoted as O.
Where, q is the uniform load of upper pillar, MPa; a1 is upper pillar width, m. A micro length dξ is defined, and it is ξ away from point O; therefore, micro concentrated stress on the length is qdξ. M (x, y) is an arbitrary point under the upper pillar, the vertical and horizontal distance of point M and micro concentrated stress are x and y-ξ, respectively, vertical stress (dσx) of point M caused by micro concentrated stress (qdξ) is [36].
d σ x = 2 q d ξ π x 3 [ x 2 + ( y ξ ) 2 ] 2
Through integral on line AB, vertical stress σx of point M caused by upper pillar is:
σ x = 2 q π -   1 2 a 1 1 2 a 1 x 3 d ξ [ x 2 + ( y ξ ) 2 ] 2 = q π [ arctan y + 1 2 a 1 x arctan y 1 2 a 1 x + x ( y + 1 2 a 1 ) x 2 + ( y + 1 2 a 1 ) 2 x ( y 1 2 a 1 ) x 2 + ( y 1 2 a 1 ) 2 ]
Based on Equation (5), if the position of point M (x, y) and uniform load q are known, vertical stress of point M can be solved. According to physical simulation, the maximum vertical stress of upper pillar is 20.56 MPa; consequently, q = 20.56 MPa, a1 = 20 m. Combining with Equation (5), distribution characteristics of vertical stress with different floor depth under the upper pillar is calculated and shown in Figure 19.
According to Figure 19, the authors come to the following conclusions:
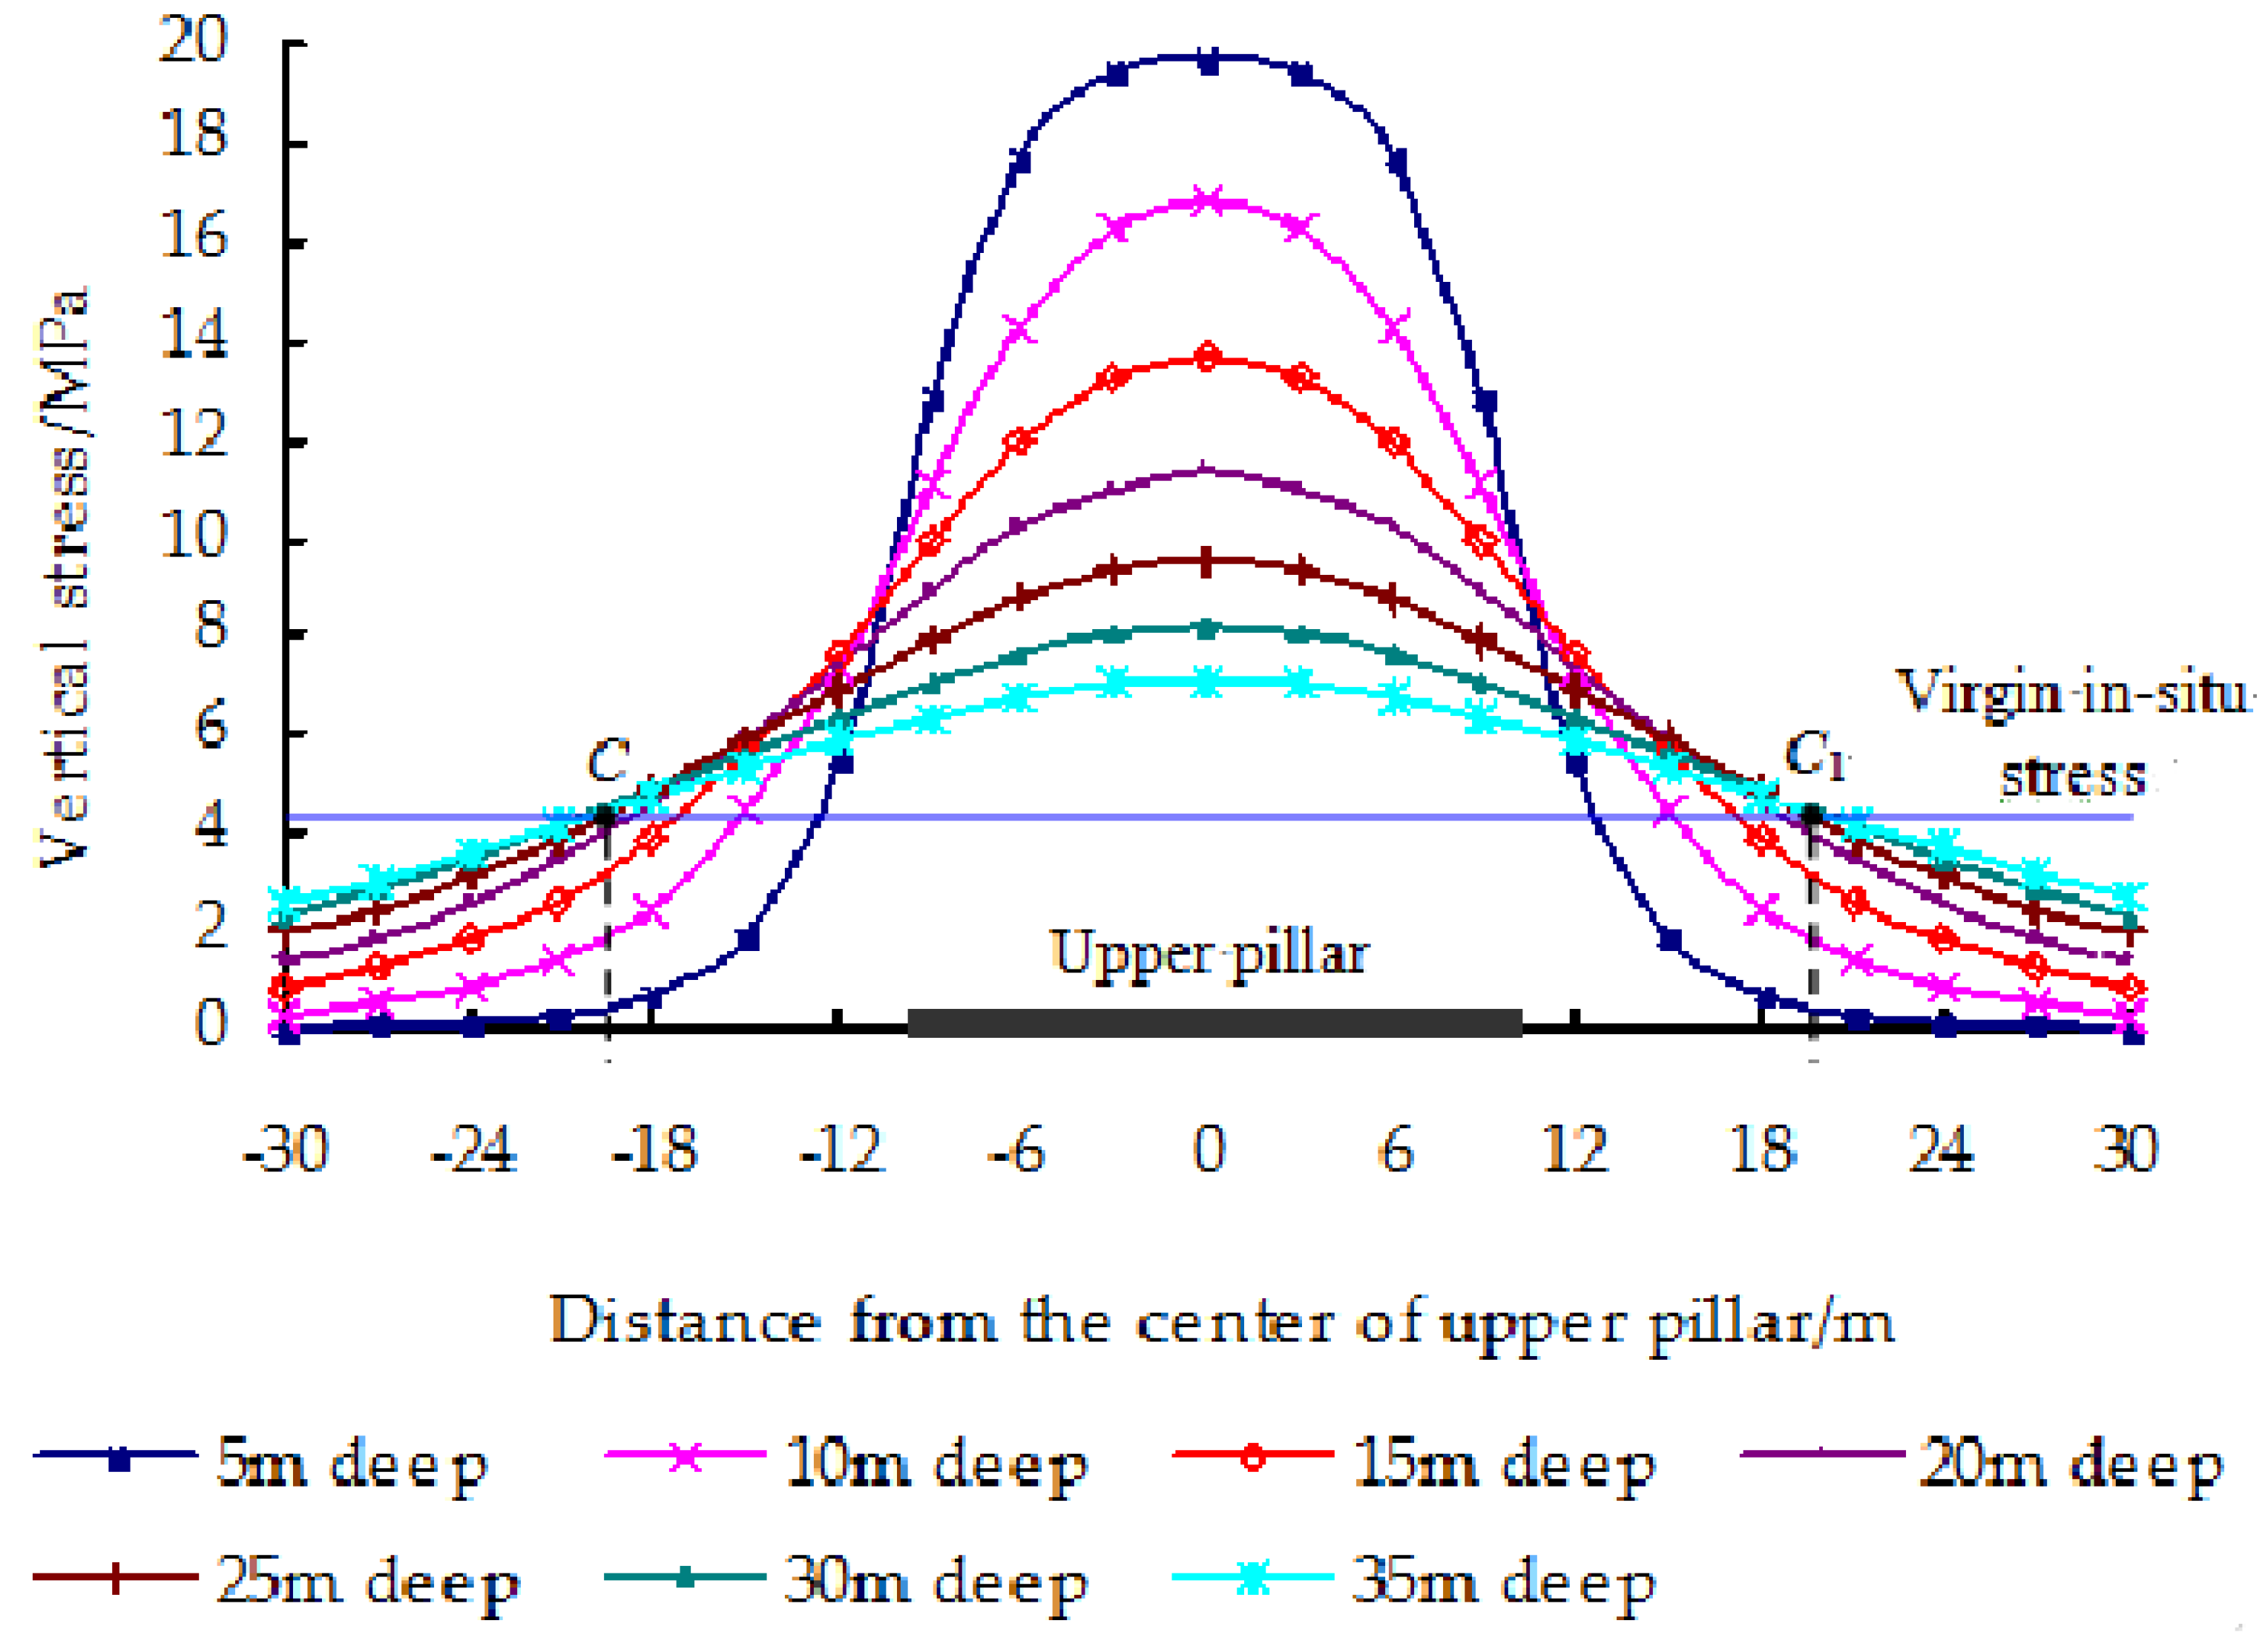
  • The largest vertical stress is located under the center of the upper pillar. It gradually decreases to two sides at a slower speed; overall, vertical stress curves represent symmetric distribution.
  • Within 10 m horizontal distance from the center of the upper pillar, as floor depth increases, the vertical stress decreases at a slower speed. When the horizontal distance from the center of the upper pillar is larger than 20 m, as floor depth increases, the vertical stress increases.
  • With increase of floor depth, the effect of concentrated stress is gradually not obvious; consequently, vertical stress distribution curves become flat and tend to virgin in-situ stress line.
Thickness of interburden strata between No. 1–2 and No. 2–2 seams is 35 m on average. The intersections of virgin in-situ stress line (No. 2–2 seam) and 35 m deep vertical stress curve are C and C1 respectively. The stress of line CC1 in No. 2–2 seam is larger than virgin in-situ stress; consequently, line CC1 is HSA-CP. According to Figure 19, the distance of point C1 (C) and upper pillar boundary is about 10 m. Calculated with a roadway width of 5 m, the CPMD should be larger than 15 m.
According to the theoretical models based on physical simulation and elasticity analysis, the rational CPMD based on control of the concentrated stress field in SBCSM-S mining is 21.32–55.59 m.

4.2. Theoretical Model Based on Control of Displacement Field and Fracture Field

As the CPMD increases, when the upper pillar and its upper inverted T-shaped structure represent completely subsidence, OSF ② and GSF ④ tend to come to a closure. The soil subsidence attaches to the bedrock subsidence; a model based on coupling control of the displacement and fracture fields is established in Figure 20. Where, Lε is the minimum CPMD of realizing coupling control of displacement field and fracture field, m; h is interburden strata thickness, m; h1 is the bedrock thickness upper No. 1–2 seam, m; α1 is bedrock caving angle of No. 1–2 seam, °; α2 is bedrock caving angle of No. 2–2 seam, °.
In addition, CPMD should be smaller than half of the longwall face width; it can be determined as:
h 1 tan α 1 + h tan α 2 L ε L 2
According to mining conditions, h1 = 70 m, h = 35 m, α1 = 65°, α2 = 72°, L = 245 m, combining with Equation (6): 44.01 m ≤ Lε ≤ 122.5 m.
Based on the calculation results of Equations (3) and (6), CPMD based on coupling control of three-field in SBCSM-S mining is 44.01–55.59 m. On the one hand, the underground concentrated stress of coal pillar is avoided, and it is beneficial to lower roadway support. On the other hand, it can realize control of OSF and GSF, and the uneven surface subsidence is decreased, all of above can promote safe and green mining in SBCSM-S.

5. Conclusions

Coal pillars result in uneven subsidence and fractures in ground surfaces, and cause underground concentrated stress. Through rational arrangement of CPMD, the uneven surface subsidence is decreased, OSF and GSF are controlled, and the concentrated stress of coal pillar is avoided; consequently, it can realize coupling control of underground concentrated stress and ground surface damage.
OSF ② and GSF ④ are the main fractures that can be controlled by rational arrangement of CPMD. According to the physical simulation, as the CPMD increases, the width of OSF ② and GSF ④ above the pillar decreases; when the CPMD is 40 m, their width decreases by 74.3% and 83.6%, compared to the arrangement of aligned pillars. Thereafter, width change is not obvious with CPMD.
In order to decrease the concentrated stress of the coal pillar, and reduce the support difficulty of the lower seam roadway, an arrangement of the lower pillar should avoid HSA-CP and HSA-MLW. In order to decrease ground surface fractures and uneven subsidence, the rational CPMD should ensure complete subsidence of the upper pillar.
According to the three-field evolution characteristics in SBCSM-S mining, models based on coupling control of the same are established, and the determination method of rational CPMD is put forward. The rational CPMD based on coupling control of the three-field at the Ningtiaota coal mine is 44.01–55.59 m; this will be applied in a follow-up arrangement at the mines.

Author Contributions

Conceptualization, Q.H.; Experimental Design, Q.H. and J.C.; Validation, Q.H. and J.C.; Theoretical Analysis, Q.H. and J.C.; Data Curation, J.C.; Supervision, Q.H.; Writing—Original Draft Preparation, J.C.; Writing—Review & Editing, Q.H. and J.C. Supervision, Q.H.; Project Administration, Q.H.; Funding Acquisition, Q.H.

Funding

This research was funded by the National Natural Science Foundation of China, grant number No.51674190.

Acknowledgments

We thank the National Natural Science Foundation of China for its support to this study. We thank the academic editors and anonymous reviewers for their kind suggestions and valuable comments.

Conflicts of Interest

The authors declare no conflict of interest.

References

  1. Wang, S.M.; Huang, Q.X.; Fan, L.M.; Wang, W.K. Coal Mining and Ecological Water Level Protection in Ecologically Fragile Areas; Science China Press: Beijing, China, 2010. [Google Scholar]
  2. Fan, L.M.; Ma, X.D.; Li, Y.H.; Li, C.; Yao, C.W.; Xiang, M.X.; Wu, B.Y.; Peng, J. Geological disasters and control technology in high intensity mining area of western China. J. China Coal Soc. 2017, 42, 276–285. [Google Scholar]
  3. Qian, M.G.; Miao, X.X.; Xu, J.L.; Cao, S.G. On scientized mining. J. Min. Saf. Eng. 2008, 25, 1–10. [Google Scholar]
  4. Qian, M.G. On sustainable coal mining in China. J. China Coal Soc. 2015, 35, 529–534. [Google Scholar]
  5. Qian, M.G.; Xu, J.L.; Wang, J.C. Further on the sustainable mining of coal. J. China Coal Soc. 2018, 43, 1–12. [Google Scholar]
  6. Ren, Y.F.; Qi, Q.X. Study on characteristic of stress field in surrounding rocks of shallow coalface under long wall mining. J. China Coal Soc. 2011, 36, 1612–1618. [Google Scholar]
  7. Ren, Y.F.; Ning, Y. Changing feature of advancing abutment pressure in shallow long wall working face. J. China Coal Soc. 2014, 39, 38–42. [Google Scholar]
  8. Xie, X.Z. Study on stability of roof-coal pillar in room and pillar mining goaf in shallow depth seam. Coal Sci. Technol. 2014, 42, 1–9. [Google Scholar]
  9. Li, S.G. Study on mining-induced stress and width of coal pillar in extremely shallow buried coal seam. Saf. Coal Mines 2018, 49, 222–225. [Google Scholar]
  10. Bai, Q.S.; Tu, S.H.; Wang, F.T.; Yuan, Y. Stress evolution and shallow coal seam in proximity underlying the room mining residual pillars. Chin. J. Rock Mech. Eng. 2012, 31, 3772–3778. [Google Scholar]
  11. Kong, D.Z.; Wang, Z.H.; Ren, Z.C. Determining the optimum position of roadways of full-mechanized caving face in the close distance seams. J. Min. Saf. Eng. 2014, 31, 270–276. [Google Scholar]
  12. Zhang, M.W.; Shimada, H.; Sasaoka, T.; Matsui, K.; Dou, L.M. Evolution and effect of the stress concentration and rock failure in the deep multi-seam coal mining. Environ. Earth Sci. 2014, 72, 629–643. [Google Scholar] [CrossRef]
  13. Liu, Z.H.; Lou, S.; Meng, X.R.; Gao, Z.N. Mining affect of close distance coal seam to surrounding rock stress evolution of coal face in distressed zone. J. Min. Saf. Eng. 2016, 33, 102–108. [Google Scholar]
  14. Zhao, Y.H.; Song, X.M.; Liu, N.B. Research on stability of coal pillar and roadway layout optimization in shallow multi-seams. Coal Sci. Technol. 2015, 43, 12–17. [Google Scholar]
  15. Tang, F.Q.; Yao, W.Q.; Xia, Y.C. Prediction method of ground subsidence for coal mining in seam under thin base rock. Coal Sci. Technol. 2017, 35, 103–105. [Google Scholar]
  16. Xuan, Y.Q. Research on movement and evolution law of breaking of overlying strata in shallow coal seam with a thin bedrock. Rock Soil Mech. 2008, 29, 512–516. [Google Scholar]
  17. Li, J.; Jia, X.G. Study on surface ground displacement law measure of fully mechanized top coal caving mining in shallow depth thick seam. Coal Sci. Technol. 2012, 40, 108–115. [Google Scholar]
  18. Liu, W.G.; Chen, T.; Yao, J.K.; Zhao, X.D. Study on characteristics of overlying strata and surface subsidence under the shallow coal seam mining in Hanglaiwan coal mine. J. Min. Saf. Eng. 2017, 34, 1141–1147. [Google Scholar]
  19. Wang, Z.L.; Wu, Z.C.; Liang, B.; Wang, B.F.; Jiang, L.G.; Mu, T.C. Simulated and experimental study on the displacement tendency of the overlying strata in the mining of the shallow-buried coal seam. J. Saf. Environ. 2017, 17, 2140–2145. [Google Scholar]
  20. Slaker, B.A.; Westman, E.C. Identifying underground coal mine displacement through field and laboratory laser scanning. J. Appl. Remote Sens. 2014, 8, 1–12. [Google Scholar] [CrossRef]
  21. Zhang, X.S.; Yu, H.C.; Dong, J.Y.; Liu, S.P.; Huang, Z.Q.; Wang, J.X.; Wong, H. A physical and numerical model-based research on the subsidence features of overlying strata caused by coal mining in Henan, China. Environ. Earth Sci. 2017, 76, 705. [Google Scholar] [CrossRef]
  22. Yang, Z.F.; Li, Z.W.; Zhu, J.J.; Hu, J.; Wang, Y.J.; Chen, G.L. InSAR-Based model parameter estimation of probability integral method and its application for predicting mining-induced horizontal and vertical displacements. IEEE Trans. Geosci. Electron. 2016, 54, 4818–4832. [Google Scholar] [CrossRef]
  23. Zhou, D.W.; Wu, K.; Chen, G.L.; Li, L. Mechanism of mining subsidence in coal mining area with thick alluvium soil in China. Arab. J. Geosci. 2015, 8, 1855–1867. [Google Scholar] [CrossRef]
  24. Ghabraie, B.; Ren, G.; Smith, J.V. Characterising the multi-seam subsidence due to varying mining configuration, insights from physical modelling. Int. J. Rock Mech. Min. 2017, 93, 269–279. [Google Scholar] [CrossRef]
  25. Zuo, J.P.; Sun, Y.J.; Li, Y.C.; Wang, J.T.; Wei, X.; Fan, L. Rock strata movement and subsidence based on MDDA, an improved discontinuous deformation analysis method in mining engineering. Arab. J. Geosci. 2017, 10, 395. [Google Scholar] [CrossRef]
  26. Huang, Q.X. Research on roof control of water conservation mining in shallow seam. J. China Coal Soc. 2017, 42, 50–55. [Google Scholar]
  27. Huang, Q.X.; Zhang, W.Z. Mechanical model of water resisting strata group in shallow seam strip-filling mining. J. China Coal Soc. 2015, 5, 973–978. [Google Scholar]
  28. Xue, D.J.; Zhou, H.W.; Ren, W.G.; Zhang, B.F.; Liu, Y.Q.; Zhao, Y.F. Stepped shearing-induced failure mechanism and cracks propagation of overlying thin bedrocks in shallow deep coal seams mining. J. China Coal Soc. 2015, 40, 1746–1752. [Google Scholar]
  29. Huang, H.F.; Yan, Y.G.; Yao, B.H.; Xu, H.J. Research on the process of fracture development in overlying rocks under coal seams group mining in Wanli Mining Area. J. Min. Saf. Eng. 2012, 29, 619–624. [Google Scholar]
  30. Fan, L.M.; Zhang, X.T.; Xiang, M.X.; Zhang, H.Q.; Shen, T.; Lin, P.X. Characteristics of ground fissure development in high intensity mining area of shallow seam in Yushenfu coal field. J. China Coal Soc. 2015, 40, 1442–1447. [Google Scholar]
  31. Sun, L.Z.; Xie, Y.Y.; Xiao, H.T. Numerical Analysis of Stress Fields and Crack Growths in the Floor Strata of Coal Seam for Longwall Mining. Math. Probl. Eng. 2018, 2018, 1–12. [Google Scholar] [CrossRef]
  32. Yang, J.H.; Yu, X.; Yang, Y.; Yang, Z.Q. Physical simulation and theoretical evolution for ground fissures triggered by underground coal mining. PLoS ONE 2018, 13, e0192886. [Google Scholar] [CrossRef] [PubMed]
  33. Chen, Z.H.; Qi, Q.X.; Li, H.Y.; Zhang, L.; Liu, X.G. Evolution of the superimposed mining induced stress-fissure field under extracting of close distance coal seam group. J. China Coal Soc. 2016, 41, 367–375. [Google Scholar]
  34. Guo, H.; Yuan, L.; Shen, B.T.; Qu, Q.D.; Xue, J.H. Mining-induced strata stress changes, fractures and gas flow dynamics in multi-seam longwall mining. Int. J. Rock Mech. Min. 2012, 54, 129–139. [Google Scholar] [CrossRef]
  35. Li, S.Q.; He, X.Q.; Li, S.Q.; Zhang, S.J.; Yan, Z.; Xie, Q.X.; Ding, Y. Experimental research on strata movement and fracture dynamic evolution of double pressure-relief mining in coal seams group. J. China Coal Soc. 2013, 38, 2146–2152. [Google Scholar]
  36. Xu, Z.L. Introduction on Elasticity; China Higher Education Press: Beijing, China, 2013. [Google Scholar]
Figure 1. The location of Jurassic Coalfield in China.
Energies 12 00462 g001
Figure 2. The longwall face arrangement in northward east area.
Energies 12 00462 g002
Figure 3. The ground surface is seriously damaged during SBCSM-S mining; (a,b) Mining-induced fractures.
Energies 12 00462 g003
Figure 4. Experiment model design: (a) physical simulation model; (b) sketch model.
Energies 12 00462 g004aEnergies 12 00462 g004b
Figure 5. Experimental monitoring system: (a) Fracture width gauge; (b) Dial indicator; (c) Force test sensor.
Energies 12 00462 g005
Figure 6. CPMD of coal seams.
Energies 12 00462 g006
Figure 7. Stress distribution of No. 1–2 seam mining.
Energies 12 00462 g007
Figure 8. The rational CPMD: (a) The minimum CPMD, (b) the maximum CPMD.
Energies 12 00462 g008
Figure 9. Maximum vertical stress vs. CPMD.
Energies 12 00462 g009
Figure 10. Overburdened movement of No. 1–2 seam mining.
Energies 12 00462 g010
Figure 11. Surface subsidence curve of No. 1–2 seam mining.
Energies 12 00462 g011
Figure 12. Surface subsidence curves vs. CPMD.
Energies 12 00462 g012
Figure 13. Physical simulation of different CPMD: (a) Aligned pillars; (b) CPMD of 10 m; (c) CPMD of 30 m, and (d) CPMD of 40 m.
Energies 12 00462 g013
Figure 14. GSF ③ evolution vs. CPMD: (a) Aligned pillars; (b) CPMD of 10 m; (c) CPMD of 30 m; (d) CPMD of 40 m; (e) CPMD of 50 m, and (f) CPMD of 80 m.
Energies 12 00462 g014
Figure 15. GSF ④ evolution vs. CPMD: (a) Aligned pillars; (b) CPMD of 10 m; (c) CPMD of 30 m; (d) CPMD of 40 m; (e) CPMD of 50 m, and (f) CPMD of 80 m.
Energies 12 00462 g015
Figure 16. OSF width and GSF width vs. CPMD.
Energies 12 00462 g016
Figure 17. Model of CPMD based on physical simulation: (a) model of minimum CPMD; (b) model of maximum CPMD.
Energies 12 00462 g017
Figure 18. Mechanical model of stress under the upper pillar.
Energies 12 00462 g018
Figure 19. Distribution characteristics of vertical stress vs. different floor depth.
Energies 12 00462 g019
Figure 20. Model based on coupling control of displacement field and fracture field: (a) physical simulation model; (b) sketch model.
Energies 12 00462 g020
Table 1. The parameters of coal and its roof and floor.
LithologyThickness (m)Depth (m)Bulk Density (kg/m3)Compressive Strength (MPa)Cohesion (MPa)Poisson’s Ratio
Red soil94.7094.7018600.290.770.35
Sandy mudstone14.80109.50256034.701.150.24
Siltstone21.60131.10242031.900.650.32
Medium-grained sandstone28.80159.90216035.300.800.29
Siltstone6.70166.60242031.900.650.32
Medium-grained sandstone10.00176.60233040.601.500.28
No. 1–2 seam1.90178.50129015.701.100.28
Fine-grained sandstone9.40187.90227029.601.500.27
Siltstone3.80191.70244036.000.900.30
Fine-grained sandstone5.90197.60234048.501.900.29
Siltstone1.00198.60240045.301.200.30
Fine-grained sandstone13.20211.80230045.602.200.27
No. 2–2 seam4.60216.40134013.801.200.27
Siltstone3.50219.90234020.500.150.34
Fine-grained sandstone8.70228.60228039.102.200.27
Siltstone2.40231.00240042.500.700.31
Fine-grained sandstone11.70242.70235047.502.400.27
Medium-grained sandstone6.90249.60226041.902.500.26
Siltstone3.50253.10240046.301.800.28
No. 3–1 seam2.70255.80127010.901.100.29
Fine-grained sandstone2.00257.80233043.102.000.25
Table 2. Material ratio of model.
LithologyMaterial Ratio NumberConsumable(kg)
SandGypsumCalcium CarbonateCoal Ash
Red soilSand: Soil: Silicone oil = 4.5:4.5:1Sand (341.28): Soil (341.28): Silicone oil (75.84)
Sandy mudstone928106.562.379.47-
Siltstone937155.525.1812.10-
Medium-grained sandstone828204.505.0920.45-
Siltstone93748.961.633.81-
Medium-grained sandstone82871.001.807.10-
No. 1–2 seam20:20:1:55.650.281.415.65
Fine-grained sandstone83766.802.505.84-
Siltstone93727.360.912.13-
Fine-grained sandstone83742.601.593.72-
Siltstone9377.200.240.56-
Fine-grained sandstone83793.803.508.19-
No. 2–2 seam20:20:1:513.000.653.2513.00
Siltstone93725.900.862.02-
Fine-grained sandstone83762.502.355.48-
Siltstone93717.300.581.34-
Fine-grained sandstone83783.803.137.32-
Medium-grained sandstone82849.701.254.97-
Siltstone93724.500.821.90-
No. 3–1 seam20:20:1:57.910.391.977.91
Fine-grained sandstone83715.600.591.37-

