1. Introduction
Liquid-gas two-phase pumps have been widely employed in various industry fields like oil-gas transportation, chemical plants and food processing these years. However, the fully-researched pump types are mainly designed and working on single-phase medium. The technology of multiphase transportation still lacks research. Unlike the traditional single-phase pumps, the working medium properties are varied in the pump passages. The inner-flow pattern changes with the mixture proportion, flow rate, rotation speed, etc., and significantly influences pump performance.
Most of the traditional rotodynamic pump types, like centrifugal pump and mixed-flow pump, could not fully accomplish the requirements of multiphase transportation [
1,
2,
3]. The main difficulty for rotodynamic pumps to transport liquid-gas flow is the separation of two-phase due to the pressure difference. In this field, the fixed displacement pumps have their advantage of pumping mediums with different component and proportion, while keeping the output flowrate constant [
4,
5].
The two main liquid-gas multiphase pump types which have been applied in industrial fields are the twin-screw pump and helico-axial pump [
5]. The two types have their own advantages and disadvantages in pumping two-phase flow. The twin-screw pump has dominated the oil and gas transportation field due to its benefits in a wide range of pumping medium [
5,
6,
7]. However, the low particle resistance and strong friction between screws leads to short service life, high replacement frequency and high maintenance cost of the pump [
8,
9].
The helico-axial pump is a specialized rotodynamic pump which is derived from an axial pump and compressor. The pump usually has a multi-stage structure with a rotor/impeller and a stator/diffuser in each stage. The axial flow direction alleviates the separation tendency caused by centrifugal force; the diffuser helps breaking air mass and converting kinetic pressure to static pressure. The development of helico-axial pump started in the 1980s and has been applied at oil fields by several research institutes and petroleum companies. Some researchers have also investigated the characteristics of the helico-axial pump. Saadawi [
5] concludes the situation of multiphase transportation technology and describes the design, testing and commissioning of the helico-axial pumps in Huwaila Field. The helico-axial pump has advantages in the flexibility of flowrate and the inclusiveness of the sand or solid in the flow compared to positive displacement pumps. Falcimaigne et al. [
10] has discussed the achievements and perspectives of helico-axial technology of IFP (Institute of Petrole France) in Priobskoye and Topacio fields. Some other applications of helico-axial pump such as core component in multiphase transportation systems have also been reported [
11,
12,
13,
14]. The performance tests and applications prove that the helico-axial pumps could do well at liquid-gas two-phase pumping work.
Due to its particular benefits of high practicality and low cost in transporting liquid-gas mixture, the helico-axial pump development method and performance characteristics have been investigated in recent years. Cao et al. [
15] used the inverse design method and direct-flow analysis to accomplish the hydraulic development of the helico-axial pump. Zhang et al. [
16,
17] carried out the three-dimensional design and optimization of helico-axial pump by neural network and genetic algorithm. Kim et al. [
18] applied the Design of Experiments (DOE) method and Response surface method (RSM) on the optimization design of the pump and validated the effectiveness by numerical simulation.
There are also investigations in the liquid-gas two-phase behaviors in the helico-axial pump by simulation and experimental methods. Tremante et al. [
19] have performed the numerical simulation and test on a five-stage axial pump and found that the Gas Volume Fraction (GVF) and attack angle of the blade have obvious interaction on the final performance of the pump. Yu et al. [
20] investigated the interphase forces like drag force, lift force, and turbulent dispersion force in bubbly flow. Zhang and Tan [
21] investigated the pressure fluctuations and flow patterns in a multiphase pump under different GVFs (0, 5, 10, 15%), results showed that the GVF had a great influence on the pressure fluctuations of the dominant frequency, but little impact on the second frequency. Liu et al. [
22] numerically studied the interphase forces of gas-liquid flow in a multiphase pump, and results show that the velocity difference and phase volume fraction are the main drive for drag force, virtual mass force, lift force and turbulent dispersion force, respectively. Zhang et al. [
23,
24] mainly carried out the visualization test on a helico-axial pump to investigate the liquid-gas flow pattern and its influencing factors like flow rate, rotation speed and gas proportion.
The liquid-gas two-phase flow patterns and mechanism are much more complicated and volatile compared to the single-phase flow. For this reason, in-depth research on the multiphase pumps is more indispensable, while being more difficult. The high degree of interaction between inner flow field and pump performances makes it an iterative process for the development of the helico-axial pump. At present, the investigation is still lacking because of the relatively short development time and also the complexity of the flow mechanism. In the research on inner-flow field, pressure fluctuation monitoring or simulation have been widely used in hydrofoils [
25] and most of the traditional pump types like centrifugal pumps [
26,
27], and mixed-flow pumps [
28,
29,
30,
31]. The description and analysis on the transient pressure field could help understanding of the energy conversion process, flow behavior and flow mechanism. For this reason, the transient pressure monitoring and analysis could be an efficient solution for the studies of inner-flow field of multiphase pump.
In the present work, a helico-axial pump has been developed and tested with water-air mixture. The multiphase performances are obtained, and the transient pressure field is monitored and analyzed to provide an in-depth understanding on the multiphase mechanism in the pump passages.
2. Basic Conditions of Pumps and Test Rig
2.1. Helico-Axial Pump Structure
The test pump in the present work is designed as a three-stage multiphase helico-axial pump with three impellers and two diffusers. Some basic design requirements and dimensional information of the pump are listed in
Table 1. The direct and inverse iterative design method [
32], which has been used in the development of some rotodynamic pumps, is employed in the hydraulic design of the helico-axial pump. The blade angle distribution optimization [
33,
34] is carried out to optimize the pump performance by numerical calculation. In the structural design, the circular suction chamber and a volute are connected to the inlet and outlet of the stages.
An innovative structure in the design of the objective pump is to employ the splitter blades. The splitter blades are usually used in centrifugal and mixed-flow pumps, turbines and fans to improve the blade control ability on fluid. In the helico-axial pump design, the splitter blades are firstly introduced in the impeller structure. The passage of helico-axial pump is relatively narrow compared with the other rotodynamic pump, so the increase of blade number in the whole impeller would significantly magnify the exclusion of coefficient, which would lead to severe deterioration in larger flowrate. However, the control of flow is more important and difficult in the multiphase pump, which needs more blades to work effectively. For these two reasons, the benefits of splitter blades are more noticeable in the helico-axial pump than in other rotodynamic pumps because the splitter blades helps improve the flow control ability in the downstream region while avoiding the increase of exclusion coefficient at the impeller inlet. Between each of the two main blades, a splitter blade was designed at the relative axial length of 0.6 to 1.0 with the same blade angle of main blade. After the design, optimization and numerical simulation, the hydraulic design was settled and a test model manufactured. The structure of the pump section is shown as
Figure 1.
2.2. Water-Air Two-Phase Test Rig
Unlike the single-phase test rig, the two-phase test rig has not been fully developed in previous researches. A two-line test rig is the simplest test system for the multiphase pump. Räbiger et al. [
8] and Hu et al. [
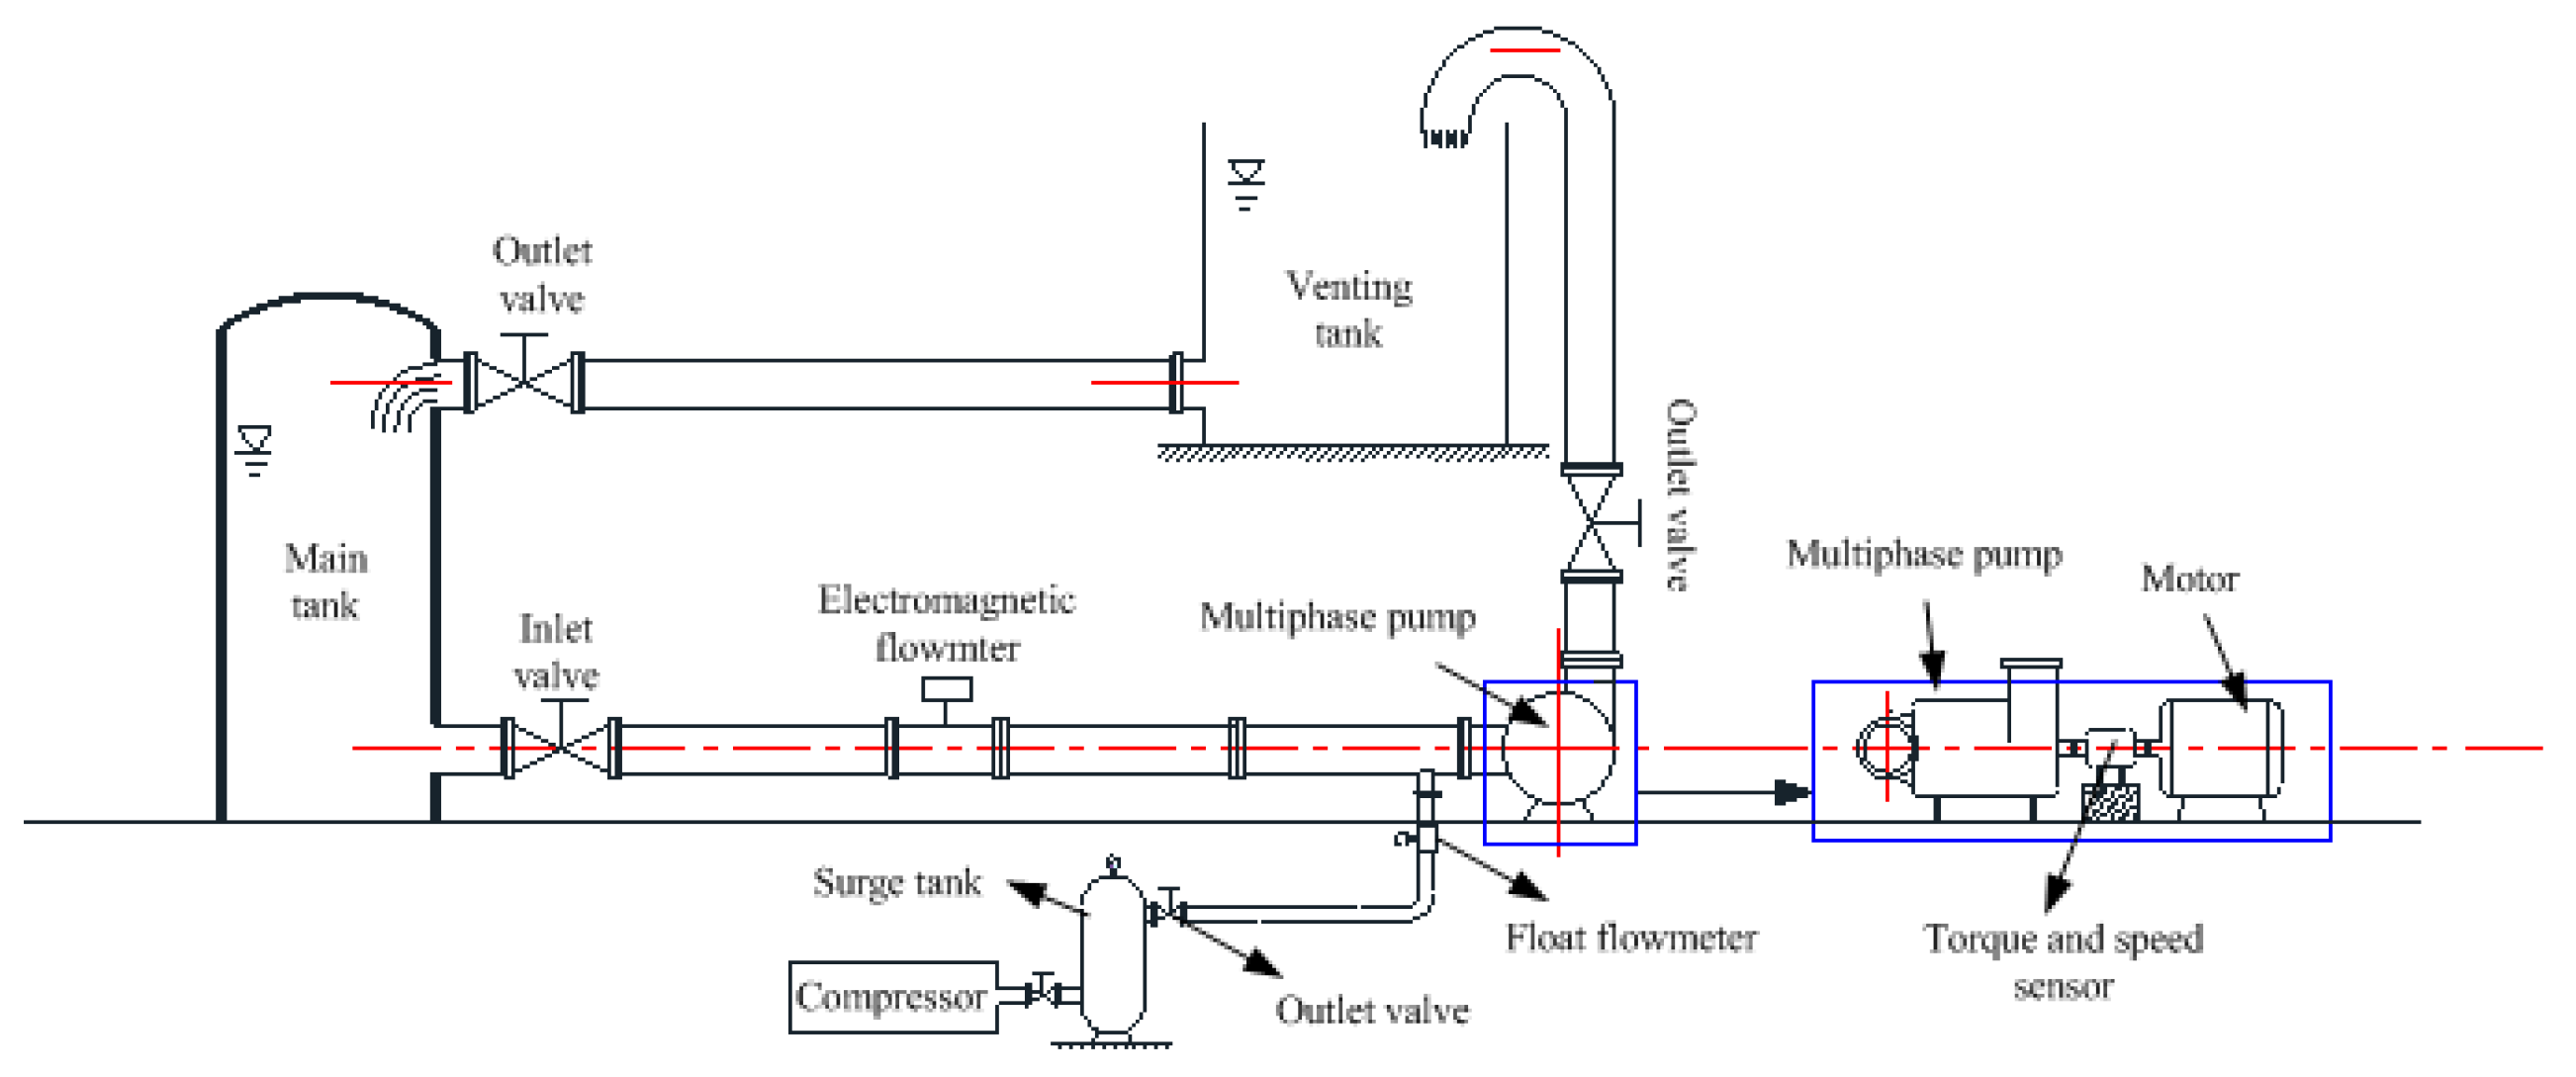
7] have designed two-line systems for the test of a twin-screw multiphase pump. A gas supplement line was added in a liquid test system. Zhang et al established a two-phase test rig for helico-axial pump, adding a mixer before the pump. The key points of the two-phase rig are the addition and the venting of the gas phase. Meanwhile, the test rig should be designed for generating stable two-phase conditions. Based on the traditional water pump test rig, a gas supplement system was added and driven by a compressor, and the gas pressure was stabilized by a surge tank connected with the outlet of the compressor. A mixer was designed to uniformly inject the gas phase into the main stream. The separation of gas from outlet mixture was accomplished by an additional open tank at the upstream of the main tank, which is the main difference from existing test rigs with one water tank. During the test, the open tank proved to be of great significance in venting the gas from the mixture after the pumping work. According to the basic theory, the structural diagram of the test rig was designed and the test rig established, as shown in
Figure 2 and
Figure 3a. The error analysis or the test rig could be seen in
Appendix A. Apart from the measurement instruments, a visualization test system with high-speed camera and a pressure fluctuation monitoring system were employed to record the flow-field condition during the test. The high-speed camera was set at the vertical direction to the pump shaft as shown in
Figure 3b.
2.3. Performance Parameter Definition
In the multiphase working conditions, more parameters are necessary to describe the medium status and pump performances. The two-phase flow rates should be measured separately and a critical parameter, GVF (Gas Volume Fraction), could be calculated by the flowrate values as Equation (1). The GVF value represents the composing proportion of the working medium.
Unlike water or common liquid, the gas phase is compressible. The compressibility makes the gas volume changeable as the pressure rises, so the local GVF value is variational in the passage. In the present work, the inlet gas volume fraction (IGVF) is used to describe the corresponding working state.
The external characteristics could be described as head
H, power
N and efficiency
η. The parameters could be calculated by inlet pressure
pin, outlet pressure
pout, rotation speed
n, and shaft torque
M as Equations (2)–(4).
where
ρ is the medium density;
g is the gravity acceleration;
z is the height of the corresponding location;
v is the velocity;
Q is the volume flow rate of the working medium; and the subscript
in and
out denote the pump inlet and outlet.
In the single-phase conditions, the density is deemed as constant, so the definition of head could be simplified as Equation (5), while in multiphase flow conditions, the density of mixture would range along with the component, flow rate and pressure change, as shown in Equation (6).
where subscripts
l and
g denote the liquid and gas respectively.
The gas component is compressible and the density would varied as the change of pressure. For this reason, the pump head cannot be processed directly. Considering the Bernoulli equation for compressible flow, the pump head can be calculated by considering the density difference of the two phases. For the air-water mixture, the mass flow rate of water is much larger than the flow rate of air (
), so the pump head can be divided as two components
Hg and
Hl, which are defined as Equation (7) and Equation (8). The total pump head H could be calculated by the two parts as Equation (9).
In the test, the air is seen as ideal gas which obeys the ideal gas state equation, so the
Hg can be transformed into Equation (10).
2.4. Pressure Fluctuation Monitoring System
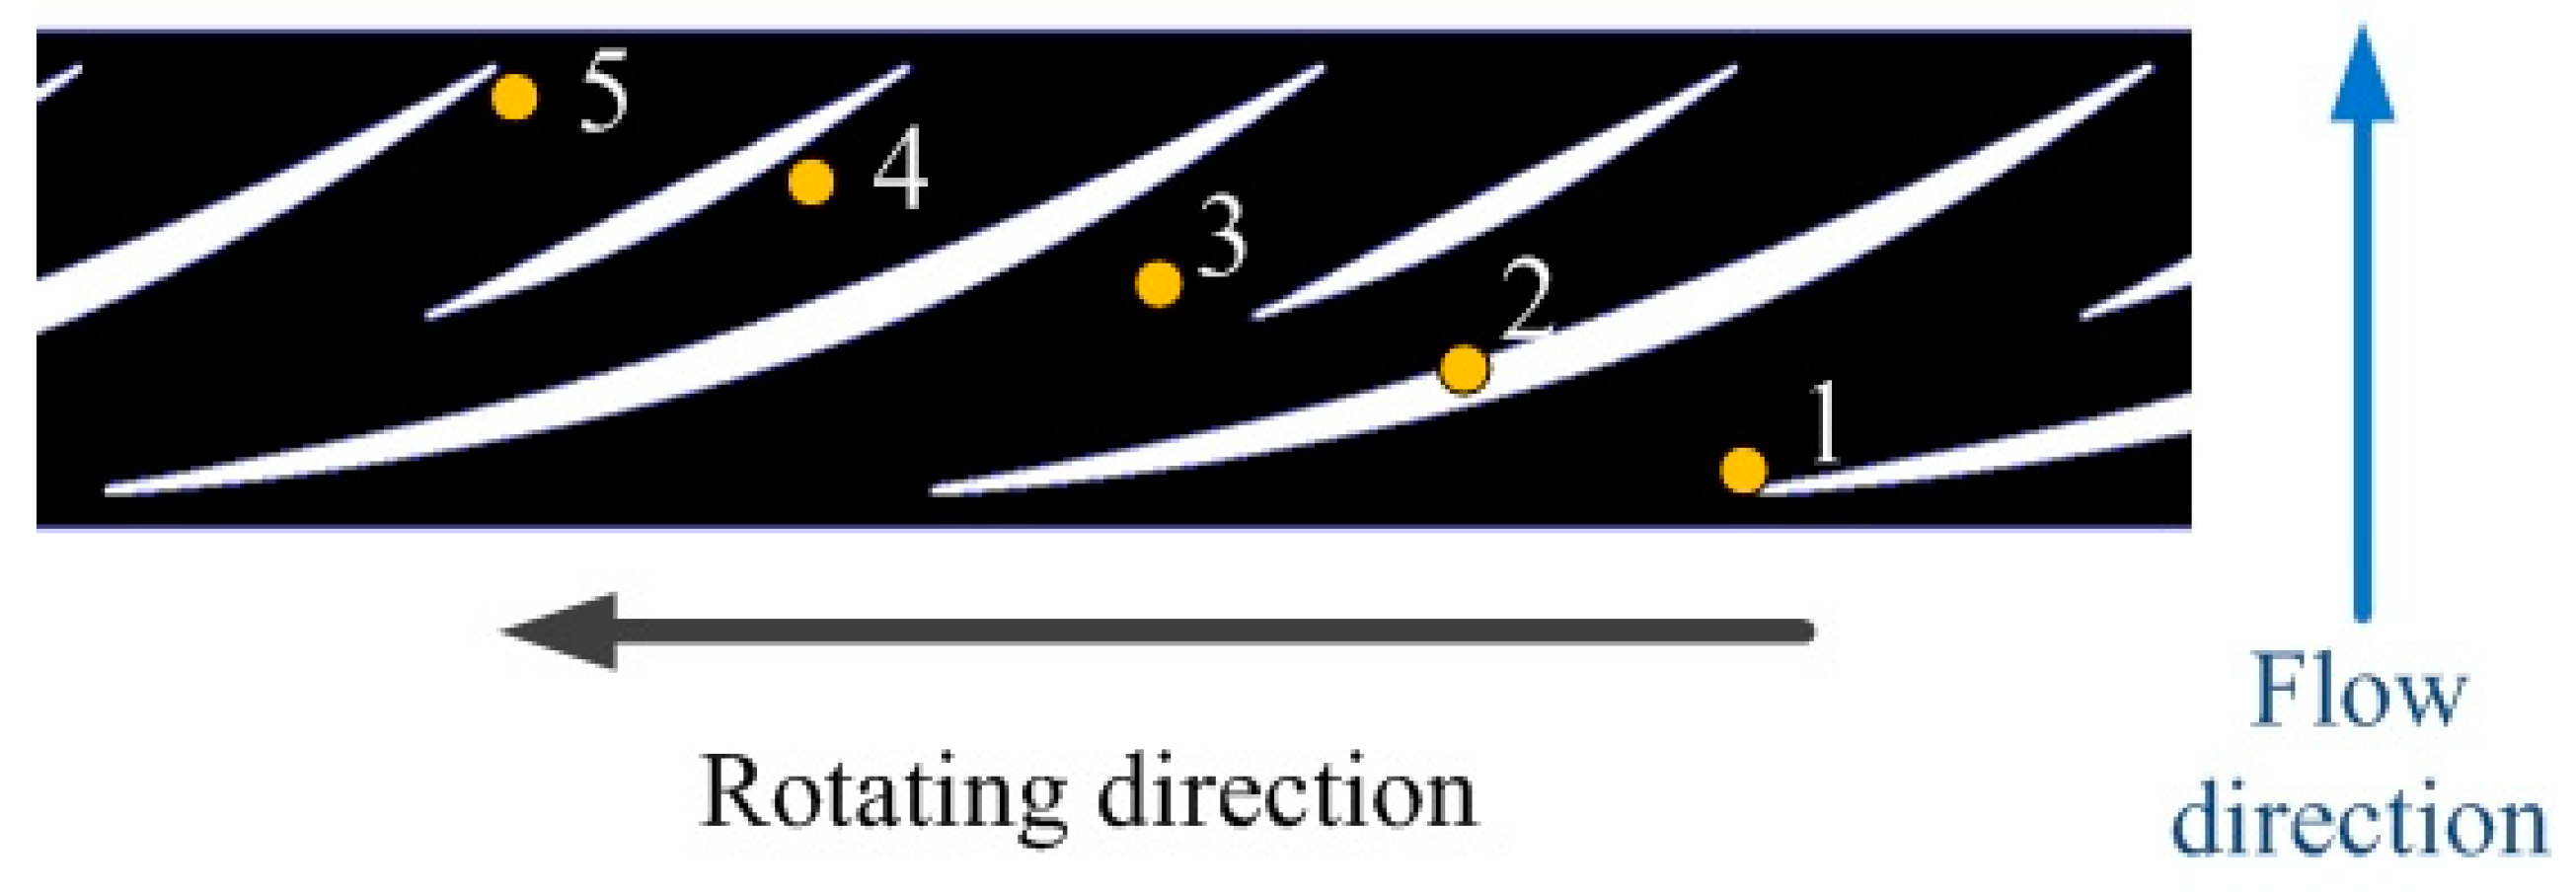
In order to monitor the detailed inner-flow condition of the multiphase pump, the pressure in the impeller section was monitored during the test. In different axial and circumferential positions, five pressure fluctuation sensors were set in the pump shell of the last stage impeller. In the axial direction, the five sensors were distributed uniformly from blade leading edge to trailing edge, and in a circumferential direction; the included angle of each two sensors was 40° in order for the sensors to be installed
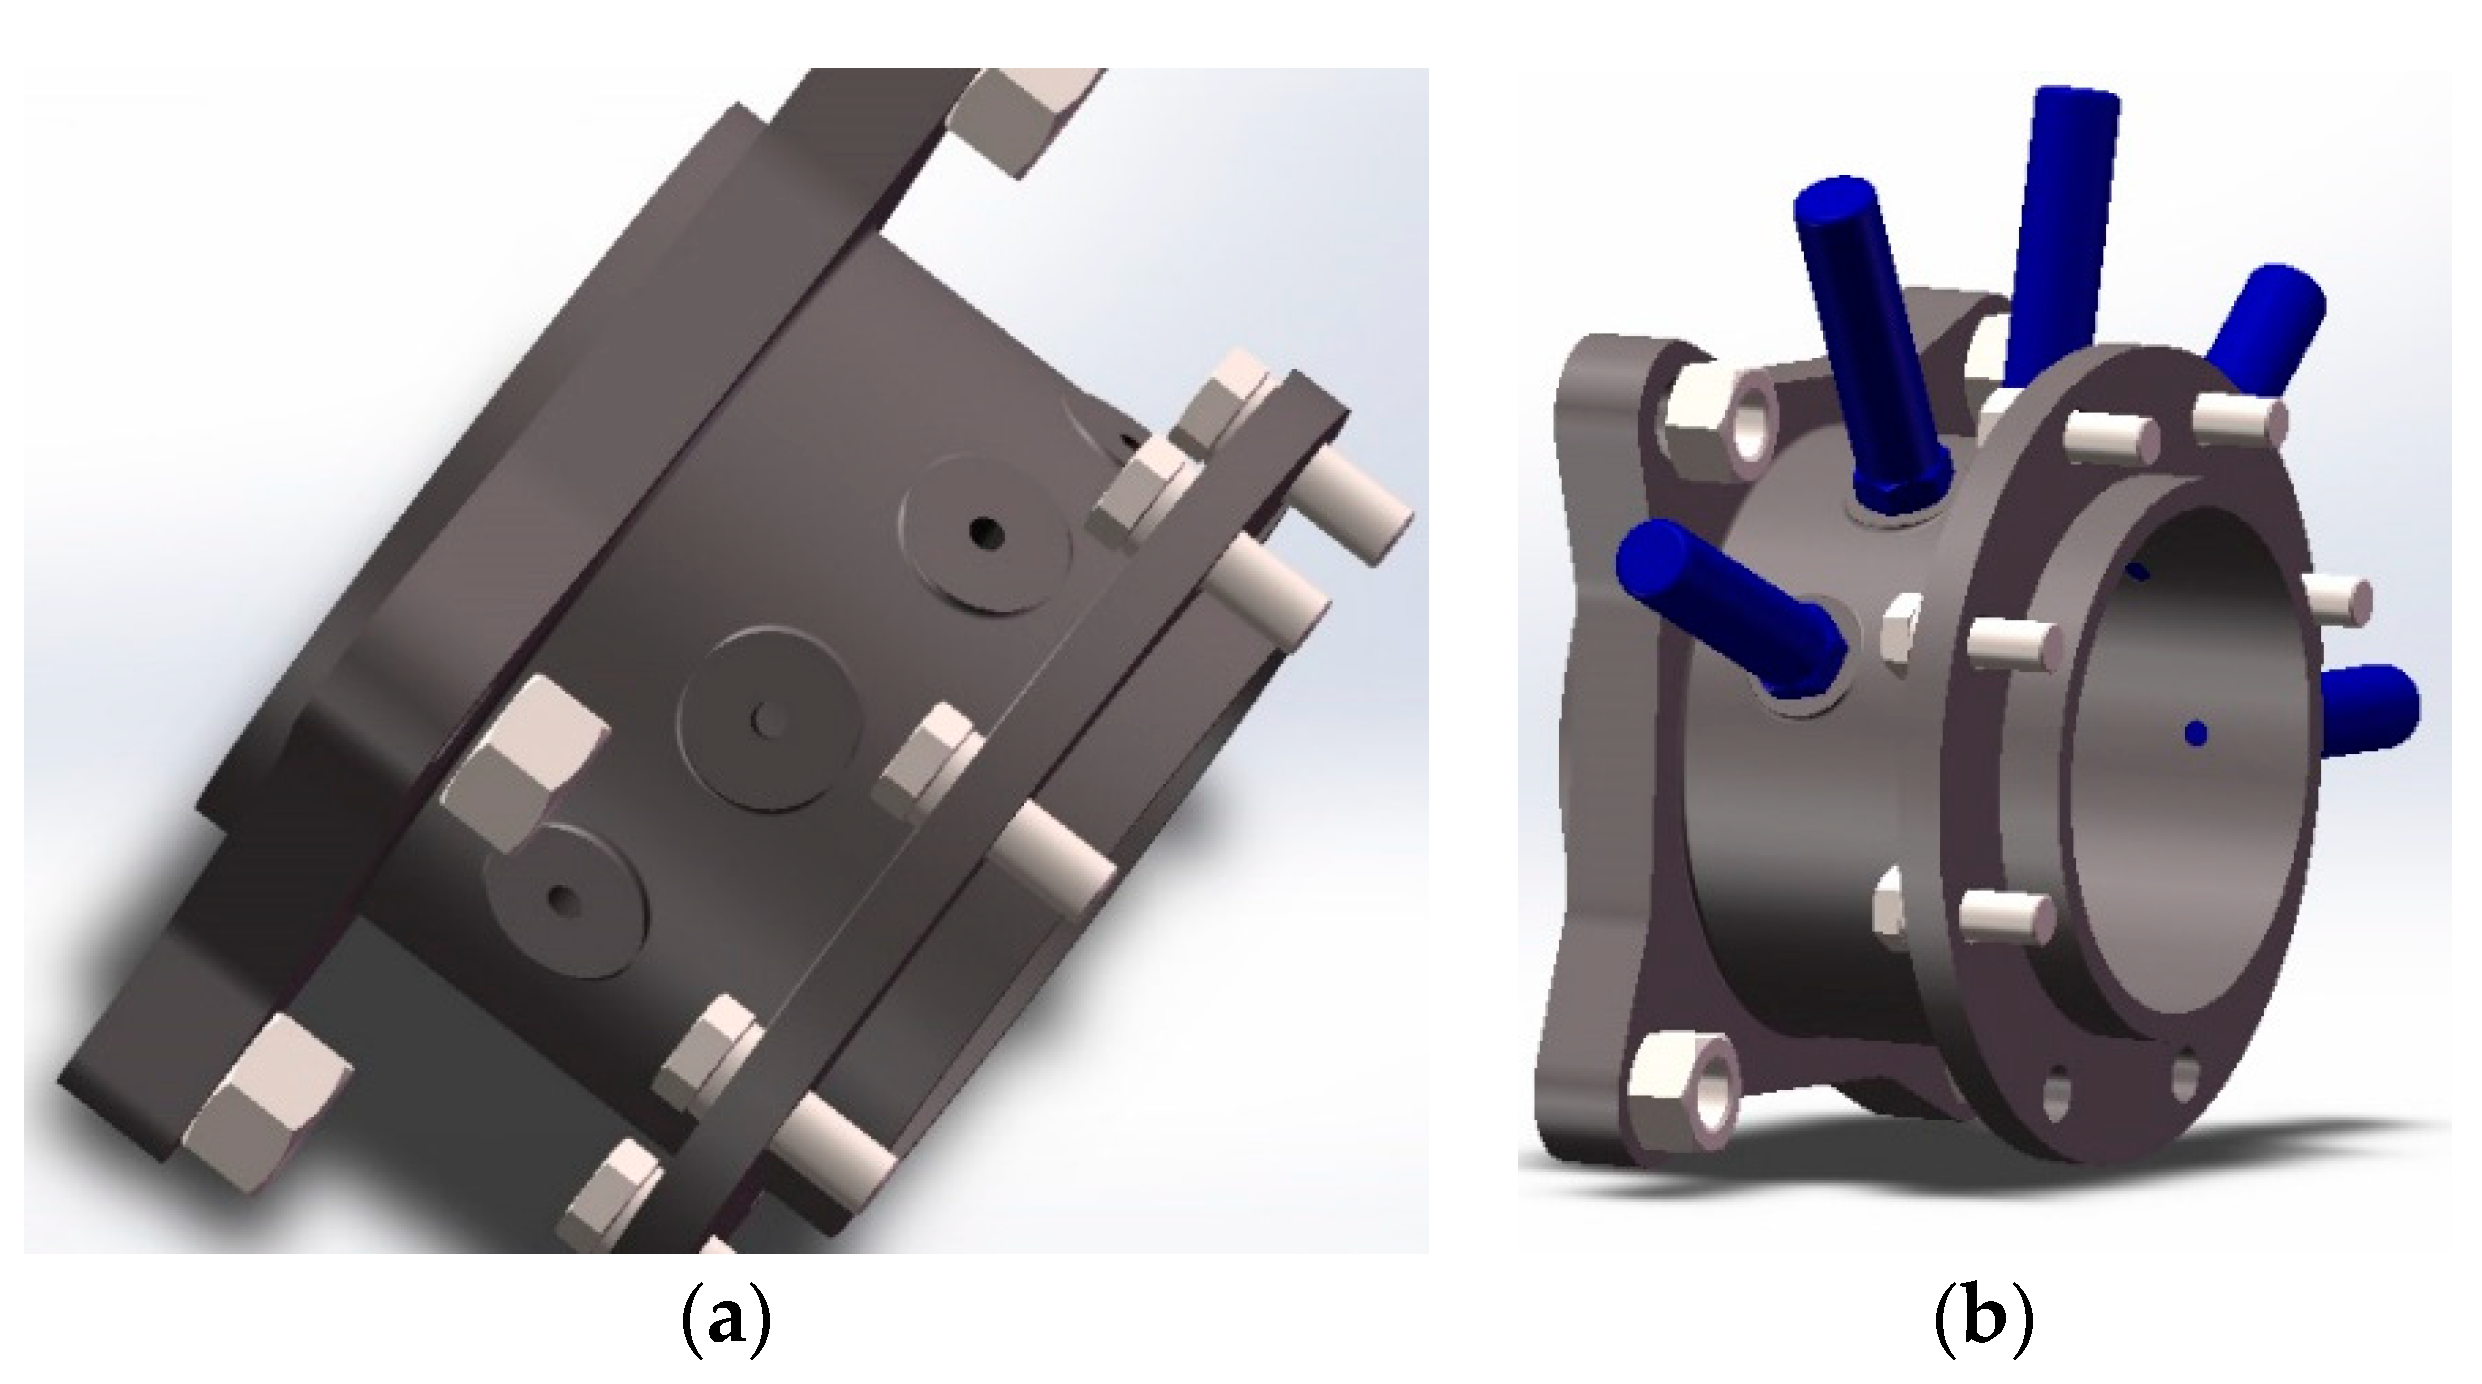
The installation of the pressure fluctuation sensors should be precise. For this reason, the installation holes are pre-designed in the structural diagram of the third stage pump shell, as shown in
Figure 4. The installation of the sensors is shown in
Figure 5.
In the test process, the pressure fluctuation sampling frequency was set to be 10.24 kHz and the sampling time was 30 s for one working condition. According to the sampling frequency and rotation speed, 208 points could be recorded in a revolution of impeller to capture the transient pressure of the pump passage.
3. Energy Performances of the Helico-Axial Pump Under Single-Phase and Multiphase Conditions
3.1. Single-Phase Performance
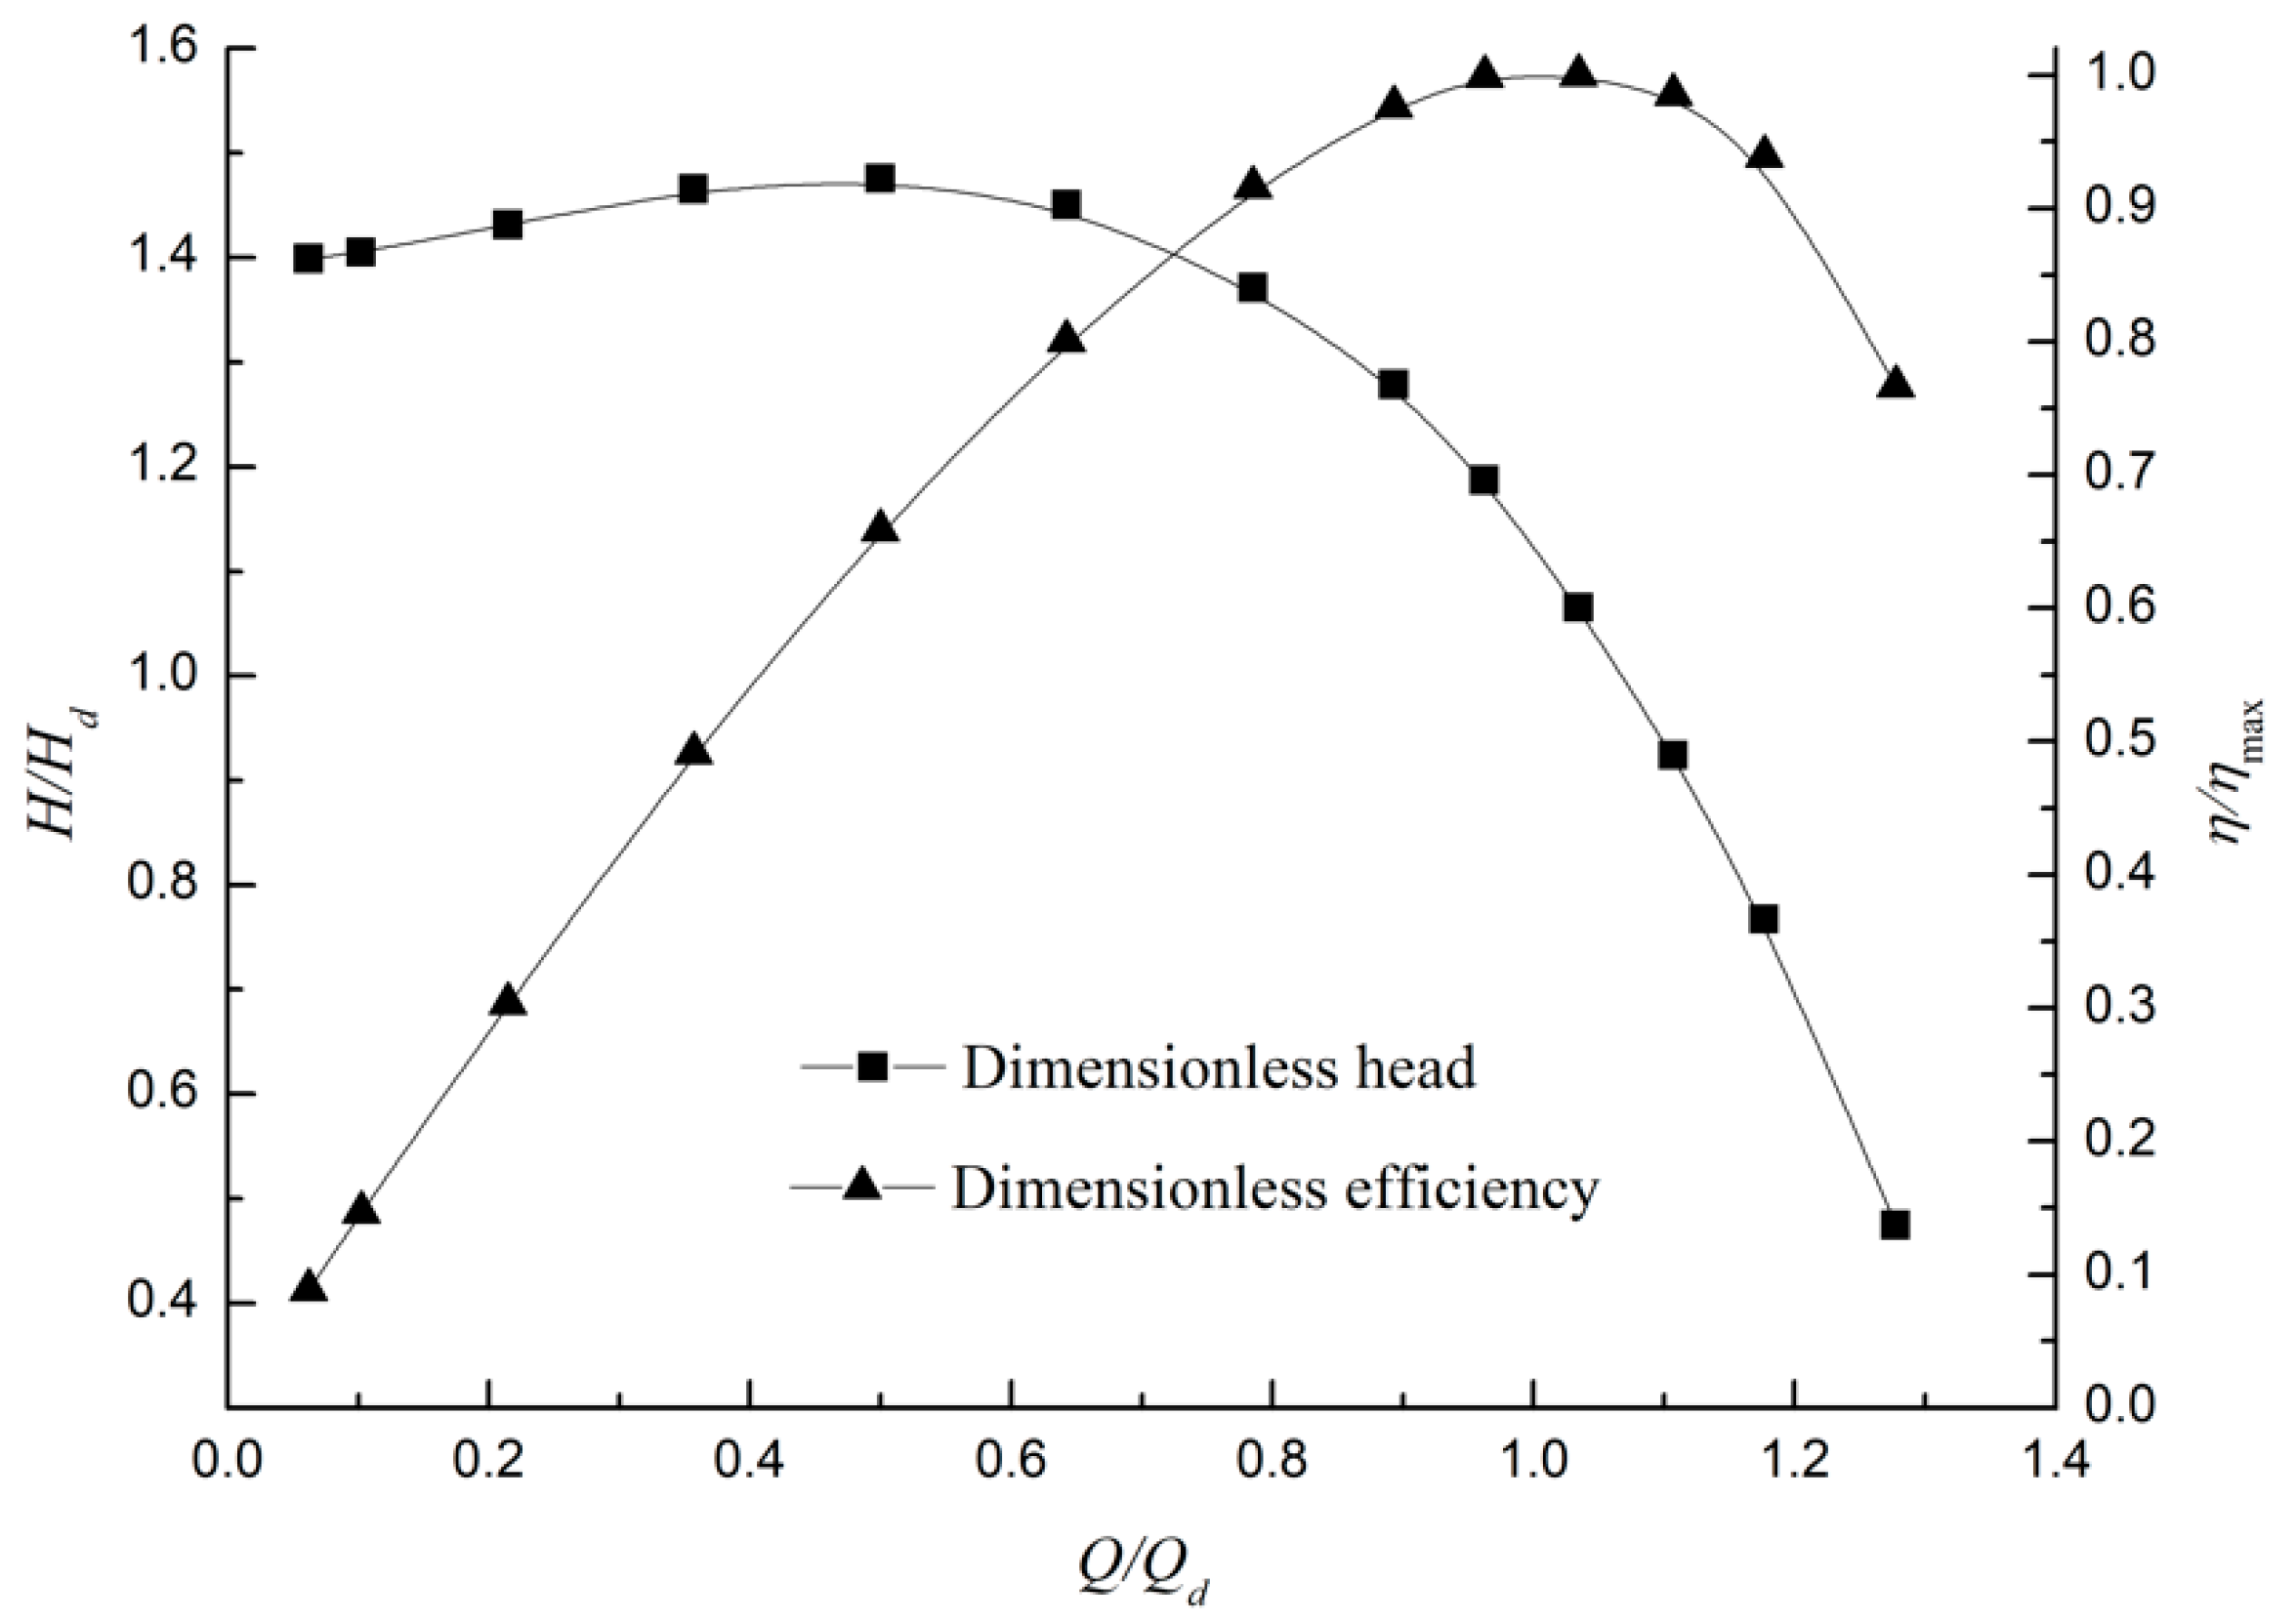
The single-phase performance is the basic characteristic of the helico-axial pump which could be tested without gas supplement system. The test results were processed according to Equations (3)–(5) and then nondimensionlized by the design flow rate Qd and design head Hd, and the efficiency curve was normalized by best efficiency value.
The pump performance curves are shown in
Figure 6. The pump has a working range from 0 to 1.3
Qd. The pump head under design flow rate is 1.1
Hd and the highest head is about 1.43
Hd under 0.5
Qd. The head curve shows a slight hump shape under partial load. The reason could be the relatively larger radius of pump shell which could lead to disorder under partial load. The best efficiency point is under the design flow rate, which means that the design of the pump is appropriate for the target.
3.2. Multiphase Performance
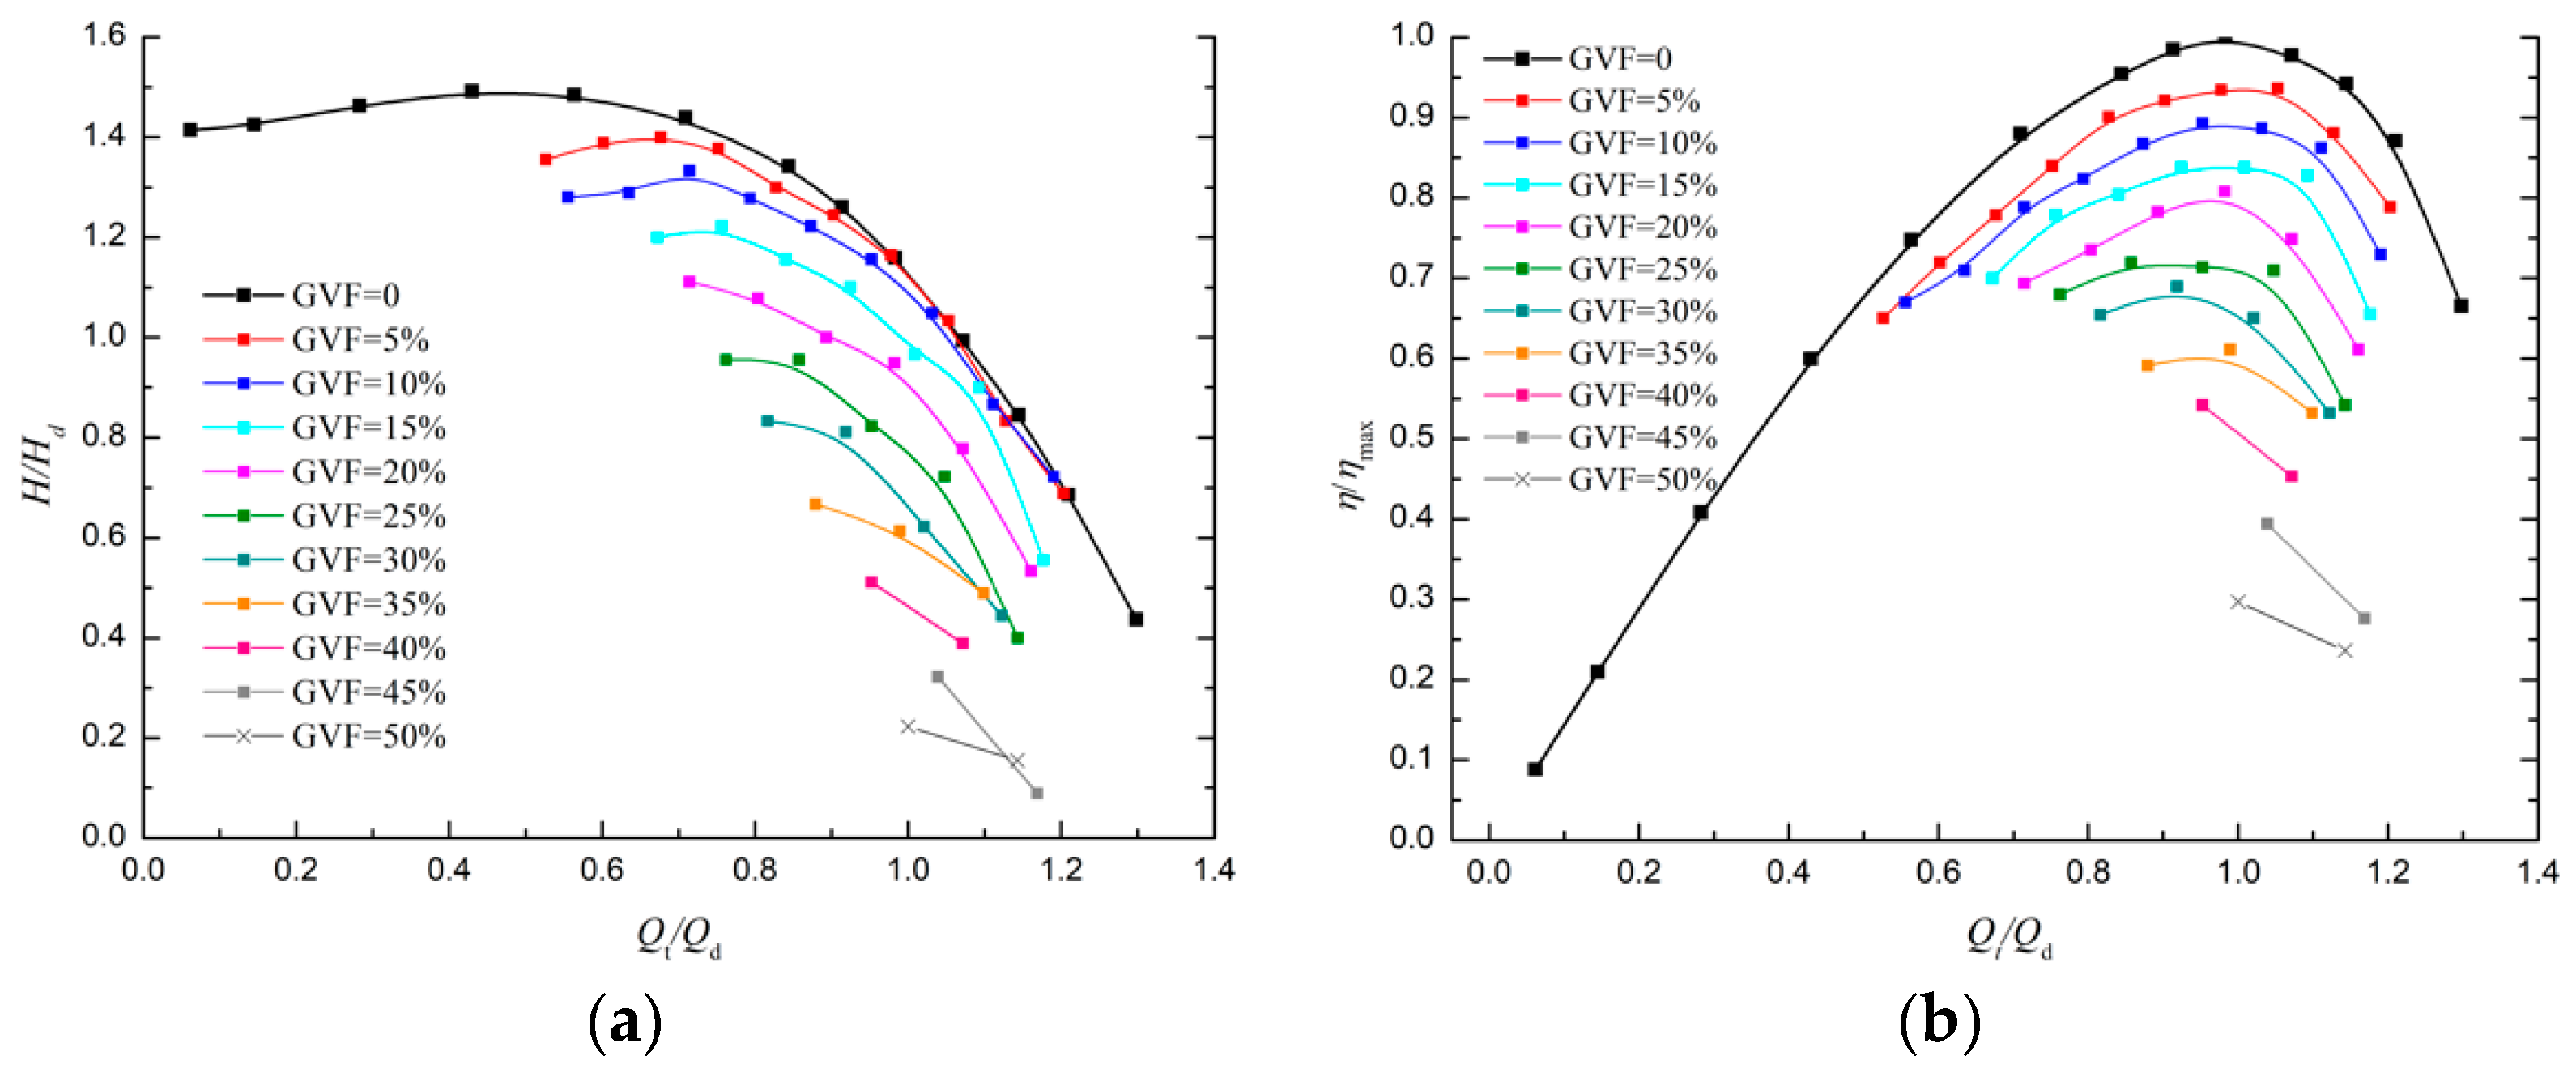
The multiphase performances could be concluded by GVF isolines, which could directly reflect the pumping capacity with different mixture. The head and efficiency curves are shown in
Figure 7 with the
x axis of dimensionless total flow rate.
During the multiphase test, the highest stable operation GVF was about 50% and the pump could sustain a momentary high GVF condition of 100%. As the GVF value increases, the performance gradually deteriorates. When the GVF is lower than 15%, the curve shape is similar with the single-phase condition, which may indicate a homogeneous mixing condition. When the GVF keeps increasing, the curves show a different tendency, which indicates the variation in the internal flow condition.
4. Transient Pressure Characteristics in the Helico-Axial Pump
The hydraulic performance is an external characteristic of the multiphase pump. Due to the existence of the gas phase, the inner-flow condition becomes more complicated. The distribution of the two phases would change as the change of flowrates, pressure condition and some irregular flow structure would emerge. The transient pressure field is one of the most important and direct descriptions of the state of inner-flow situation.
To monitor pressure fluctuation in the test, the transient pressure conditions of the five monitoring points were recorded. Based on the sampling frequency of 10.24 kHz and sampling time of 30 s, there are more than 300,000 pressure values for each monitoring point in a given working condition. The enormous data makes it almost impossible to analyze the pressure condition directly.
For this reason, the Fast Fourier Transform (FFT) Algorithm is used to analyze the transient pressure. The Fast Fourier Transform is an algorithm that samples a signal over a period of time (or space) and divides it into its frequency components. These components are single sinusoidal oscillations at distinct frequencies with their own amplitude and phase. By using the FFT algorithm, the pressure characteristics of different working conditions and different monitoring positions could be obtained. Some detailed description and the settings of FFT algorithm in the present research are listed in
Appendix B.
4.1. Spectral Analysis on the Single-Phase Conditions
The main controlled variable in the single-phase condition is the liquid flow rate. This analysis looks at three different flow rate conditions: partial load with 0.8
Qd, design flow rate
Qd, and the overload condition 1.2
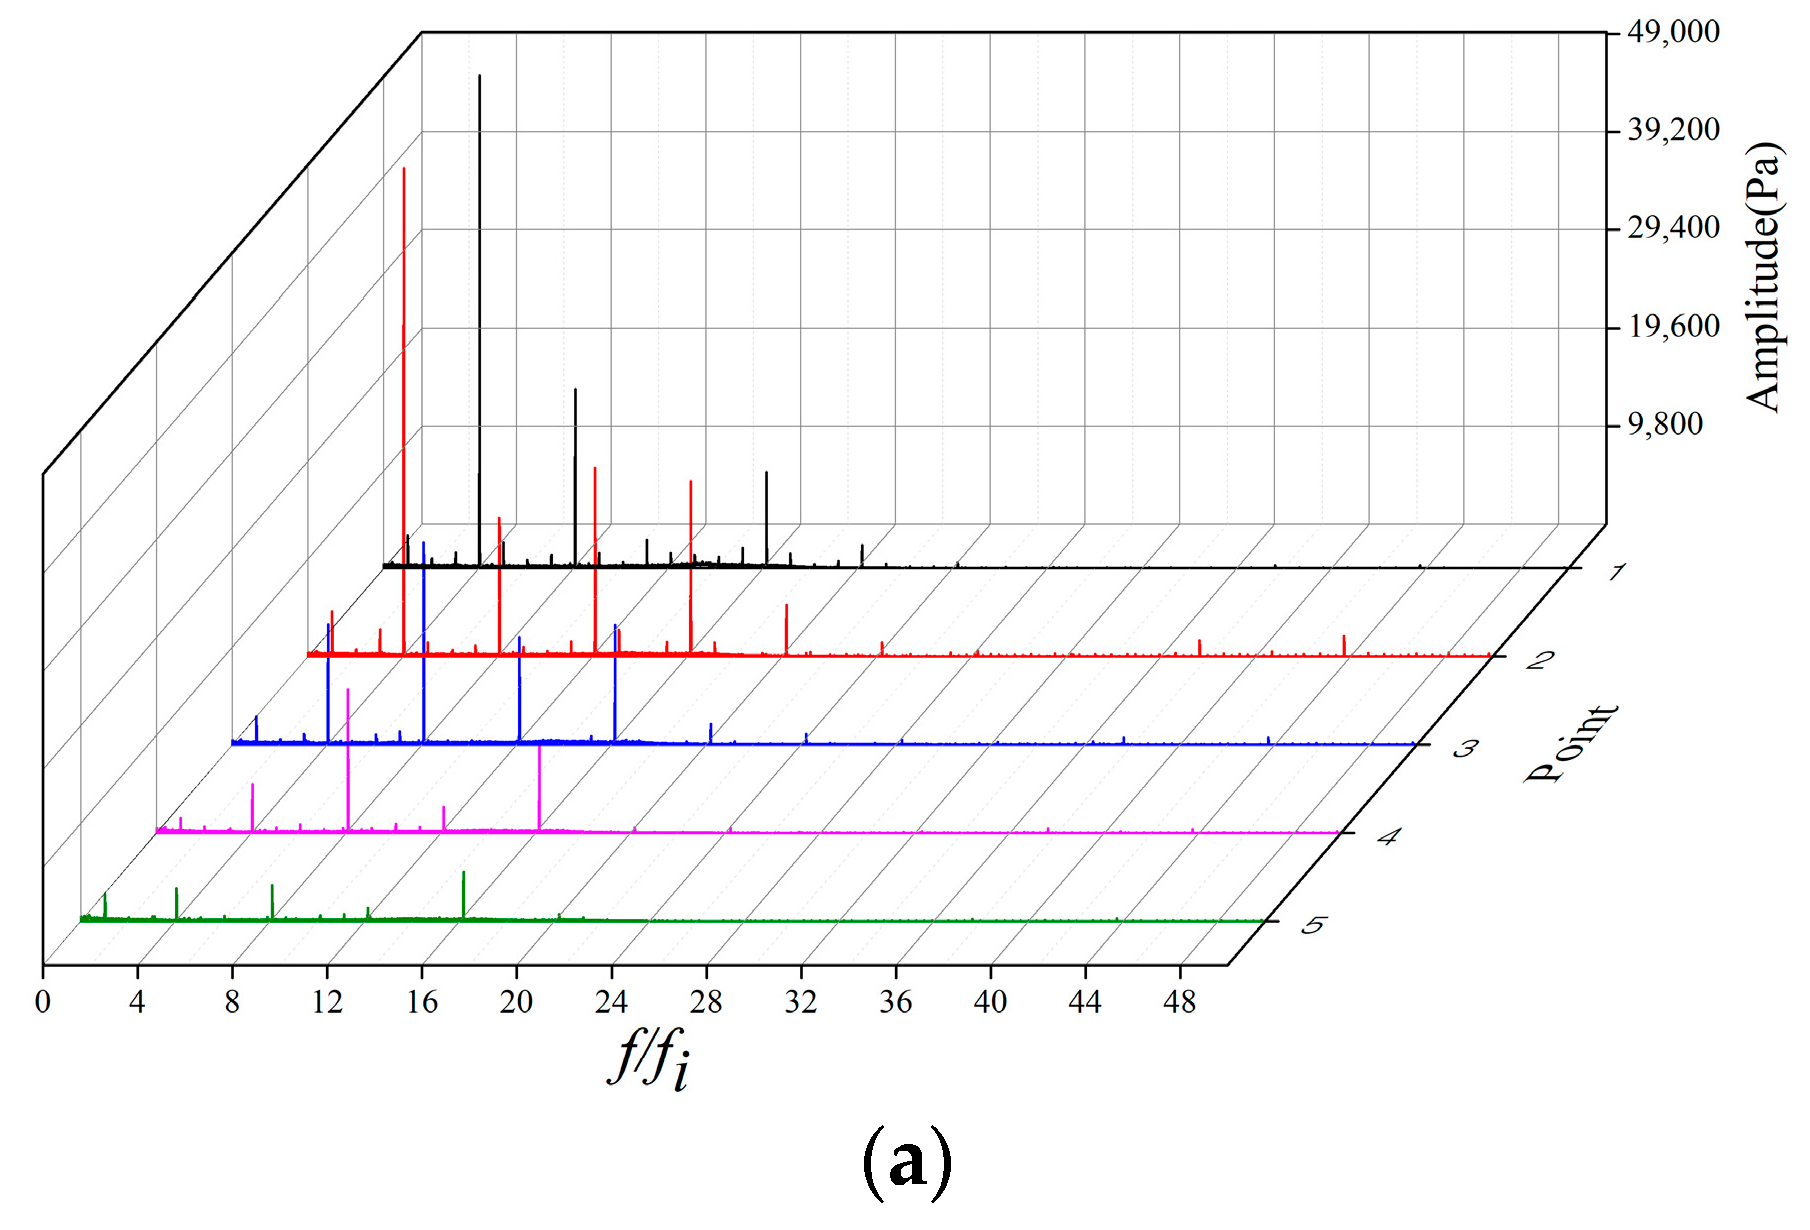
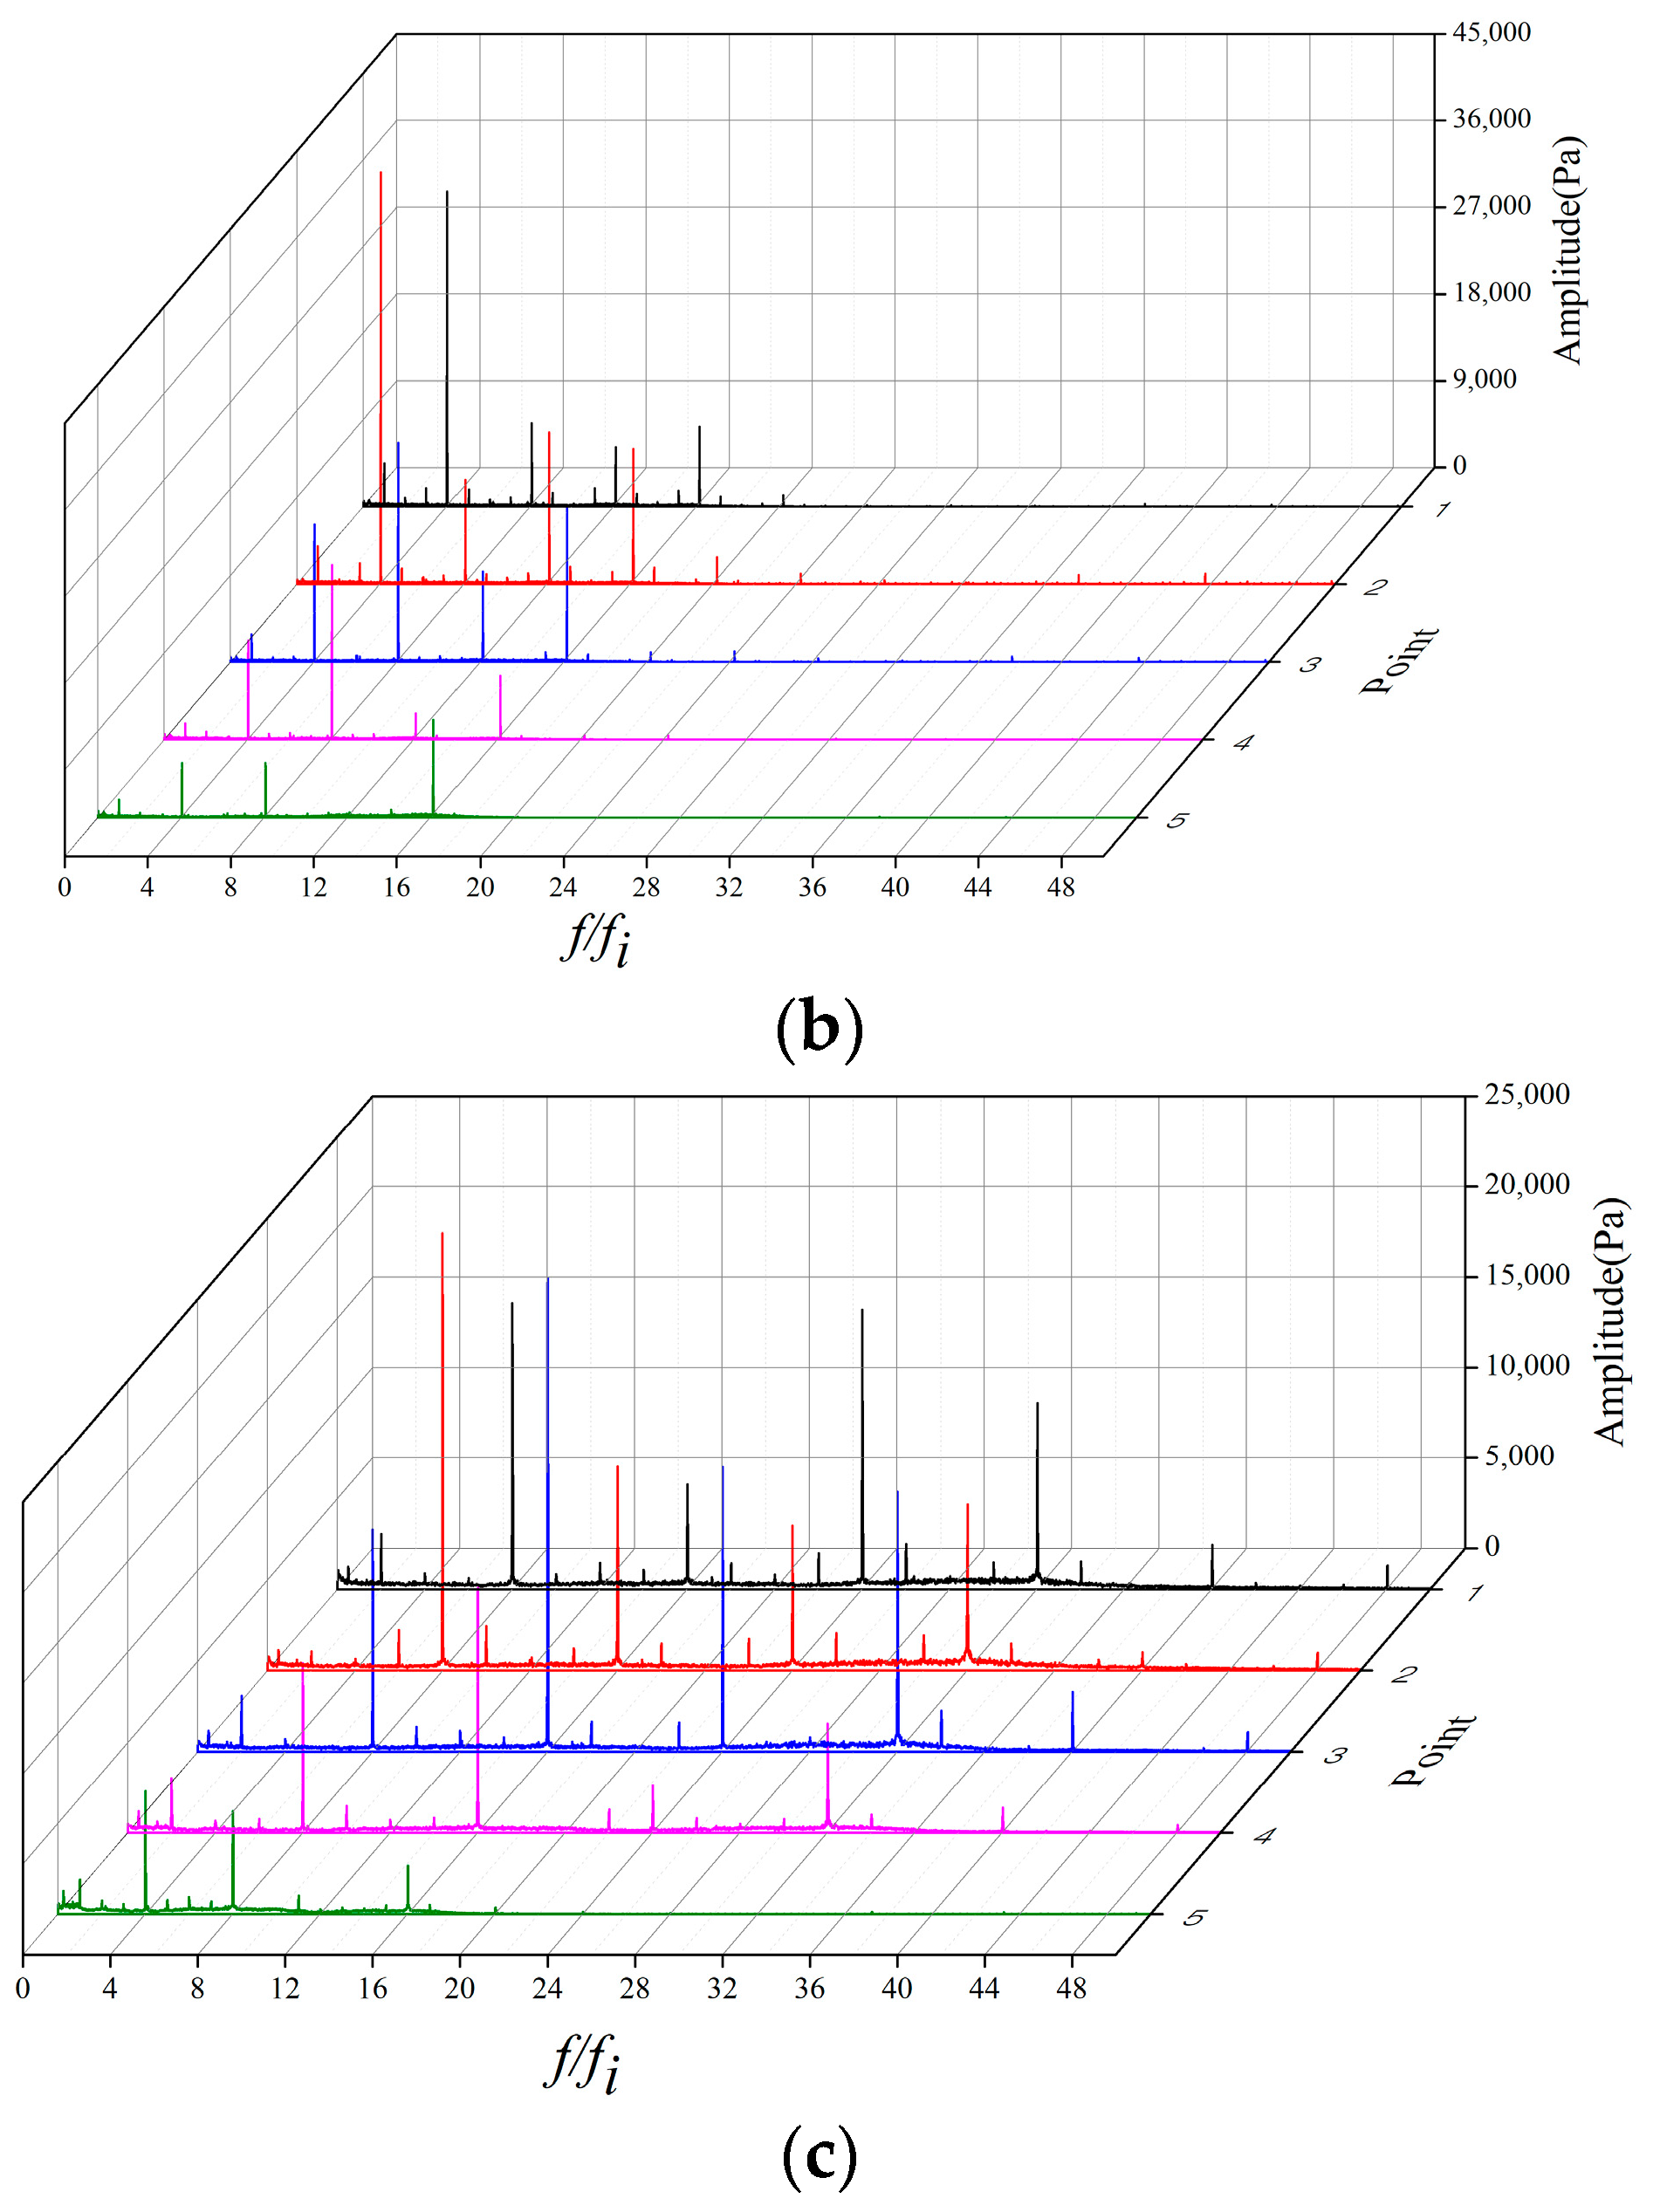
Qd were selected as the representative working conditions to investigate the spectral characteristics of the helico-axial pump. The spectral diagrams are shown as
Figure 8 with the
x axis nondimensionlized by impeller rotation frequency
fi.
From the FFT analysis, some general regulations and special characteristics under different flow rates are revealed. The most clear and common regulation is that the fluctuation amplitude peaks appear at multiples of the impeller rotation frequency fi, which could be calculated as rotating revolution per minute. The dominant frequency values reflect that the main fluctuation in the impeller is caused by the regular rotation. The two points, P1 and P2, near impeller inlet have dominant frequency of 4 fi and 8 fi in most conditions and the three latter points, P3 to P5, mainly show a fluctuation of 8 fi and 16 fi. This phenomenon agrees with the structure of the impeller: four main blades at inlet and eight blades (main blades and splitter blades) at outlet. In conclusion, the blade passing frequency fBPF, calculated as the product of rotation frequency and blade number, is the main pressure pulsation frequency source, and the maximum fluctuation amplitude appears at fBPF and 2 fBPF under the different flow rate conditions.
The spectral analysis also shows that when the flow rate increases, the fluctuations under 2 fBPF and higher multiples of rotation frequency tend to be intensified. The high-frequency fluctuation under larger flow rates may be stimulated by the attack of the flow to the flow components.
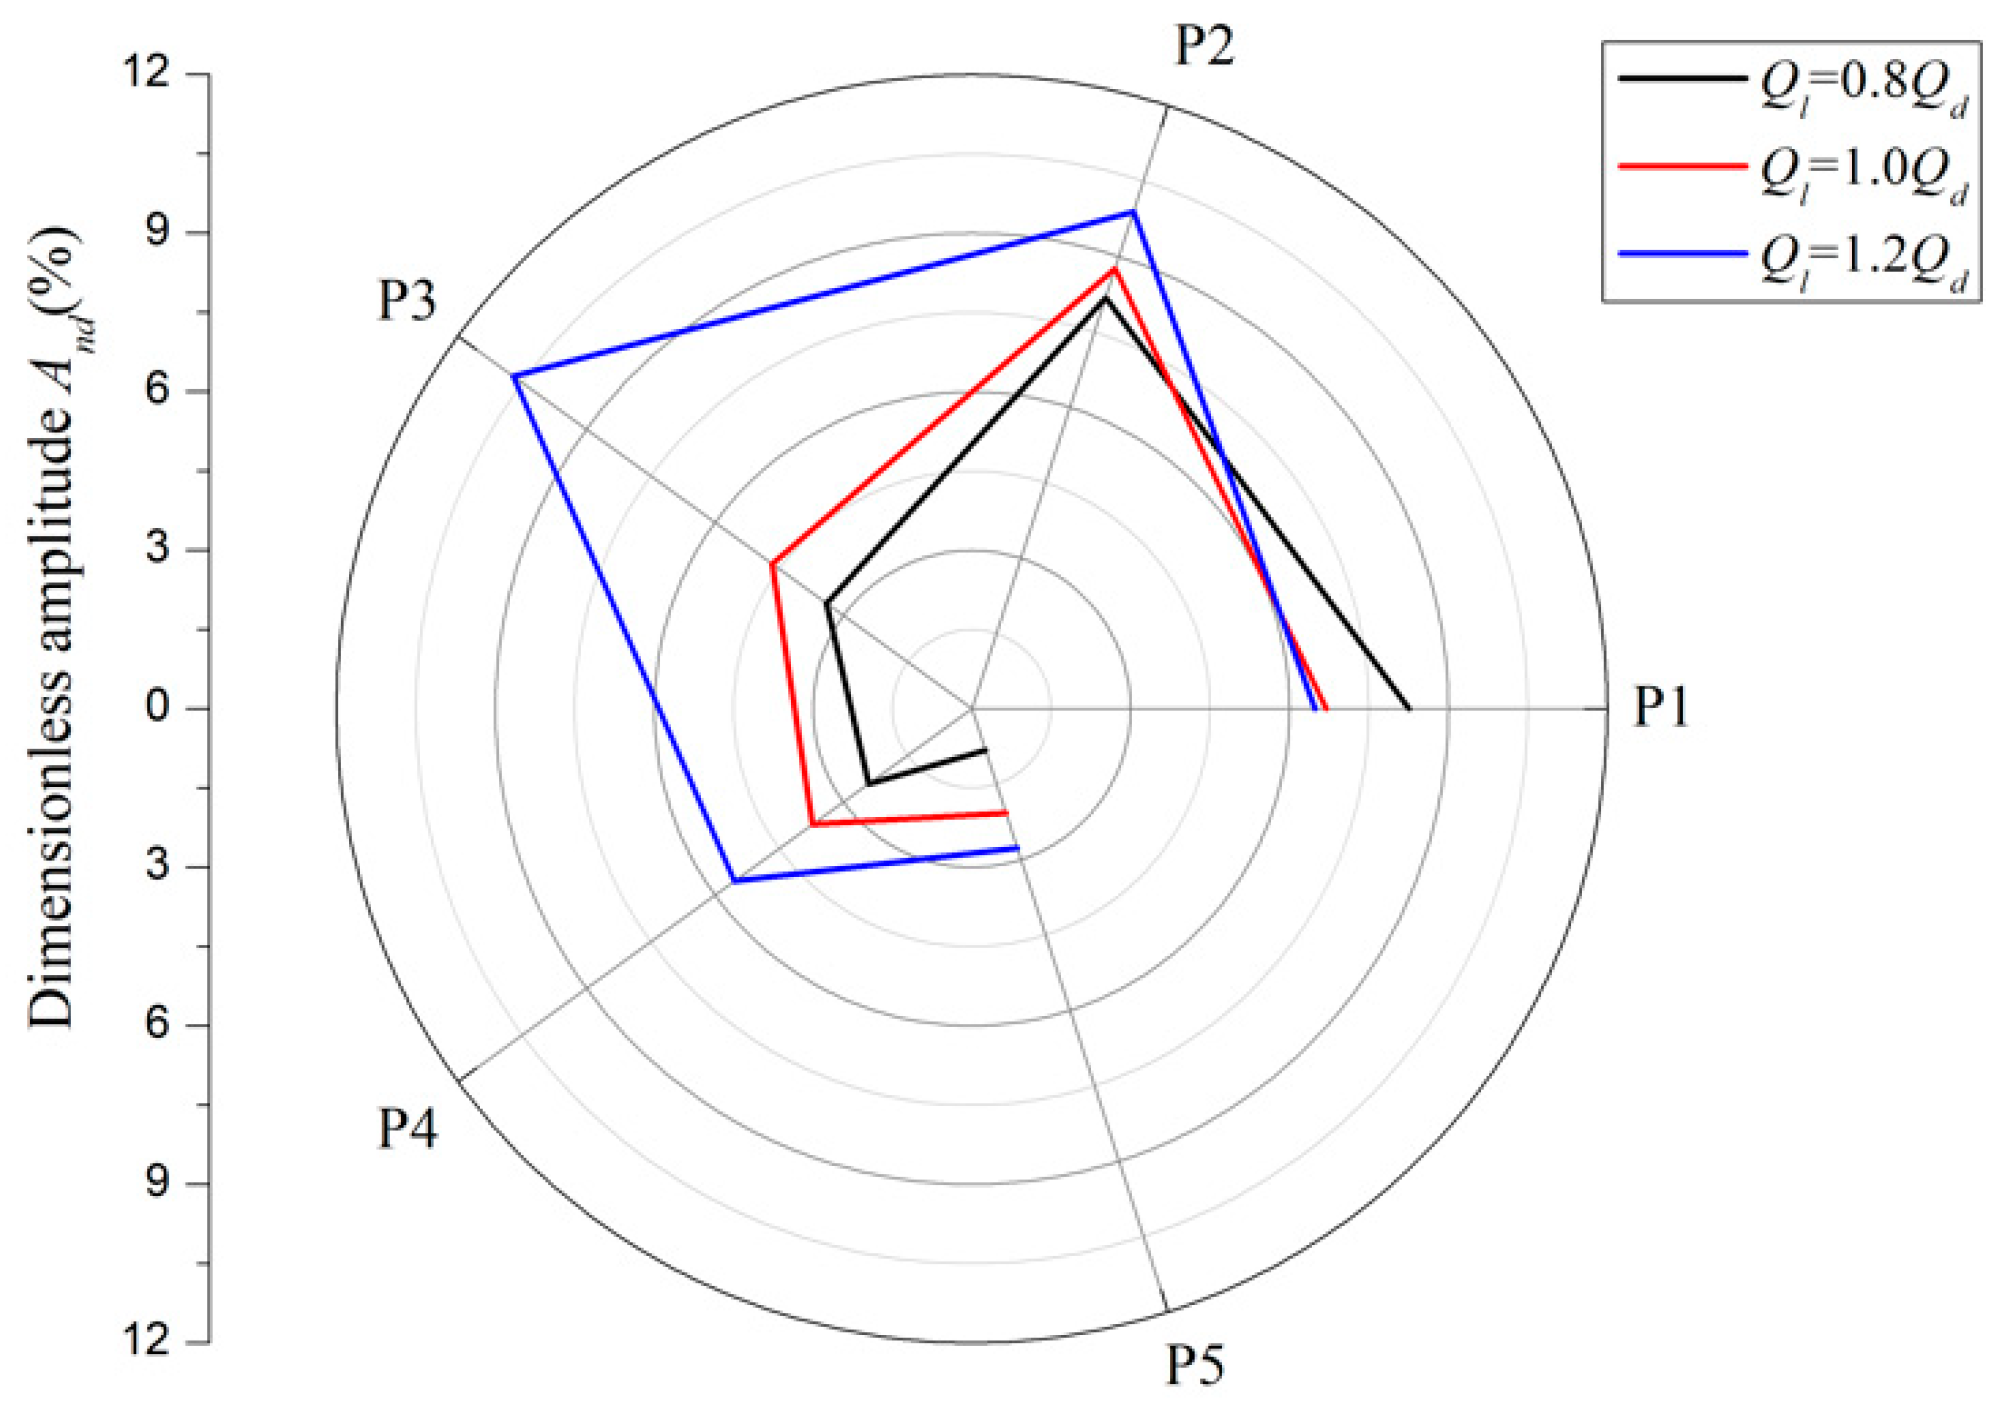
The pressure fluctuation amplitude is highly related to the pressure level in the whole passage, and the pressure level is related to the inlet pressure (which is similar in all the conditions) and the head in the corresponding condition. In order to compare the amplitude level in different working conditions, the pump head, which corresponds to the pressure rise in the pump section, is selected as the baseline. The dimensionless amplitude
And is calculated as follows:
where
A is the amplitude of the certain frequency,
ρ is the density of the working medium,
g is the gravity acceleration and
H is the corresponding pump head under the certain flow rate.
Figure 9 shows the dimensionless amplitude values of different points in the three flow rates. The total amplitude level of 1.2
Qd is higher than the others. Under partial load of 0.8
Qd, the highest amplitude appears at the impeller inlet, which indicates that the inner-flow pattern is nonuniform with backflow and flow separation. For the design flow rate, the pressure fluctuations of the five points are relatively even: the highest value appears at the first two points, and after the flow enters the splitter-blade region, the fluctuation is restrained. The fluctuation distribution under 1.2
Qd has many more differences from the other two flow rates. The fluctuation amplitude keeps increasing from the inlet and maximizes at the point P3. P3 is set near the leading edge of the splitter blade, so the increase of P3 fluctuation amplitude indicates that there are some uneven flow structures or flow impacts at the inlet of the splitter blades. The reason for the phenomenon could be the sudden decreasing of passing area, which is caused by the increase of blade number.
4.2. Spectral Analysis on the Multiphase Conditions
In order to investigate the inner-flow patterns and the pressure fluctuations in the multiphase flow conditions, and to reveal the differences between different GVF conditions, the test points with the total flow rate equal to
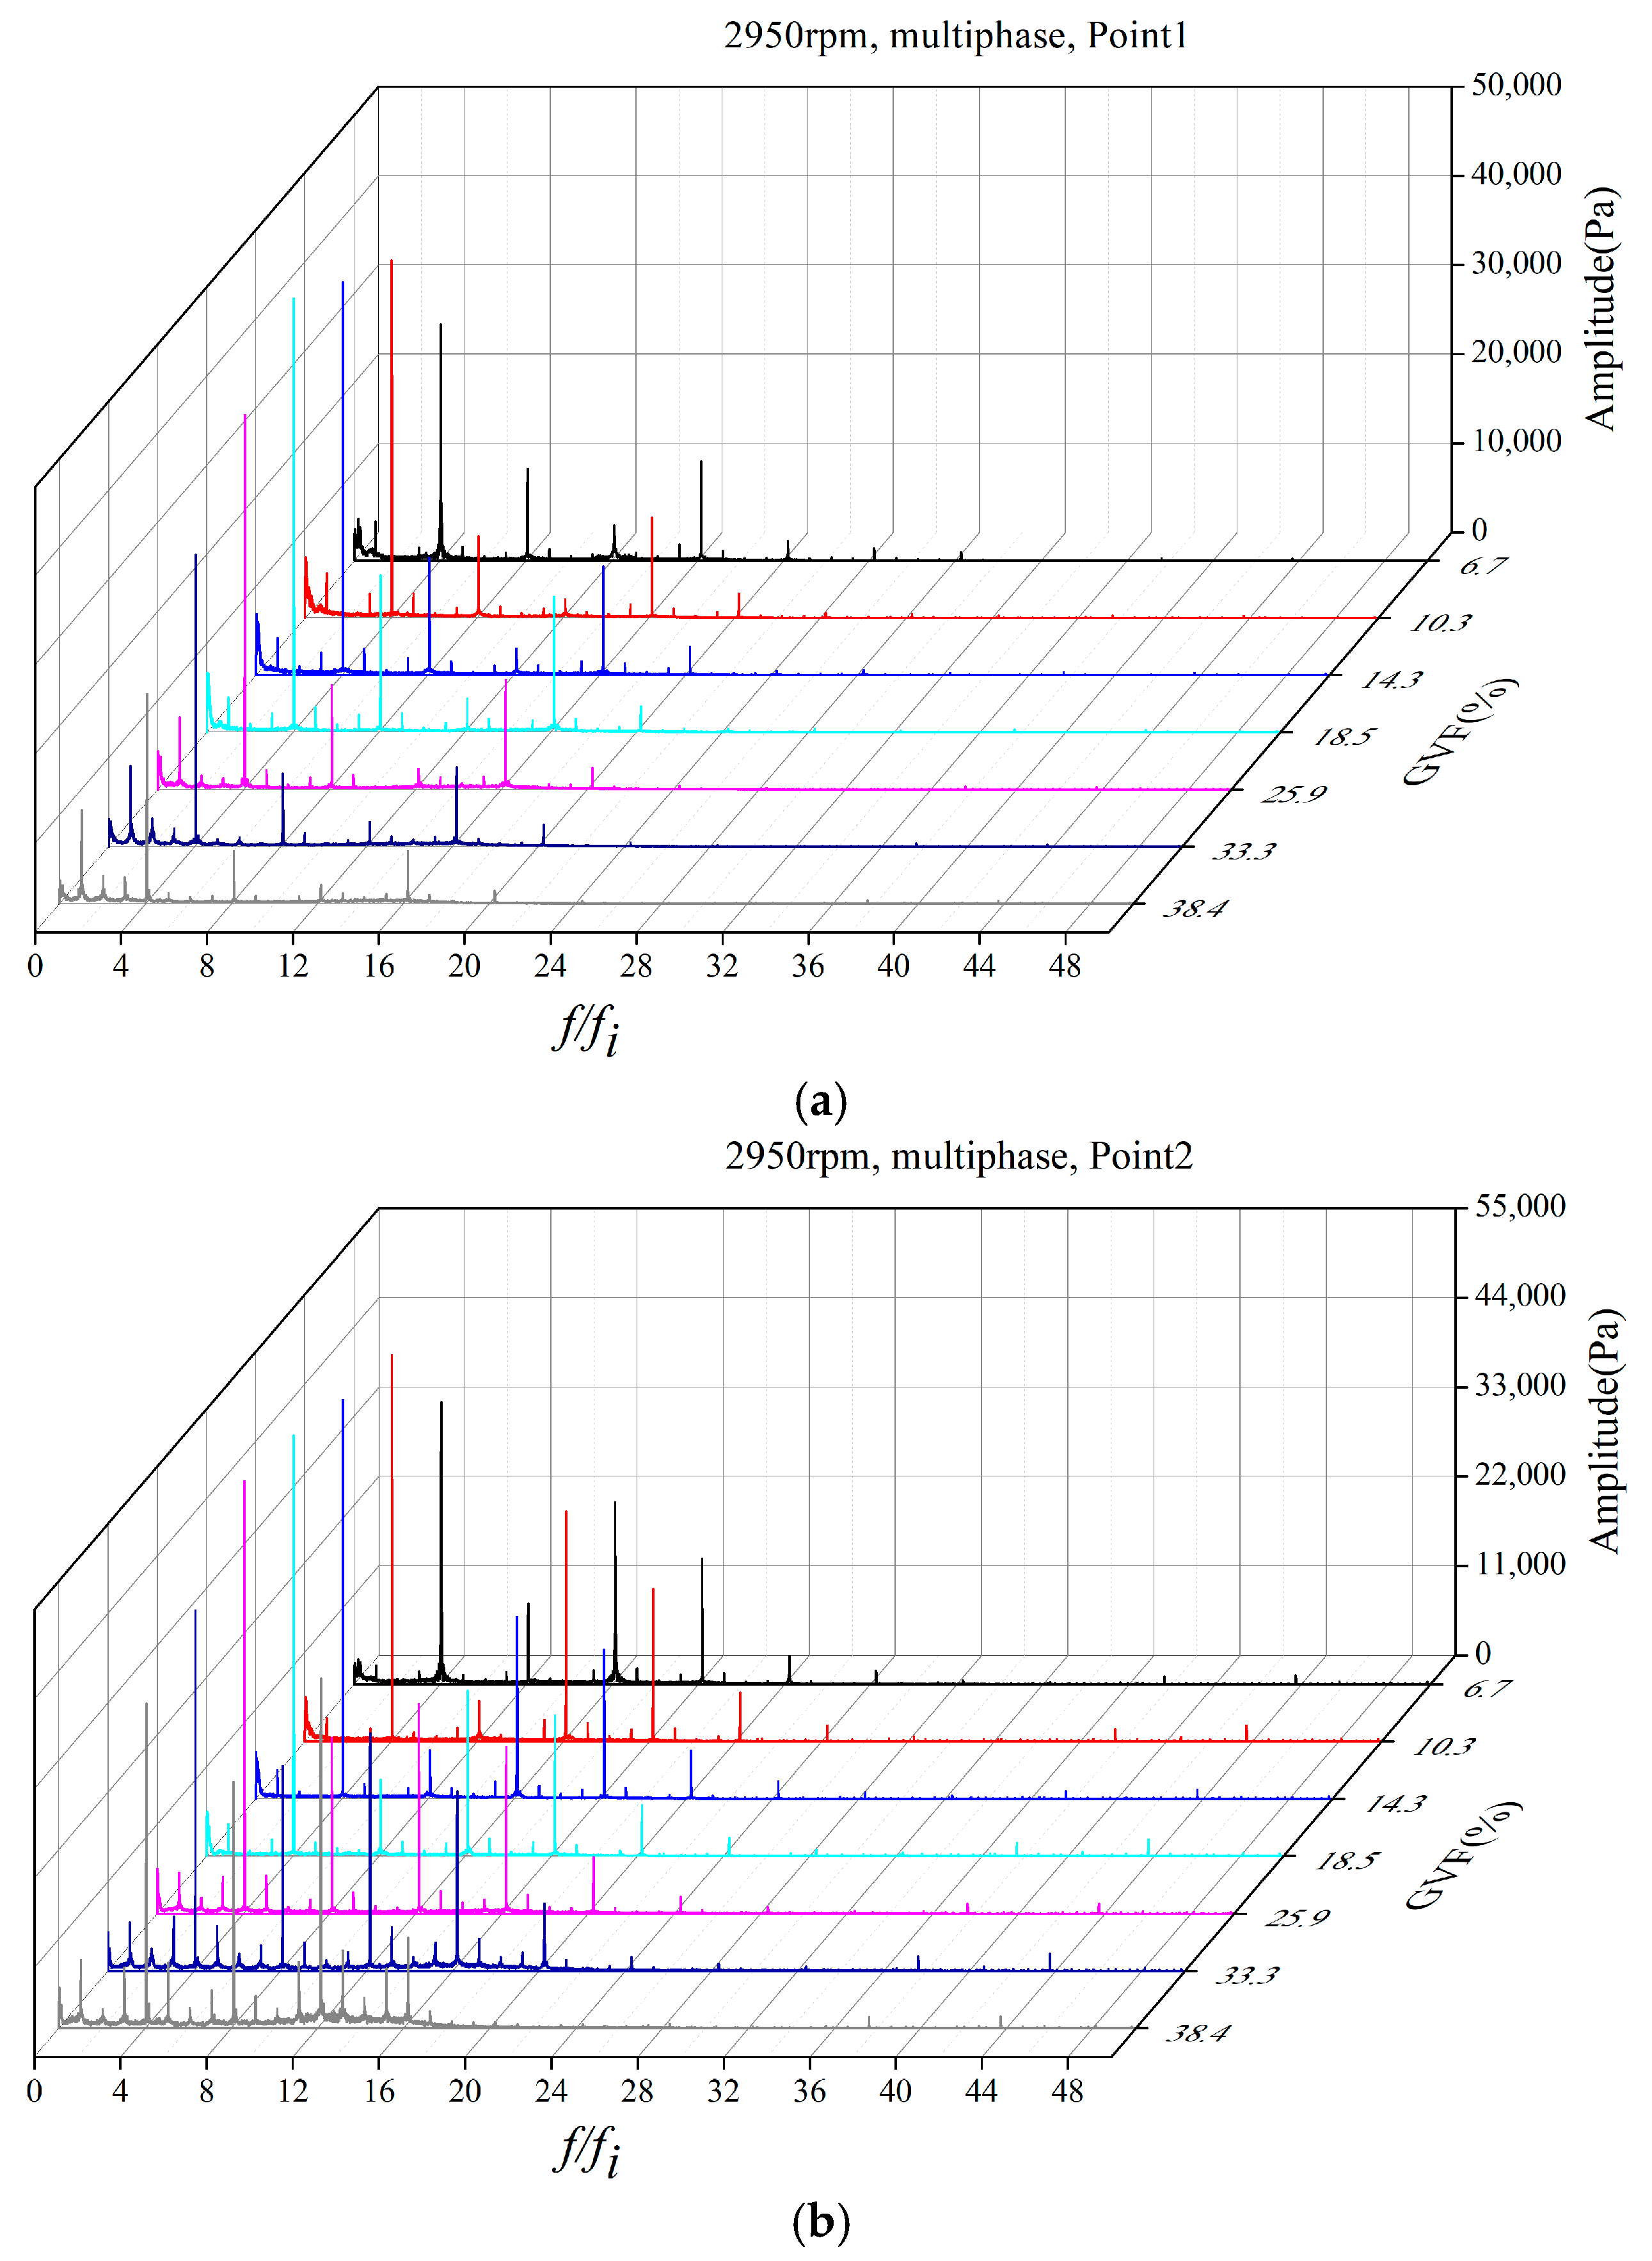
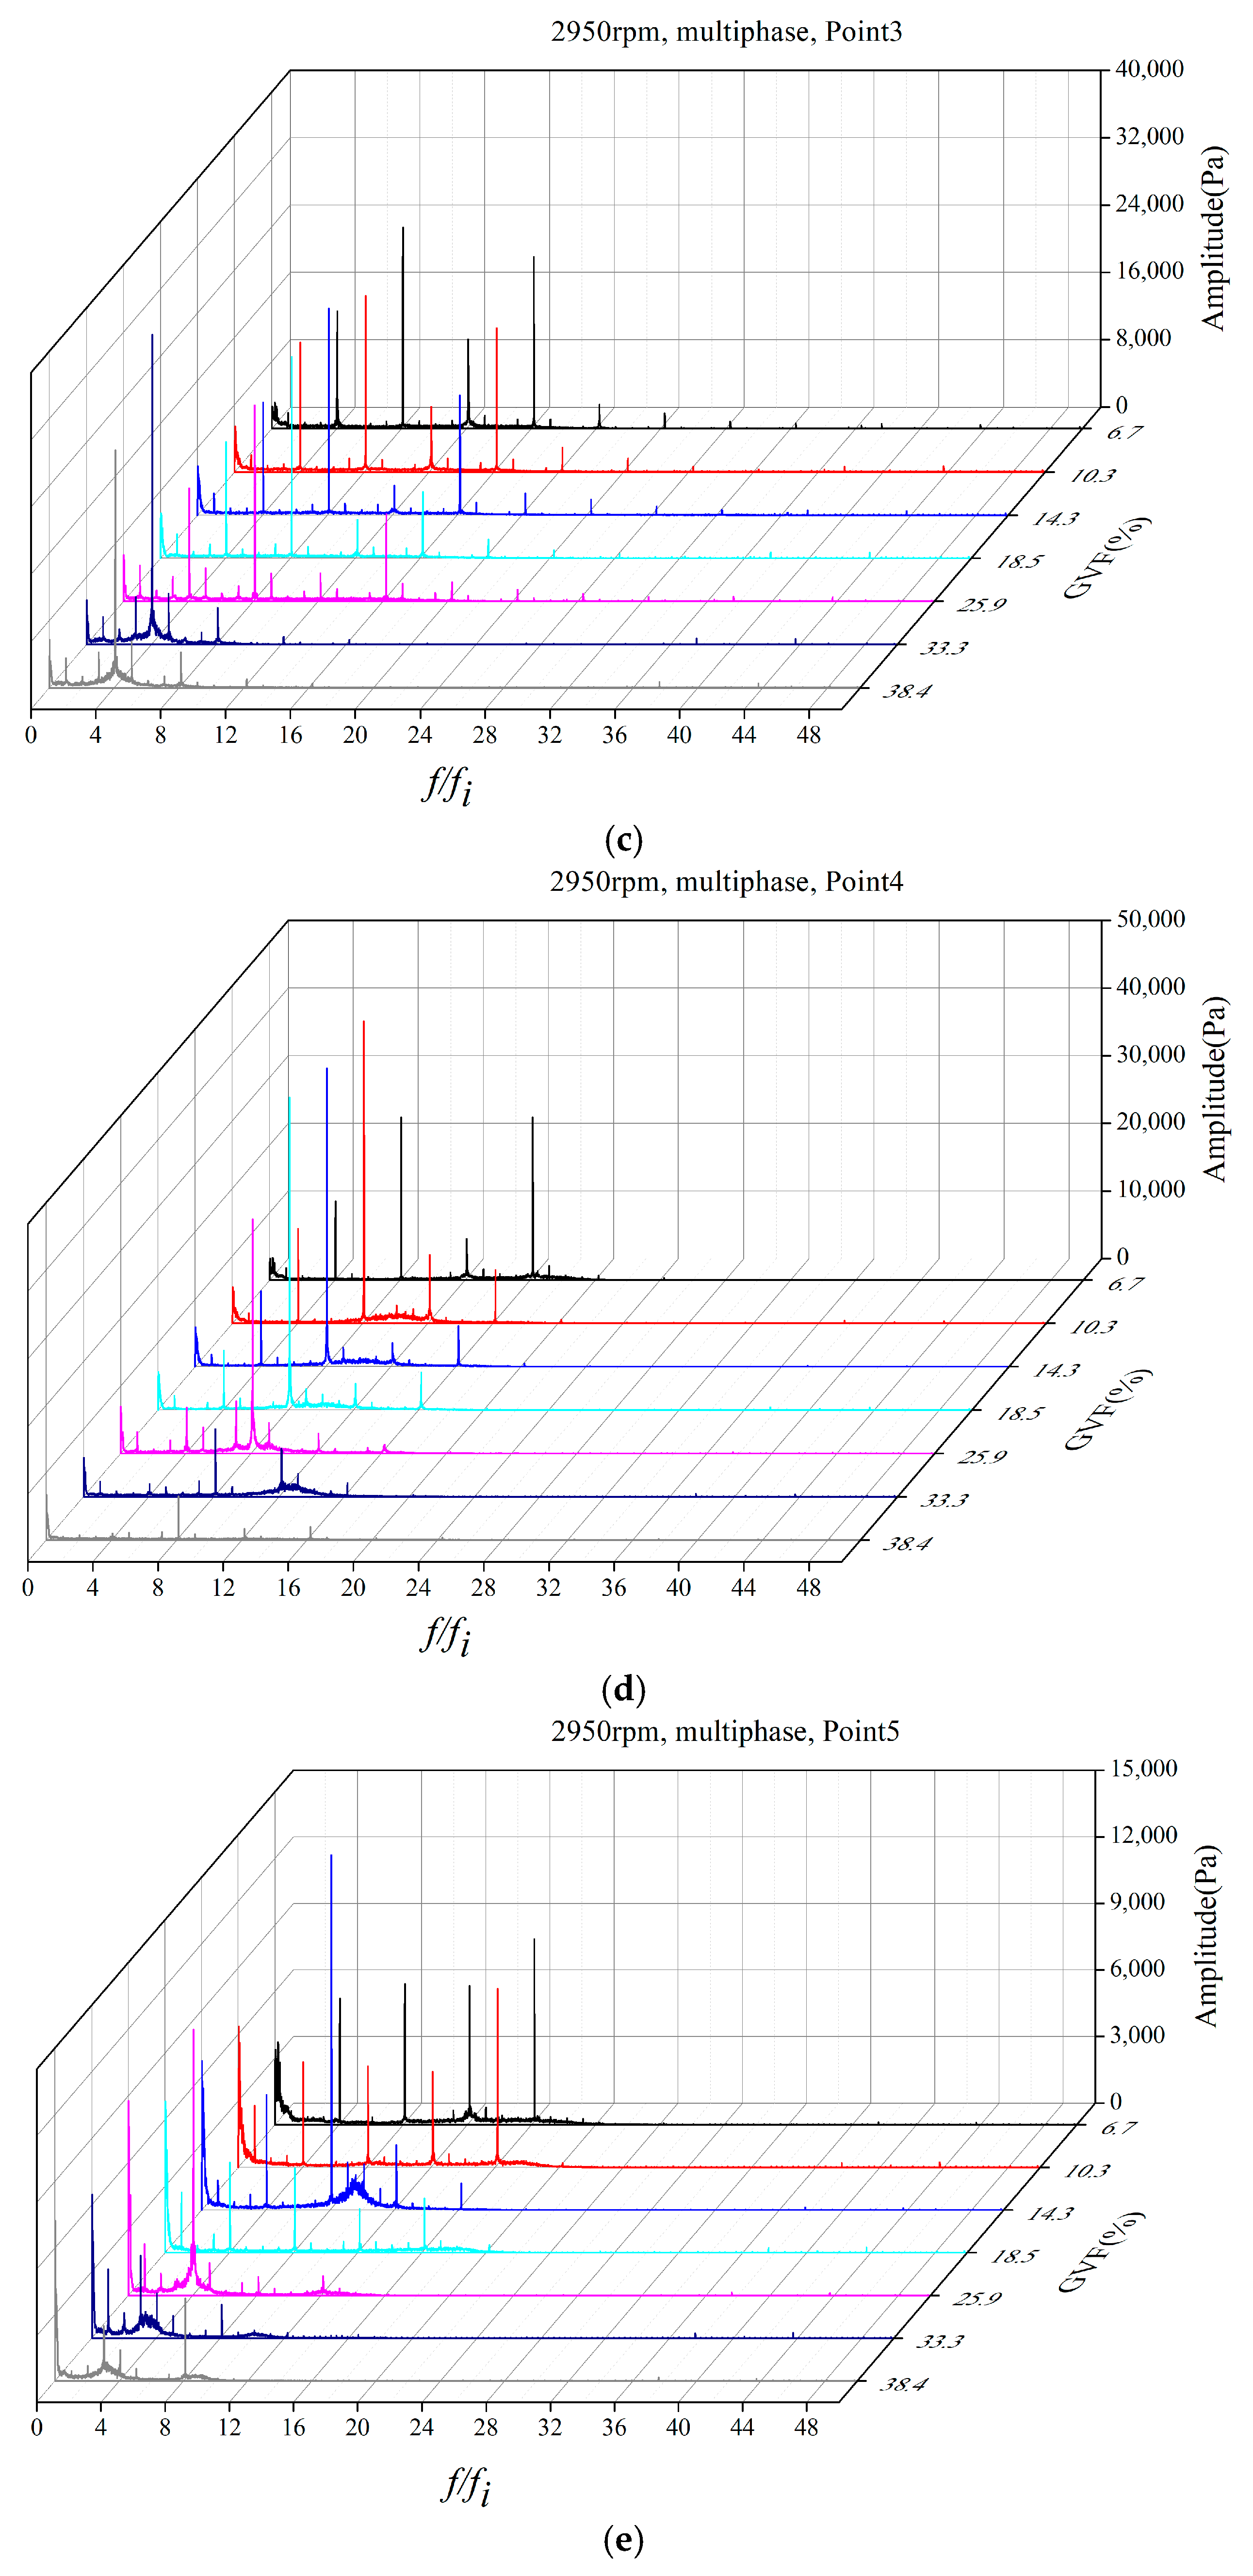
Qd were chosen to further analyze the pressure fluctuation performance. In the seven selected GVF conditions, the GVF had a range of 6.7% to 38.4%, the GVF values are shown as
Table 2, and the pressure fluctuation distributions are listed as
Figure 10 and
Figure 11. The curves are concluded with the position of monitoring points.
From the spectrum in
Figure 10, it can be seen that under multiphase conditions, the main fluctuation peaks still emerge at multiples of impeller rotation frequency
fi, especially at the multiples of the blade passing frequency
fBPF and 2
fBPF. This phenomenon proves that the main fluctuation in these conditions is still caused by the blade passing. Interestingly, the fluctuations under every multiple of rotation frequency are strengthened while the single-phase condition mainly has the peaks under multiples of blade passing frequencies. The stimulation of these fluctuation peaks is the consequence of relative movement of the two phases, and the variation of gas phase form in each passage.
Considering the pressure fluctuation amplitude distribution, the first four points, P1 to P4, have the dominant frequency fBPF, which indicates consistency with the impeller blade number. The fifth point P5 has a dominant frequency of 2 fBPF and the amplitude values are smaller. This may be caused by the influence of the volute tongue on the point near impeller outlet. As the GVF increases, the low frequency noises become prominent, especially in P5. The phenomenon indicates that under higher GVF conditions, the influence of the impeller rotation is weakened, and irregular fluctuations make significant influence on the multiphase flow near the impeller passages outlet.
Figure 11 shows the dimensionless amplitude of these multiphase conditions. It is obvious that the pressure level increases as the GVF value increasing. The amplitude distribution forms are similar in the first five GVF conditions from 6.7% to 25.9%, which are similar to the single-phase condition. The pressure fluctuation amplitude order is P2 > P4 > P1 > P3 > P5. This order shows that when the working medium firstly enters the impeller, the blades could have a strong control of the multiphase flow. Then some irregular flow behaviors appear due to the increasing of the pressure gradient and the separation of the two phases. Then the medium enters the with-splitter-blade region, the flow control ability of the impeller is improved, and the fluctuation amplitude is restricted. This phenomenon indicates a better control ability of with-splitter-blade region because the increase of blade number would reduce the pressure difference between two blades. When the gas component keeps increasing to GVF larger than 30%, the effort of the splitter blades decreases, which leads to the increase of pressure fluctuation amplitude in the third point. However, the fluctuation in the last two points, P4 and P5, is smaller than the lower GVF conditions. The main reason maybe the separation and gathering of the gas phase near the trailing edge of the blades, which creates a new stable flow structure near the impeller outlet.
5. Correlation of Inner-Flow Pattern and Pressure Field
The inner-flow pattern of liquid-gas two phases would make significant influence on the pressure field of the passage, while the pressure distribution also impacts the phase distribution. In the test, the inner field is monitored by high-speed camera.
Figure 12 shows photographs of four different working conditions with GVF from 10.3% to 38.4%, the total flow rate of the conditions equals to design flow rate
Qd. It could be observed that in every working condition, the inner-flow region is mainly in a uniform condition with foam shape. The foam shape flow form is a uniformly mixed-flow pattern of liquid-gas flow, which consists of tiny bubbles and well-mixed two-phase condition. This indicates the good mixing performance of the helico-axial pump under liquid-gas flow, while there are differences among the conditions: as the GVF increases, the inner region becomes lighter, which is owed to the increase of bubble size and bubble number. Under the two lower GVF conditions, no separation could be observed in the whole flow region. A gas gathering region could be seen near the leading edge of the blade. Under higher GVF conditions, some big bubbles could be found near the upstream region, where the pressure is lower than the downstream region and the gas phase is not severely compressed. Additionally, the separation could be captured clearly in the 38.4% GVF condition in the downstream region. The increase of gas component and the larger pressure difference in the downstream region lead to the gathering of gas phase in low pressure region, which is the suction side of the blades. Due to the centrifugal force gradient, the hub region is also an accumulation area for gas. The gathering of gas to the hub and blade suction side form an annular flow pattern in the downstream region, which consists of a gas column near the hub and a liquid film in the shroud. The annular flow is a severe separated flow pattern of liquid and gas, which deteriorates the pump performances and blocks the passage.
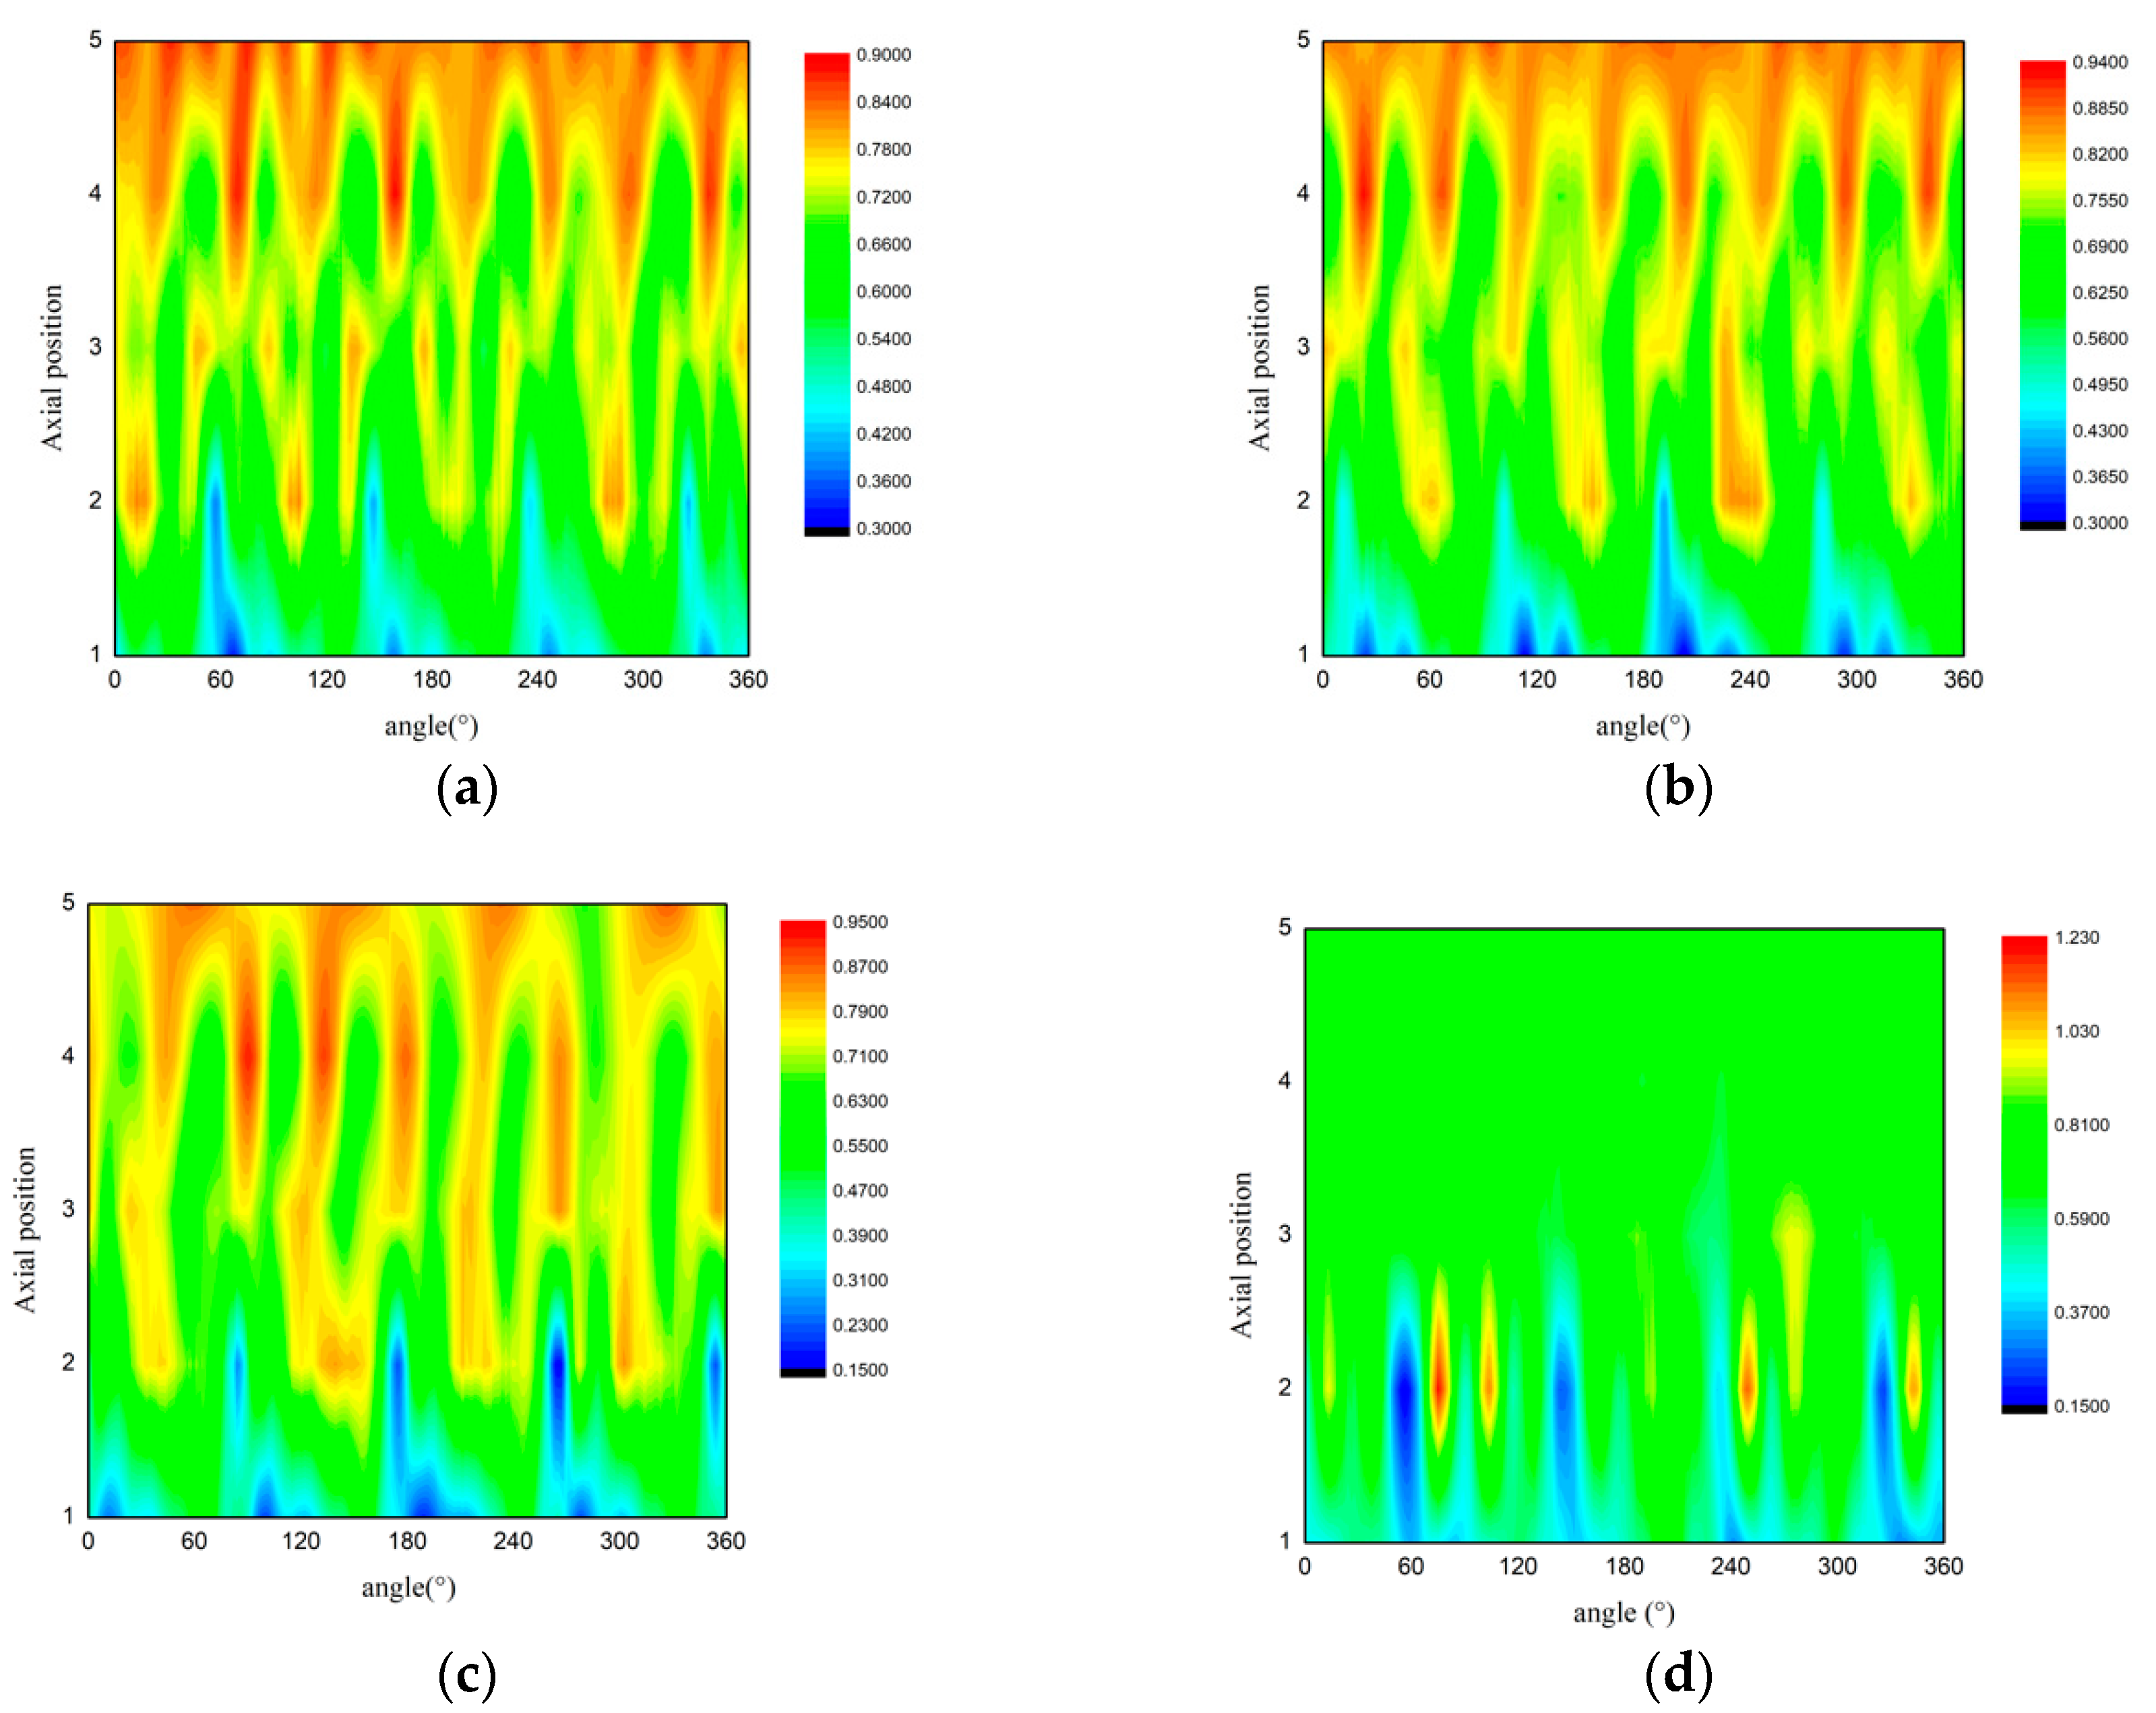
In order to investigate the inner-flow field and the correlation between two-phase distribution and pressure field, the dimensionless pressure contour was drawn by concluding the transient pressure values of the five sensors in a complete rotation cycle, which could show the pressure static pressure in the shroud surface. The pressure values are nondimensionalized by corresponding head in each case, like the process of pressure fluctuation amplitude.
Figure 13 shows the dimensionless pressure field of design flow rate condition with single-phase water, and
Figure 14 shows the status of different multiphase cases with total flow rate equal to design flow rate (
Qg +
Ql =
Qd).
Above all, the dimensionless pressure ranges of the conditions are different. In the single-phase, the range is from 0.5 to 1.0. When the gas phase enters, the range would be enlarged and as the GVF increases, the range varies from 0.3–0.9 to 0.15–1.23. The pressure range has two main determinants: the dimensionless head of the last stage, and the fluctuation amplitude of the pump. The dimensionless head
could be defined as Equation (12), which shows the pumping ratio of the stages in the whole pump:
where the
Hi is the single-stage head of the corresponding stage and
H is the total pump head.
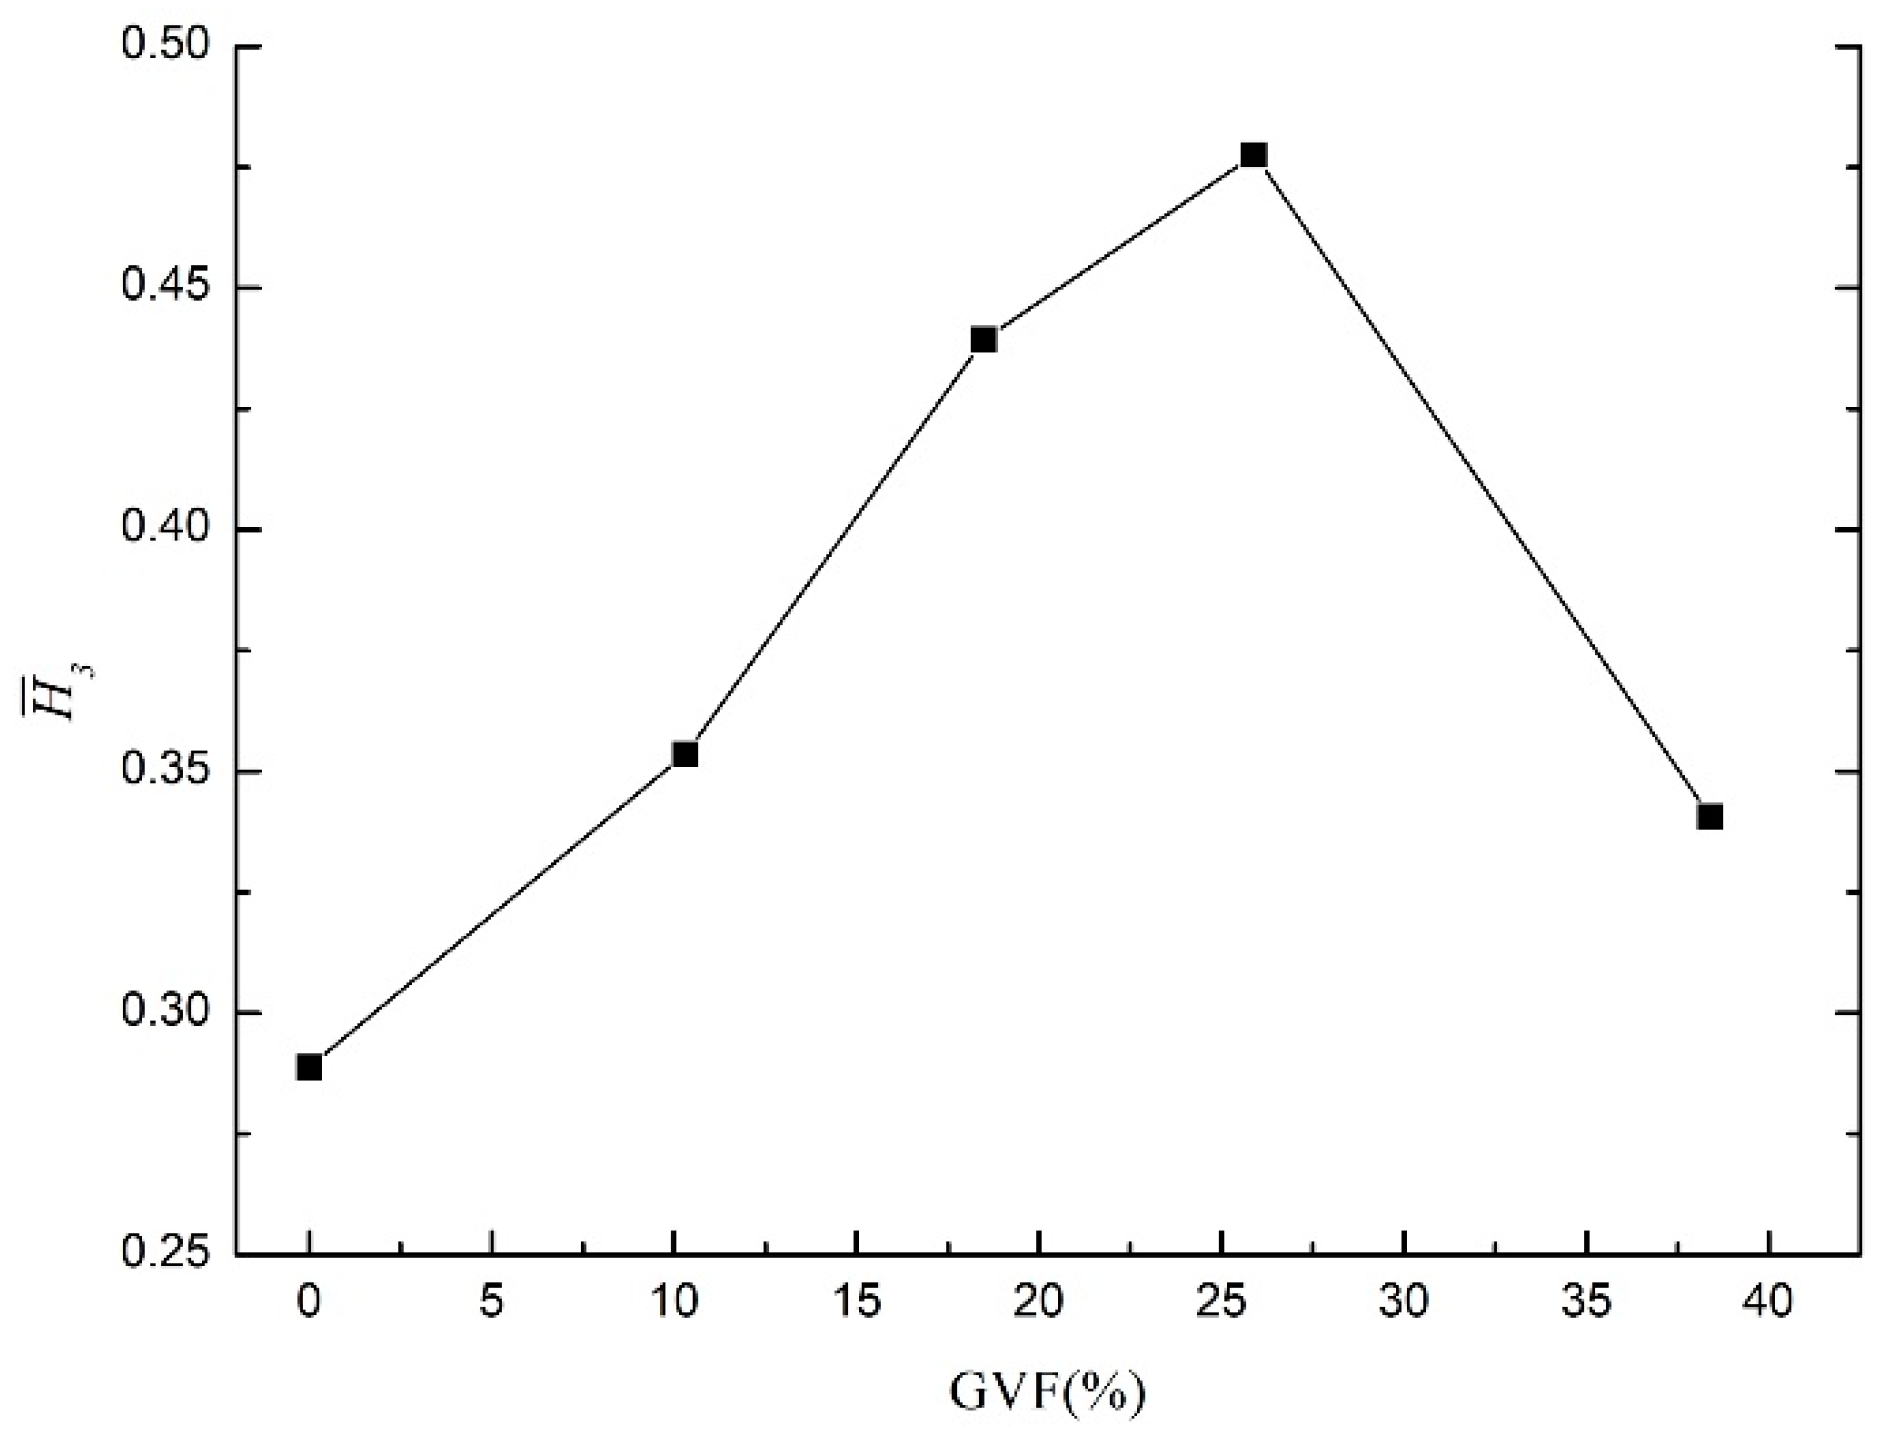
The dimensionless head values are shown in
Figure 15. It is clear that the dimensionless head of the third stage impeller would firstly increase and then decrease as the GVF increases. When the GVF is lower than 25.9%, the
value shows positive correlation with the gas component increasing. The main reason is that from the first to last stage, the pressure level would rise, and the gas phase would be compressed. The compressing of gas leads to the decrease of real GVF value and the pumping ability would be enhanced. Another reason is the mixing effect of the first two stages. When the GVF keeps increasing, the
value decreases acutely. In
Figure 15, the difference between the first three multiphase conditions and the highest condition is evident. The pressure distribution could explain the decreasing trend. In the high GVF condition, the pressure level doesn’t rise obviously in the downstream region of the impeller due to the phase separation and blockage of the passage.
The variation of pressure distribution also proves the deterioration of pumping and control capacity of impeller as GVF increases. In the single-phase contour, the gradual increase of the pressure level in axial direction and the fluctuation caused by the passing of blades can be clearly observed. In the lower GVF conditions, the pressure field is still regular while more pressure fluctuations could be captured in the passages. By comparing the inner-flow field photograph and the pressure field, the reason of the stronger fluctuations could be the movement of gas component towards low pressure regions and the break, collision, merging of the tiny bubbles.
In
Figure 14d, with GVF equals to 38.4%, the pressure field has a qualitative change from the other cases. The highest pressure emerges in the upstream region of the passage, while the downstream region is in a relatively uniform status without obvious fluctuation along with the rotation of blades. This phenomenon indicates that under high GVF conditions, the pumping capacity of blades in downstream areas is severely weakened. Additionally, the drastic fluctuation in the upstream region is caused by the separating process and the relative movement of the two phases.
6. Conclusions
On the basis of design and test of a helico-axial multiphase pump, the energy performance, spectral characteristics, transient pressure field and its correlation with inner-flow patterns have been investigated by experiment measurement in the present work.
The multiphase pump developed in the present work has a preferable energy performance which meets the design requirements and has a wide operation range of two-phase medium. The stable operation GVF value could reach to 50%, and meanwhile a temporary 100% GVF situation could be sustained during the operation.
The monitoring of transient pressure condition was accomplished by installing five pressure fluctuation sensors and their recording system in the test pump shell. The frequency domain and pressure field were discussed based on the monitoring results. In the spectral analysis of all the working conditions, the predominant fluctuation resource was found to be the passing of blades under both single-phase and multiphase conditions. The dominant frequency values in upstream region (P1 and P2) and downstream region (P3 to P5) correspond to the blade number in the without-splitter-blade (4 blades) region and with-splitter-blade (8 blades) region. The main differences of fluctuation peak distribution between single-phase and multiphase are the low frequency noises under multiphase and the stimulation of peaks under every multiple of rotation frequency, which are caused by the movement and form change of gas phase.
The amplitude value and distribution were analyzed by flowrate change and GVF change. Under single-phase, the overload condition proved to have a higher fluctuation level compared with design point and partial load, caused by the narrower passage area of the helico-axial pump. The phenomenon is especially obvious in P3, which is near the leading edge of splitter blades, where the passage area decreases acutely. The distribution of amplitude in five monitoring points also proves that the usage of splitter blade could lead to a better control of flow.
For the amplitude distribution under multiphase conditions, the distribution forms were similar in lower GVF conditions which are similar to single-phase condition. The similarity validates the mixing and control ability of the pump under lower GVFs. When the GVF increases to more than 30%, the fluctuation in upstream regions is stimulated while the downstream region is weakened.
In the last section, the pressure field form was created by applying transient pressure values in a continuous cycle of impeller rotation, and compared with the multiphase flow patterns under corresponding conditions. Under single-phase and lower GVF conditions, the pressure fields were regular with the fluctuation of blade passing and gradual increase of pressure level from inlet to outlet. This pressure form corresponds to the uniformly mixed inner flow of two phases, which can be clearly seen in the photos shot by high-speed camera. While in the high GVF condition, the highest pressure appears in the upstream region and the fluctuation near the region is acutely stimulated. At the same time, the downstream region tends to be uniform because the energy conversion between blades and medium is weakened due to the separation of phases.
Author Contributions
Conceptualization, Y.X., S.C., T.S., T.W. and M.R.; Data curation, Y.X. and S.C.; Formal analysis, Y.X. and S.C.; Funding acquisition, T.S., T.W. and M.R.; Investigation, Y.X. and S.C.; Methodology, Y.X. and S.C.; Project administration, S.C., T.S., T.W. and M.R.; Supervision, S.C. and T.S.; Visualization, Y.X.; Writing–original draft, Y.X.; Writing–review & editing, S.C., T.S. and M.R.
Funding
This research received no external funding.
Conflicts of Interest
The authors declare no conflicts of interest. The funders had no role in the design of the study; in the collection, analyses, or interpretation of data; in the writing of the manuscript, and in the decision to publish the results.
Appendix A
Error Analysis of the Test Rig
The main measurement instruments for the basic parameters include: electromagnetic liquid flowmeter, float gas flowmeter, torque sensor, rotation speed sensor, pressure sensors for inlet and outlet. The efficiency measurement uncertainty Eh of test rig could be divided into two parts, the system uncertainty Es and random uncertainty Er. The system error could be calculated according to flowrate measurement error EQl and EQg, head measurement error EH, torque and speed measurement uncertainty EM and En.
The electromagnetic flow meter used in the present work has an obtained measurement uncertainty
EQl = 0.5%, while the float flowmeter has an uncertainty
EQg = 1.0%. The torque and speed measurement uncertainty
EM =
En = 0.25%.
EH consists of dynamic head measurement uncertainty
Ed and static head measurement uncertainty
Ej. In the present work, the inlet and outlet pipelines are in the same diameter, so the dynam ic head can be ignored as
Ed = 0. The
Ej can be calculated by pressure sensor uncertainty
Eps and the pressure transmitter uncertainty
EpT, where
Eps = 0.25% and
EpT = 0.1%. So
EH can be calculated as follows:
Then the efficiency system uncertainty
Es could be calculated by the uncertainty values as follows:
The random uncertainty of efficiency could be obtained by repeated experiment under stable operation condition. In the present work, ten groups of data are obtained to collect ten efficiency values. According to the standards of International Electrotechnical Commission, t-distribution is used to calculate the random error
Er as follows:
where
t is the value of t-distribution when the confidence level is 95%;
s is the standard deviation,
y is the measurement times,
is the mean value of efficiency. According to the equation, the random uncertainty is 0.15% in the test. So, the efficiency uncertainty could be calculated as follows:
Appendix B
Fast Fourier Transform Algorithm Used in the Pressure Analysis
The time domain analysis on the pressure signal has the advantages of being intuitive and accessible. While under complicated working conditions, like the transient flow and sudden switches of the flowrate, the characteristic frequencies are difficult to capture only by using time domain analysis. For better comprehension of the dynamic variation process of signal, the spectral analysis should be performed.
The main instrument of spectral analysis is the Fourier Transformation (FT). The method aims at decomposing a function of time, which is a signal, into the waveforms that makes it up. The separated waves are usually sine waves or cosine waves, which are called harmonic waves. By the decomposition, the characteristics of harmonic waves like the amplitude, phase and their relationship could be further discussed. Set the
x(t) is a time domain signal, if the Dirichlet condition is satisfied in the signal, which means:
then the Fourier transformation could be defined as function:
where
X(
f) is the frequency domain form of the signal,
f is the frequency.
The inverse transformation is:
The Fourier Transformation is a convert method between time domain and pressure domain without information losses. The classical Fourier Transformation Algorithm is calculated based on continuous time, which leads to difficulties in application. For this reason, the Discrete Fourier Transformation (DFT) was proposed for Fourier transformation analysis on computers, which could transform discretize signal and approach the continuous time signal. The Fast Fourier Transform (FFT) is an algorithm that computes the discrete Fourier transform (DFT) of a sequence.
The FFT algorithm in the present work was performed by the software ORIGIN. The first step is inputting all the time and pressure data of a certain point into the column, and the sampling interval is set to be automatically computed by the data. The Hanning window is used to suppress frequency leakage. In this research, frequency and amplitude are the two concerned parameters. The nomaliazation of Real part (Re), Imaginary part (Im) and Magnitude (Mag) is not used, and the other selections are as default.
References
- Caridad, J.; Asuaje, M.; Kenyery, F.; Tremante, A.; Aguillón, O. Characterization of a centrifugal pump impeller under two-phase flow conditions. J. Petrol. Sci. Eng. 2008, 63, 18–22. [Google Scholar] [CrossRef]
- Narabayashi, T.; Arai, K.; Kubokoya, T.; Amano, O.; Gomyo, T. Centrifugal Pump Behavior in Steady and Transient Two-Phase Flow. J. Nucl. Sci. Technol. 1986, 23, 136–150. [Google Scholar] [CrossRef]
- Medvitz, R.B.; Kunz, R.F.; Boger, D.A.; Lindau, J.W.; Yocum, A.M.; Pauley, L.L. Performance Analysis of Cavitating Flow in Centrifugal Pumps Using Multiphase CFD. J. Fluids Eng. 2002, 124, 377–383. [Google Scholar] [CrossRef]
- Karkoub, M.A.; Gad, O.E.; Rabie, M.G. Predicting axial piston pump performance using neural networks. Mech. Mach. Theory 1999, 34, 1211–1226. [Google Scholar] [CrossRef]
- Saadawi, H.N. An overview of multiphase pumping technology and its potential application for oil fields in the gulf region. In Proceedings of the International Petroleum Technology Conference, Dubai, UAE, 4–6 December 2007. [Google Scholar]
- Dolan, P.J.; Goodridge, R.A.; Leggate, J.S. Development of a twin-screw pump for multiphase duties. SPE Prod. Eng. 1988, 3, 629–632. [Google Scholar] [CrossRef]
- Hu, B.; Cao, F.; Yang, X.; Wang, X.; Xing, Z. Theoretical and experimental study on conveying behavior of a twin-screw multiphase pump. Proc. Inst. Mech. Eng. Part E J. Process Mech. Eng. 2014. [Google Scholar] [CrossRef]
- Räbiger, K.; Maksoud, T.M.A.; Ward, J.; Hausmann, G. Theoretical and experimental analysis of a multiphase screw pump, handling gas-liquid mixtures with very high gas volume fractions. Exp. Therm. Fluid Sci. 2008, 32, 1694–1701. [Google Scholar] [CrossRef]
- Vetter, G.; Wirth, W.; Korner, H.; Pregler, S. Multiphase Pumping with Twin-Screw Pumps-Understand and Model Hydrodynamics and Hydroabrasive Wear. In Proceedings of the 17th International Pump Users Symposium, Houston, TX, USA, 6–9 March 2000; pp. 153–170. [Google Scholar]
- Falcimaigne, J.; Brac, J.; Charron, Y.; Pagnier, P.; Vilagines, R. Multiphase pumping: Achievements and perspectives. Oil Gas Sci. Technol. 2002, 57, 99–107. [Google Scholar] [CrossRef]
- Gié, P.; Buvat, P.; Bratu, C.; Durando, P. Poseidon Multiphase Pump: Field Tests Results. In Proceedings of the Offshore Technology Conference, Houston, TX, USA, 4–7 May 1992. [Google Scholar]
- Leporcher, E.; Delaytermoz, A.; Gerbier, A.; Burger, O. Deployment of multiphase pumps on a North Sea field. In Proceedings of the SPE Annual Technical Conference and Exhibition, New Orleans, Louisiana, 30 September–3 October 2001. [Google Scholar]
- Humoud, A.A.; Boudi, A.A.; Al-Qahtani, S.D.; Al-Dayil, N. Deployment of a rotodynamic multiphase pump in a remote hilly-terrain oil field in saudi Arabia. In Proceedings of the Abu Dhabi International Petroleum Exhibition and Conference, Abu Dhabi, UAE, 3–6 November 2008. [Google Scholar]
- Saadawi, H.N. Operating multiphase helicoaxial pumps in series to develop a satellite oil field in a remote desert location. SPE Proj. Facil. Constr. 2008, 3, 1–6. [Google Scholar] [CrossRef]
- Cao, S.; Peng, G.; Yu, Z. Hydrodynamic design of rotodynamic pump impeller for multiphase pumping by combined approach of inverse design and CFD analysis. J. Fluids Eng. 2005, 127, 330–338. [Google Scholar] [CrossRef]
- Zhang, J.; Zhu, H.; Wei, H. Three-Dimensional Blade Design of Helico-Axial Multiphase Pump Impeller Based on Numerical Solution of Meridian Flow Net and Blade Mean Camber Lines. In Proceedings of the ASME-JSME-KSME 2011 Joint Fluids Engineering Conference, Hamamatsu, Japan, 24–29 July 2011; pp. 163–170. [Google Scholar]
- Zhang, J.; Zhu, H.; Yang, C.; Li, Y.; Wei, H. Multi-objective shape optimization of helico-axial multiphase pump impeller based on NSGA-II and ANN. Energy Convers. Manag. 2011, 52, 538–546. [Google Scholar] [CrossRef]
- Kim, J.; Lee, H.; Kim, J.; Choi, Y.; Yoon, J.; Yoo, I.; Choi, W. Improvement of Hydrodynamic Performance of a Multiphase Pump Using Design of Experiment Techniques. J. Fluids Eng. 2015, 137, 081301. [Google Scholar] [CrossRef]
- Tremante, A.; Moreno, N.; Rey, R.; Noguera, R. Numerical turbulent simulation of the two-phase flow (liquid/gas) through a cascade of an axial pump. J. Fluids Eng. 2002, 124, 371–376. [Google Scholar] [CrossRef]
- Yu, Z.; Zhu, B.; Cao, S. Interphase force analysis for air-water bubbly flow in a multiphase rotodynamic pump. Eng. Comput. 2015, 32, 2166–2180. [Google Scholar] [CrossRef]
- Zhang, J.; Tan, L. Energy Performance and Pressure Fluctuation of a Multiphase Pump with Different Gas Volume Fractions. Energies 2018, 11, 1216. [Google Scholar] [CrossRef]
- Liu, M.; Cao, S.; Cao, S. Numerical analysis for interphase forces of gas-liquid flow in a multiphase pump. Eng. Comput. 2018, 35, 2386–2402. [Google Scholar] [CrossRef]
- Zhang, J.; Cai, S.; Zhu, H.; Zhang, Y. Experimental investigation of the flow at the entrance of a rotodynamic multiphase pump by visualization. J. Petrol. Sci. Eng. 2015, 126, 254–261. [Google Scholar] [CrossRef]
- Zhang, J.; Cai, S.; Li, Y.; Zhu, H.; Zhang, Y. Visualization study of gas–liquid two-phase flow patterns inside a three-stage rotodynamic multiphase pump. Exp. Therm. Fluid Sci. 2016, 70, 125–138. [Google Scholar] [CrossRef]
- Liu, M.; Tan, L.; Liu, Y.; Xu, Y.; Cao, S. Large eddy simulation of cavitation vortex interaction and pressure fluctuation around hydrofoil ALE 15. Ocean Eng. 2018, 163, 264–274. [Google Scholar] [CrossRef]
- Tan, L.; Zhu, B.; Wang, Y.; Cao, S.; Gui, S. Numerical study on characteristics of unsteady flow in a centrifugal pump volute at partial load condition. Eng. Comput. 2015, 32, 1549–1566. [Google Scholar] [CrossRef]
- Furukawa, A.; Takahara, H.; Nakagawa, T.; Ono, Y. Pressure fluctuation in a vaned diffuser downstream from a centrifugal pump impeller. Int. J. Rotating Mach. 2003, 9, 285–292. [Google Scholar] [CrossRef]
- Tan, L.; Yu, Z.; Xu, Y.; Liu, Y.; Cao, S. Role of blade rotational angle on energy performance and pressure fluctuation of a mixed-flow pump. Proc. Inst. Mech. Eng. Part A 2017, 231, 227–238. [Google Scholar]
- Xu, Y.; Tan, L.; Liu, Y.; Cao, S. Pressure fluctuation and flow pattern of a mixed-flow pump with different blade tip clearances under cavitation condition. Adv. Mech. Eng. 2017, 9, 2071938710. [Google Scholar] [CrossRef]
- Xu, Y.; Tan, L.; Liu, Y.; Hao, Y.; Zhu, B.; Cao, S. Pressure fluctuation and flow pattern of a mixed-flow pump under design and off-design conditions. Arch. Proc. Inst. Mech. Eng. Part C J. Mech. Eng. Sci. 2018, 232, 2430–2440. [Google Scholar] [CrossRef]
- Liu, Y.; Tan, L. Tip clearance on pressure fluctuation intensity and vortex characteristic of a mixed flow pump as turbine at pump mode. Renew. Energy 2018. [Google Scholar] [CrossRef]
- Tan, L.; Cao, S.L.; Wang, Y.M.; Zhu, B.S. Direct and inverse iterative design method for centrifugal pump impellers. Proc. Inst. Mech. Eng. Part A J. Power Energy 2012, 226, 764–775. [Google Scholar] [CrossRef]
- Xu, Y.; Tan, L.; Cao, S.; Qu, W. Multiparameter and multiobjective optimization design of centrifugal pump based on orthogonal method. Proc. Inst. Mech. Eng. Part C J. Mech. Eng. Sci. 2017, 231, 2569–2579. [Google Scholar] [CrossRef]
- Liu, M.; Tan, L.; Cao, S. Design method of controllable blade angle and orthogonal optimization of pressure rise for a multiphase pump. Energies 2018, 11, 1048. [Google Scholar] [CrossRef]
Figure 1.
Structure of the three-stage helico-axial pump (a) Three-dimensional structure of pump; (b) Test pump model.
Figure 1.
Structure of the three-stage helico-axial pump (a) Three-dimensional structure of pump; (b) Test pump model.
Figure 2.
Structural diagram of the water-air test rig.
Figure 2.
Structural diagram of the water-air test rig.
Figure 3.
Water-air multiphase test rig (a) Test system; (b) High-speed camera shooting system.
Figure 3.
Water-air multiphase test rig (a) Test system; (b) High-speed camera shooting system.
Figure 4.
Adoption of pressure fluctuation sensors (a) Reserved holes for the sensors; (b) assembly of the sensors.
Figure 4.
Adoption of pressure fluctuation sensors (a) Reserved holes for the sensors; (b) assembly of the sensors.
Figure 5.
Positions of the pressure fluctuation sensors in blade-to-blade view.
Figure 5.
Positions of the pressure fluctuation sensors in blade-to-blade view.
Figure 6.
External single-phase performance of the helico-axial pump.
Figure 6.
External single-phase performance of the helico-axial pump.
Figure 7.
Hydraulic performances under different GVF conditions (a) dimensionless head curves; (b) efficiency curves.
Figure 7.
Hydraulic performances under different GVF conditions (a) dimensionless head curves; (b) efficiency curves.
Figure 8.
Spectral analysis on the single-phase conditions under (a) 0.8 Qd, partial load spectral domain graph; (b) 1.0 Qd, design flowrate spectral domain graph; (c) 1.2 Qd, overload spectral domain graph.
Figure 8.
Spectral analysis on the single-phase conditions under (a) 0.8 Qd, partial load spectral domain graph; (b) 1.0 Qd, design flowrate spectral domain graph; (c) 1.2 Qd, overload spectral domain graph.
Figure 9.
Dimensionless amplitude under dominant frequency of five monitoring points.
Figure 9.
Dimensionless amplitude under dominant frequency of five monitoring points.
Figure 10.
Spectrum curves under different GVF of point (a) P1 (b) P2 (c) P3 (d) P4 (e) P5.
Figure 10.
Spectrum curves under different GVF of point (a) P1 (b) P2 (c) P3 (d) P4 (e) P5.
Figure 11.
Dimensionless amplitude of five monitoring points under different multiphase conditions.
Figure 11.
Dimensionless amplitude of five monitoring points under different multiphase conditions.
Figure 12.
Photograph of the inner field under (a) GVF = 10.3%; (b) GVF = 18.5%; (c) GVF = 25.9%; (d) GVF = 38.4%.
Figure 12.
Photograph of the inner field under (a) GVF = 10.3%; (b) GVF = 18.5%; (c) GVF = 25.9%; (d) GVF = 38.4%.
Figure 13.
Dimensionless pressure field of single-phase condition (Q = Qd, Qg = 0).
Figure 13.
Dimensionless pressure field of single-phase condition (Q = Qd, Qg = 0).
Figure 14.
Dimensionless pressure fields of multiphase conditions (Ql + Qg = Qd) (a) GVF = 10.3%; (b) GVF = 18.5%; (c) GVF = 25.9%; (d) GVF = 38.4%.
Figure 14.
Dimensionless pressure fields of multiphase conditions (Ql + Qg = Qd) (a) GVF = 10.3%; (b) GVF = 18.5%; (c) GVF = 25.9%; (d) GVF = 38.4%.
Figure 15.
Dimensionless head of the third stage under different working conditions.
Figure 15.
Dimensionless head of the third stage under different working conditions.
Table 1.
Basic design requirements and dimensional information.
Table 1.
Basic design requirements and dimensional information.
| Parameters | Symbol | Value |
|---|
| Design head | Hd | 45 m |
| Design flow rate | Qd | 70 m3/h |
| Rotation speed | n | 2950 rpm |
| Axial length (Single-stage) | l | 125 mm |
| Number of impeller main blade | Zi | 4 |
| Number of diffuser blade | Zd | 11 |
Table 2.
Spectral analysis points under multiphase conditions.
Table 2.
Spectral analysis points under multiphase conditions.
| GVF | Head (m) |
|---|
| 6.7 | 43.8 |
| 10.3 | 45.7 |
| 14.3 | 44.2 |
| 18.5 | 44.4 |
| 25.9 | 33.4 |
| 33.3 | 28.2 |
| 38.4 | 24.5 |
© 2019 by the authors. Licensee MDPI, Basel, Switzerland. This article is an open access article distributed under the terms and conditions of the Creative Commons Attribution (CC BY) license (http://creativecommons.org/licenses/by/4.0/).

