Article

Consumer Demand for Blockchain-Enabled Peer-to-Peer Electricity Trading in the United Kingdom: An Online Survey Experiment

UCL Energy Institute, London WC1H 0NN, UK
*
Author to whom correspondence should be addressed.
Energies 2019, 12(20), 3913; https://doi.org/10.3390/en12203913
Submission received: 18 September 2019 / Revised: 7 October 2019 / Accepted: 9 October 2019 / Published: 16 October 2019
(This article belongs to the Special Issue Transaction-Based Peer-to-Peer Energy Management Systems)

Abstract

:
Peer-to-peer (P2P) energy trading could help address grid management challenges in a decentralizing electricity system, as well as provide other social and environmental benefits. Many existing and proposed trading schemes are enabled by blockchain, a distributed ledger technology (DLT) relying on cryptographic proof of ownership rather than human intermediaries to establish energy transactions. This study used an online survey experiment (n = 2064) to investigate how consumer demand for blockchain-enabled peer-to-peer energy trading schemes in the United Kingdom varies depending on how the consumer proposition is designed and communicated. The analysis provides some evidence of a preference for schemes offering to meet a higher proportion of participants’ energy needs and for those operating at the city/region (as compared to national or neighbourhood) level. People were more likely to say they would participate when the scheme was framed as being run by their local council, followed by an energy supplier, community energy organization, and social media company. Anonymity was the most valued DLT characteristic and mentioning blockchain’s association with Bitcoin led to a substantial decrease in intended uptake. We highlight a range of important questions and implications suggested by these findings for the introduction and operation of P2P trading schemes.

Graphical Abstract

1. Introduction

1.1. Background and Aims

A rise in energy consumers producing their own energy (‘prosumers’), thanks to the accessibility of cheaper renewable energy technologies, has been paralleled by a growing interest in the sharing of self-produced energy within communities [1]. Through peer-to-peer (P2P) energy trading, energy prosumers are able to sell surplus energy from their renewable energy installation to other energy consumers (‘peers’) in their neighbourhood or more widely [2]. The trading is, in many ongoing trials, being facilitated by blockchain technology [3].
Blockchains are a distributed ledger technology (DLT) relying on cryptographic proof of transaction validity to enable peer-to-peer (P2P) trading. A copy of this unalterable ledger of sequentially ordered transactions is held by all participants (‘nodes’, i.e., computers). By providing computational power, participants also help verify new transactions and at the same time update the ledger [4]. Blockchain is one of the methods making peer-to-peer energy trading possible by measuring and recording imported and exported electricity with the help of a smart meter. Based on this data, sellers and buyers of self-generated energy are matched by the system, which then goes on to financially settle their transaction automatically. It should be noted that in P2P energy trading, blockchain is used for virtual trading and as an accounting mechanism, with the direction of energy flows still being determined by the physics of the grid [5]. A blockchain can either be public and joined by any person, the most famous example thereof being Bitcoin, or be private/permissioned. Access to the latter is restricted to approved participants, in most cases by the central entity running it. This permissioned network structure is more likely to be the model adopted for peer-to-peer energy trading, due to the highly regulated nature of the energy grid [3].
The first blockchain-enabled P2P energy trade took place in New York in April 2016, as part of the Brooklyn Microgrid project [6]. Since then, similar pilots have been launched across the world. In the United Kingdom, these are being rolled out under the framework of the energy regulator’s (Ofgem) regulatory sandbox, enabling companies to test new energy business models without being subject to all of the standard regulatory requirements, as P2P energy trading is currently not allowed under UK law [7]. In the coming years, regulators and policymakers in the UK will need to gather all possible evidence when deciding if and how to fit P2P energy trading into the current energy regulatory framework. This will be done with consumers’ preferences in mind. Business stakeholders will also be taking these into account when designing their P2P energy trading platforms, with a view to ensuring optimal uptake and engagement.
This study, based on a November 2018 UK-wide online survey experiment on consumer demand for different aspects of peer-to-peer blockchain-enabled electricity trading in communities, aims to provide the evidence on how demand varies as a function of how the consumer proposition is designed and described. It also seeks to fill a gap in the existing literature regarding the preferences of energy consumers when engaging in peer-to-peer energy trading enabled by distributed ledgers such as blockchain, as evidenced by the literature review below.
The survey investigated the effect of varying some important trading scheme characteristics on consumers’ stated intention to participate in P2P energy trading. We tested the effect of varying:
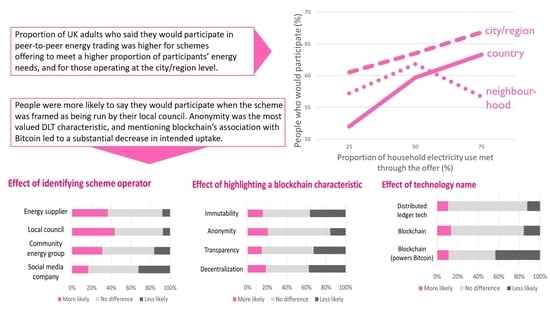
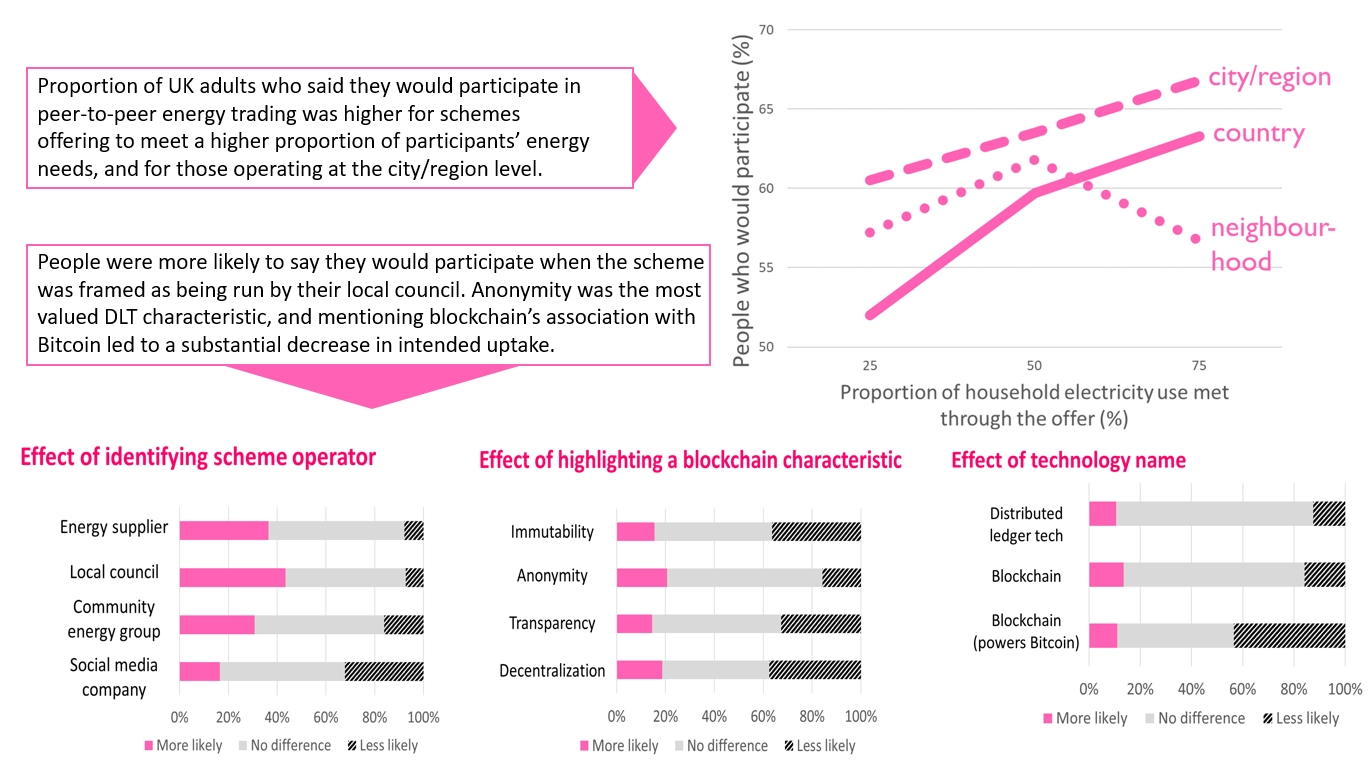
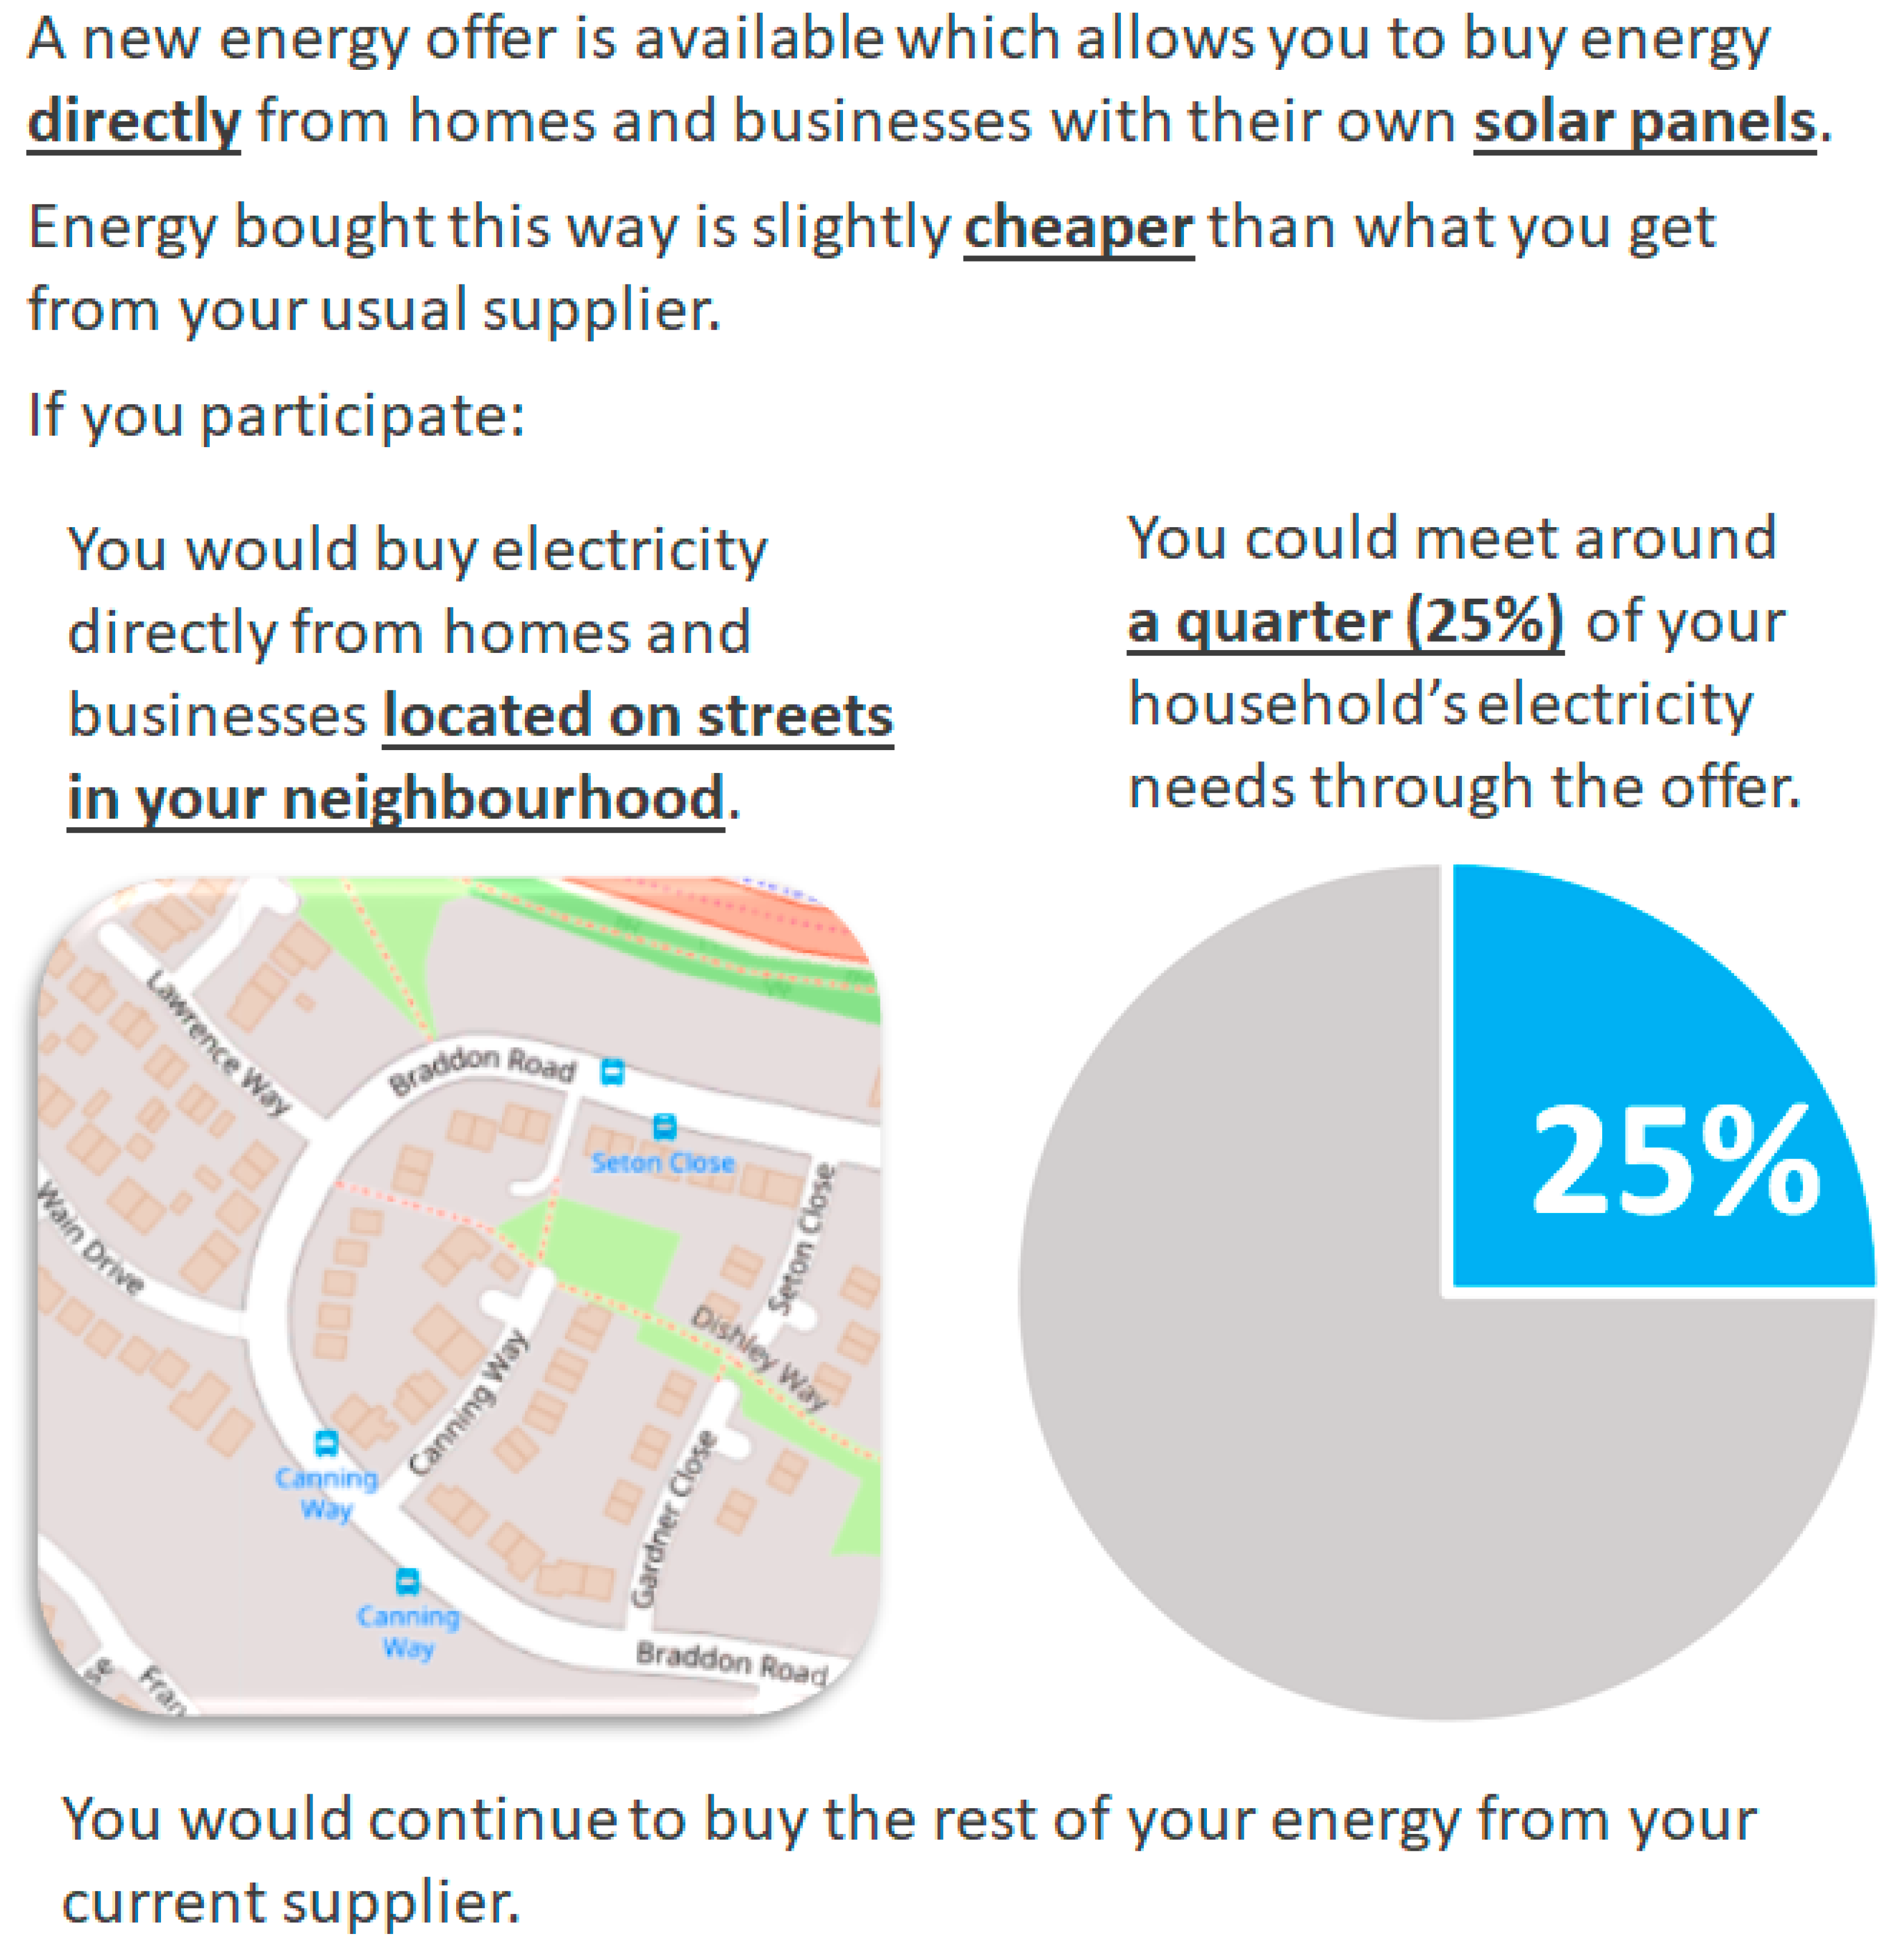
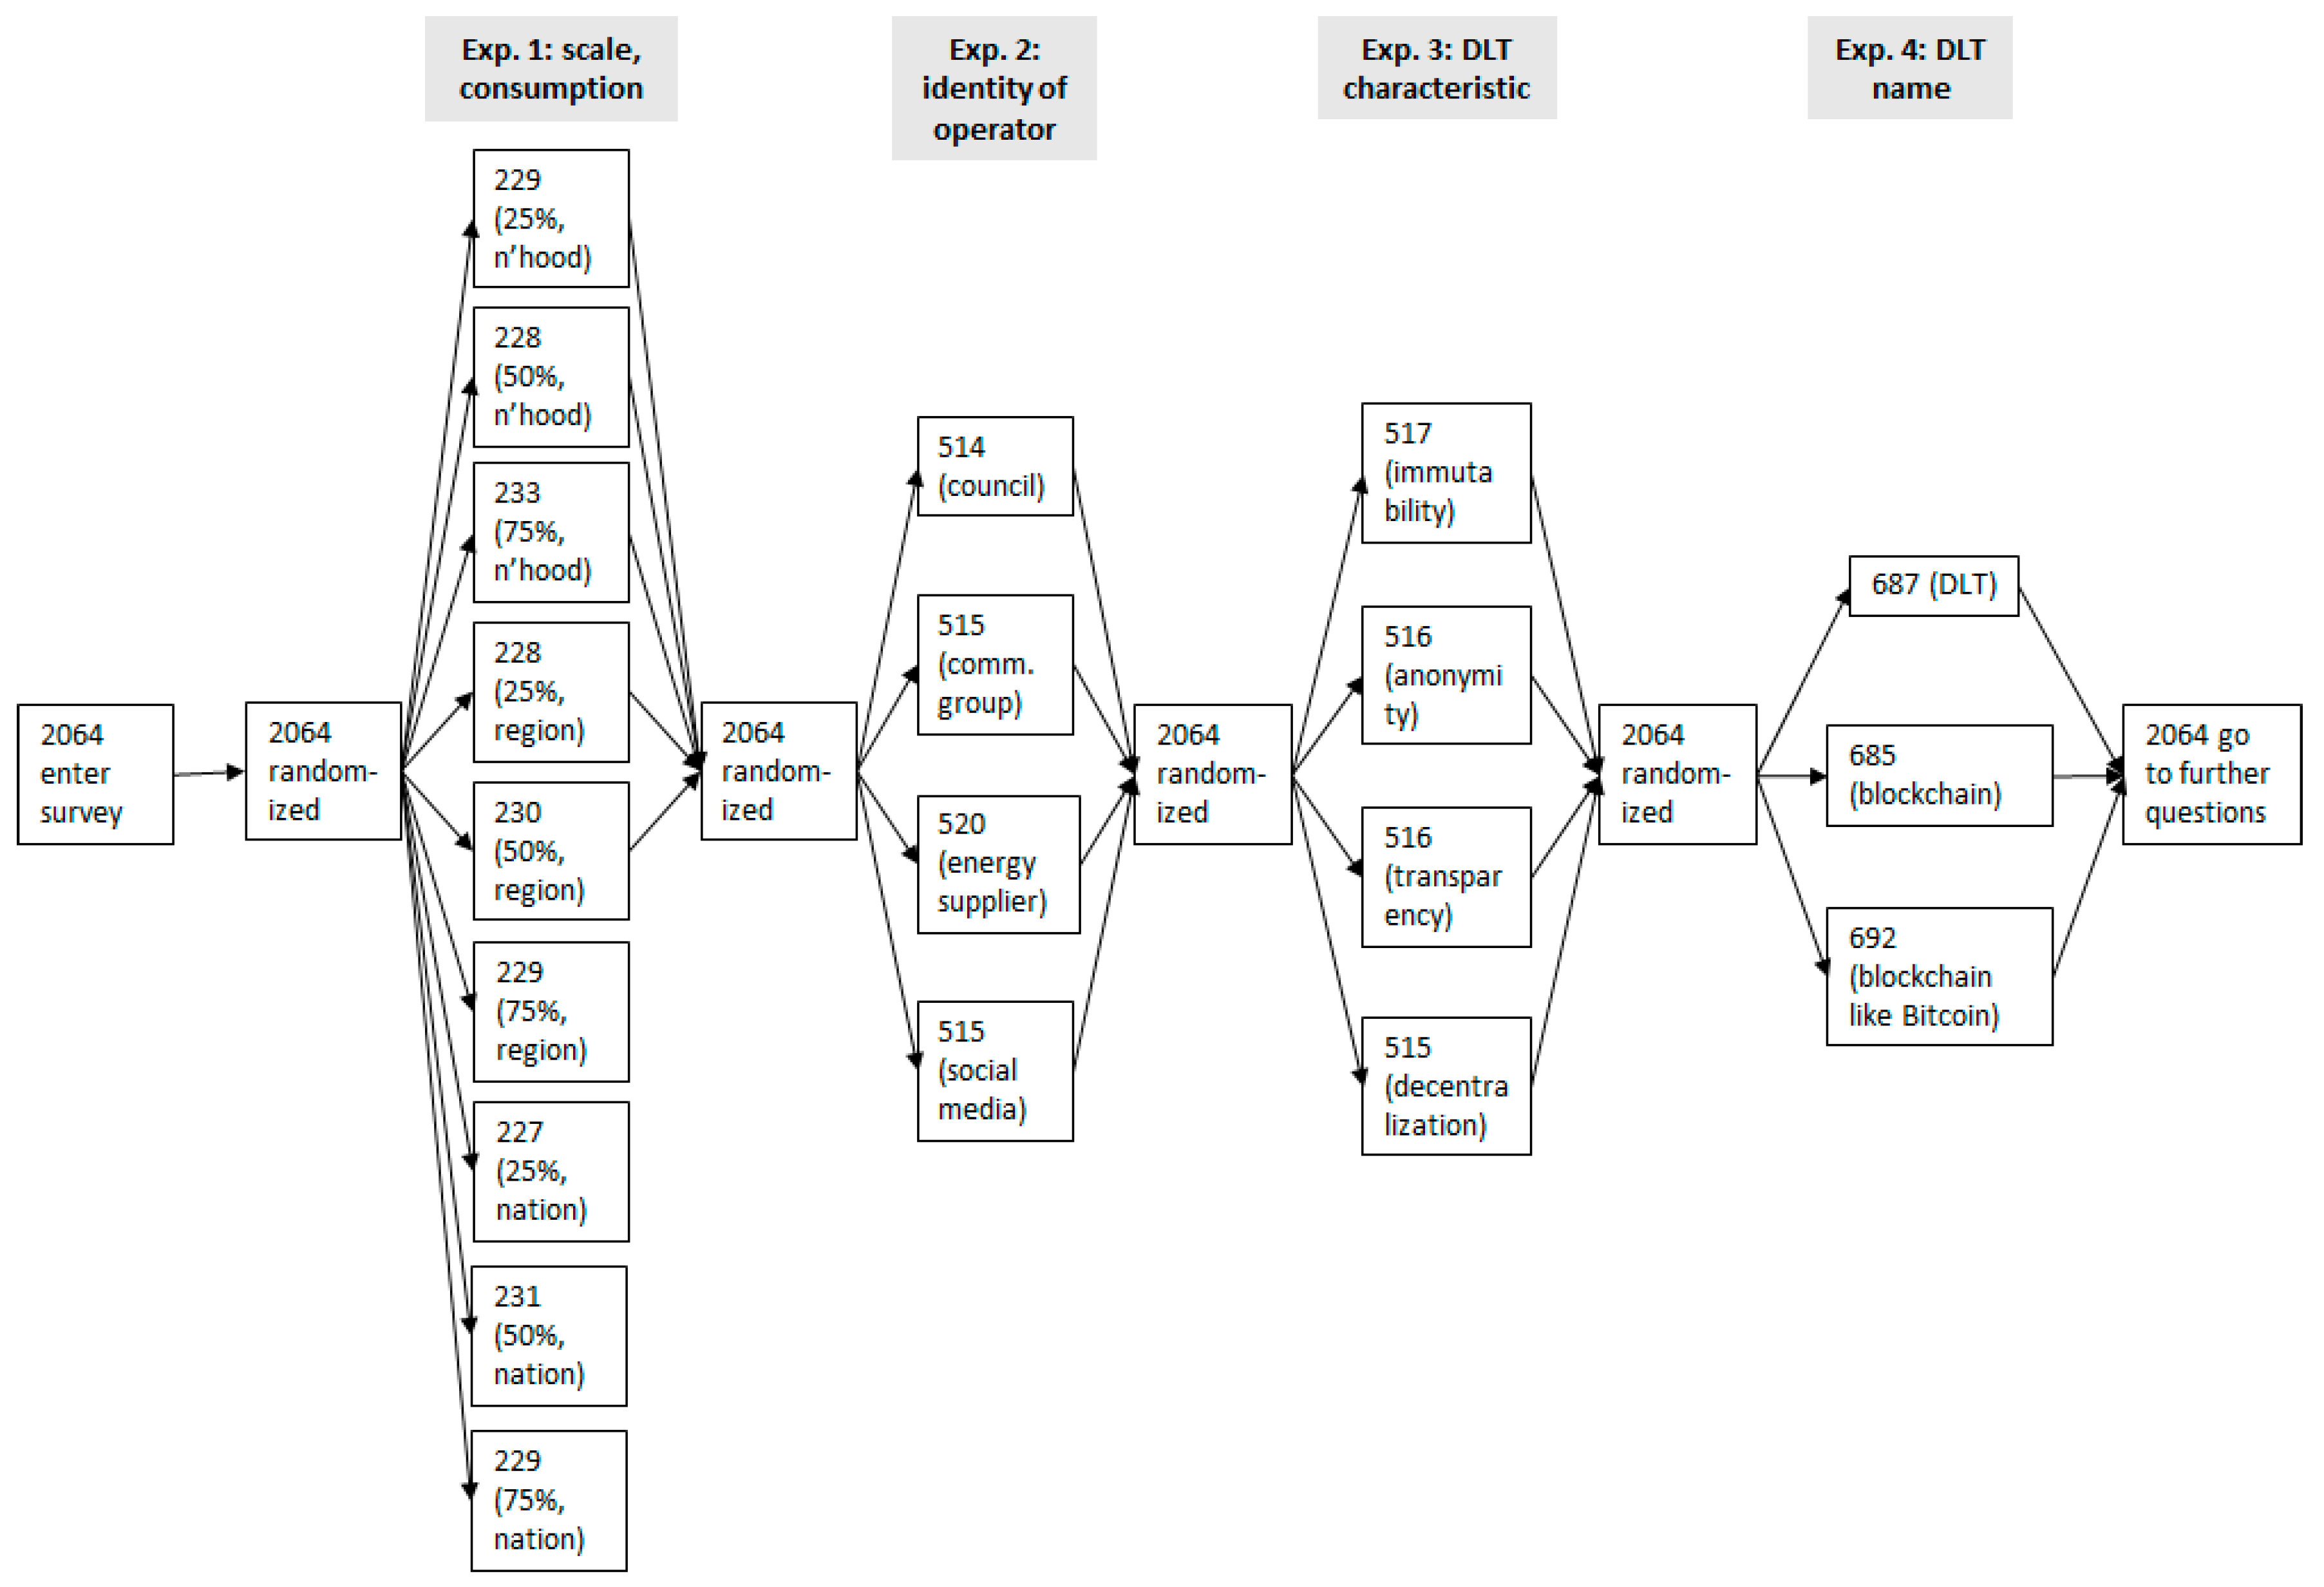
  • The spatial scale from which electricity could be purchased (neighbourhood, city/region or national).
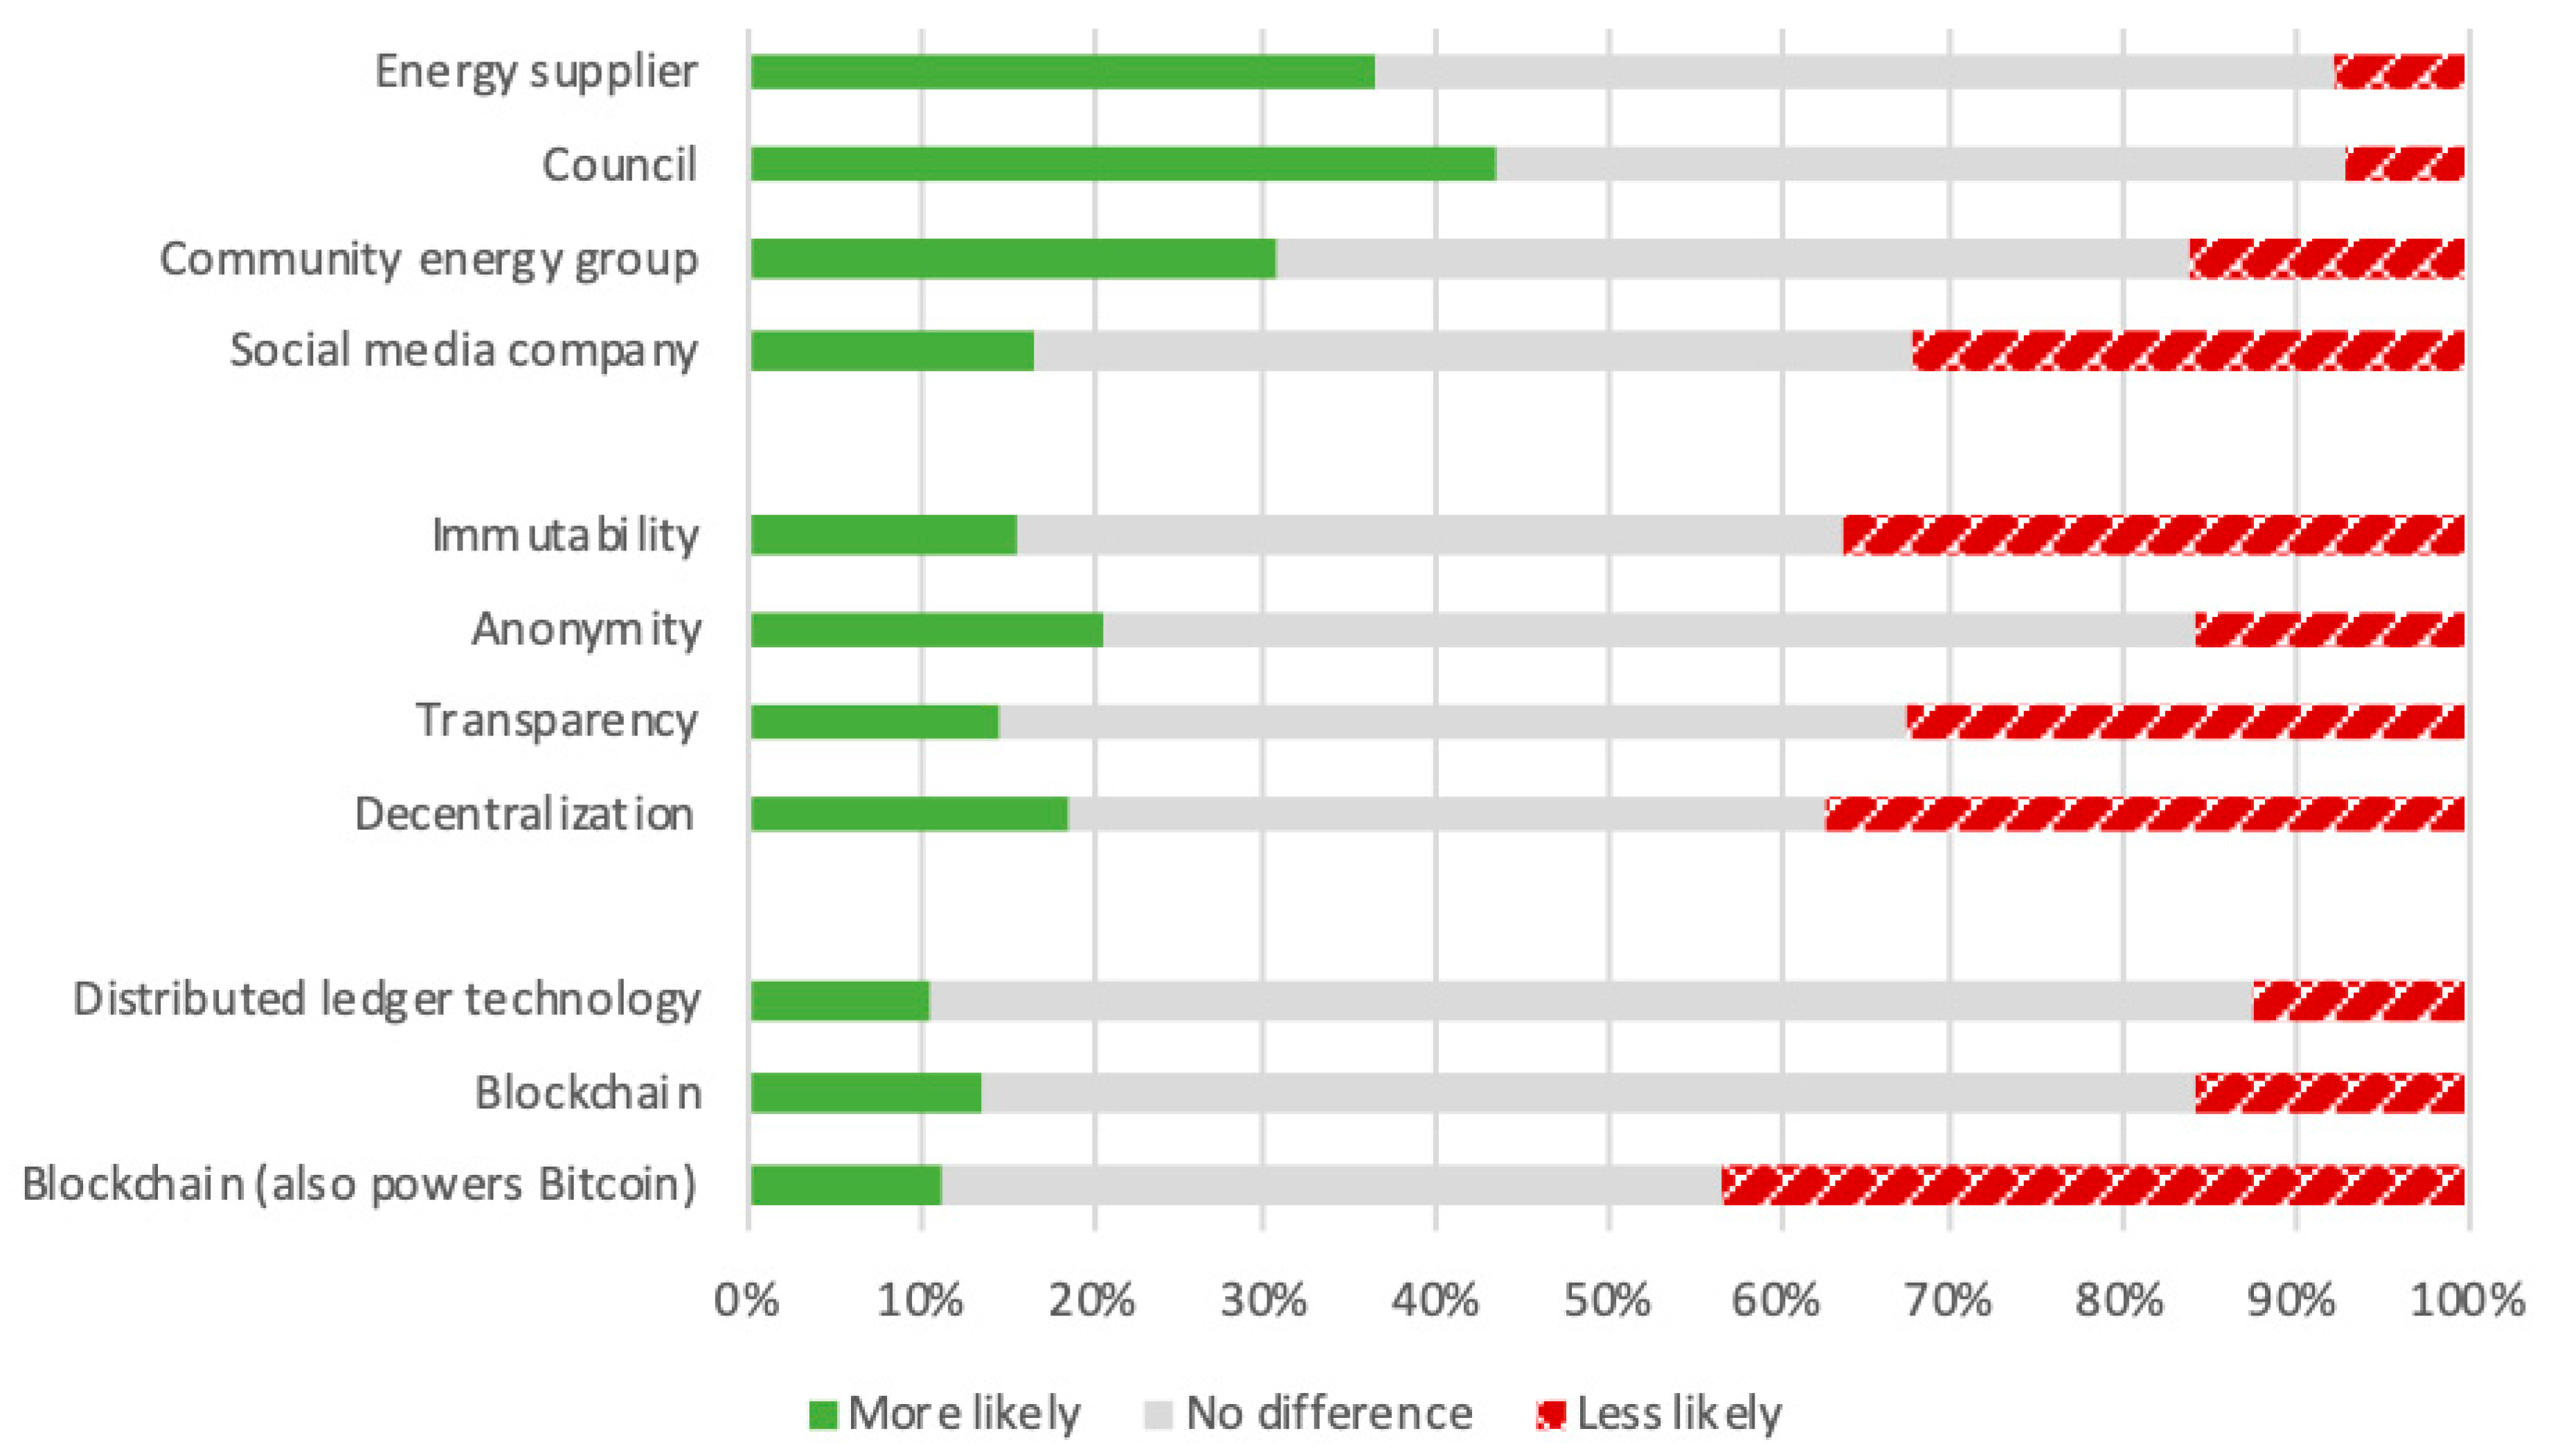
  • The identity of the coordinating entity (local council, energy supplier, community energy organization or social media company).
  • The highlighted characteristics of distributed ledger technology (immutability, anonymity, transparency or decentralization).
  • The term used to describe distributed ledger technology (distributed ledger technology, blockchain, or blockchain which is used to run Bitcoin).
We also investigated associations between uptake intention and a range of demographic and attitudinal variables. The method and results are set out below, followed by a brief discussion of the main findings as well as key recommendations for policy and industry stakeholders. We adhere as closely as possible to the CONSORT guidelines for reporting of randomized control trials [8].

1.2. Literature Review and Hypotheses

Consumer demand for peer-to-peer energy trading has been investigated to a limited extent in Europe. There is a small but growing body of work in this area, often based on surveys with fairly small, non-representative samples. Many studies on blockchain and energy, such as [9,10], mention peer-to-peer energy trading as one of the ways in which blockchain technology can be used within the energy sector. We have structured this literature review according to the sections of the study, namely findings relating to spatial scale and proportion of consumption, operating entity, technology characteristic and technology name.

1.2.1. Spatial Scale and Proportion of Consumption

A peer-to-peer energy trading network using blockchain technology could operate at a range of scales, from neighbourhood to national, as long as consumers remain connected through the energy grid and the Internet. Previous studies on energy trading have surveyed respondents on their preferences with regards to the locality of the sharing network, going up to county level. In a 2016 survey by Gstrein [11] of 154 consumers in Switzerland, participants preferred interacting in an energy-sharing arrangement with others in their suburb/block (65) or cities/villages (52), rather than their street (14) or direct neighbours (7). The authors speculate that this is due to participant awareness of the group size needed for a functioning arrangement [11]. Another relevant study is the one by Mengelkamp et al. [12] on German consumers’ preferences with regards to the design of local energy markets (LEMs). A survey of 417 consumers across Germany and 239 in the Allgäu region showed that local electricity is less valued than regional electricity, although neither are seen as particularly valuable. The authors speculate that this may be due to concerns around price, security of supply, and objections to local generation infrastructure.
However, studies have not yet given respondents the option of trading at the national level, which is something that is possible in a peer-to-peer energy trading scheme (e.g., sonnenCommunity in Germany) [2]. We identified no studies investigating consumers’ preferences when it comes to the proportion of their energy demand met by a peer-to-peer arrangement, as well as its link with preferences regarding the scale of locality.
Our survey asked energy consumers whether they would sign up to participate in a scheme that would enable them to purchase energy directly from other homes and businesses, with varying levels of consumption met (25%, 50% and 75%) as well as level of locality (neighbourhood; town/city/region; whole country).
Hypothesis H1.
Uptake will increase as a greater proportion of domestic electricity use is met through the peer-to-peer offering.
This is largely because the survey question indicates that energy bought through the offering would be slightly cheaper than that purchased from the consumer’s usual energy supplier, but we also expected other motivations (such as the ability to draw more on local renewable energy) to play a role. We had no hypothesis with regards to the preferred locality level.

1.2.2. Operating Entity

Permissioned peer-to-peer energy trading networks are likely be coordinated by a central entity. Previous studies on energy trading have already surveyed consumers’ views on potential entities that could oversee a P2P network. For instance, in a 2017 survey of 830 consumers in four European countries by Reuter and Loock [13], it was found that out of a choice of cooperative, municipality, electricity provider and telecommunications provider, cooperatives (consisting of citizens from the same neighbourhood) were chosen as the preferred entity to govern a market. These studies do not include new media companies (e.g., social media company), which we have included in our study because of the interest we believe such organizations could have in getting involved in P2P energy trading.
Our survey asked energy consumers whether they would be more or less likely to participate if the scheme was operated by their local council, a local community energy group, an energy supplier or a well-known online social media company.
Hypotheses H6.
Uptake will be highest in the “community energy group” condition. This is based on the finding by Reuter and Loock (2017) mentioned above.
Hypotheses H7.
Uptake of the social media condition will be positively associated with being younger. Social media use in the UK has been found to be highest in the 18–34 age bracket, with figures declining with age [14].

1.2.3. Technology Characteristics and Name

Regarding consumer expectations, Gstrein [11] found that transparency was valued as the most important characteristic of a local energy trading network (to 28% of respondents). Ecker et al. [15] concluded in 2016, when surveying 253 German homeowners on the desirability of exchanging self-generated energy with neighbours, that an emphasis on energy independence (i.e., autarky) made consumers more likely to raise the price of their self-generated energy, resulting in less peer-to-peer energy trading. The study by Mengelkamp et al. [12] found that data usage within local energy markets is of little importance to German consumers. While informative, these studies do not focus specifically on the characteristics of these arrangements’ underlying technology. We have also not identified any work which attempts to assess the characteristics of DLTs as they might be experienced by consumers in the context of energy. This survey aims to fill this gap, by surveying consumers’ perception of the properties that have been most used in the promotional language of blockchain energy businesses, namely the technology’s immutability, anonymity, transparency and decentralisation (the process is described in Appendix A).
Furthermore, there are no studies on (energy) consumers’ perception of the overall concepts of blockchain and distributed ledger technology. The news headlines on the steep rise and subsequent sharp fall in the value of Bitcoin and the thousands of other virtual currencies running on blockchains at the time of the survey, have perhaps shed a negative light on the technology [16]. This survey aims to investigate this, by testing whether the likelihood of participating in a peer-to-peer energy trading model would be affected by consumers’ awareness that blockchain, a distributed ledger technology and the technology behind Bitcoin, would be running the network.
Our survey described several characteristics of blockchain technology, such as its immutability, anonymity, transparency and decentralized nature, without naming the technology itself. Participants were then asked whether knowledge of such characteristics would make them more or less likely to participate in a P2P scheme. In the follow-up question, they were then told that the technology used to run the scheme is called ‘distributed ledger technology’, ‘blockchain’, and is the same technology as that used to run the online currency Bitcoin.
Hypothesis H8.
Early adopters are more likely than non-early adopters to respond that seeing mention of any of “distributed ledger technology”, “blockchain”, or “blockchain/bitcoin”, will increase their willingness to participate.
This is based on our informal observation that the awareness of the existence and nature of DLT in the wider population is limited, and that it is most likely higher amongst those who are interested in (and like to use) new technologies. We had no hypothesis with regards to the technology characteristics, as this is an exploratory section of the survey.

1.2.4. Consumer Profile

A survey was conducted by Hackbarth and Löbbe in 2017 [17] to test the attitudes, preferences and intentions of 4148 consumers in Southwestern Germany to participate in P2P energy models. It found that attitudes, rather than socio-demographic factors, more strongly determined consumers’ interest in participating. Those that were well-informed on the sharing of self-generated electricity and early adopters of new technologies, as well as in the 40–69 years old age bracket, were most interested in P2P. In 2017, Reuter and Loock [13] surveyed roughly 800 consumers in Switzerland, Norway, Germany and Spain on their interest in participating in local electricity markets. In contrast to the previous study, their results showed that the younger the age of the participant, the more interest there was in participating. This was also found by Mengelkamp et al. [12], along with the fact that larger households in Germany were more likely to participate in local energy markets. Our study aims to investigate these questions for the UK.
Participants in our survey were asked a series of questions relating to their age, income, occupation, as well as attitudes towards climate change, technology and access to renewable energy technologies.
Hypotheses H2.
Uptake will be higher amongst younger people. While the studies mentioned above find mixed results regarding an association between age and uptake, our previous research has demonstrated a slight preference amongst younger consumers to sign up with unconventional energy products such as time of use tariffs [18].
Hypotheses H3.
Uptake will be higher amongst participants with microgeneration, storage and/or smart home technologies. This is because those already benefiting from or having access to renewable energy installations are likely to see the advantages of participating in a P2P scheme (e.g., selling their own energy).
Hypotheses H4.
Uptake will be higher amongst early adopters. These consumers are (by definition) more likely to be open to trying a new business model being operated by a less-known technology such as blockchain.
Hypotheses H5.
Uptake will be higher amongst those who are concerned about climate change. Such consumers should be expected to perceive peer-to-peer energy trading favourably due to its use and support for renewable sources of generation.
The next section describes the methods we employed in this study.

2. Materials and Methods

The survey was conducted in the form of a series of sequential between-subjects experiments delivered as part of an online survey. It was administered by the market research firm Populus at the end of November 2018, as part of their omnibus, and the participants recruited from their consumer panel (i.e., people who have opted to participate in research for them) (For more details see https://www.populus.co.uk/how/omnibus/).
Quota sampling was used (with quotas for age, gender and region) in order to achieve a nationally representative sample for the United Kingdom. Our questions (see Supplementary Online Material for all scenarios and questions) were included at the beginning of the omnibus (i.e., before questions from other organizations), while a range of demographic variables were also recorded later on in the survey.
Table 1 provides an overview of the four separate experiments, while Table 2 makes clear the 3 × 3 factorial design employed in Experiment 1. Simple block randomization was used in order to obtain equal sized experimental groups, and participants were re-randomized before each experiment.
Figure 1 shows an example of a scenario participants would have seen in the survey. Note that the P2P scheme was framed as offering slightly lower prices for electricity purchased within it, and also mentioned the source of generation (solar power). We selected these general features because they are characteristic of early examples of such schemes [2]. We included graphics as well as text to make the experimental conditions as clear and visible as possible to participants.
We used binary logistic regression in SPSS 24 to analyse the data. Much of the analysis was specified in a pre-analysis plan (PAP) (Registered at https://aspredicted.org/c9kv9.pdf, registration number 17,407). Due to the restricted timescale of the work, this plan was written and pre-registered after receipt of the data. However, to preserve the benefits of pre-registration, the data was received and held by A.S., while the pre-analysis plan was written by M.F., before receiving the data from A.S. for analysis.
We deviated from this plan in a few minor respects, which are explained in the relevant parts of Section 3 (Results). Table 3 below sets out the three models used for data analysis, as well as the demographic variables recorded in the survey.
For Experiments 1 and 2, a ‘manipulation check’ question was included, to test whether participants correctly understood the spatial scale and proportion of consumption conditions. It asked whether the statements included in the manipulation check question correspond with the description of what they were offered in Experiments 1 and 2 (e.g., a scheme that could meet 75% of their electricity, at national level, offered by their local council). The flow diagram shown in Figure 2 details the participant journey through the survey.
Ethical approval was received for the study through the UCL Bartlett School of Environment, Energy and Resources ethics process, for which registration numbers are not assigned. The full survey dataset is available as Supplementary Material.

3. Results

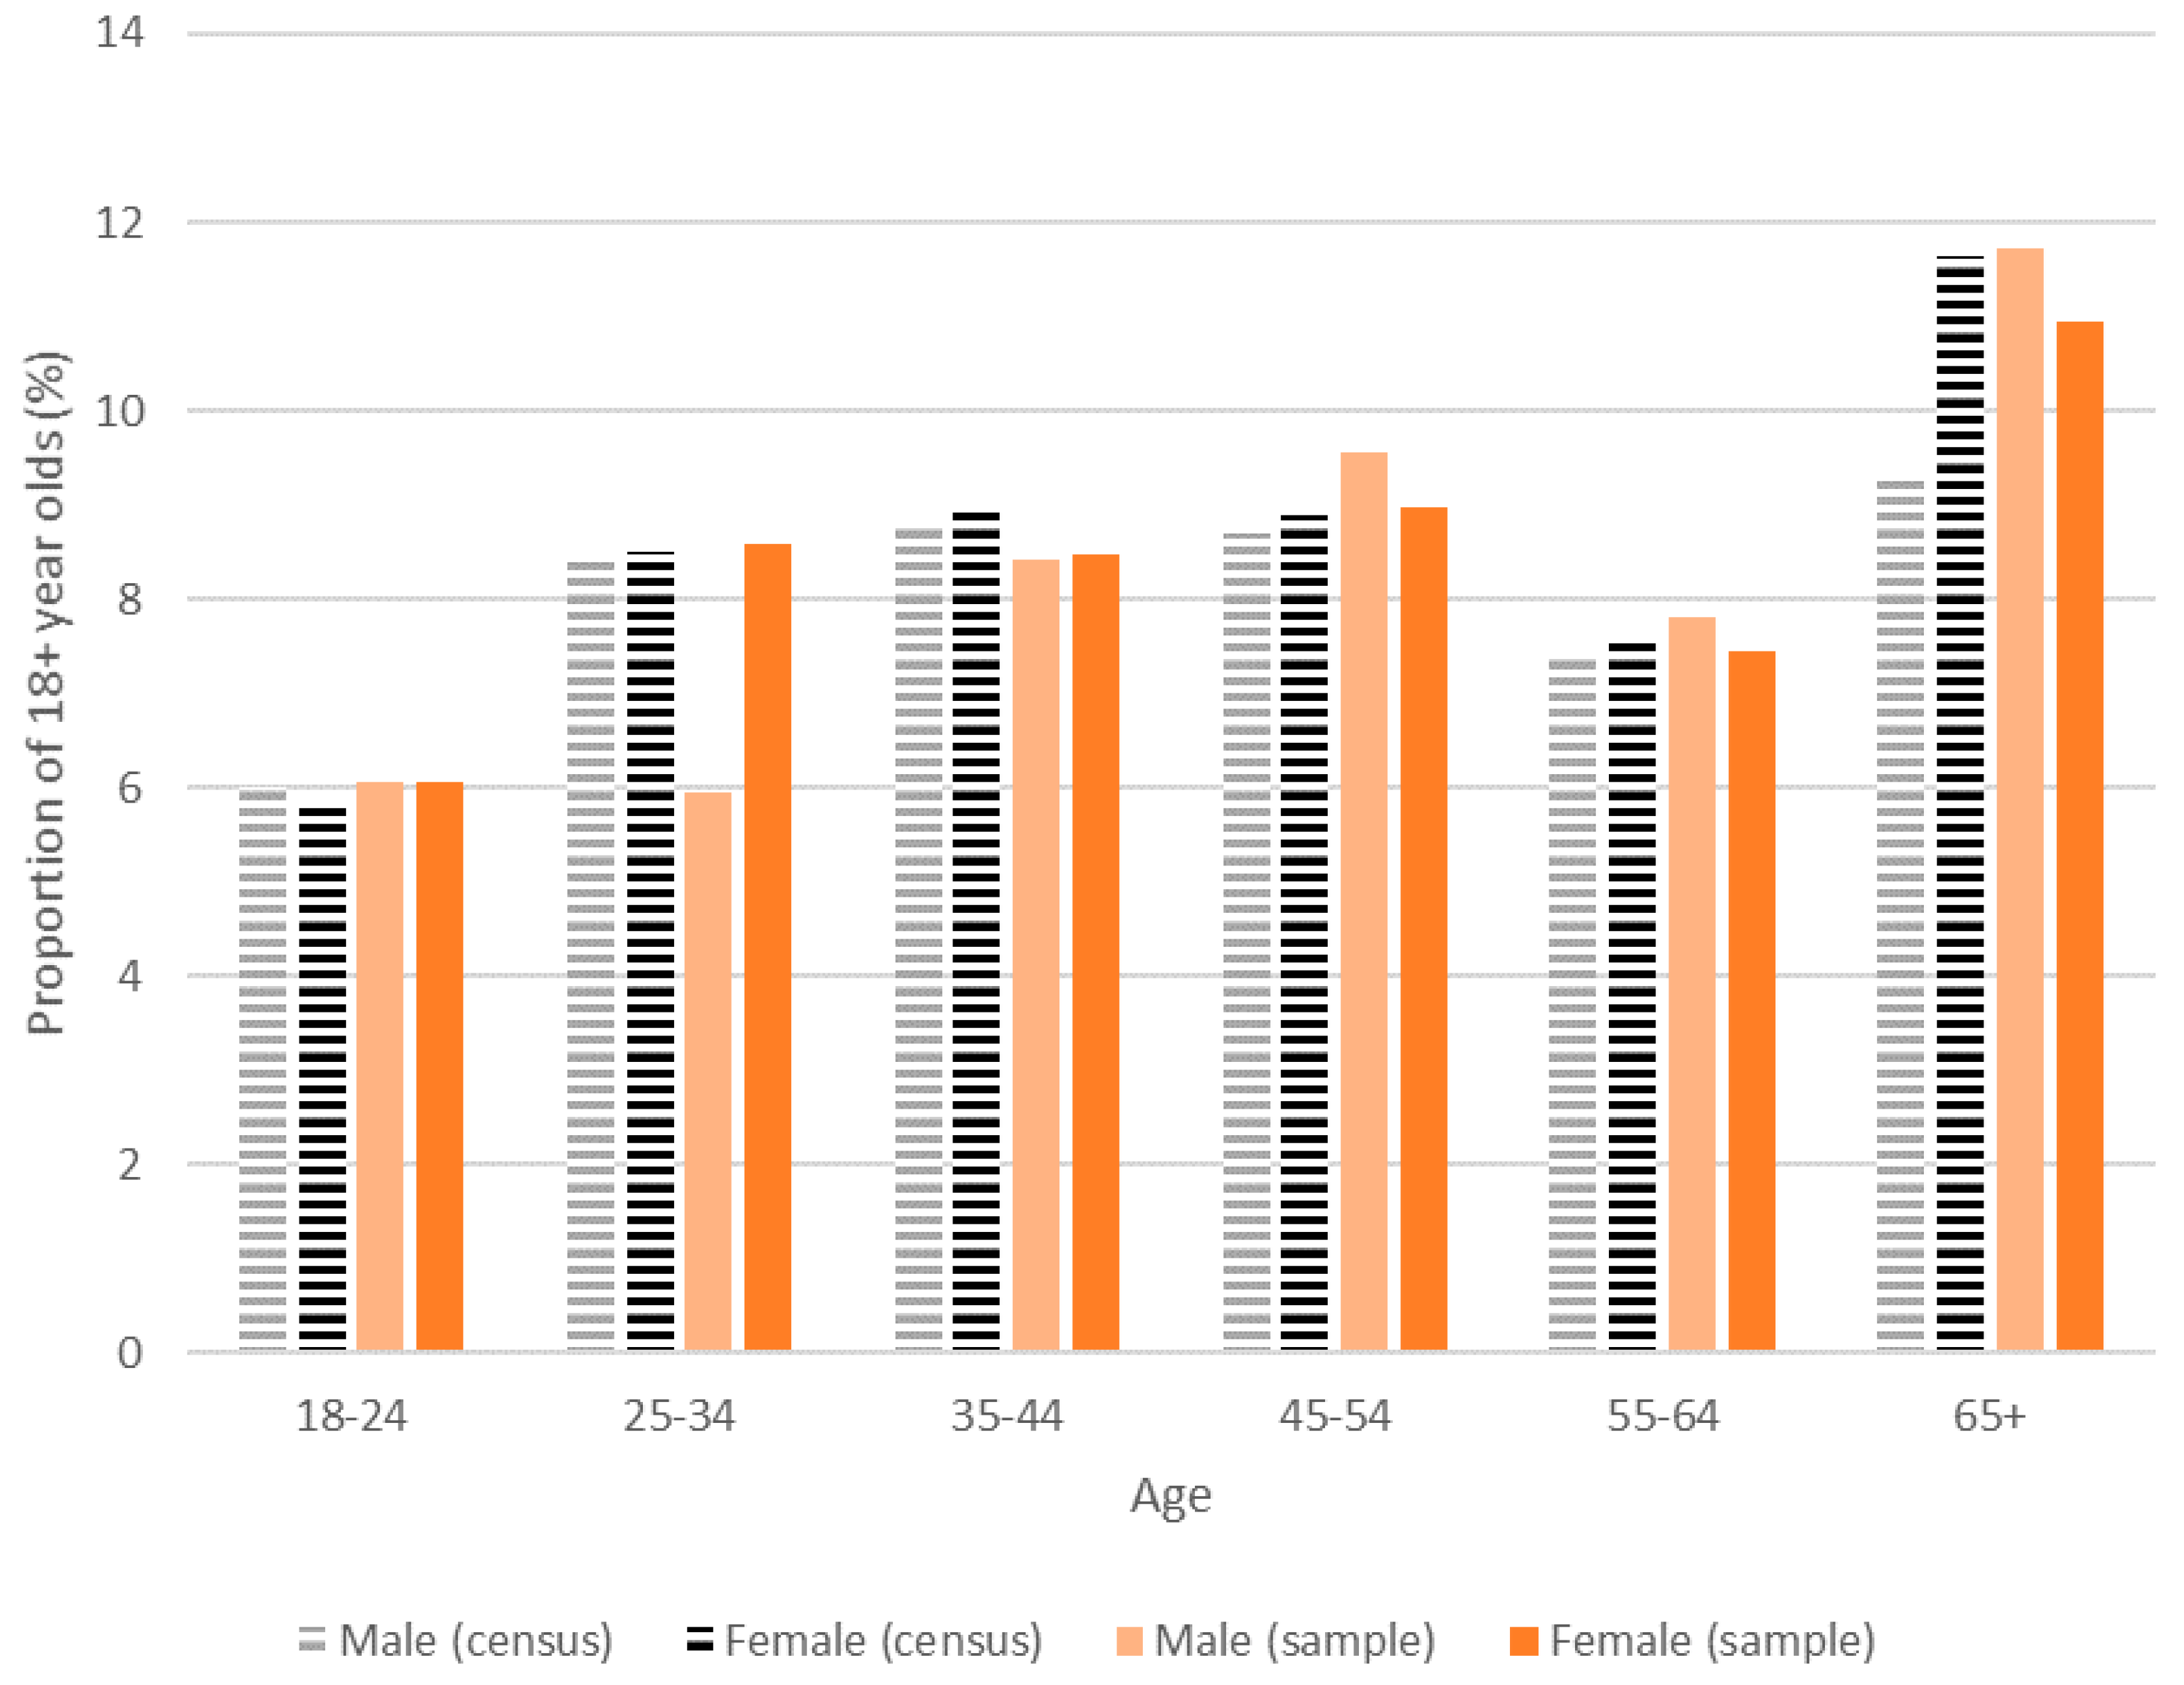
3.1. Overview of Sample

Figure 3 shows the age/gender breakdown of the sample, alongside UK census figures. A table showing the other main variables we recorded about the participants is included in Appendix B.
Visual inspection of Figure 3 reveals that the age/gender breakdown in the sample is broadly representative of that in the UK, with the exceptions that men aged 25–34 appear to be under-sampled, while men aged over 65 are over-sampled.

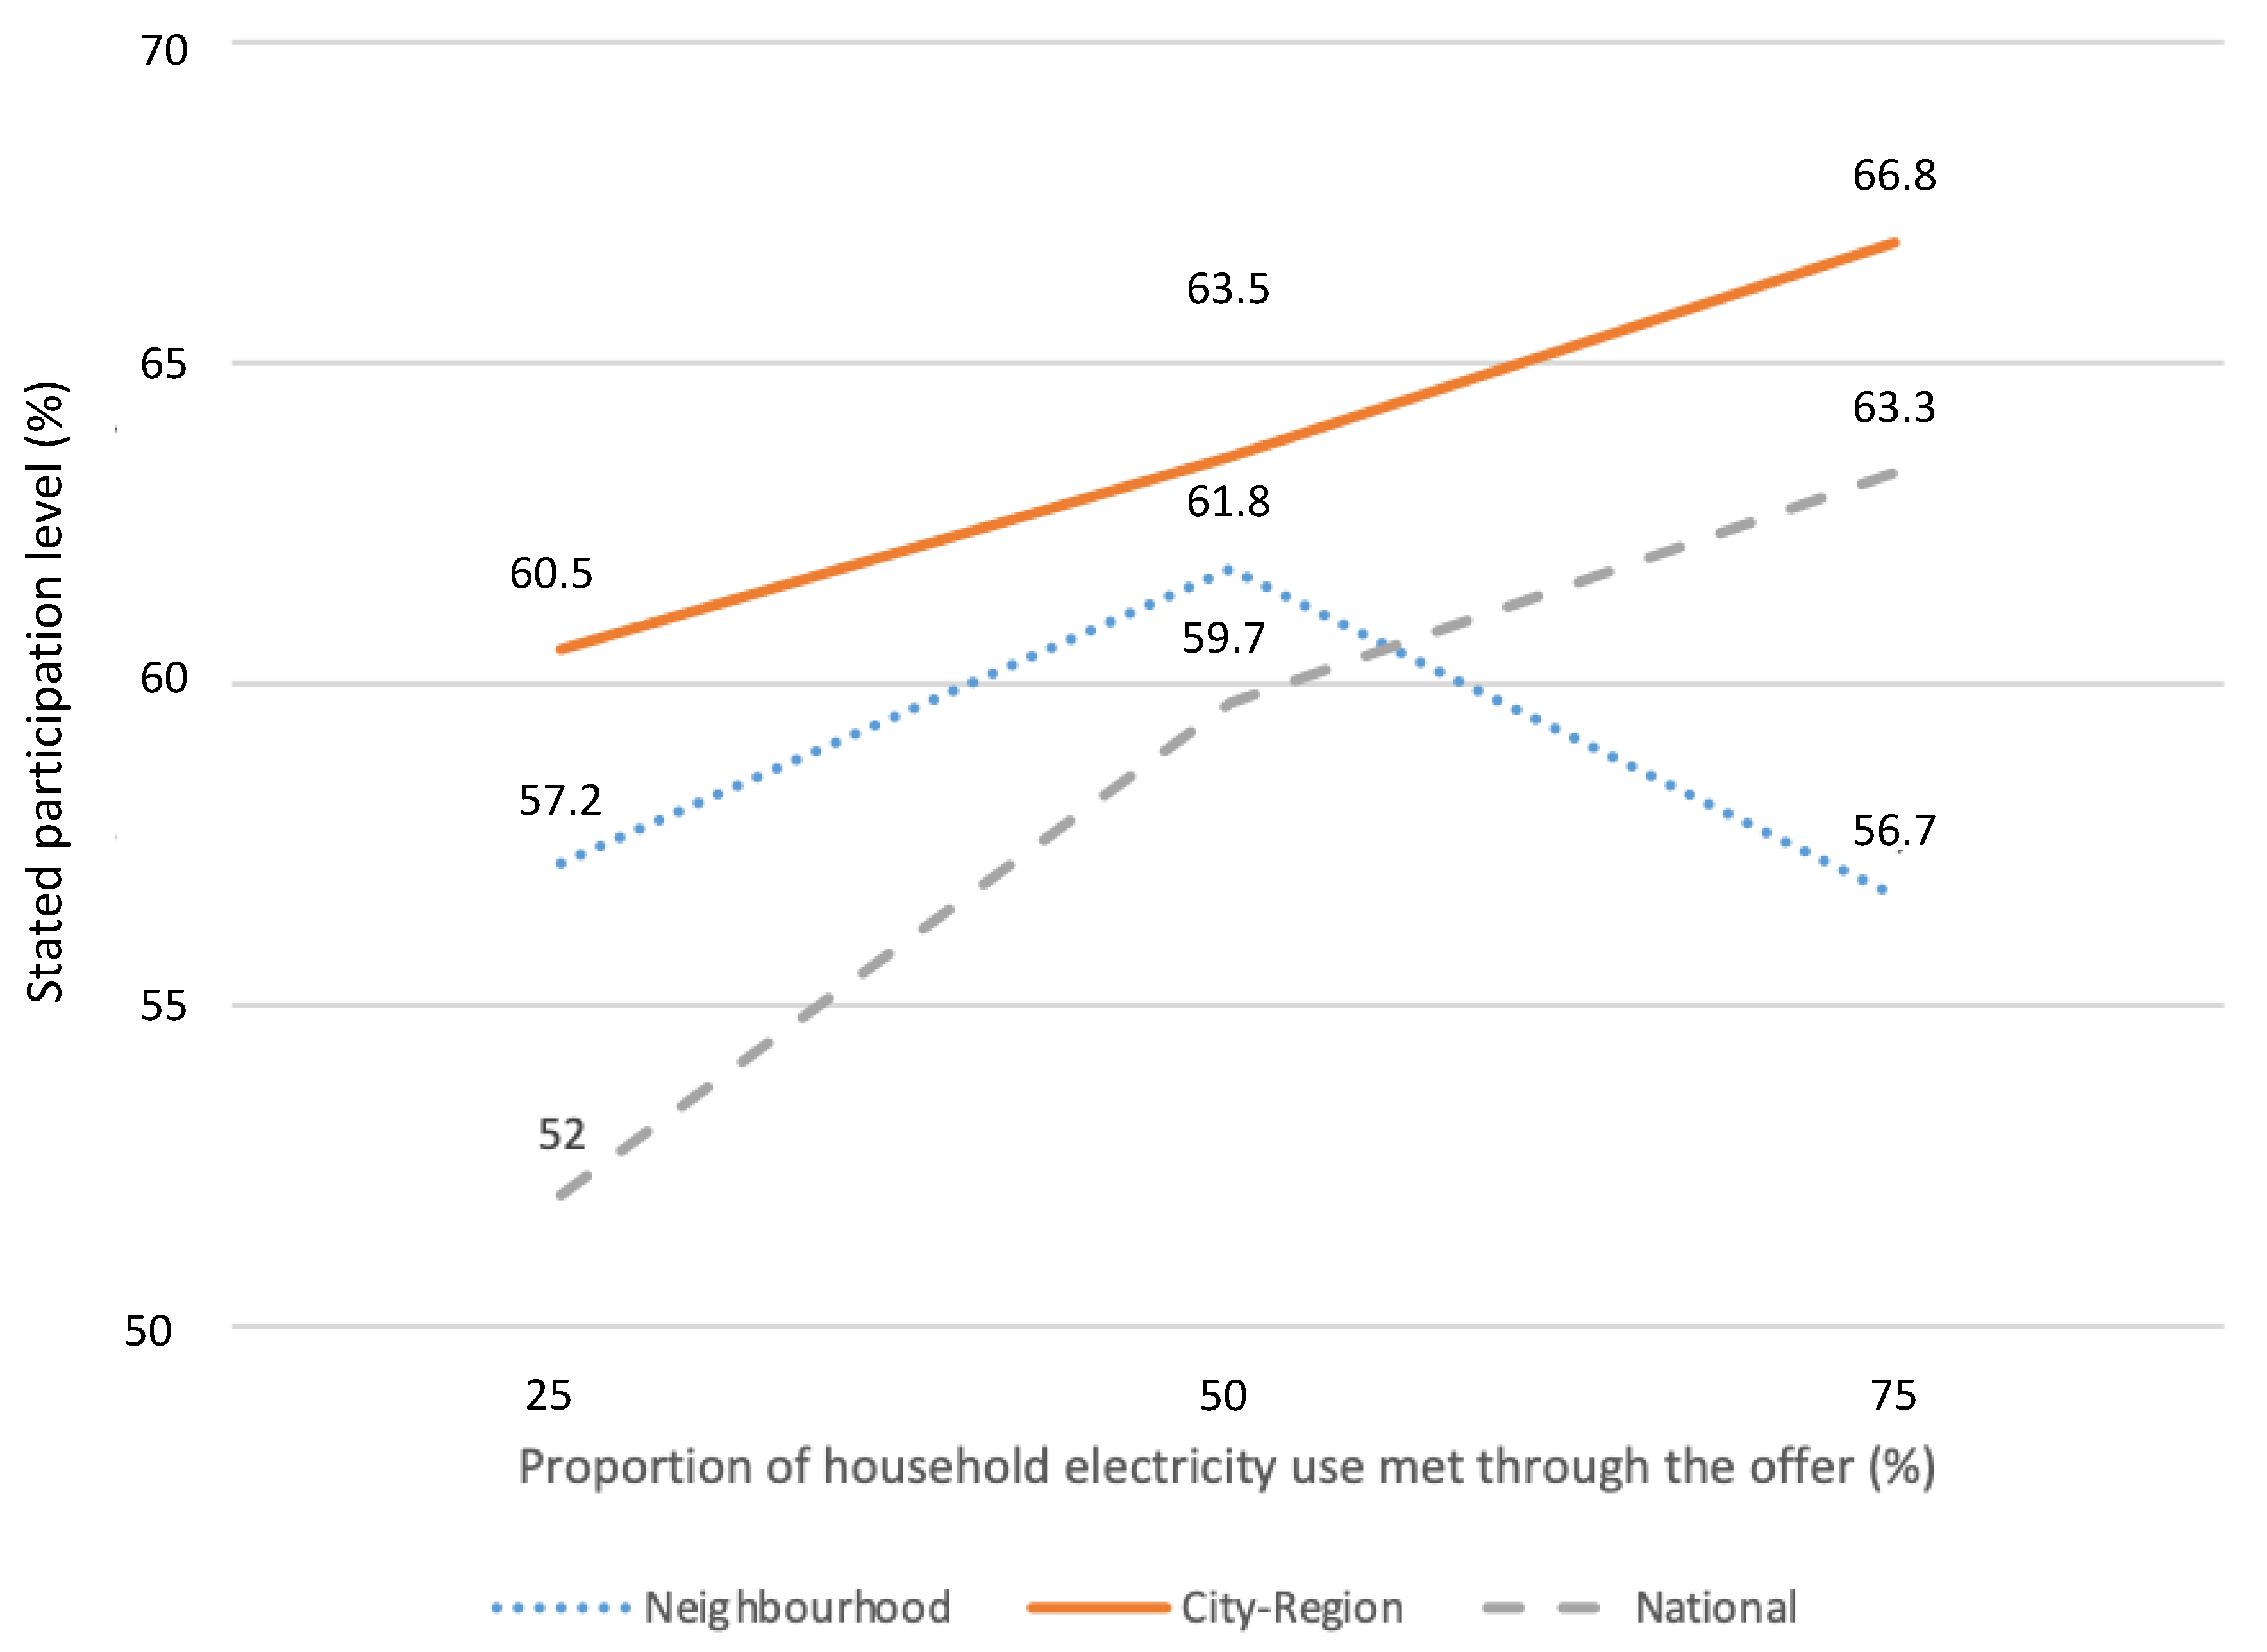
3.2. Experiment 1: Effect on Uptake of Spatial Scale and Proportion of Consumption Met

Figure 4 summarises the results of Experiment 1. This experiment set out to test the effect of varying spatial scales covered by the P2P electricity trading scheme (neighbourhood, city/region, national) and the proportion of household electricity use that could be expected to be met through the scheme (25%, 50% and 75%) on its uptake by participants.
As can be seen in Figure 4, stated uptake in our sample generally increased as the proportion of consumption met increased, except at the neighbourhood level, where it fell at 75% of consumption met to roughly the same value as at 25% of consumption met. The city/region level of spatial scale prompted the highest stated uptake at all levels of consumption met. Uptake at this scale had the highest value of all groups at 66.8% uptake, where 75% of consumption would be met through the scheme.
After city/region, uptake was highest in our sample for neighbourhood spatial scale followed by national scale at both 25% and 50% of consumption met, however, this ordering switched at 75% of consumption met due to the fall in neighbourhood-level uptake. National spatial scale prompted the lowest uptake value of all, with only 52% of people saying they would participate at 25% of consumption met. Overall, there was a difference of just under 15% between the highest and lowest uptake values.

3.2.1. Statistical Analysis

Logistic regression was used to make inferences from the sample to the wider UK population, the results of which are shown in Table 4.
In interpreting the results of Experiment 1, it is important to consider the results of the ‘manipulation check’ question in the survey. While 79.5% of participants correctly answered the manipulation check relating to the proportion of consumption met, only 62.6% were correct on the question relating to spatial scale, and 53.1% were correct on both checks. We believe there is a possibility that because the description of the offer stated that people would purchase any additional electricity (over and above that provided through the offer) from their usual supplier, this could have led to some ambiguity in the spatial scale manipulation check. This check asked participants to assess the veracity of the statement: “On the offer you would buy electricity directly from homes and businesses across the whole country” (i.e., national level).
While basic pre-testing using cognitive interview approaches did not highlight this ambiguity, because of the low pass rate, we are inclined to treat the result of this check with scepticism. For this reason, while we initially planned only to analyse the full sample and those who passed both manipulation checks, we included an additional analysis for those who correctly answered only the manipulation check on consumption met.
We also ran additional unplanned analysis in the form of model 1, which included only main effects (e.g., compare the overall group of 666 respondents who were shown 50% of consumption met with the overall group of 666 individuals shown 25%). This is as opposed to both main and interaction effects, which we specified in the PAP and which is now included as model 2. For example, the group of 222 respondents whose energy demand would be met by 25% by the scheme at neighbourhood level was compared with the group of 222 respondents whose demand would be met by 50% at region/city level. We added model 1 because, as discussed below, the larger group sizes available in this analysis increased sensitivity to smaller effect sizes—which we believe to be useful in the context of an exploratory study. It should be noted that the groups whose energy demand would be met by 50% and for which the P2P scheme would run at regional level, were used as reference categories in the analysis below.
These results present a mixed picture. There is little consistency between the different model results which would be expected for strong real effects. Notably, there were no significant differences for any of the model 2 analyses, which included interaction terms. This is likely due to the smaller group size that these analyses depend upon (as well as the possibility of multi-collinearity) which increases the effect size that we would be able to recognize.
Nevertheless, we observe a number of consistent significant differences across models 1 and 3 (which include only either main effects, or main effects and demographic/other variables). In model 1 (which includes only main effects), uptake is significantly lower when the offer is framed as national rather than at city/region level—both for the whole sample and when screening out people who failed the ‘consumption met’ manipulation check. The same effect is apparent in model 3 (which controls for demographic/other variables).
These significant results suggest people are only 88–92% as likely to participate in P2P trading when operating at the national level as compared to the city/region level (this is a risk ratio (RR), calculated by RR = OR/(1 − p + (p × OR)) where OR is the odds ratio and p is the probability of uptake). In model 3 (which controls for demographic and other variables), there is a consistent finding that there is a main effect of proportion of consumption met between the 25% and 50% (reference) levels, with uptake being higher when 50% of consumption is met. Specifically, when controlling for demographic and other variables, people are only 86–90% as likely to participate in P2P trading when it is presented as meeting 25% as compared to 50% of their consumption.
Further significant results are apparent for those analyses which include only those people who passed the ‘consumption met’ manipulation check. Neighbourhood-level framing is less popular with and without controlling for demographic/other variables, with people being only 90% as likely to participate compared to the city/region level. Suggesting that 75% of consumption will be met results in a significant increase in uptake, with people being 111% as likely to participate as compared to when 50% of consumption will be met (although this effect is not apparent when controlling for demographic/other variables).

3.2.2. Summary

In summary, we would characterise these findings as providing some provisional evidence that P2P schemes which offer 50% as compared to 25% of consumption will be more popular, with limited evidence that increasing this to 75% may increase uptake further. There is some provisional evidence that schemes which operate at the city/region level will be more popular than at the national level, and limited evidence that they will also be more popular than at the neighbourhood level.
Our hypothesis 1, that uptake would increase with a higher proportion of consumption met, is therefore tentatively confirmed. The interaction which is visible in the results in the sample (especially the decrease in uptake at neighbourhood level between 50% and 75% consumption met) does not appear significant in the statistical analysis, although this may be due to the smaller group size available at this level of analysis.

3.3. Experiments 2–4: Effect on Likelihood of Participation of Identity of Operator, DLT Characteristic Highlighted and DLT Term Used

Figure summarises the results of Experiments 2–4. These set out to test the impact on likelihood of uptake when varying the identity of the operator (Experiment 2), as well as the DLT characteristic (Experiment 3) and DLT name (Experiment 4) mentioned in the description of the P2P scheme.
As can be seen in Figure 5, in Experiment 2 (in our sample), the council was the entity most likely to make people want to participate in the P2P trading scheme, followed by the energy supplier, community energy group and finally the social media company. In Experiment 3, no condition makes participation particularly more attractive than the others. However, anonymity is substantially less off-putting than the others—that is, more than twice as many people said they would be less likely to participate if shown the immutability, transparency or decentralization scenarios compared to the anonymity one.
In Experiment 4, in our sample, the DLT name included in the description of the P2P scheme did not have a large effect on the proportion of people saying it would make them more likely to participate. However, the mention of ‘Bitcoin’ led to over 40% of respondents saying this made them less likely to want to participate in the scheme.

3.3.1. Statistical Analysis

In our pre-analysis plan, we anticipated using ordinal regression to analyse the data for these experiments, with the outcome variable on an ordered scale of likelihood of uptake being ‘more likely’, ‘no different’ or ‘less likely’. However, initial tests revealed that the assumption of proportional odds required for this test (i.e., that each input variable has the same effect at each cumulative split of the dependent variable) was not met. Instead, we therefore conducted two binary logistic regressions for each experiment—one comparing the outcome ‘more likely’ with other outcomes, the other comparing the outcome ‘less likely’ with other outcomes. Table 5 presents the results of these tests.
Looking first at Experiment 2, we observe that when the P2P scheme was framed as being offered by the local council, this significantly increased the chances of people saying they would participate, compared with if it was offered by an energy supplier (with a ‘risk ratio’ of 119%), the reference category. However, framing it as being offered by a community energy organisation or a social media company resulted in fewer people saying they would be more likely to participate, and more saying it would make them less likely (compared to when offered by an energy supplier). Indeed, telling people that it would be offered by a social media company resulted in more than a four-fold increase in the number of people saying this would reduce the likelihood of their participation. These findings apply both with and without the manipulation check, with the exception that framing as a community energy organisation is just as likely as an energy supplier to result in a ‘more likely’ response for those who passed the manipulation check.
In Experiment 3 on DLT characteristics, the only condition to differ significantly from the ‘immutability’ reference category was ‘anonymity’. When the anonymity characteristics of DLT were highlighted, people were 134% as likely to say they would be more likely to participate and only 43% as likely to say they would be less likely to participate.
In Experiment 4 on DLT name, the only significant effect was when blockchain was described as ‘the same technology used to run ‘Bitcoin’’. This description made significantly more people say this would make them less likely to participate, as compared to simply describing it as ‘blockchain’ (the reference category) (risk ratio of 273%).

3.3.2. Summary

In summary, we would characterise these findings as providing provisional evidence that blockchain-enabled P2P schemes run by the council (local authority), with an emphasis on anonymity and which do not explicitly mention the fact that it is the technology behind Bitcoin, will be more popular.
As a result of the analysis for Experiment 2, we do not have evidence to support our hypothesis 6, that an increase in uptake will be highest in the community energy group condition. Indeed, there is some evidence that this was less popular than when offered by an energy supplier, and it was substantially less popular than when offered by a local council. The least popular option by a considerable margin was when offered by a social media company.

3.4. Demographic and Other Variables

For each experiment, we also ran analyses to test the association between demographic, household, attitudinal and other variables and likelihood of participation (see the methods section for a full list of variables). For Experiment 1, this was achieved in model 3. For Experiments 2, 3 and 4, we departed from our PAP and ran separate binary logistic regression models for each experimental group. So, for example, we ran a model with the outcome variable being a dummy for ‘more likely’ to participate, with demographic and other independent variables, separately for each of the groups who saw council, community energy group, energy supplier or social media company. We did this because we were interested in whether any particular demographic/other characteristics were more likely to be associated with increased uptake in each separate group (which our original PAP would not have allowed us to do). The results of these regression analyses are summarized in Table 6, with effect sizes noted only for those variables which showed a statistically significant association with selecting ‘more likely’ to participate.
Due to the large number of significant impacts, we focus here on those which are either consistent across a number of experiments or we consider otherwise noteworthy.
The most consistent association is between reporting being very or somewhat concerned about climate change and being more likely to participate in the P2P scheme. Since climate concern was positively associated with uptake of P2P in general, our hypothesis 5 (see table below) is therefore supported. However, it is perhaps less clear why this should be associated with factors such as the scheme being offered by a social media company, or its immutability characteristics being highlighted. It is possible that such participants were simply more pre-disposed to signaling their general support for P2P trading and therefore select the ‘more likely’ option. It is noteworthy that this did not apply when Bitcoin was mentioned, which we speculate may suggest familiarity with the energy use implications of Bitcoin.
Another consistent association was between people having their own solar panels, electric vehicle, heat pump or battery and being more likely to participate. To a lesser extent, this also applied to people who reported having smart heating/lighting controls. Again, the positive association between these factors and uptake of P2P in general means our hypothesis 3 is supported.
Where age was a factor, younger people tended to be more keen to participate—including for P2P in general. Our Hypothesis 2 was therefore supported, as is our hypothesis 7 that being younger would be positively associated with increased uptake under the social media company condition.
We also hypothesised that uptake of P2P in general would be associated with being a (self-reported) early adopter of technology (Hypothesis 4), and that this factor would also be positively associated with mention of DLT, blockchain or Bitcoin increasing the likelihood of participation (Hypothesis 8). Both of these hypotheses were supported (with the caveat that mention of ‘blockchain’ only had no impact on intended uptake amongst early adopters).
Aside from these consistent or hypothesised effects, a number of others are worth highlighting. Firstly, even controlling for all the other variables included in the regression, men are slightly more likely to say they would participate in a P2P trading scheme than women and also appear to be more interested when the decentralised nature of the technology running the offer is highlighted, or blockchain is mentioned. There are similar (unexpected) associations with households which include children. There is no obvious explanation for these findings, but they may be worthy of some further investigation. The only association with living in a rural location was with the ‘community energy group’ condition, which prompted rural dwellers to increase their likelihood of participation.

Summary

In summary, the analysis of demographics and other variables shows that a blockchain-enabled P2P trading scheme of the kind we described would be most popular with individuals that are concerned about climate change, have their own renewable energy installation, are early adopters of technology and are of a young age.
In conclusion for this section, Table 7 indicates which of our original hypotheses were supported as well as summarizing the other key findings. In the next section, we discuss possible interpretations of the findings and their implications for policy, business and research.

4. Discussion

The results provide an interesting picture of what UK energy consumers would value in a blockchain-enabled peer-to-peer energy trading scheme, while also raising several important questions.

4.1. Spatial Scale and Proportion of Consumption

We found that consumers would rather purchase energy from prosumers in their city or region than from prosumers nationally or in their direct neighbourhood, no matter the level of consumption met. This is a similar finding to that of Gstrein [11] and Mengelkamp et al. [12].
Since resource constraints did not allow us to include questions to understand consumer motivations for these choices, we can only speculate as to why this may be. Given that the neighbourhood-level offering was less popular at 75% than at 50% of consumption met, it may be that they did not consider meeting such a high proportion of their consumption for very local sources to be plausible (as was concluded in the Gstrein study). The security of supply concerns when energy is purchased locally and regionally in the Mengelkamp study echo this. The city/region level may have provided a ‘sweet spot’ between the neighbourhood and the national level offering, the latter of which may not have the attraction sometimes attached to local products and services (such as food [20]). Given the relative attractiveness of anonymity highlighted in our Experiment 3, it is possible that the city/region level provided an attractive balance of localness and anonymity. Further work could usefully investigate this further. The selection of spatial scale for trading also has implications for another key variable we investigated—proportion of consumption met.
While we found that meeting a higher proportion of electricity consumption was generally more attractive (in line with our expectation), we have only measured values at a (relatively crude) three levels—25%, 50% and 75%. We did this because it provided a wide initial spread for an early study in this area. However, we know that currently, UK households with their own solar microgeneration are thought to self-consume about 45% of their generation [21]. This suggests that, depending on precise trading conditions, the proportion of consumption met by non-generating P2P participants is unlikely to exceed 50% and may be significantly lower depending on the proportion of prosumers to consumers. This raises further important questions.
Firstly, it will be important to understand the effect of proportion of consumption met at the lower end of the scale—that is, between 0–25%. How attractive, for example, would a scheme be that meets just 5% of a participant’s consumption? And what is the difference between giving an average value over a year such as this, or spelling out the (potentially substantial) range that might exist between summer, with its high generation potential, and winter? Further work could usefully explore this, along with possible explanatory factors and possible interactions, such as altruism (e.g., by being able to subsidize energy for friends or a local school), as on the basis of our work, we are unable to say if participants were attracted by the potential to make financial savings or by other factors.
Important questions are raised about the dynamic nature of participation in P2P trading schemes. As new prosumers and consumers opt to join, the proportion of their consumption that consumers might expect to meet will be in a constant state of flux. A scheme which sees strong growth in consumers relative to prosumers will see the average proportion of consumption met under the scheme drop. If, for example, a scheme were to see 100 new consumers for every new prosumer, the proportion of consumption likely to be met through the scheme would be approximately zero. While our findings suggest this might be to a certain extent self-regulating (i.e., a scheme which meets such a low proportion of consumption may not be attractive for new participants), we do not know if this holds for existing participants, or for low levels of consumption met (see previous paragraph). It also suggests there may be an important role for ‘curation’ of scheme membership, such as through prosumer lock-in to ensure enough participants are generating energy in the winter, in order to balance production and consumption at meaningful levels. However, this, in turn, has implications for who gets to benefit from the lower prices that such schemes could offer, how limited generation gets apportioned, and how you control who joins or leaves.
It is instructive to consider a possible scenario by which the P2P energy trading schemes might be expected to develop. On the face of it, our finding that the city/region level is the most attractive to consumers suggests this would be the best spatial scale for operators to establish P2P trading schemes. However, given the still relatively low level of distributed energy resource penetration in most countries, and the extreme novelty of P2P energy trading in general, it may be easier initially to ‘curate’ an appropriate balance of generation and consumption at the national level (as it provides a larger pool of potential participants). After all, 63% of the survey respondents said that they would sign up to a P2P scheme if 75% of their consumption were to be met at the national level. In due course, participation levels may increase such that individual cities or regions, (or even neighbourhoods) have viable levels of production/consumption to support smaller schemes—with larger schemes splitting into smaller ones in a process similar to biological cell division. This provides a possible route by which P2P energy trading could be introduced, but does itself raise important questions about the different technical and social roles it would fulfil at different spatial scales. These are all fertile areas for future investigation.

4.2. Operating Entity

In the foregoing discussion, we raised the question of who gets to control and curate participation in a (permissioned) P2P trading network. We found that established authorities, such as energy suppliers and the council, would be attractive as P2P scheme organizers. As peer-to-peer trading between consumers would require numerous safeguards, in light of potential threats to (for instance) consumer rights and the grid infrastructure, local authorities could be well-placed to ensure such protections while taking at least some role in running the scheme. They would probably need to work with other entities providing the platform infrastructure.
Based on our results, entities such as social media companies, community energy groups and blockchain energy start-ups appear to be less attractive to consumers. They should therefore look into partnering up with local authorities, or energy suppliers, in their ventures. Policymakers should also ensure that there is legal clarity as to the way in which such entities safeguard the rights of consumers participating in peer-to-peer energy transactions, and consider where exactly the responsibilities of collaborating partners extend and overlap. It should be noted that press coverage on apparent data mishandling by Facebook such as the Cambridge Analytica story [22] was prominent at the time of the survey and could have influenced participants’ views of social media companies. This negative view could change with time. Furthermore, the lack of popularity of community energy groups amongst respondents could be due not necessarily to a lack of trust but rather a lack of awareness of these groups.
The question of consumer appeal is not the only crucial factor determining who will be responsible for running P2P networks, but also organisations’ ability and motivations to do so, which deserves further research. For instance, energy suppliers have privileged access to valuable energy data, making trading possible. If a local council were to run the network, it would need to obtain this data from the supplier. This could make the system more inefficient. Some entities might be more suitable depending on the motivations of participating consumers. For instance, a community energy group could be a better fit for a community trading with underlying motivations of social cohesion and a preference for an equitable distribution of energy and profits. Should participants prefer to trade with friends or family, a social media entity could be more suitable. On the other hand, the motivations of the responsible entity are also likely to impact its relationship with consumers. Organisations such as an energy supplier or social media company are likely to act with profit-driven motivations, whereas a local council could strive to meet policy aims such as renewable energy targets.
The locality of trading is an additional important factor to consider when determining the responsible entity. For a nationwide P2P network, a social media company would make more sense, whereas a local council or community energy group would not due to their local character. Also, an energy supplier running a nation-wide P2P network could raise antitrust issues. These questions should be investigated in further research.

4.3. DLT Characteristic Highlighted and DLT Term Used

In the age of the General Data Protection Regulation (GDPR) (Regulation (EU) 2016/679) and data privacy concerns, anonymity is important to energy consumers, as evidenced by the results of Experiment 3. This may also explain the fact that the option of a social media company running the scheme was the least popular with respondents in Experiment 2. It seems that characteristics not having a direct impact on their wellbeing, such as immutability, transparency and decentralisation, are perceived as being less crucial. As long as the platform runs properly, the technology and its operational specificities are not important. Businesses and policymakers should therefore limit their consumer messaging to the technology properties relating to personal wellbeing, such as anonymity. This finding is not only relevant to P2P energy trading schemes, but also to other forms of blockchain-enabled P2P models. The communication around a technology will have an impact on uptake, which will eventually define its success rate.
The finding that the likelihood of participating in the P2P scheme did not generally change when the technology was named, supports the conclusion in the previous paragraph that the type of technology running the scheme and its specificities are of low importance to consumers. However, the mention of Bitcoin caused a significant negative reaction in respondents. This is likely due to a combination of media stories around the extreme price instability of Bitcoin around the time of the survey (e.g., [23]), as well as general associations people may have between Bitcoin and factors such as its high energy use [24] and use in illegal activities [25]. It should be noted that blockchain is not the same as Bitcoin, as the latter is only one of thousands of ways in which the technology can be used [26]. Policymakers and businesses should not equate blockchain with Bitcoin in their messaging and policy outputs. However, they should be alert to the possibility that others (such as the media) may well make this conflation and be ready to respond with clear explanations about the differences.

4.4. Sample Characteristics

It is no surprise that consumers who are concerned about climate change are early adopters of technology, young, have their own renewable energy installations, and are most interested in participating in P2P trading. This is backed by previous studies, referred to in the literature review, such as those by Hackbarth & Löbbe [17] and Reuter & Loock [13]. The fact that those with installations are interested bodes well for P2P schemes, since such users are more likely to be able to provide generation or flexibility services. This is important in the situation (as seen in Experiment 1) where consumers may be more attracted by schemes that promise to meet a higher proportion of their consumption.
Most energy consumers do not fit the profile described in the previous paragraph. Businesses and policymakers working on P2P energy trading schemes will therefore have to find ways to capture the interest of these other consumers—namely those that are older, less concerned about climate change and not early adopters of technology. Benefits such as the anonymity provided by the technology, as well as a potential reduction in energy bills resulting from participation in the P2P scheme, could be used to try to appeal to them. The P2P trading platform should be user-friendly, using a simple interface with trading preferences being set automatically and needing minimal intervention, to be suitable for use by less technology-knowledgeable consumers. Furthermore, enabling P2P schemes to be run by (or with involvement of) entities such as the council or energy supplier could help attract cautious consumers.
The type of survey respondents most interested in P2P energy trading, namely early adopters of technology, and those having their own renewable energy installations, are more likely to be wealthier. Furthermore, the fitting of renewable energy installations at home is possible if one has the space (i.e., large enough dwelling) to do this, which is only the case for a proportion of the UK population. Organizations and policymakers should prepare for questions around the inclusiveness of such P2P networks. Consumers that are not able to participate due to not being able to afford technology to run the network, such as an internet connection or smart phone/computer, are likely to be left out from P2P networks and have to bear higher energy costs such as those related to maintaining the proper functioning of the energy grid. The behavior of wealthier participants might also have an impact on the price of traded energy, which could be driven up and exclude those less well-off. These challenges present plentiful opportunity for future research.

4.5. Key Limitations

Since the study was conducted online, it excluded those consumers that have limited access to the internet or a smartphone (around 10% of households in Great Britain [27]). We defend this on the basis that internet access is very likely to be a necessary prerequisite to participate in P2P trading, but it is important context for the demand levels we present. Furthermore, because of the known gap between stated intentions and actions (e.g., [28]), we take consumers’ answers as indicative of their general willingness to participate, with an expectation that real participation rates are likely to be significantly lower, at least in the near-term.
In Experiment 3, we tried to balance positive and negative aspects in our descriptions of characteristics of DLTs, but it is possible that the particular positive/negative aspects we selected to highlight for each had an impact on which characteristics were favoured. Furthermore, we do not expect scheme operators to spell out DLT characteristics as we have done in the survey. Nevertheless, our findings give an insight into what factors might be of more or less interest to UK consumers.

5. Conclusions

In this study, we investigated consumer demand for blockchain-enabled peer-to-peer energy trading using an online survey experiment with a nationally representative sample of around 2000 UK-based consumers. Generally, we found substantial interest in participating as a consumer in P2P trading, with just over a half to two-thirds of participants (depending on experimental condition) saying they would participate in such a scheme if it were available to them today. This should be an encouraging finding for organizations exploring or developing offerings in this area.
Results from Experiment 1 provide provisional evidence that the more of their household electricity consumption consumers can expect to meet through a P2P scheme, the more attractive it will be. More precisely, schemes which offer to meet 50% as compared to 25% of consumption appear to be more popular, with limited evidence that increasing this up to 75% may increase uptake further. There is further provisional evidence that schemes which operate at the city/region level will be more popular than at the national level, and limited evidence that they will also be more popular than at the neighbourhood level. While this suggests that city/region-level schemes may be the most sensible for those developing P2P initiatives, the differences are not very large, and other factors such as the ability to recruit the right balance of prosumers and consumers are likely to be important considerations. We point out further important questions connected with balance and scale in our discussion in Section 4.
Presenting a P2P trading scheme as being operated by a local council makes people more likely to say they would participate, followed by the energy supplier, community energy organization and social media company. This suggests that getting local authorities involved in P2P trading—whether in directly running them, or acting in an endorsing or overseeing role—could help increase overall uptake. Regarding the messaging related to the characteristics and terms used to describe distributed ledger technology, P2P schemes where the messaging places an emphasis on anonymity, and which do not mention the fact that blockchain is the technology behind Bitcoin, are most popular. It will be important for scheme operators to consider the negative impact that associations made elsewhere—such as in the press—of the relationship between DLT in general and Bitcoin could have for the popularity of blockchain-enabled P2P trading.
Lastly, analysis using socio-demographic data suggests that those consumers that are concerned about climate change, early adopters of technology, young, and owners of renewable energy installations are most interested in participating in a blockchain-enabled P2P trading scheme. They are likely to constitute the early target market for such schemes, however, this finding does also give an early indication of those consumer groups at risk of missing out on the benefits of participating in P2P trading.

Supplementary Materials

The following are available online at https://www.mdpi.com/1996-1073/12/20/3913/s1: Full survey and scenarios; and at https://www.mdpi.com/1996-1073/12/20/3913/s2: Survey data.

Author Contributions

Conceptualization, M.J.F., A.S. and D.S.; methodology, M.J.F., A.S. and D.S.; software, M.J.F. and A.S.; formal analysis, M.J.F.; data curation, M.J.F.; writing—original draft preparation, M.J.F. and A.S.; writing—review and editing, M.J.F., A.S. and D.S.; visualization, M.J.F.; project administration, A.S.; funding acquisition, D.S.

Funding

This research was principally funded by EPSRC grant PETRAS Internet of Things (IoT) Research Hub under the project The Internet of Energy Things (‘P2P-IoET’), grant number EP/N02334X/1. Additional funding was received through the UKRI Centre for Research into Energy Demand Solutions (grant number EP/R035288/1).

Conflicts of Interest

The authors declare no conflict of interest.

Appendix A

In the table below, the messaging of several start-ups working with blockchain and energy on the technology is set out. It should be noted that this is the messaging used by companies at the time of the survey (October 2018).
Table A1. Summary of company messaging.
EntityMessaging
LO3 Energy (https://lo3energy.com/)Comfort; security; democratized marketplace; transparency; secure transactions; verifiable.
Electron (http://www.electron.org.uk/)Efficient, resilient and flexible systems; secure, robust and transparent platform; in control of own data; democratic; inclusive; fair.
Verv (https://verv.energy/)Take control of data; reduction in energy bills; innovate and create own trading community.
HDAC (https://www.hdactech.com/)Confidentiality; integrity; anonymity; automated; low-cost transactions; everyone has access to the market; customers will be able to check the orders to ensure efficiency and accuracy; secure.
The main themes in the messaging are: security and robustness of the system (purple); confidentiality (blue); democratisation/lack of centralised control (orange); and transparency (green). These are referred to in the questionnaire by using the keywords ‘immutability’, ‘anonymity’, ‘transparency’ and ‘decentralisation’.

Appendix B

Other variables recorded for the sample.
Table A2. Other variables recorded for the sample.
VariableSample Proportion
Type of energy supplierBig six energy supplier (62.7%), others (37.3%)
Dwelling typeLive in house or bungalow (77.2%), live in flat or apartment (20.6%), other dwelling (2.2%)
TenureOwned (56.7%), rent from council or housing association (22.8%), private rent (18.4%), other tenure (2.1%)
Urban/ruralLive in city or town (81.3%), live in village or isolated (18.7%)
ChildrenChildren in household (28.9%)
Employment statusIn full-time employment (38.7%)
Household incomeUp to £21k (39.9%), £21-40k (38.7%), £41k+ (14.9%)
Home technologiesHas one of photovoltaic panels, electric vehicle, heat pump or home battery (8%), has smart heating/lighting controls (10.8%)
Climate concernVery or fairly concerned about climate change (67.1%)
Early adopter statusSelf-reported very or fairly early adopter of technology (24.7%)

References

  1. Zahedi, A. Maximizing solar PV energy penetration using energy storage technology. Renew. Sustain. Energy Rev. 2011, 15, 866–870. [Google Scholar] [CrossRef]
  2. Zhang, C.; Wu, J.; Zhou, Y.; Cheng, M.; Long, C. Peer-to-Peer energy trading in a Microgrid. Appl. Energy 2018, 220, 1–12. [Google Scholar] [CrossRef]
  3. Shipworth, D. Peer-to-Peer Energy Trading Using Blockchains. DSM Spotlight Newsl. Int. Energy Agency Demand-Side Manag. Programm. 2017, 67, 5–9. [Google Scholar]
  4. Nakamoto, S. Bitcoin: A Peer-to-Peer Electronic Cash System. 2008. Available online: http://citeseerx.ist.psu.edu/viewdoc/summary?doi=10.1.1.221.9986 (accessed on 18 September 2019).
  5. Plewnia, F. The Energy System and the Sharing Economy: Interfaces and Overlaps and What to Learn from Them. Energies 2019, 12, 339. [Google Scholar] [CrossRef]
  6. Nguyen, C. Brooklyn’s ‘Microgrid’ Did Its First Solar Energy Sale; VICE: Brooklyn, NY, USA, 2016. [Google Scholar]
  7. Stoker, L. Peer-to-Peer Trading, Renewables and Blockchain: What’s Inside Ofgem’s ‘Regulatory Sandbox’; Current News: London, UK, 2017. [Google Scholar]
  8. Schulz, K.F.; Altman, D.G.; Moher, D. CONSORT 2010 Statement: Updated guidelines for reporting parallel group randomised trials. BMJ 2010, 340, c332. [Google Scholar] [CrossRef] [PubMed]
  9. Andoni, M.; Robu, V.; Flynn, D.; Abram, S.; Geach, D.; Jenkins, D.; McCallum, P.; Peacock, A. Blockchain technology in the energy sector: A systematic review of challenges and opportunities. Renew. Sustain. Energy Rev. 2019, 100, 143–174. [Google Scholar] [CrossRef]
  10. Goranovic, A.; Meisel, M.; Fotiadis, L.; Wilker, S.; Treytl, A.; Sauter, T. Blockchain applications in microgrids: An overview of current projects and concepts. In Proceedings of the IECON 2017-43rd Annual Conference of the IEEE Industrial Electronics Society, Beijing, China, 29 October–1 November 2017; pp. 6153–6158. [Google Scholar]
  11. Gstrein, M. Handling the Crowd—An Explorative Study on the Implications of Prosumer-Consumer Communities on the Value Creation in the future Electricity Network. Ph.D. Thesis, University of Fribourg, Fribourg, Switzerland, 2016. [Google Scholar]
  12. Mengelkamp, E.; Schönland, T.; Huber, J.; Weinhardt, C. The value of local electricity—A choice experiment among German residential customers. Energy Policy 2019, 130, 294–303. [Google Scholar] [CrossRef]
  13. Reuter, E.; Loock, M. Empowering Local Electricity Markets—A Survey Study from Switzerland, Norway, Spain and Germany; University of St. Gallen: Gallen, Switzerland, 2017. [Google Scholar]
  14. Office for National Statistics Social Networking by Age Group, 2011 to 2017. Available online: https://www.ons.gov.uk/peoplepopulationandcommunity/householdcharacteristics/homeinternetandsocialmediausage/adhocs/007401socialnetworkingbyagegroup2011to2017 (accessed on 1 August 2019).
  15. Ecker, F.; Spada, H.; Hahnel, U.J.J. Independence without control: Autarky outperforms autonomy benefits in the adoption of private energy storage systems. Energy Policy 2018, 122, 214–228. [Google Scholar] [CrossRef]
  16. Cuthbertson, A. Why bitcoin’s revolutionary experiment is still in its infancy 10 years later. The Independent News, 31 October 2018. [Google Scholar]
  17. Hackbarth, A.; Löbbe, S. Attitudes, preferences, and intentions of German households concerning participation in peer-to-peer electricity trading. Reutl. Work. Pap. Mark. Manag. No 2019-2 2018. [Google Scholar]
  18. Hledik, R.; Gorman, W.; Irwin, N.; Fell, M.; Nicholson, M.; Huebner, G. The Value of TOU Tariffs in Great Britain: Insights for Decision-Makers: Volume II: Technical appendices; The Brattle Group: Boston, MA, USA, 2017. [Google Scholar]
  19. Benjamini, Y.; Yekutieli, D. The Control of the False Discovery Rate in Multiple Testing under Dependency. Ann. Stat. 2001, 29, 1165–1188. [Google Scholar]
  20. Darby, K.; Batte, M.T.; Ernst, S.; Roe, B. Decomposing Local: A Conjoint Analysis of Locally Produced Foods. Am. J. Agric. Econ. 2008, 90, 476–486. [Google Scholar] [CrossRef]
  21. McKenna, E.; Pless, J.; Darby, S.J. Solar photovoltaic self-consumption in the UK residential sector: New estimates from a smart grid demonstration project. Energy Policy 2018, 118, 482–491. [Google Scholar] [CrossRef]
  22. Meyer, R. The Cambridge Analytica Scandal, in 3 Quick Paragraphs. Available online: https://www.theatlantic.com/technology/archive/2018/03/the-cambridge-analytica-scandal-in-three-paragraphs/556046/ (accessed on 1 August 2019).
  23. Kollewe, J. Bitcoin price plunges below $4,500 mark in new 2018 low. The Guardian, 20 November 2018. [Google Scholar]
  24. Staff, O.F. Iceland set to use more energy mining Bitcoin than powering homes. The Telegraph, 12 February 2018. [Google Scholar]
  25. Kollewe, J. Bitcoin: UK and EU plan crackdown amid crime and tax evasion fears. The Guardian, 4 December 2017. [Google Scholar]
  26. Digital Trends Blockchain beyond Bitcoin. Available online: https://www.digitaltrends.com/blockchain-beyond-bitcoin/ (accessed on 10 September 2019).
  27. Office for National Statistics Internet access: Households and individuals, Great Britain. Available online: https://www.ons.gov.uk/peoplepopulationandcommunity/householdcharacteristics/homeinternetandsocialmediausage/bulletins/internetaccesshouseholdsandindividuals/2018 (accessed on 1 August 2019).
  28. Carrington, M.J.; Neville, B.A.; Whitwell, G.J. Why Ethical Consumers Don’t Walk Their Talk: Towards a Framework for Understanding the Gap Between the Ethical Purchase Intentions and Actual Buying Behaviour of Ethically Minded Consumers. J. Bus. Ethics 2010, 97, 139–158. [Google Scholar] [CrossRef]
Figure 1. An example experimental scenario as it would have appeared to participants.
Energies 12 03913 g001
Figure 2. Participant flow through the experiment, showing number of participants in each group.
Energies 12 03913 g002
Figure 3. Chart comparing census data for age and gender in the UK population with our sample.
Energies 12 03913 g003
Figure 4. Stated participation level for different combinations of spatial scale and proportion of household consumption met.
Energies 12 03913 g004
Figure 5. Stated impact on likelihood of uptake in Experiments 2 (top), 3 (middle) and 4 (bottom).
Energies 12 03913 g005
Table 1. Survey experiment overview and hypotheses.
ExperimentConditionsOutcome OptionsHypotheses
1. Spatial scale and proportion of consumptionNine groups in 3x3 factorial design, each shown one combination of:
Spatial scale: neighbourhood, city/region, national.
Proportion of household consumption met: 25%, 50%, 75%
Would you sign up to participate in this offer if it was available to you today?
  • Yes
  • No
H1: Uptake will increase as a greater proportion of home electricity use is met through the offering.
H2: Uptake will be higher amongst younger people.
H3: Uptake will be higher amongst participants with microgeneration, storage and/or smart home technologies.
H4: Uptake will be higher amongst earlier adopters.
H5: Uptake will be higher amongst those who are concerned about climate change.
2. Operating entityShown one of:
your local council,
a local community energy group,
an energy supplier,
a well-known online social media company.
Does knowing this about the offer make you more or less likely to want to participate?
  • More likely
  • Less likely
  • No difference
H6: Uptake will be highest in the “community energy group” condition.
H7: Uptake of the social media condition will be positively associated with being younger.
3. DLT characteristicShown one of:
immutability,
anonymity,
transparency,
decentralisation
Does knowing this about the offer make you more or less likely to want to participate?
  • More likely
  • Less likely
  • No difference
Exploratory only.
4. DLT nameShown one of:
distributed ledger technology,
blockchain
blockchain (as used to run Bitcoin)
Does knowing this about the offer make you more or less likely to want to participate?
  • More likely
  • Less likely
  • No difference
H8: Early adopters are more likely to respond that seeing mention of distributed ledger technology, blockchain, or blockchain/bitcoin, will increase their willingness to participate.
Table 2. 3 × 3 factorial design of Experiment 1.
Proportion of Household Electricity Needs Met through the Offer
25%50%75%
Spatial scale covered by the offerNeighbourhoodGroup 1: 25%, neighbourhood levelGroup 2: 50%, neighbourhood levelGroup 3: 75%, neighbourhood level
City/regionGroup 4: 25%, city/region levelGroup 5: 50%, city/region levelGroup 6: 75%, city/region level
NationalGroup 7: 25%, national levelGroup 8: 50%, national levelGroup 9: 75%, national level
Table 3. Analysis models.
Analysis ModelOutcomePredictors
Model 1 (main effects only) Uptake of P2P trading, Yes/No (coded 1/0).Main effects: spatial scale and proportion of consumption, dummy coded, with city/region scale and 50% proportion of consumption as reference categories.
Model 2 (main and interaction effects)Uptake of P2P trading, Yes/No (coded 1/0).-Main effects: spatial scale and proportion of consumption, dummy coded, with city/region scale and 50% proportion of consumption as reference categories.
-Interaction effects dummy coded for experimental groups 1, 3, 7 and 9, with city/region scale and 50% proportion of consumption group (5) as reference category.
Model 3 (main effects and other variables)
Uptake of P2P trading, Yes/No (coded 1/0).-Main effects: spatial scale and proportion of consumption, dummy coded, with city/region scale and 50% proportion of consumption as reference categories.
-Type of energy supplier dummy: big 6 (reference) vs not.
-Energy technology access, dummies for supply or large loads (one or more of solar electricity/water, heat pump, EV or home battery), smart controls (smart heating/lighting controls) or none of above (reference).
-Climate concern dummy: very/fairly concerned vs other (reference).
-Adopter category dummy: early (one of first or before most) vs late (other categories, reference).
-Gender dummy: male, female (reference), other.
-Age (continuous).
-Type of housing dummy: house/bungalow (reference), flat, other.
-Tenure: owned (reference), social rent, private rent, other.
-Urban dummy: urban (city, town or fringe – reference), vs rural (village or hamlet).
-Household size (continuous).
-Children in household dummy: yes vs no (reference).
-Employment: employed full time vs not (reference).
-Household income: Less than £21k, £21-40k (reference), £41k and over, income not declared.
-Health dummy: chronic physical/mental condition or disability vs not (reference).
Table 4. Logistic regression results for Experiment 1. Results shown are the odds ratio (OR) and p-value, with values lower than 0.05 shaded in red. An asterisk (*) is used to indicate those analyses which we did not pre-specify in our PAP. Model 1 included main effects only; model 2 added interaction terms; and model 3 also included other (e.g., demographic) variables—see methods section for full list. In each case, the model was run for three samples: (a) the full sample, (b) only those who passed manipulation check 1, and (c) only those who passed both manipulation checks. All significant p-values withstood correction for false discovery due to multiple comparisons by the Benjamini-Hochberg test [19].
Entity1a*1b*1c*2a2b*2c3a3b*3c
ORpORpORpORpORpORpORpORpORp
Proportion of consumption met25%0.8090.0540.7810.0510.7670.0800.8820.5150.8690.5220.9940.9830.7800.0340.7420.0270.7200.043
75%1.0240.8311.3180.0231.2220.1781.1580.4541.4540.0881.3830.2721.0100.9321.2630.0721.2030.248
Spatial scaleStreet0.8080.0540.7660.0320.8080.1940.9320.7170.9080.6540.9210.7570.7990.0560.7600.0380.8080.223
National0.8010.0460.7320.0130.9260.6150.8540.4090.7510.1911.1380.6190.8080.0700.7540.0330.9590.800
InteractionsStreet*25% 0.9350.8040.8860.6950.9050.799
Street*75% 0.6960.1850.7000.2330.7330.436
National*25% 0.8270.4810.8320.5550.5720.137
National*75% 1.0040.9871.0880.7810.8970.770
Table 5. Logistic regression results for Experiments 2 (reference category: energy supplier), 3 (reference category: immutability) and 4 (reference category: blockchain). Results shown are the odds ratio (OR) and p-value, with values lower than 0.05 shaded red. Experiment 2 was the only one for which a manipulation check was run. All significant p-values withstood correction for false discovery due to multiple comparisons by the Benjamini-Hochberg test [19].
Full SamplePassed Manipulation Check
ExperimentMore LikelyLess LikelyMore LikelyLess Likely
ORpORpORpORp
Experiment 2: Identity of operatorCouncil1.3310.0250.9060.6761.7430.0000.6440.119
Community energy group0.7690.0462.2450.0000.7830.1042.4840.000
Social media company0.3430.0005.5570.0000.2200.0006.4660.000
Experiment 3: DLT characteristicAnonymity1.4290.0290.3260.000
Transparency0.9290.6730.8450.198
Decentralization1.2520.1771.0490.711
Experiment 4: DLT nameDistributed ledger technology0.7570.0950.7560.072
Blockchain (runs Bitcoin)0.7970.1684.0680.000
Table 6. Logistic regression table showing only demographic and other variables which have a statistically significant association with selecting ‘more likely’ to participate (as compared with other outcomes) in all experiments. For Experiment 1, the main effects (i.e., 25% and 75% of consumption met, neighbourhood and national spatial scale) were included in the regression to control for their effects: these are not reported here. For other experiments, regressions were run separately for each experimental group. The number reported is the odds ratio, with asterisks representing p < 0.05 *, p < 0.01 **, p < 0.001 ***.
VariableExperiment 1: P2PExperiment 2: Identity of Operating OrganizationExperiment 3: DLT Characteristic HighlightedExperiment 4: DLT Name
Energy SupplierCouncilCommunity Energy GroupSocial Media CompanyImmutabilityAnonymityTransparencyDecentralizationDLTBlockchainBlockchain (Powers Bitcoin)
Type of energy supplier Big 6 customer, 2.67 **Big 6 customer, 2.39 ** Big 6 customer, 2.31 **
Home technologiesHas PV, EV, battery or heat pump, 1.94 **. Has smart heating/lighting controls, 1.59 ** Has PV, EV, battery or heat pump, 2.94 **Has PV, EV, battery or heat pump, 4.04 ***. Has smart heating/lighting controls, 3.09 **Has PV, EV, battery or heat pump, 3.14 **Has PV, EV, battery or heat pump, 2.91 **Has PV, EV, battery or heat pump, 3.17 **. Has smart heating/lighting controls, 2.83 *Has smart heating/lighting controls, 2.33 *Has PV, EV, battery or heat pump, 3.45 **Has PV, EV, battery or heat pump, 5.53 ***Has smart heating/lighting controls, 2.17 *
Climate concernConcerned about climate change, 2.26 *** Concerned about climate change, 1.98 **Concerned about climate change, 2.75 ***Concerned about climate change, 2.61 **Concerned about climate change, 3.34 **Concerned about climate change, 1.75 *Concerned about climate change, 2.41 *Concerned about climate change, 2.64 **Concerned about climate change, 2.89 **Concerned about climate change, 1.91 *
Early adopter?Early adopter, 1.67 *** Early adopter, 1.86 * Early adopter, 2.21 **
GenderMale, 1.40 ** Male, 1.95 * Male, 2.63 **
AgeYounger people, 1.15 *** per 10 years approx. Younger people, 1.46 *** per 10 years approx.Younger people, 1.32 ** per 10 years approx.Younger people, 1.28 ** per 10 years approx. Younger people, 1.22 * per 10 years approx.Younger people, 1.37 ** per 10 years approx.Younger people, 1.25 * per 10 years approx.Younger people, 1.40 ** per 10 years approx.
Dwelling type Do not live in house or apartment, 4.80 *Do not live in house or apartment, 5.15 * Live in apartment, 2.14 *
Tenure Social renter, 2.09 *. Private renter, 1.99 *
Urban/rural Live in village or hamlet, 2.18 **
Household size
Children in householdChildren in household, 1.31 *No children in household, 1.78 * Children in household, 2.09 *
Employment status In full time employment, 2.24 *
Household income Income declared, 2.53 * Household income £41k+, 2.58 *
Disability or chronic health
Table 7. Table of hypotheses and study outcomes.
ExperimentHypothesesResults
1. Spatial scale and proportion of consumptionH1: Uptake will increase as a greater proportion of home electricity use is met through the offering.
H2: Uptake will be higher amongst younger people.
H3: Uptake will be higher amongst participants with microgeneration, storage and/or smart home technologies.
H4: Uptake will be higher amongst earlier adopters.
H5: Uptake will be higher amongst those who are concerned about climate change.
Provisional evidence that uptake is higher with higher proportion of consumption met through the offer (depending on model), so H1 is tentatively supported. There was, again, provisional evidence that uptake is higher at the city/region than the national or neighbourhood levels.
H2-5 were all supported.
2. Operating entityH6: Uptake will be highest in the “community energy group” condition.
H7: Uptake of the social media condition will be positively associated with being younger.
H6 was not supported, as uptake was highest in the local council condition (followed by energy supplier, community energy group, and social media company).
H7 was supported.
3. DLT characteristicExploratory only.Only anonymity as a characteristic of DLT was more attractive than off-putting. Highlighting immutability, transparency and decentralization were all more off-putting than attractive.
4. DLT nameH8: Early adopters are more likely to respond that seeing mention of distributed ledger technology, blockchain, or blockchain/bitcoin, will increase their willingness to participate.H8 was partially supported (with exception of ‘blockchain’ condition). Overall, mentioning the name ‘Bitcoin’ made the offer significantly less attractive.

