1. Introduction
With the improvement of oil and gas resources exploitation technology, more and more offshore oil and gas resources have been exploited in recent years [
1,
2]. The exploitation of deepwater oil and gas resources has increased gradually, and the safety of downhole perforation is an important technical problem [
3]. The shaped charge jet perforation has been widely used in deepwater completion operations, the purpose of which is to form a channel between reservoir and wellbore that can effectively transport oil and gas [
4,
5]. On the one hand, the energy released by the explosion of perforating charge is converted into the effective energy to penetrate casing. On the other hand, part of the energy will be released into the wellbore, resulting in the pulsation of perforation pressure in the wellbore. This is the beginning of the wellbore dynamic effect in the process of perforation, in which the pulsating pressure of perforation will produce strong impact loads on the downhole tools and affect the stability of the whole perforation system [
6,
7,
8]. Predicting the magnitude of downhole perforation pressure is a critical step for the safety analysis of deepwater perforation.
Perforation testing refers to the process of connecting perforating gun, upper operating string, and packer into a cluster for downward entry. The downhole perforation system for the deepwater wells is shown in
Figure 1, which shows that the wellbore is filled with fluid after the packer is set. With the increase of water depth, the perforation process of deepwater wells is more complex and difficult. This is bound to greatly increase the downhole perforation pressure and wellbore safety risk. The normal exploitation of oil and gas will be affected, and even some irreparable damage may be caused.
The fluctuating pressure of perforation mainly comes from the asymmetric dynamic loads, which are produced by the explosion of many perforating bullets arranged in a certain phase in the perforating gun. Progress has been made in this field in recent years. Lu et al. [
9] proposed a perforation pressure equation based on reservoir conditions by using the superposition principle, with preliminary theoretical derivation and qualitative analysis. Zhao et al. [
10,
11] qualitatively studied the characteristics of perforation pressure fluctuation in the process of composite perforation by combining theoretical research with experimental tests. Chen et al. [
12] analyzed the dynamic load of downhole perforation by using theoretical empirical formula and simulation software. Sanders et al. [
13] proposed that the pulsating pressure of downhole perforation would increase the risk of downhole equipment damage in deepwater well. Yang et al. [
14] indirectly calculated the peak pressure of downhole perforation by calculating the energy of detonation gas based on the detonation theory. Zhou et al. [
15] used the load test system to measure perforation pressure data downhole. Bale et al. [
16] developed a commercial perforation software to simulate the dynamic downhole perforation pressure of deepwater wells. Li et al. [
17] pointed out that the change and distribution of perforation impact pressure in the wellbore with time is not clear and needs further investigation. Liu et al. [
18] set up a pressure field model of shaped charge to study the downhole perforation impact pressure. These studies have promoted the research progress of downhole perforation pressure. However, the functional relationships between downhole perforation pressure and different influencing factors are not clear. The distribution of perforation pressure along the wellbore is not clear. There is a lack of an accurate method to predict the magnitude of perforation pressure by considering multiple downhole influencing factors.
There are three main methods to study the dynamic pressure of downhole perforation, which are the empirical formula calculation, laboratory test, and numerical simulation [
19]. However, due to the asymmetric load of perforating bullets and the complexity of the downhole dynamic environment, it is difficult to comprehensively describe the whole perforation process by relying solely on the existing empirical formulas. The data obtained by the laboratory test for perforation is limited. Therefore, the numerical simulation method of non-linear dynamics can be applied to describe the three-dimensional dynamic process of downhole perforation.
In this study, the parameters setting of the model materials and the state equations have been explored. By setting the fluid-structure coupling, the modeling method of multiple perforating bullets is formed. The complex perforating conditions are successfully simulated by LS-DYNA software on a large computer. The physical process of perforation with hundreds of perforating bullets has been innovatively simulated. Based on the simulated data, the functional relationships between perforation peak pressure and different influencing factors have been obtained. A prediction model to calculate the downhole perforating peak pressure has been proposed. The perforation peak pressure at different positions in the wellbore can be obtained.
2. Empirical Formulas of Perforation Pressure
At present, the calculation of downhole perforation pressure is mainly based on the empirical formulas of the explosive explosion. One of them is referring to the method of measuring explosive performance in an isolated container. It is assumed that the perforating charge is put in the sealed casing and the remaining space of which is filled with air. The empirical formula of explosive explosion pressure is used to calculate perforation pressure, as shown in [
20]:
where
is the explosive pressure, MPa;
is the explosive specific energy, J/kg;
is the perforating charge quantity, kg;
is the effective volume of the casing, L;
,
is the Hexogen specific volume, L/kg.
By equating the perforating charge explosion with the underwater explosion test, the perforating pressure at different locations is calculated by [
21]:
where
is the tested coefficient, 44.5 for spherical TNT explosive, dimensionless;
is the explosive quality, kg;
is the distance from the detonation center, m;
is the attenuation coefficient, 1.5 for spherical TNT explosive, dimensionless.
Based on the detonation theory, the energy of detonation products is determined according to the detonation parameters of the perforating charge. The explosion pressure of perforation is obtained by [
22]:
where
is the explosive density, g/cm
3;
is the molar number of the detonation gas products per unit mass of explosive, mol/g;
is the average molar mass of detonation gas components, g/mol;
is the detonation heat, KJ/mol.
Assuming that a certain proportion of explosive energy will be converted into wellbore fluid internal energy, a certain increment of pressure can be produced in the wellbore. After perforation, the wellbore pressure is obtained as [
23]:
where
is the wellbore initial pressure, MPa;
is the explosive energy transfer rate, dimensionless;
is the imaginary gas-liquid ratio in the wellbore, dimensionless;
the number of perforating bullets;
is the charge per hole, g;
is the average molar mass of detonation gas components, g/mol;
is the wellbore effective volume, m
3;
is the detonation heat, KJ/mol.
The idea of the above empirical formulas is to calculate the explosion pressure of perforation by the equivalent explosion of explosives. It is assumed that other calculation parameters remain constant: charge density is 1.80 g/cm
3; inner diameter of casing is 0.157 m; casing length is 2.5 m; inner diameter of tubing is 0.059 m; tubing length is 1 m; inner diameter of perforating gun is 0.105 m; gun length is 1 m; residual volume of charge is 0.83 L/kg; explosive specific energy is 1181861 J/kg; molecular mass of explosive is 222.12 g/mol; molar number of explosive per unit mass is 0.03377; detonation heat is 6205.23 KJ/mol. The initial wellbore pressure is 10 MPa, with 30% of explosive energy converted into wellbore pressure during perforation. The total charge quantity of perforation is calculated as a variable by Equations (1)–(4), which is changed as 2 kg, 4 kg, 6 kg, 8 kg, 10 kg. The calculation results are shown in
Figure 2.
Based on the above calculation results, it can be seen that the perforation pressure increases with the increase of the total charge quantity. The pressure values of perforation calculated Equations (1)–(4) are quite different. The actual downhole perforation conditions are complex, with many factors affecting the fluctuating pressure of perforation. The above empirical formulas cannot consider the factors comprehensively, especially for the influence of formation conditions. The calculation results of the above empirical formulas are inaccurate. It is important to account for the reservoir condition since it can act as an absorber or reflector (based on porosity, permeability, etc.) of shock waves that eventually affects the propagation and strength of shock waves within the wellbore [
24,
25]. Therefore, these theoretical empirical formulas can only be used as a preliminary reference for qualitative analysis of downhole perforation pressure. The above analysis shows that the charge of perforation, the effective space of the wellbore, the wellbore initial pressure, and so on are the important factors affecting the explosion pressure of perforation. Therefore, further research is needed to explore a more accurate calculation model for perforating pressure.
Due to high flexibility and ability, the technologies of numerical simulation have been widely applied for the study of complex non-linear problems in recent years. The simulation of perforation completion has undergone a process from simple to complex, and the perforation model has gradually developed from two-dimensional to three-dimensional. At present, the perforation simulation analysis has entered the stage of finite element simulation calculation with the further development of computer technologies. Some complex non-linear problems with high calculation accuracy have been solved with the premise of adapting to various complex mathematical models. The numerical simulation has many advantages and has become an effective means of piercing engineering analysis, in which the whole dynamic process can be presented by numerical simulation [
26,
27].
3. Modeling and Meshing
The whole process of perforation includes charge explosion, jet formation, casing penetration, and fluid-solid coupling. The sequential explosion of perforating bullets has an extremely complex coupling superposition effect with increasing shock loads in the wellbore. At present, the finite element software of LS-DYNA or AUTODYNA has been widely used to simulate the whole dynamic process. Lee [
28] simulated the process of jet formation and penetration into the casing wall based on the 2D Euler coding, the foundation of perforation numerical simulation was laid. Han et al. [
29] studied the process of explosive explosion forming jet and penetrating casing wall during perforation by numerical simulation. Kang et al. [
30] used the software of LS-DYNA to study the dynamic response of the perforating gun, and few numbers of perforating bullets were simulated in three-dimensional. Yang [
31] simulated a single perforating bullet of the horizontal well perforation by the software of LS-DYNA, and the state equations and model parameters during perforation were explored. Li [
32] simulated the fluctuation of perforation pressure by the software of AUTODYN using spherical explosive instead of perforating bullets. Yan et al. [
33] studied the process of perforation to cement damage by the software of LS-DYNA, and the ALE (Arbitrary Lagrange–Euler) algorithm was used to describe the fluid-structure coupling phenomenon in the perforation process. The above researches have laid the foundation for modern perforation completion simulation and promoted its rapid development. The selection of state equations, the setting of model parameters, and the fluid-structure coupling phenomenon in the perforation process have been preliminarily studied. However, previous work often focused on a single or a few numbers of perforation bullets due to the complexity of perforation modeling and meshing with huge workloads. Without considering the influence of multiple factors on downhole perforation pressure, the simulation cannot reflect the actual working conditions of perforation.
In this section, the perforation model, with hundreds of perforating bullets, has been innovatively established. Several trial calculations have been carried out by exploring the parameters of the model materials and state equation and setting the fluid-solid coupling interface. The numerical simulations have been carried out smoothly.
3.1. Physical Model
A number of perforating bullets are distributed in the gun at a certain phase. The downhole perforation system of deepwater wells has many components, as shown in
Figure 1. The physical model needs to be simplified for the convenience of simulation calculation. Make the following assumptions: Firstly, the cement or reservoir is assumed as isotropic materials by ignoring their heterogeneity; Secondly, all the downhole components in the perforation string system are regarded as isotropic tubing string materials. Through the above assumptions, a 3D physical model can be established by simplification, as shown in
Figure 3. The perforating gun, tubing string, and casing are involved in the model with 300 perforating bullets with phase 45°, 63 g charge per hole. The air fills inside the remaining space of the gun. The wellbore fluid fills the annulus space of tubing and casing with the initial pressure of 15 MPa. The packer restrains the upper end of the string radially, and the circumference of the string is restrained by the casing with reservoir surrounding.
3.2. Model Meshing
The physical process of perforation includes complex fluid-structure interaction with a high strain rate, which is commonly solved by the BEM (boundary element method) and FEM (finite element method). The BEM is suitable for solving linear homogeneous problems, while FEM is suitable for solving nonlinear problems with complex boundaries [
34,
35]. Therefore, the finite element method can be used to simulate perforation. In LS-DYNA, there are mainly ALE (Arbitrary Lagrange–Euler) algorithm and SPH (Smoothed Particle Hydrodynamics) algorithm for fluid-structure interaction calculation. The mesh deformation caused by meshless can be avoided for the SPH algorithm [
36]. However, the ALE algorithm is more stable under perforation conditions, accurately describing the deformation response of perforated string, cement, and reservoir without mesh non-convergence. The ALE algorithm can accurately simulate the formation and penetration of a shaped charge jet with a high strain rate and large deformation, which can be used in RDX (Royal Demolition Explosive) explosives, air, and fluid. The spatial position of the ALE grid remains unchanged with the material flows among the grids. The Lagrange algorithm is used in the downhole string. The Lagrange algorithm can be firstly executed by the ALE algorithm at each time step [
37].
Since the model meshing is complex, the grid is built on the cylindrical boundary to make the whole area transition into a cuboid structure. The remaining 3/4 models can be obtained by rotating the replication command. The fluid area model of the perforating bullet and the torsion model are connected by twisting the air area model between the cylindrical segments, in which different perforating bullets are located. The twisting model is connected by replicating rotation. The fluid area model of several perforating bullets can be obtained. Through the above methods, the geometric parameters of the liner, charge, the height of the upper end face of the cuboid, and the number of corresponding meshes can be adjusted. Different sizes of the perforating bullets can be quickly established by changing the parameters. Multiple perforating bullets can be obtained by simple replication with the distance that can be quickly adjusted.
Figure 4a shows the vertical section of the mesh model, and the vertical section of the mesh model of the perforating bullet is shown in
Figure 4b.
3.3. Material Model and State Equation
The selection of material parameters and the related equation of state have been briefly introduced in the section. The state equation of EOS_JWL (Jones-Wilkins-Lee) is adopted for RDX explosive, and the expression is shown in [
38]:
where
is the pressure of detonation product, MPa;
is the specific volume, cm
3/g;
are material constants;
is the explosive internal energy of unit volume, J/m
3. The parameters’ values are listed in
Table 1.
The MAT_NULL material model and state equation of EOS_GRUNEISEN are used for describing the wellbore fluid (water) dynamic response. The equation is shown in [
39]:
where
is the sound velocity in water, cm/μs;
are the constant coefficients, dimensionless;
is the Gruneisen constant, dimensionless;
is the water compressibility, dimensionless;
is the first-order volume correction of
,
, dimensionless. The main parameter values are shown in
Table 2.
The EOS of material air is shown as [
40]:
where
are the EOS parameters, dimensionless. The values of the parameters are shown in
Table 3.
The Cowper–Symonds model is adopted for the shell and perforated string (gun, tubing, casing), as shown in [
41]:
where
is the strain rate of materials, dimensionless;
and
are the strain rate parameters, dimensionless;
is the initial value of yield stress, MPa;
is the plastic hardening modulus of materials, GPa;
is the tangent modulus of materials, GPa;
is the young modulus of materials, GPa;
is the effective plastic strain of materials, dimensionless. According to the API (American Petroleum Institute) standard, the material parameters of the perforated string are shown in
Table 4 [
42].
The cement and reservoir can be described by the material model of Holmquist–Johnson–Cook model [
38]:
where
is the uniaxial compression strength, MPa;
is the normalized pressure value, dimensionless;
is the normalized strain rate, dimensionless;
are the constants of the material, dimensionless;
is the damage value, dimensionless. In order to reduce the amount of calculation, the cement and reservoir model is only established near the perforation section. The modeling parameters are shown in
Table 5.
The numerical model is input into the LS-DYNA program in the form of a K file for calculation. The parameters of numerical simulation are defined by keywords. * INCLUDE and * INCLUDE TRANSFORM: importing the grid model information; * INITIAL_DETONATION: defining the initiation point and time of explosives; * ALE_MULTI-MATERIAL_GROUP: making the material flows with each other in the fluid domain grid; * CONSTRAINED_LAGRANGE_IN_SOLID: realizing the fluid-solid coupling; * SECTION_SOLID and * SECTION_SOLID_ALE: setting the grid cell algorithms; * CONTROL_TERMINATION and *CONTROL_TIMESTEP: controlling the simulation time and the output step of the model calculation [
37].
4. Numerical Analysis
In this section, numerical simulation has been carried out on a large computer based on the above modeling and calculation methods. The simulation data can be extracted through post-processing. The total explosion time during perforation of 0–5000 μs has been simulated.
4.1. Simulation Results
The perforation pressure in the wellbore distribution from 800 μs to 1400 μs with an interval of 100 microseconds can be obtained, as shown in
Figure 5. When the perforator has not been detonated, there is no fluctuation of the pressure in the wellbore. When the shock wave is formed by the explosion of perforating bullets, the perforation pressure in the wellbore increases sharply upward along the wellbore. When the shock wave reaches the position of the packer at the top of the wellbore, it reaches the peak value, which is caused by the reflection of the packer. The reflected shock wave gradually propagates downward along the wellbore, showing a trend of attenuation. The wellbore pressure-time curve can be drawn by extracting the simulated data, as shown in
Figure 6.
It can be seen from the simulated perforation pressure-time curve that the wellbore pressure reaches peak instantaneously with the detonation of the perforating bullets. Then, the oscillation occurs when shock waves are reflected back and forth in the wellbore. The attenuation occurs with propagation in the wellbore fluid. Finally, the pressure value tends to be stable after perforation. The changing trend is similar to the field measured data curve, as shown in
Section 5. It can be seen from
Figure 6 that the peak pressure of deepwater perforation is as high as 110 MPa, which is a very important index for downhole wellbore safety. The high peak perforation pressure will cause the direct damage of downhole tools, such as the fracture of perforated string, the failure of the packer, etc. The peak value of perforation pressure can be used as the test index of the downhole safety for deepwater wells [
43,
44]. Before the shock wave reaches the packer, the contour of annulus pressure is captured along the different positions of the wellbore from bottom to top, as shown in
Figure 7.
The position of perforating gun is regarded as the starting position of perforating explosive load. From
Figure 7, it can be seen that the farther away from the source of the explosion, the lower the perforating pressure is. It means that the propagation of perforating pressure in wellbore fluid shows an attenuation trend. The peak perforation pressure at different positions in the wellbore can be extracted [
45,
46,
47,
48,
49]. By using the extremum method, the simulated data can be dimensionless. The change trend curve of peak perforation pressure at different wellbore positions has been obtained, as shown in
Figure 8.
The ultra-high pressure detonation products formed by perforation bullets rapidly expand in wellbore fluid in the form of gas. Since the pressure of the detonation products is far greater than the static pressure of surrounding wellbore fluid, the shock waves and perforation pressure pulsation have been formed in the wellbore. There will be a decaying trend with the propagation of shock waves in the wellbore fluid. The physical process is very similar to the underwater explosion. The mathematical model of the underwater pressure attenuation is usually obtained by fitting the experimental data. Cole [
50] first proposed the theory to describe the pressure attenuation of underwater explosion; it is considered that the propagation attenuation law of underwater explosion accords with exponential attenuation. Through the above analysis, the attenuation coefficient model of the downhole perforation pressure in the wellbore is proposed by the undetermined coefficient method:
where
is the peak pressure of perforation at different positions of the wellbore, MPa;
is the initial pressure of the explosive source of perforation bullets, MPa;
is the undetermined coefficient, dimensionless;
is the attenuation index, dimensionless;
is the ratio of the distance along the wellbore from the source of the explosion and the distance from the packer to the source of the explosion, dimensionless.
Based on the numerical simulation data in
Figure 8, the model of the undetermined coefficient in the equation can be solved,
and
. In order to obtain the pressure of the source of the explosion of perforating bullets, a large number of numerical simulation analysis is carried out for different factors based on the orthogonal test.
4.2. Orthogonal Test
The orthogonal test is a scientific, effective, and simple method to study the influence of multiple factors, which is applicable to a certain index affected by these factors, with each factor taking more than one value. As we know, there are many factors affecting the pulse pressure of perforation, such as perforation-related parameters, pressure in the initial wellbore fluid, wellbore size, the thickness of casing and cement sheath penetrated, reservoir conditions, and so on. In this study, in order to obtain the variation law of downhole perforation pressure under different perforation conditions, the orthogonal test method has been used to carry out a series of numerical simulation calculations on a large computer for the influence of different factors on perforation pressure. Five correlative factors have been considered: total charge quantity, wellbore initial pressure, downhole effective volume for perforation, the thickness of casing and cement, formation elastic modulus. The designed orthogonal test table is shown in
Table 6.
The perforating peak pressure is the index affected by the factors; the results of orthogonal numerical simulation tests can be obtained in
Table 7. Through range analysis, the order of importance of each factor to test index can be judged. The range can be calculated by the formula, as shown in [
28]:
where
is the range formula of the
ith column, dimensionless;
is the sum of the test indices corresponding to the
ith column (factor) and
jth level (value), dimensionless;
is the average value of the test indices corresponding to the
ith column (factor) and
jth level (value), which can be used to obtain the optimum combination of factors to make the test index, dimensionless.
Through range analysis, the order of importance of each factor to the perforating peak pressure can be obtained. The larger the range value, the greater the influence of the factor on the peak perforation pressure is. The range value of the total charge quantity, wellbore initial pressure, downhole effective volume for perforation, the thickness of casing and cement, formation elastic modulus is 90.3, 106.52, 24.27, 29.1, 19.79, respectively. Therefore, the order of influence of each factor on the peak value of perforation pressure is as follows: wellbore initial pressure > total charge quantity > thickness of casing and cement > downhole effective volume for perforation > formation elastic modulus.
4.3. Analysis of Influence Factors
In order to study the correlation between influence factors and peak perforation pressure, the dimensionless analysis is adopted for the simulated data. Five dimensionless normalized forms of the factors of the total charge quantity, wellbore initial pressure, downhole effective volume for perforation, the thickness of casing and cement, formation elastic modulus are represented by
X1,
X2,
X3,
X4,
X5, respectively. The dimensionless normalized form of peak perforation pressure can be represented by
Y. The downhole wellbore perforation peak pressure function can be expressed in the dimensionless form:
where
,
,
,
,
are the ratios of the total charge quantity, wellbore initial pressure, downhole effective volume for perforation, the thickness of casing and cement, formation elastic modulus to the maximum value of that, respectively, dimensionless.
Based on the dimensionless simulation data, taking
X1 as abscissa and
Y as a longitudinal coordinate, the trend curve and the influence law can be obtained, as shown in
Figure 9.
Figure 9 indicates that the peak value of perforation pressure and the total charge quantity show a logarithm function. The perforating peak pressure increases with the total charge quantity increasing. The reason is that the fluctuating pressure of downhole perforation mainly comes from the explosion source of perforated bullets with the shaped charge. The larger the single charge and the more the number of perforation bullets are, the more the total charge quantity is, the higher the peak pressure of perforation pulsation is.
Similarly, in order to investigate the effects of wellbore initial pressure on the pulsating pressure of perforation, the relationship between the wellbore initial pressure and the peak value of downhole perforation can be obtained in
Figure 10.
As shown in
Figure 10, the peak perforation pressure increases linearly with the increase of wellbore initial pressure. The reason is that the initial wellbore pressure provides the basis for the pulsating pressure of perforation. When the explosive energy produced by the explosion of the perforation bullets is released into the wellbore, the larger the wellbore initial pressure is, the higher the perforating explosion pressure is.
Figure 11 illustrates the relationship between the downhole perforation effective volume and the peak value of perforation. It can be seen that the peak value of perforation and the downhole perforation effective volume shows an exponential function. The peak value of perforation gradually becomes smaller with the increase of the downhole perforation effective volume. This is because as the packer is seated, the downhole wellbore is in a closed space. With the increase of downhole perforation effective volume, the energy generated by the perforation explosion has more space to release. Less energy can be converted into the perforating pulsating pressure.
The relationship between the thickness of casing and cement and the peak value of downhole perforating pressure can be drawn, as shown in
Figure 12. It can be seen that the peak value of downhole perforating pressure and the thickness of casing and cement show a power relation function. The peak value of downhole perforating pressure gradually becomes smaller with the increase of the thickness of casing and cement. The reason is that with the increase of energy used to perforate casing and cement, the explosive energy released in wellbore decreases correspondingly. The pulsating pressure of perforation decreases accordingly.
Figure 13 illustrates the relationship between the formation elastic modulus and the peak value of perforation pressure. It can be seen that the peak value of perforation pressure and the formation elastic modulus show a power function. The peak value of perforation pressure gradually becomes smaller with the increase of the formation elastic modulus. The reason is that the greater the formation elastic modulus is, the stronger the ability to resist elastic deformation is. More energy is required for perforation to penetrate the formation. Less energy will be released in the wellbore with the smaller perforating pressure.
Based on the above analysis, the influence laws of the factors on the downhole perforation peak pressure have been obtained. In order to obtain a prediction model that can be used to calculate the peak pressure of perforation pulsation accurately in engineering, it can be fitted based on a large number of numerical simulation data by considering multi-factor changes. Equation (12) can be written further as:
where
are the undetermined coefficients, which can be obtained by fitting the numerical simulation data, dimensionless.
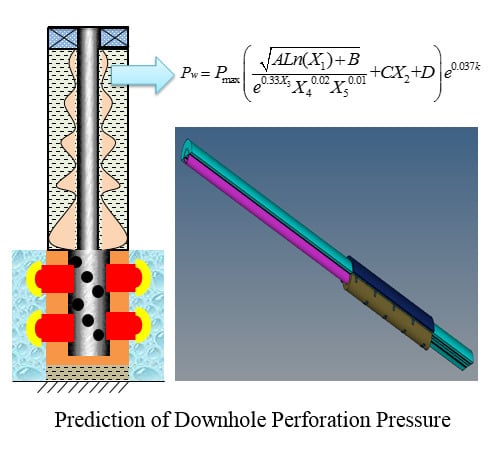
Combining with the attenuation coefficient model of the downhole perforation pressure in the wellbore of Equation (10), the final prediction model of perforation peak pressure at different positions of the wellbore can be obtained in:
where
are the undetermined coefficients, which can be solved, dimensionless
,
,
,
.
Through the above analysis, a calculation model for the prediction of the fluctuating peak pressure of downhole deepwater perforation has been obtained, which can be applied to the field perforation case study.
5. Field Application
The field case is a deepwater well located in the South China Sea [
51]. The well’s depth is 1295 m, the length of the perforating gun, rathole length, and tubing is, respectively, 9 m, 19.14 m, 35 m. The packer adopts a static type with rated working pressure of 30 MPa. The specific operation parameters of the field well are shown in
Table 8. The measured perforation pressure-time curve can be obtained by the test instrument installed on the perforation gun, as shown in
Figure 14.
It can be seen that the measured and simulated pressure-time curves of
Figure 14 and
Figure 6 show similar trends, in which the perforation pressure reaches peak instantaneously with the detonation of the perforating bullets. Then, the oscillation occurs when shock waves are reflected back and forth in the wellbore, and the attenuation occurs due to propagation in the wellbore fluid. Finally, the pressure value tends to be stable after perforation. The measured peak pressure during perforating is 7900 psi (54.57 MPa). According to the prediction model of perforation peak pressure of Equation (13), the result can be obtained. The downhole effective volume for perforation can be calculated in:
where
are the volume of tubing section, perforating gun section, and pocket section, respectively, m
3. The predicted peak perforation pressure by this study (Equation (13)) has been found to be 56.85 MPa; the error between the predicted value and the measured value can be calculated by:
Similarly, the results of different empirical formulas (Equations (1)–(4)) in previous reports for calculating the peak pressure of perforation and the errors in comparison with the measured data can be obtained, as shown in
Table 9.
By comparing the results of this study with those of previous studies, it has been found that the error in comparison with the measured data by Equation (13) is within 10%. The result calculated by the prediction model accords with the accuracy needs of actual perforation operation. The safety of downhole perforation can be analyzed, in which the safety of the packer is an important index to measure the safety of downhole wellbore. When the packer is seated, it is in a fixed state. When the perforation pressure wave is transmitted to the lower end of the packer, it will produce reflection and transmission. According to the principle of reflection and transmission of the wave, the pressure value acting on the packer can be calculated by:
where
is the final pressure value acting on the packer, MPa;
is the perforation pressure of the lower end of the packer, MPa;
is the reflection pressure, MPa;
is the transmission pressure, MPa;
is the ratio of shock impedance between wellbore fluid and the packer, dimensionless.
Combining with the prediction model of perforation peak pressure at different positions of the wellbore of Equation (14), the final pressure value acting on packer can be obtained as 51.37 MPa. The value is beyond the range of a packer (30 MPa), and the packer will be damaged with such perforating peak pressure. To ensure the safety of perforation while keeping the perforation strength is an important challenge. It means that the number of perforating bullets and charge quantity cannot be reduced. The material properties, type, and size of the downhole string cannot be changed, and the reservoir conditions are determined. The perforating pressure can be reduced by adjusting the installation distance of the packer and the installation of shock absorbers. The shock absorbers are usually installed below the packer to ensure the safety of the whole perforation process. The shock absorber is usually composed of spring or rubber parts. For deepwater wells, the rubber parts in the shock absorber are more easily damaged due to the complex bottom-hole environment, which causes great trouble to perforation operation. So, the spring shock absorber is often used in the perforation of a deepwater well. According to the previous analysis, the axial dynamic response of the downhole string under perforation impact is the most obvious. The perforating peak pressure can be alleviated by installing the longitudinal spring shock absorber. It is proposed that the shock absorbers installed in the middle of the string can achieve the best shock absorption effect [
5].
The shock absorber is simulated by adding spring elements connected in series to the string in the numerical model of
Figure 3. The numerical models with shock absorbers installed in the middle of the string have been used to carry out the simulation calculation. Through the numerical simulations, the date of perforating peak pressure on the packer with a different number of shock absorbers under different packer setting distances can be obtained, as shown in
Figure 15.
Figure 15 shows the reduction of the peak value of perforating pressure on the downhole packer with different numbers of shock absorbers. The more the number of shock absorbers is, the larger the reduction is, and the better shock absorption effect can be achieved. With the increase of packer installation distance, the peak value of the perforating pressure on the downhole packer decreases. When one shock absorber is installed, the minimum value is reduced to 32.5 MPa, which still exceeds the range of a packer (30 MPa). When the optimal installation position cannot meet the requirements of shock absorption, the number of shock absorbers can be increased. With the increase of the number of shock absorbers, the downhole packer can be ensured in a safe state combined with the optimization of packer installation distance. The optimization range refers to the color region in
Figure 15. Through the above analysis, the specific optimization scheme is put forward. In the field operation, the distance of the packer is 20 m, and two shock absorbers are installed in series in the middle of the string. After safety optimization, there is no damage to the downhole packer after perforation.


