Article

Accumulation Conditions and an Analysis of the Origins of Natural Gas in the Lower Silurian Shiniulan Formation from Well Anye 1, Northern Guizhou Province

1
School of Energy Resource, China University of Geosciences, Beijing 100083, China
2
Key Laboratory of Shale Gas Exploration and Evaluation, Ministry of Land and Resources, China University of Geosciences, Beijing 100083, China
3
Beijing Key Laboratory of Unconventional Natural Gas Geological Evaluation and Development Engineering, Beijing 100083, China
*
Author to whom correspondence should be addressed.
Energies 2019, 12(21), 4087; https://doi.org/10.3390/en12214087
Submission received: 18 September 2019 / Revised: 20 October 2019 / Accepted: 22 October 2019 / Published: 26 October 2019
(This article belongs to the Special Issue Development of Unconventional Reservoirs)

Abstract

:
The origin of natural gas and the mechanisms that lead to gas accumulation in the marine calcareous mudstone of the Lower Silurian Shiniulan Formation in northern Guizhou province are special and complicated. According to a combination of qualitative and quantitative methods, including the reconstruction of hydrocarbon generative potential and gas content’s measurement, in the context of some geochemistry information—the origins of the natural gas of Shiniulan Formation is suggested to be mixed gas. Furthermore, the accumulation of the natural gas can be proposed combined with some geological information. Results indicated that the volume of the in-place gas content of Shiniulan samples, reinstated by the formulas’ computation, reaches a yield of 3.67 m3·t−1 in rock. The theoretical gas content for Shiniulan Formation mudstone ranges from 1.6 to 5.8 m3·t−1 using the indirect calculation of gas content, and the total gas contents of those samples range from 0.065 to 0.841 m3/t, according to the United States Bureau of Mines’ (USBM) direct method. According to the combination of the reconstructed in-place gas content and the gas content, even mudstone in the Shiniulan Formation has potential to generating gas but could not satisfy the actual gas content in Shiniulan Formation. In addition, according to the composition, the carbon and hydrogen isotope charts of gaseous hydrocarbons further indicate that the gas origin of Shiniulan Formation is a mixed gas, which also means that the gas is not just generated in the layer, but has partly migrated from other formations, such as the Wufeng–Longmaxi Formation. The lower Shiniulan Formation in the study area is characterized by frequent interbed of limestone and calcareous mudstone. The geological information shows that well-developed fractures of mudstone and faults can be used as main pathways for the upward migration of gases from the underlying strata to the Shiniulan Formation. The limestone with fairly low porosity and permeability hinders the migration of natural gas as much as possible and keeps that efficiently reserved in the horizontal fractures of calcareous mudstone. This migration pattern implies that the interbedded rock association is also favorable for gas accumulation in the Shiniulan Formation.

Graphical Abstract

1. Introduction

The great success of shale gas’s exploration in North America has tremendously promoted the exploration and development of shale gas worldwide. The resources, such as net crude oil and petroleum-related production, are increasingly independent of imports, which has contributed mostly to the development of tight oil and shale gas reservoirs, as suggested by Jia et al. [1]. According to the Energy Information Administration (EIA) in 2017 [2], the new record for shale plays in the northeast extends to a longer-term trend of development, and the upward trends have continued in the days thereafter.
The exploration of shale gas is undergoing rapid development in China. In particular, the Lower Paleozoic marine facies rich in organic shale are an advantageous area for marine shale gas exploration. These facies are spread widely over the upper Yangtze region, with rich sources of rock layers, high organic matter abundance, rich organic matter types, high thermal maturity, a high content of brittle minerals, and moderate development of fractures having been demonstrated by Zhang and Zou and Wang and Tan [3,4,5,6]. Through the determination of the actual gas content of drilling cores in many areas of the southern Paleozoic, the shale gas content of the Lower Cambrian Qiongzhusi Formation was found to be distributed in the range of 0.13‒5.02 m3·t−1, with an average of 2.14 m3·t−1. Accordingly, the shale gas content of the upper Ordovician Wufeng–lower Silurian Longmaxi Formation ranges from 0.29 to 6.50 m3·t−1 as pointed out by Zou et al. [7].
The northern Guizhou area is one of the research areas for the strategic investigation of shale gas resources in China; this area lies to the south of the Sichuan basin and has a generally low level of petroleum geological evaluation and exploration. The upper Ordovician Wufeng Formation–lower Silurian Longmaxi Formation and the Lower Cambrian Qiongzhusi Formation, which developed in the northern Guizhou area, have the most potential shale layers, with good hydrocarbon generation capabilities as effective formations in geological research and exploration for marine shale gas, as presented according to Han et al. and Zhao et al. [8,9].
The AY (AnYe)-1 well is located in Anchang Town, Zhengan County, in the north of Guizhou Province. The structural location belongs to the west wing of the Anchang syncline in the Wuling folded region. The purpose of drilling was to explore the upper Ordovician Wufeng Formation–lower Silurian Longmaxi Formation for shale gas. More remarkably, a number of high-pressure gas reservoirs were drilled in the Shiniulan Formation of the Silurian. This is the first time that high-yield gas flows have been obtained in the interbedded marine limestone and mudstone layers of the strata in southern China. The black shale was drilled for nearly 20 m from the upper Ordovician Wufeng Formation to the Lower Silurian Longmaxi Formation, which met the standard for the commercial exploration of shale gas. Furthermore, natural gas was prospected first in the Permian Qixia Formation, and then in the Baota Formation outside the Sichuan Basin. The drilling of the AY-1 well is a major breakthrough in the new area, which has a new formation system, and new types of natural gas and have opened up new areas for oil and gas exploration in southern China.
There is a fairly prominent gas logging abnormality in the gas source rock of the Shiniulan Formation, with 15 layers of gas logging abnormality drilled in the well depth of 2105‒2204 m. The anomalous total hydrocarbon value rapidly soared from 0.35% to 85.40% while the abnormal methane value also rose from 0.25% to 80.5%. The initial production of the well AY-1 attained a maximum of 420 × 103 m3 per day, as presented by Liu et al. [10]. It is expected that the output can reach 200 × 103 m3 per day after acid fracturing. At present, the daily output reaches approximately 5000 cubic meters, and the cumulative gas production is nearly 600,000 cubic meters, signifying a principal breakthrough for gas exploration in Guizhou Province.
As a new stratum for natural gas exploration and trial in China, the investigation of gas potential and gas accumulation condition of reservoir is of vital importance to the next step of exploration and development in study area. This paper aims to evaluate the potential of the hydrocarbon generation of calcareous mudstone in the Shiniulan Formation by different methods which have not used in previous research, combined with the relationship between the stable isotopic compositions of gaseous hydrocarbons and the molecular composition of gases to confirm the origin of natural gas in lower part of the Shiniulan Formation due to its complexity and multiple solutions. Afterwards, characterizing the fault and fractures as controlling factors was used to estimate the accumulation model of natural gas in the reservoir with high yields.

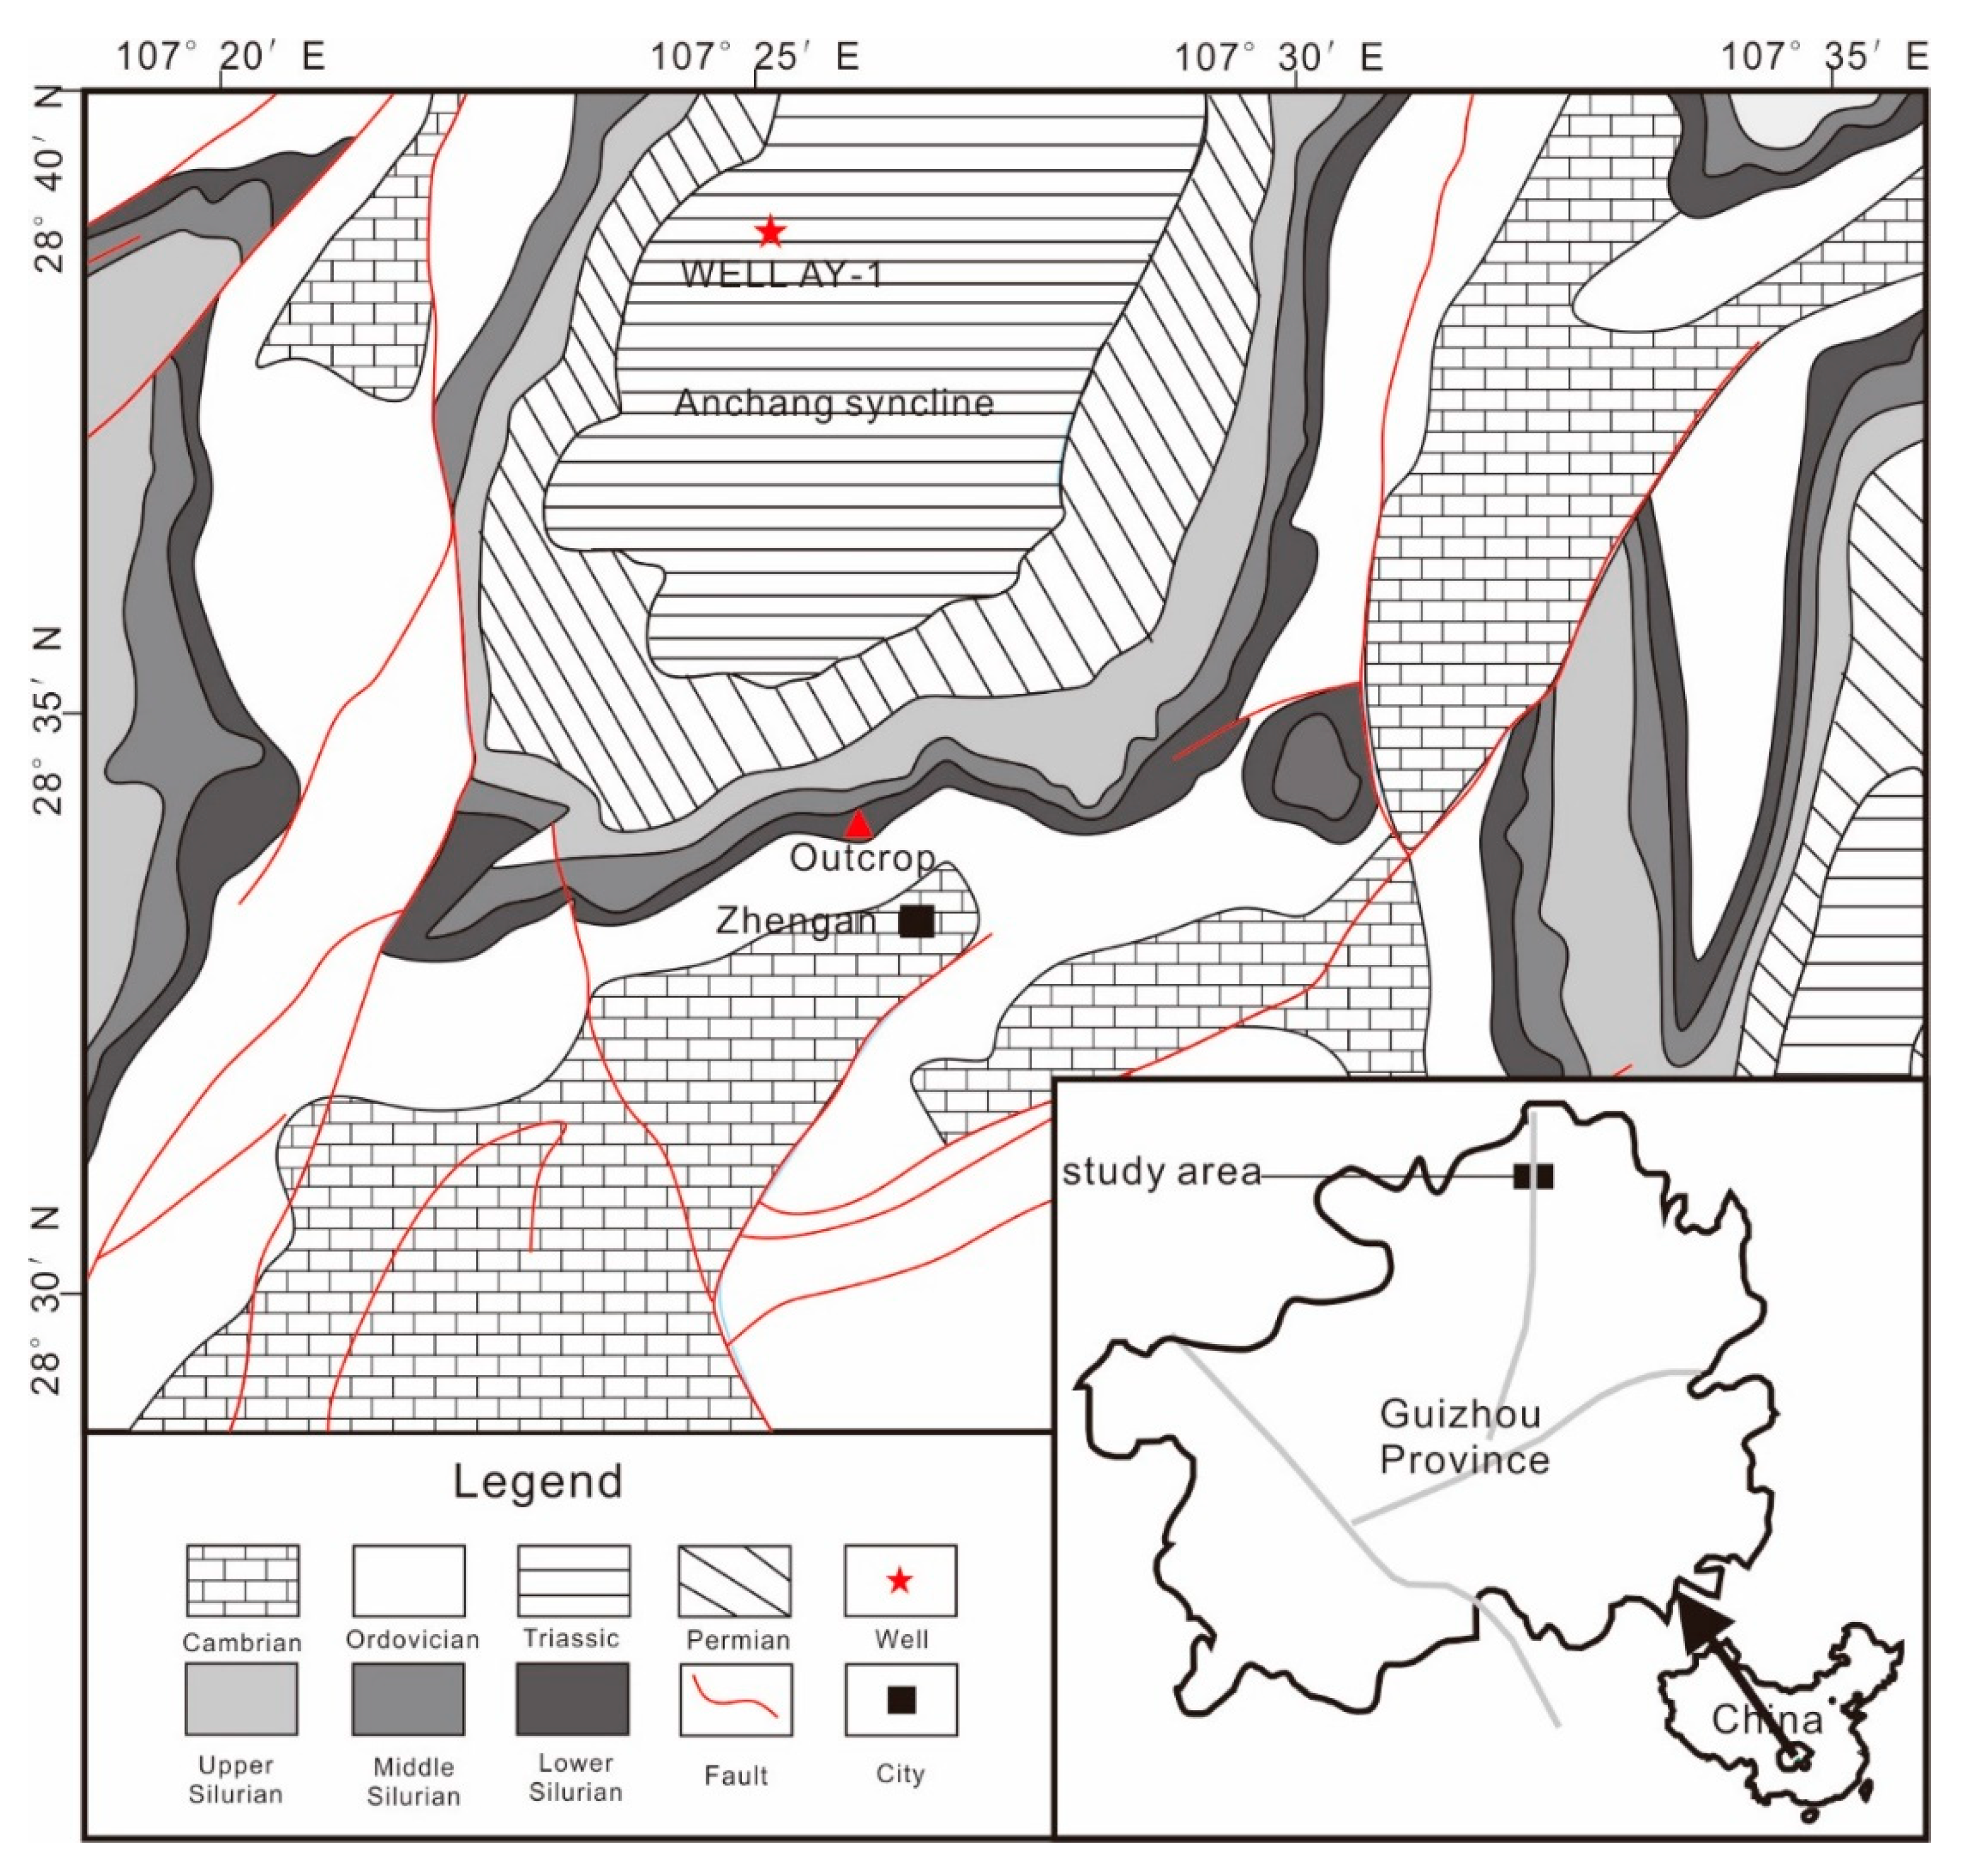
2. Geological Setting

The Silurian in the upper Yangtze area has a good material foundation, which is not only widely distributed but also has a large thickness with rich organic matter, as presented by Wang. [11]. With the development of shale gas exploration, the resources of the Lower Silurian have achieved many breakthroughs in the Weiyuan, Changning, Fushun-Yongchuan, Fuling, and Pengshui areas in the southern Sichuan basin. Many wells have obtained high yields during the process of the gas testing suggested by Liang et al. [12].
The study area belongs to the South Sichuan–Northern Qianbei sub-region in the upper Yangtze (Figure 1). The Paleozoic strata have developed to a great extent, while Carboniferous and Devonian areas are lacking in the northern region of Guizhou Province. According to the lithology, sedimentary facies, and paleontological characteristics, the Sinian–Cambrian strata are divided into east and west regions. The study area is mainly exposed of the upper Cambrian–Silurian Formation, which is distributed in the anticlinoria. Among the strata, the Silurian strata are relatively developed with a large number of fossils that contact the underlying Ordovician but are in uncomfortable contact with the overlying Lower Permian. The Lower Silurian is divided into three groups from the bottom to top: the Silurian Longmaxi Formation, the Shiniulan Formation, and the Hanjiadian Formation.
Silurian exists as an important source of rocks in the upper Yangtze region. The lithology of the Wufeng–Longmaxi Formation shows mainly black carbonaceous shale with a small amount of thin-layer of bioclastic limestone or bioclastic limestone strips, and the upper part is mainly a thin interbed of argillaceous limestone and mudstone refer to Wang et al. [13]. Furthermore, the lithology of the Shiniulan Formation is mainly composed of a set of bioclastic limestone in an argillaceous limestone and calcareous mudstone interbedding, which is in a conformity relationship with the underlying strata. The thickness of limestone increases from bottom to top, while that of calcareous mudstone diminishes slightly (Figure 2).

3. Materials and Methods

3.1. Sample Selection

Twenty-four fresh core samples from depths of 2110 to 2348 m of AY-1 well were analyzed, 15 of which were from the Shiniulan Fm., and nine of which were from the Longmaxi Fm. A series of experiments were used for evaluating the characteristics of mudstone samples and the gas potential of the Shiniulan Fm. in the upper Yangtze area.
Eleven gas samples from Shiniulan Fm. in AY-1 were collected from the wellheads or separators for the molecular composition and isotopes of carbon and hydrogen analyses. To collect the gas samples, double-ended stainless-steel bottles equipped with a maximum pressure of 15 MPa and vacuumed before sampling were used. During sampling, the stainless-steel bottles were repeatedly flushed and replaced with a gas stream, and then the exhaust valve was closed. The filling gas pressure was made stable at 4 MPa, the intake valve was closed, and the bottle was covered in water in case of gas leakage.

3.2. Organic Matter Properties

The total organic carbon (TOC) content was determined using a Leco CS230 carbon/sulfur analyzer following the Chinese National Standard GB/T19145-2003. [14]. Vitrinite reflectance values (Ro%), a representative indicator for characterizing the thermal maturity of organic matter, were evaluated by an MPV-SP microphotometer under an oil-immersion objective lens. The photometry of samples was obtained at the temperature of 23 °C according to the Chinese standard SY/T5124-2012 [15]. Maceral composition observations were performed using polished sections under reflected white and fluorescent light with a Leica MPV microscope. According to the type index (TI) following the criteria of the Chinese oil and gas industry standard SY/T5125-1996 [16]. and Cao [17], the abundances of the maceral components could be evaluated for organic matter type identification. All of these experiments and analyses were performed by at the geochemistry laboratory of Yangtze University, Jingzhou, China.

3.3. Parameterization of the Gas Content

3.3.1. Indirect Calculation of the Gas Content

By adding together the adsorbed and free gas contents, the total gas content can be obtained. The content of adsorbed gas in mudstone cannot be obtained directly. At present, methane isothermal adsorption is commonly used to signify the capacity of gas adsorption and to measure the amount of adsorbate (methane); that is, through isothermal adsorption, a simulation experiment is conducted to establish the relationship model between the adsorption gas content and pressure and the temperature, as pointed out in previous publication by Wang et al. [18]. The experimental process involves testing the capacity of the adsorption gas under different pressures at a constant temperature.
The methane adsorption isotherm was formed at a temperature of 30 °C and a humidity level of 2.31% by the isothermal adsorption/desorption analyzer (HPVA-200-4). Through the isothermal adsorption test, eight equilibrium pressure points were measured at 30 °C (about the same as the ground temperature at 500 m depth), as was the equilibrium moisture of pure methane at 0, 0.35, 1.07, 2.25, 4.31, 6.24, 8.72, and 11.13 MPa, respectively. The equilibrium time of each pressure point was approximately 12 h, and then it was pressurized to the next pressure point under the experimental environment with a methane gas concentration greater than 99.999%. The adsorption volume of methane was obtained by the following equation; see Dang [19], Gasparik et al., [20], Ji et al., [21], and Tan et al., [4], Dang [22].
m = m t o t a l ρ g a s V v o i d
where m is the volume of methane adsorption; mtotal represents the amount of gas drawn into the sample cell; and ρgas is the density of gas; the void volume (Vvoid) generally is contingent on helium expansion. The adsorption profile used the Gibbs adsorption calculation which neglects the volume occupied by the adsorbed phase in calculating the amount of unadsorbed gas and Vvoid is viewed as being available to the unadsorbed gas suggested by Sudibandriyo et al. [23].
According to the Langmuir isotherm equation, as pointed out by Langmuir [24], which is related to the adsorption of gas molecules on a solid surface under a fixed gas pressure and temperature, the methane adsorption’s experimental results can be obtained:
V = V L P / ( P L + P )
PL is the pressure at which the adsorbed gas content is equivalent to the half of the Langmuir volume; V means the adsorbed gas volume; and P is the gas pressure; VL indicates the maximum capacity of the adsorbent’s adsorption
Free gas is generally stored in the pores and microfractures of mudstone. The main influential factors of the content include porosity, pressure conditions, the temperature system, and gas saturation. The content of free gas was calculated by the following equation proposed by Lewis et al. [25].
G f = φ × S g B g × ρ b
where Gf is the content of free gas, m3·t−1; Φ is the rock porosity (%); Sg is the original gas saturation (%); Bg is the factor of gas formation volume; and ρb is the formation density, g·cm−3.
The factor of gas formation volume is the volume of natural gas per unit volume under formation standard state (20 °C, 0.101325 MPa). The formula of the factor of gas formation volume as follows.
B g = V g V s c
PscVsc = nRTsc
PVg = nZRT
where Vg is the volume of n mol gas under formation conditions, m3; Vsc is the volume of n mol gas under formation conditions, m3; n is the number of moles, k mol; T is the formation temperature, K(T = (273.15 + t)K); P is the formation pressure, MPa; R is the universal gas constant, MPa·m3(k mol·K)−1; t is the formation temperature, °C; tsc is the formation temperature in standard state, tsc = 20 °C; and Z is the compressibility factor, which can be obtained by the two-parameter compression factor chart of natural gas. Psc = 0.101235MPa; Tsc = (273.15 + 20) °C (under standard state).
B g = P s c ( 20 + 273.15 ) × Z ( t + 273.15 ) P = 3.456 × 10 4 Z   t + 273.15 P
G f = k 2893.5 φ S g P ρ Z ( t + 273.15 )
The key to this calculation is to determine the effective porosity and gas saturation of free gas. The reservoir space of free gas consists of matrix pores and fractures. Both of these factors directly affect the content of free gas. The reservoir space can be characterized by effective porosity.
Therefore, the effective porosity of the free gas in the reservoir is the summation of the matrix porosity and fracture porosity, which are obtained through high-precision experiments and log interpretation. The comparative matrix’s porosity can be measured by sound waves, neutrons, density, and other well logging data; and accurate fracture porosity is commonly obtained by dual lateral logging data. The gas saturation is obtained from a formula named the total shale model, which was described by Schlumberger (1972) [26]. The calculation of the total shale model is as follows:
1 R t = φ m × S w n a R w × ( 1 V s h ) + V s h × S w R s h
where, Rsh is the resistivity of mudstones; Rt presents the rt true formation resistivity; and Sw is the water saturation. Then, Rw is the formation water resistivity, which has units of Ω·m; φ is the formation porosity (%); a is the lithology factor; n is the saturation exponent; and m is the formation cementation exponent.

3.3.2. USBM Direct Method

The USBM direct method, as one of the industry standards, is used to evaluate the gas content, as presented by Diamond et al. [27], Yee et al. [28], Diamond and Schatzel [29], and Dang et al. [30]. The core samples lifted from the wellhead are quickly loaded into stainless-steel cans and sealed. The adsorbed gas content can be measured by spherical particles, which are characterized by a surface concentration of zero and a constant initial gas concentration (see Dang et al. [26] for details). The lost gas content is estimated by linear regression analysis of the square root of the adsorbed gas content and desorption time when the desorption of gas is completed.

3.4. Original TOC and Hydrocarbon Potential

An analysis was carried out with 10 g of powdered sample. Each sample was heated to 600 °C by Rock-Eval 6 pyrolysis equipment manufactured by Vinci® Technologies (Nanterre, France). Herein, we focused mainly on the following parameters, which were recorded during the pyrolysis phase: Some parameters can be obtained by experimentation, including the volatile hydrocarbon content, mg HC·g‒1 Rock (S1); remaining hydrocarbon generative potential, mg HC·g‒1 Rock (S2); and the temperature of maximum pyrolysis yield (Tmax). The hydrogen index (HI) and the production index (PI), which were proposed by Behar et al. [31], were calculated through the calculation formula. Finally, we used the following equation, according to Jarvie et al. [32], to acquire the original hydrocarbon generative potential:
S2o = HIo × TOCo × 100−1
where HIo is the original hydrogen index; TOCo is the total organic carbon; and S2o is the original generative potential of hydrocarbon, mg HC·g−1 Rock.

3.5. Natural Gas Geochemistry

The compositions of the 11 gas samples in this study were analyzed by a gas chromatograph (GC); i.e., an Agilent 6890 N integrated with a flame ionization detector (FID) and a thermal conductivity detector (TCD). A capillary column (PLOT Al2O3 50 m × 0.53 mm) was used for hydrocarbon gas components (C1–C3) fractions. The temperature program of the GC oven included an initial heating at 30 °C, which was then increased to the temperature of 180 °C with a final hold time for 20–30 min at 10 °C·min−1.
The carbon isotope compositions of the gas components were obtained using a mass spectrometer (Finnigan Mat Delta Plus). The target gas component was separated on a fused silica capillary column. The temperature program of the GC oven was increased from 35 °C to 80 °C at 8 °C·min−1 and reached 260 °C at 5 °C·min−1 (held for 10 min). The stable hydrogen isotope analyses of alkane gases were performed on a mass spectrometer (Finnigan GC/TC/IRMS). Helium, as the carrier gas with a rate of 1.5 mL·min−1, was injected into an HP-PLOT Q column (30 m × 0.32 mm × 20 μm) to separate the alkane gas components. The GC oven temperature was initially held at 40 °C for 4 min, increased at a rate of 10 °C·min−1 to 80 °C, then to 140 °C at °C·min−1, and finally, turned up to 260 °C at a rate of 3 °C·min−1 and held for 10 min. The values of stable carbon and hydrogen isotopes are presented in the δ-notation (δ13C, ‰) as V-PDB (Vienna-Pee Dee Belemnite) and V-SMOW (Vienna-standards mean ocean water), respectively. The analytical error of the carbon and hydrogen isotopic compositions was less than 3‰, as suggested by Ni et al. [33], Dai et al. [34], Dai et al. [35].

3.6. Observation and Statistical Classification Method for Fractures

The observation and statistical analyses of the length, opening, dip, and density of core fractures are fundamental for the study of the fracture development and distribution features of cores.
In the identification and observation of core fractures, the core is generally immersed in water so that fractures can be clearly observed before the core surface is entirely dry. The reason for this is that there are many microfractures in cores. After the water immersion, the water on the surface completely evaporates, but does not completely evaporate in the microfractures; thus, water marks with the same dip size were observed on the core.
(1) Statistical analysis and research into the fracture length of cores:
The length distribution of fractures can be divided into three different types: length (L) < 6.5 cm, length L ≥ 10 cm, and 6.5 cm ≤ L < 10 cm.
(2) Statistical analysis and research into the degree of the fracture development of cores:
A fracture’s density is a significant parameter to describe the degree of fracture development, which can intuitively reflect the intensity of a fracture. The fracture liner density is one of the most effective parameters indicating the degree of fracture development. It refers to the ratio of the number of fractures intersecting a straight line to the length of the line:
D = N H
N is the total number of fractures observed in the core unit; H is the core length in the unit, m; and D is the liner density of a fracture, m−1.

4. Results and Discussion

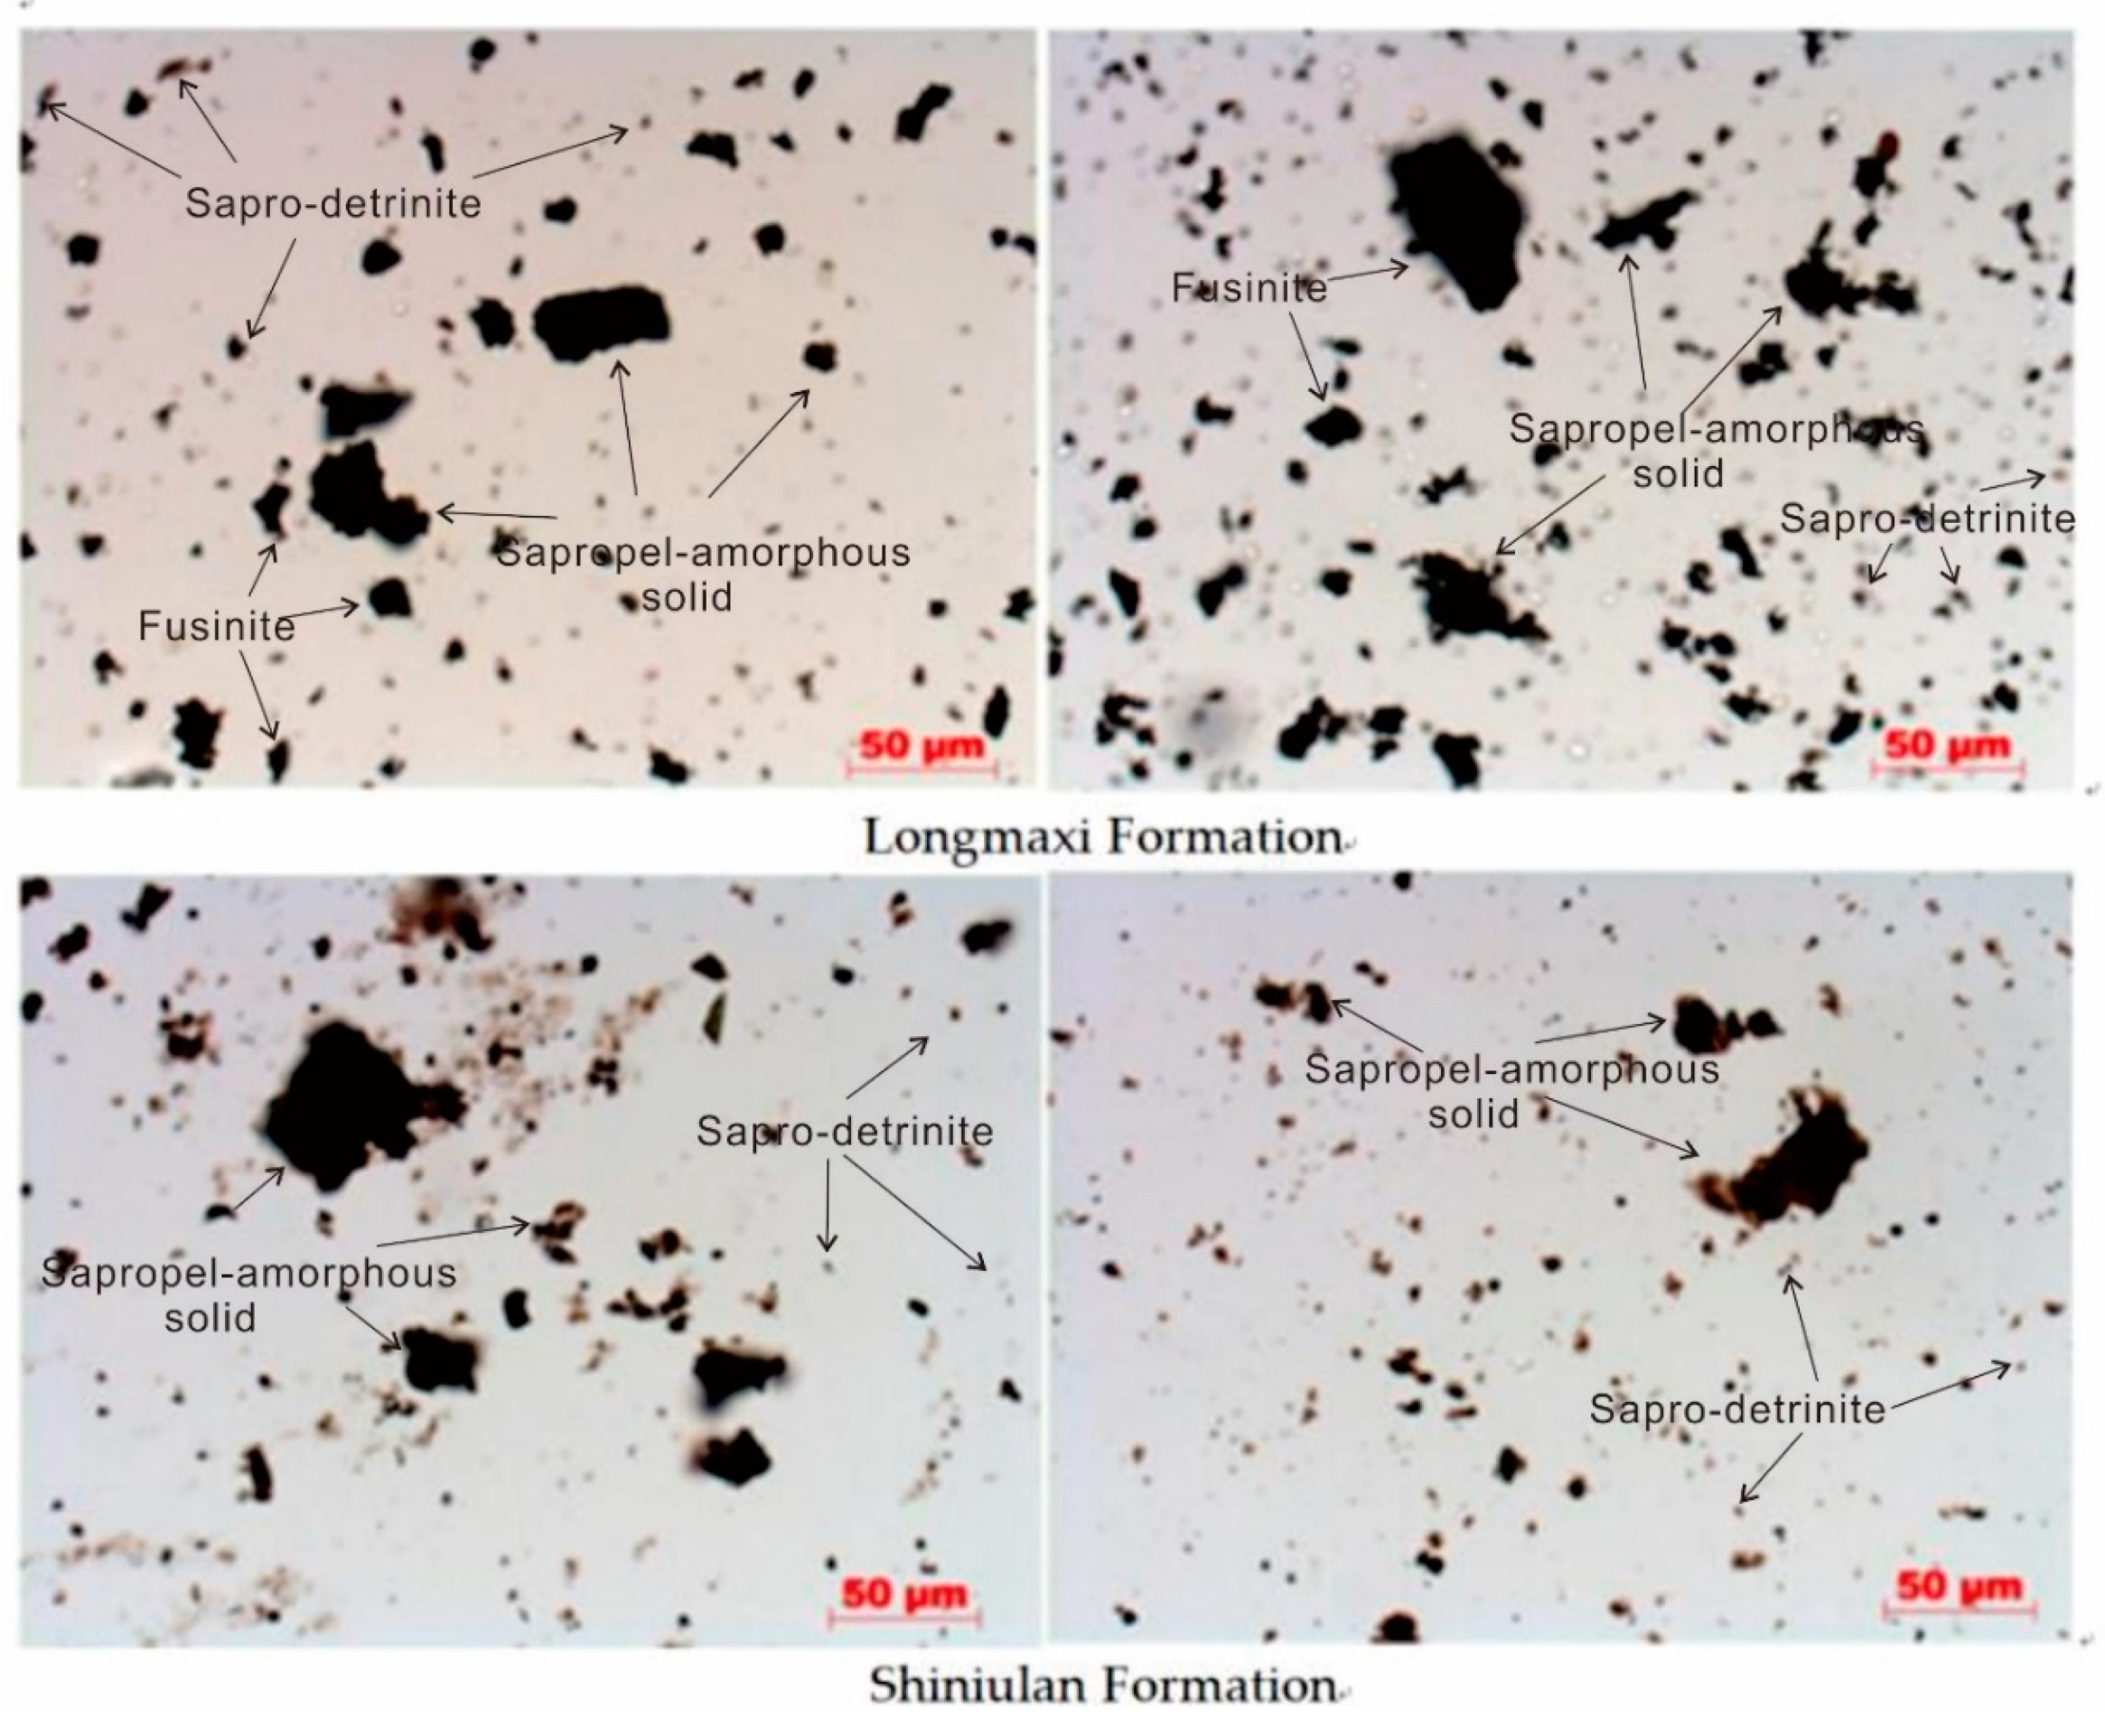
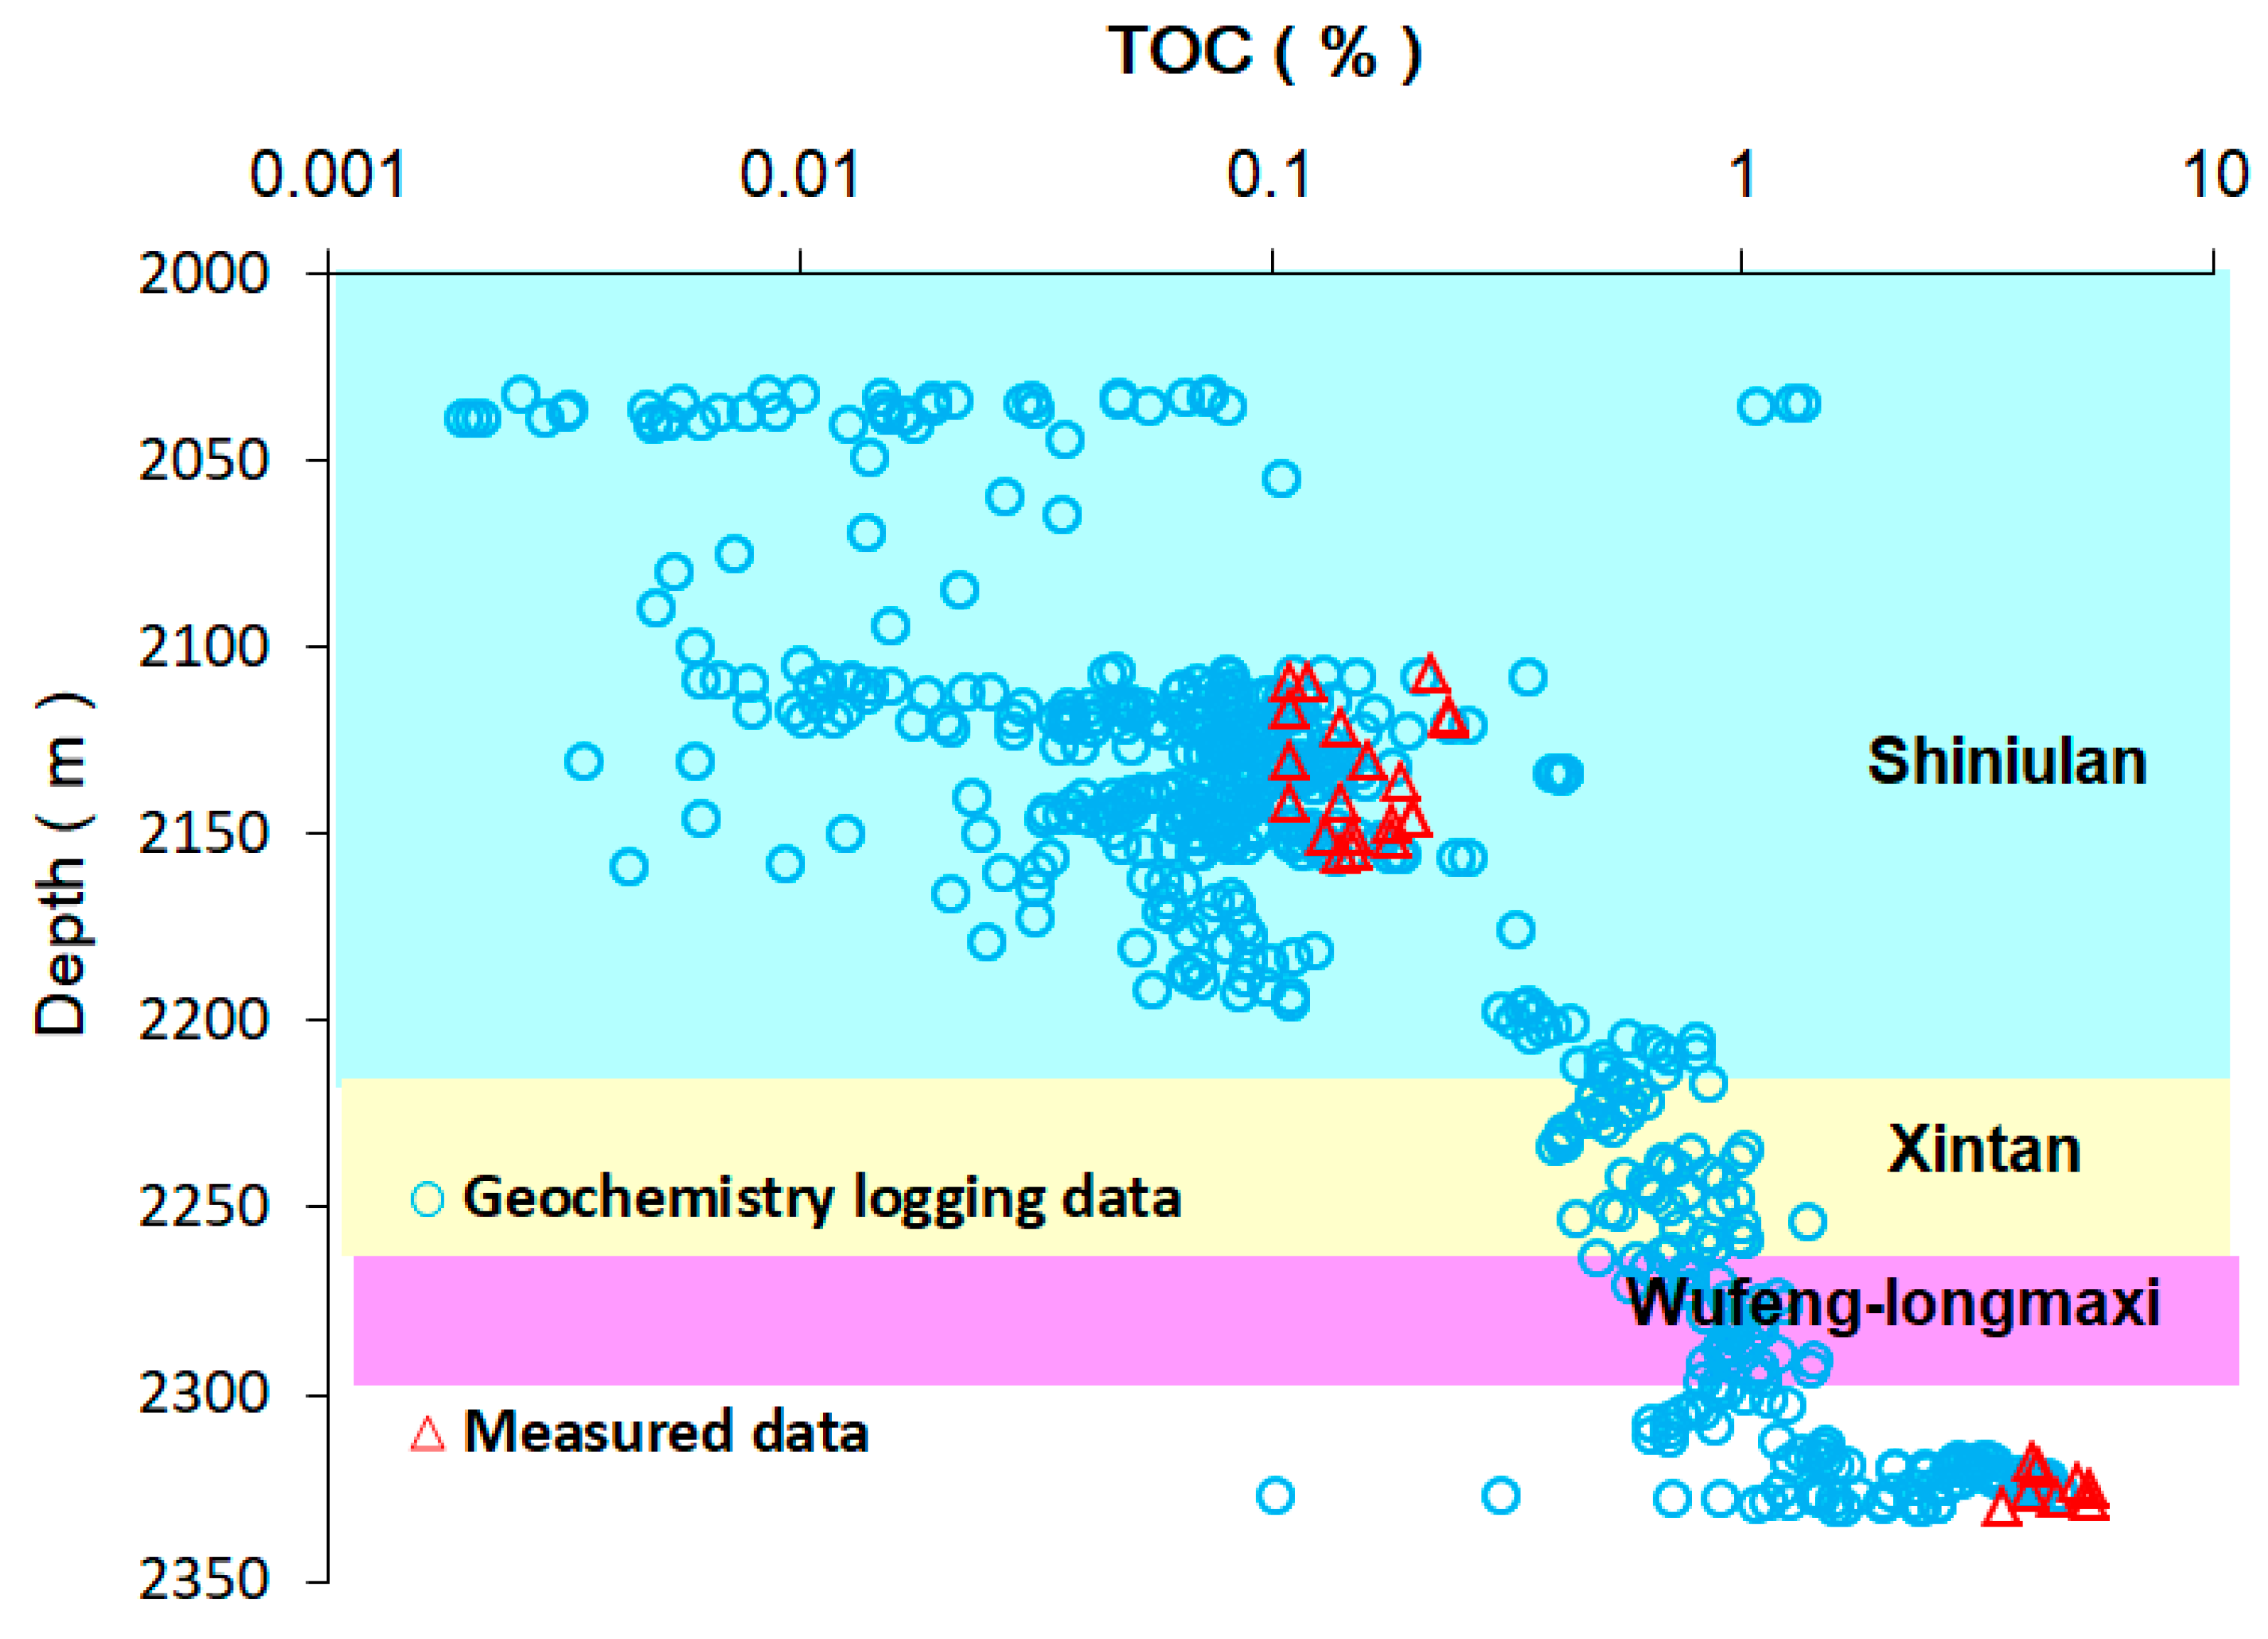
4.1. Organic Geochemical Bulk Parameters and the Hydrocarbon-Generative Source Rock

The type of organic matter affects the gasification capacity and gas content, both of which were demonstrated in the pioneering work by Boyer, C. et al. [36]. Some information about the depositional environment can be revealed by the compositional characteristics of kerogen, proposed by Romero and Philp [37]. The type of kerogen not only has an influence on the hydrocarbon generation of the rock, but can also affect the adsorption and diffusion rates of natural gas.
The results of the microfractional analysis for samples in the Longmaxi Formation show that the organic matter types of the organic-rich shale are mainly distributed in type I and II1, and the macerals are mainly composed of sapropelinite and inertinite groups and lack-of-vitrinite groups (Table 1). In the chitin group, the sapropelinite group is mainly composed of the dispersed mineral asphalt matrix. Although the content of organic carbon is fairly low, the analysis of the microstructure shows that the organic type of the calcareous mudstone in the Shiniulan Fm. is type II1 which indicates good hydrocarbon generation capability (Figure 3).
As proposed by Bowker et al. [38], there is a large amount of organic matter in the shale reservoir, and its abundance and maturity have a significant impact on shale gas resources. Boyer C et al. [36] demonstrated that the organic carbon content (TOC) is an important controlling factor for the accumulation of shale gas, dominating not only the physicochemical properties of shale, but more importantly, controlling the gas content of shale.
The geochemical experiment of calcareous mudstone in the Shiniulan Formation shows that the TOC content is generally less than 1% and is distributed mostly at 0.1%, with an average value of 0.16%; the distribution of organic carbon in the Wufeng–Longmaxi Formation ranged from 3.5% to 5.4%, with an average of 4.5%. According to geochemical logging data, the shale gas enrichment section of the Wufeng–Longmaxi Fm. was concentrated at 2311–2331 m; the organic carbon content was between 0.2% and 4.8%, with an average of 2.96%; and the organic carbon content (TOC) increased with the depth (Figure 4). However, the TOC of samples in the lower Shiniulan Fm. were generally low, being less than 1% at most.
The maturity of all samples was greater than 2%. The maturity of the Silurian mudstone samples changed within the range of 2.79% to 3.32%, with an average of 3.11%, both of which are in the over-mature stage. Owing to the rather high thermal evolution in the Shiniulan Fm., the maturity was between 2.75% and 2.92% with an average of 2.95% (Figure 5).
For hydrocarbon source rocks of the same or similar quality, in general, a higher Ro indicates a greater possibility of producing, fracture development (the greater the relative content of free gas), and a greater production of gas. Thermal maturity has some effect on the hydrocarbon generation potential of organic matter and directly influences the amount of gas generated by source rock and affects the occurrence condition, migration, and aggregation state of natural gas after hydrocarbon generation.
The organic matter content before the threshold of oil generation when hydrocarbons are not produced in large numbers or expelled, is considered to be the original organic matter content. However, the organic matter content of core samples measured at present is usually the residual organic matter content after massive hydrocarbon expulsion. The abundance of organic matter drops significantly during maturation, according to Qin et al. [39]. Thus, the present organic matter cannot show the original geochemical characterization of the mudstone cores accurately, owing to the thermally over-mature organic matter. As a result, we probably underestimated the hydrocarbon generation potential of source rock. Thus, restitution of the original TOC was needed. Therefore, we used a formula proposed by Jarvie et al. [32] to evaluate the hydrocarbon generation potential by arithmetic and parameters, such as HIo, TRHI (Transformation ratio), TOCo, and S2o according to Dang et al. [40] (Table 2).
The results obtained by different formulas show that the TRHI is distributed in the range of 92%‒100%, with a mean value of 97.6%, which occurs when organic matter is at the post-mature stage. Furthermore, the quite low S2 indicates that the current organic matter has hydrocarbon generation.
For an amount of generated hydrocarbon equal to S2o minus S2, the result ranges from 1.18 to 3.39 with an average number of 2.8 mg HC·g−1 rock for Shiniulan Fm. mudstones. As the final step, we obtained the QHC, which was transformed to a volume of CH4 per unit mass of rock by means of the formulas shown below the table, and then obtained the average result of about 3.67 m3·t−1 rock of Shiniulan mudstone. It was proven that the Shiniulan mudstone has a certain hydrocarbon generation potential. However, it is far from enough to satisfy the gas content in the reservoir.

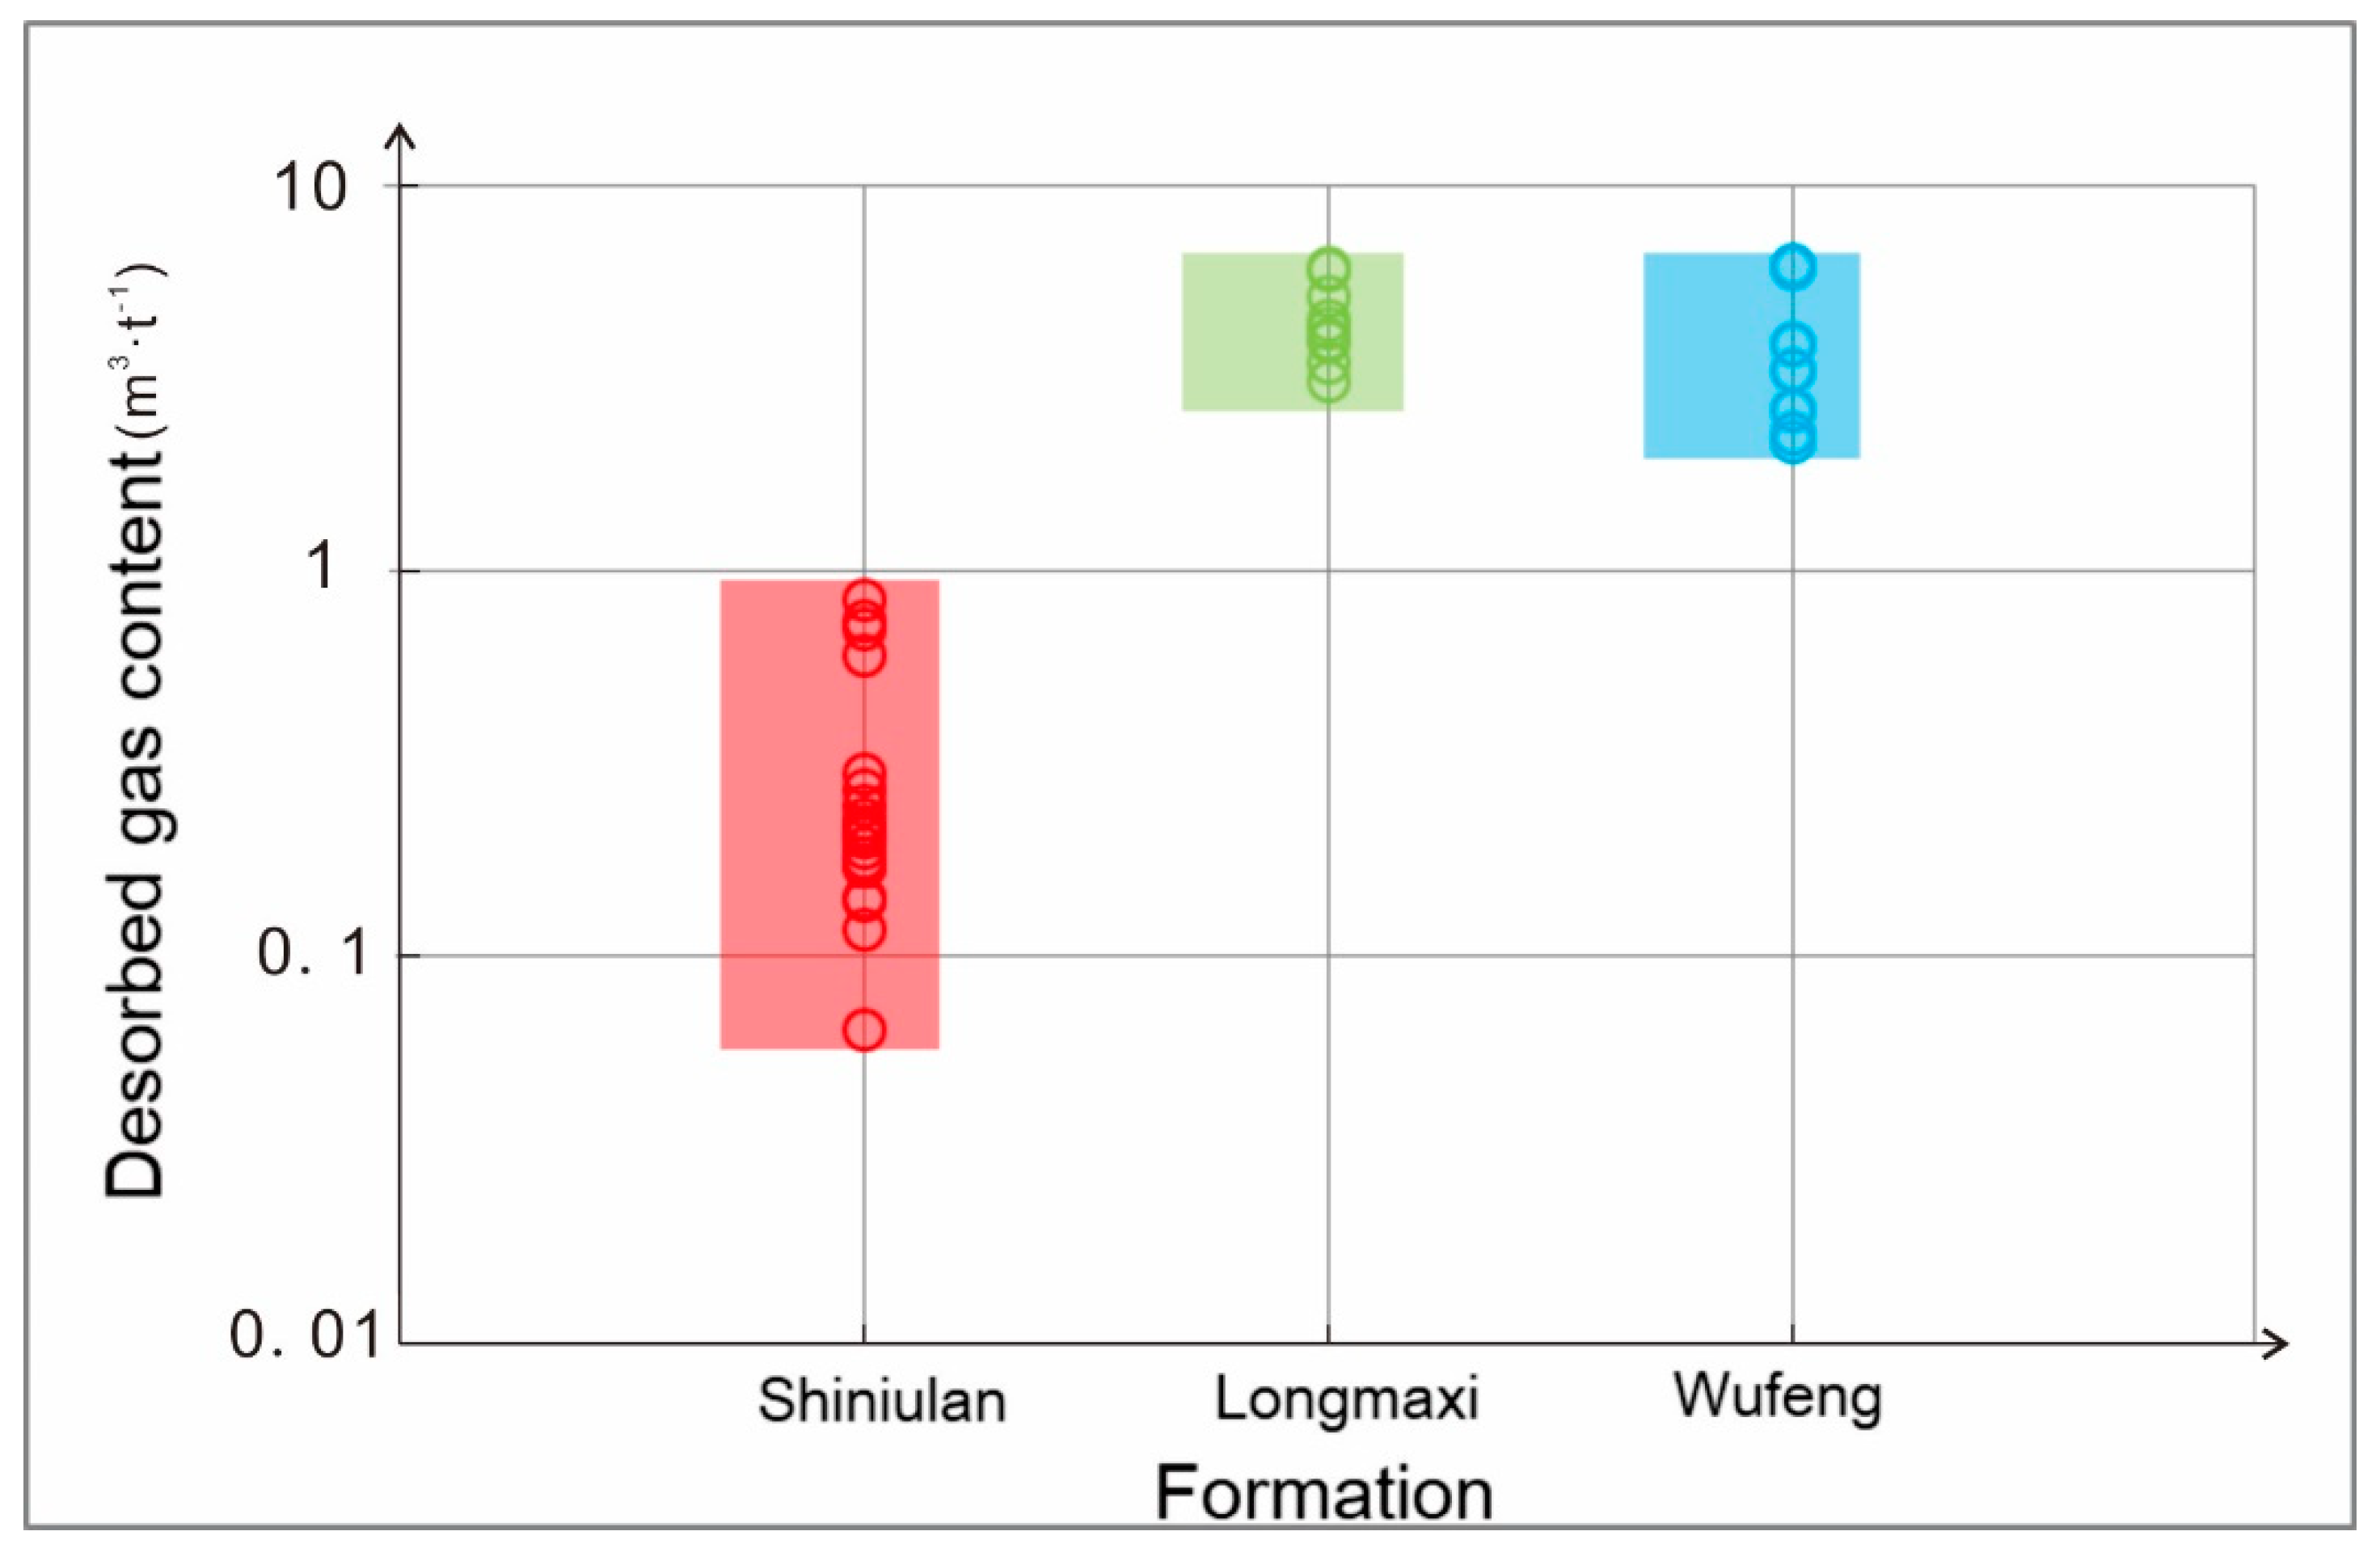
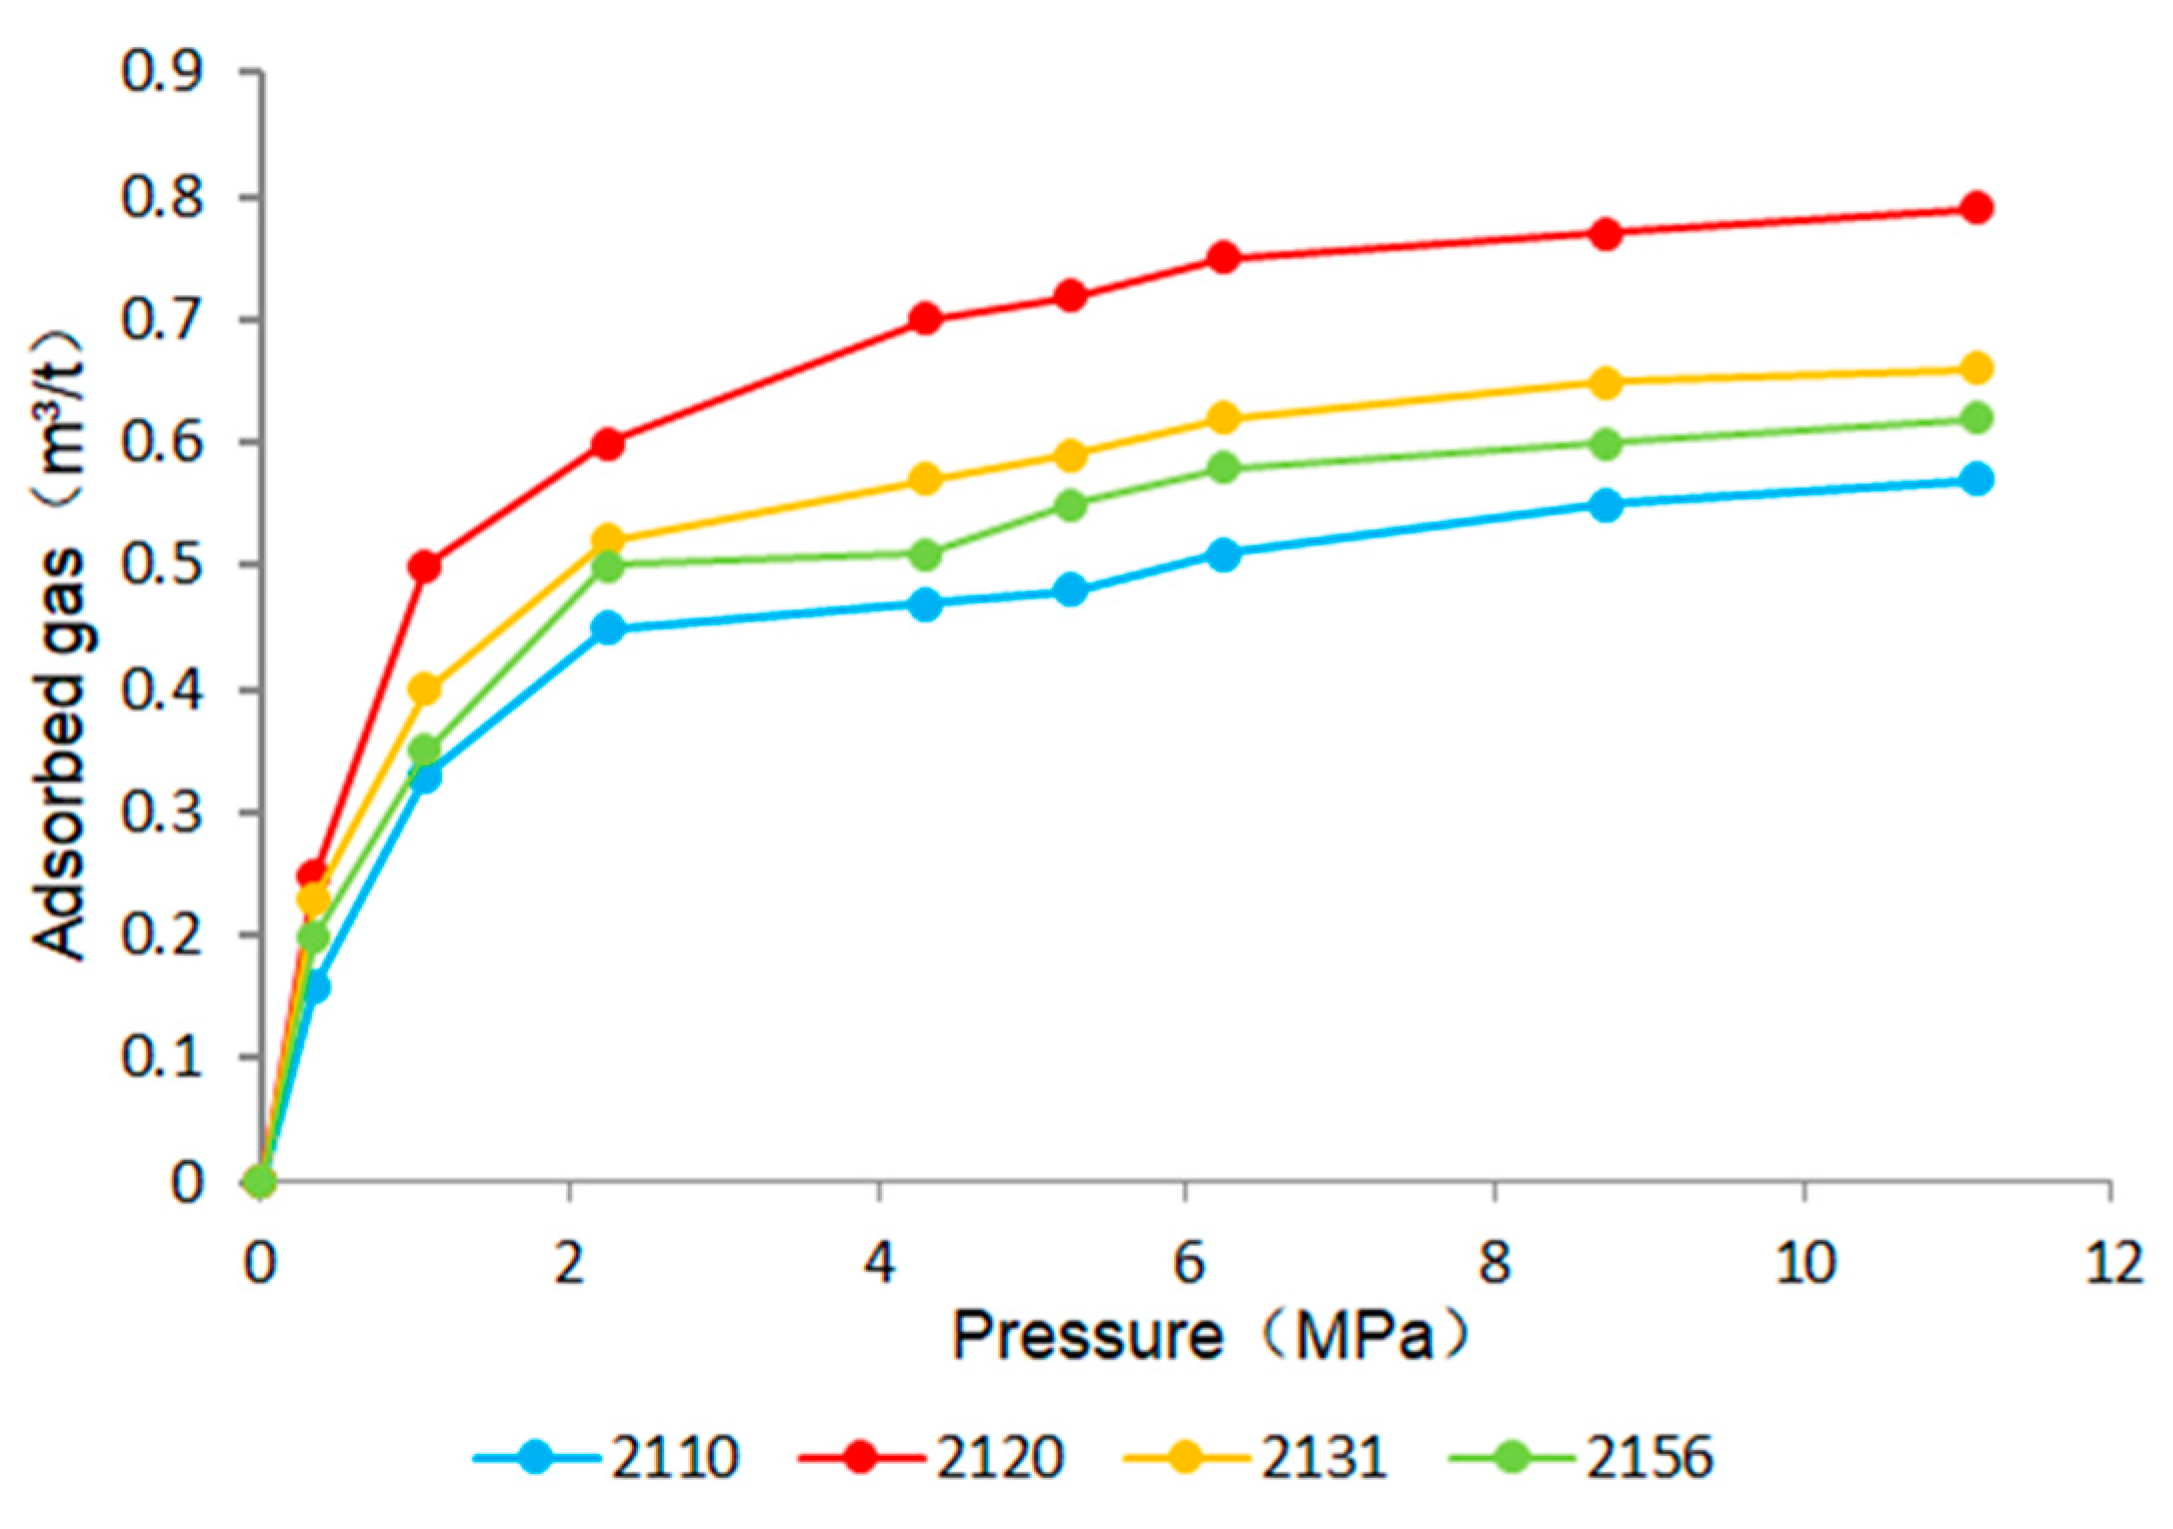
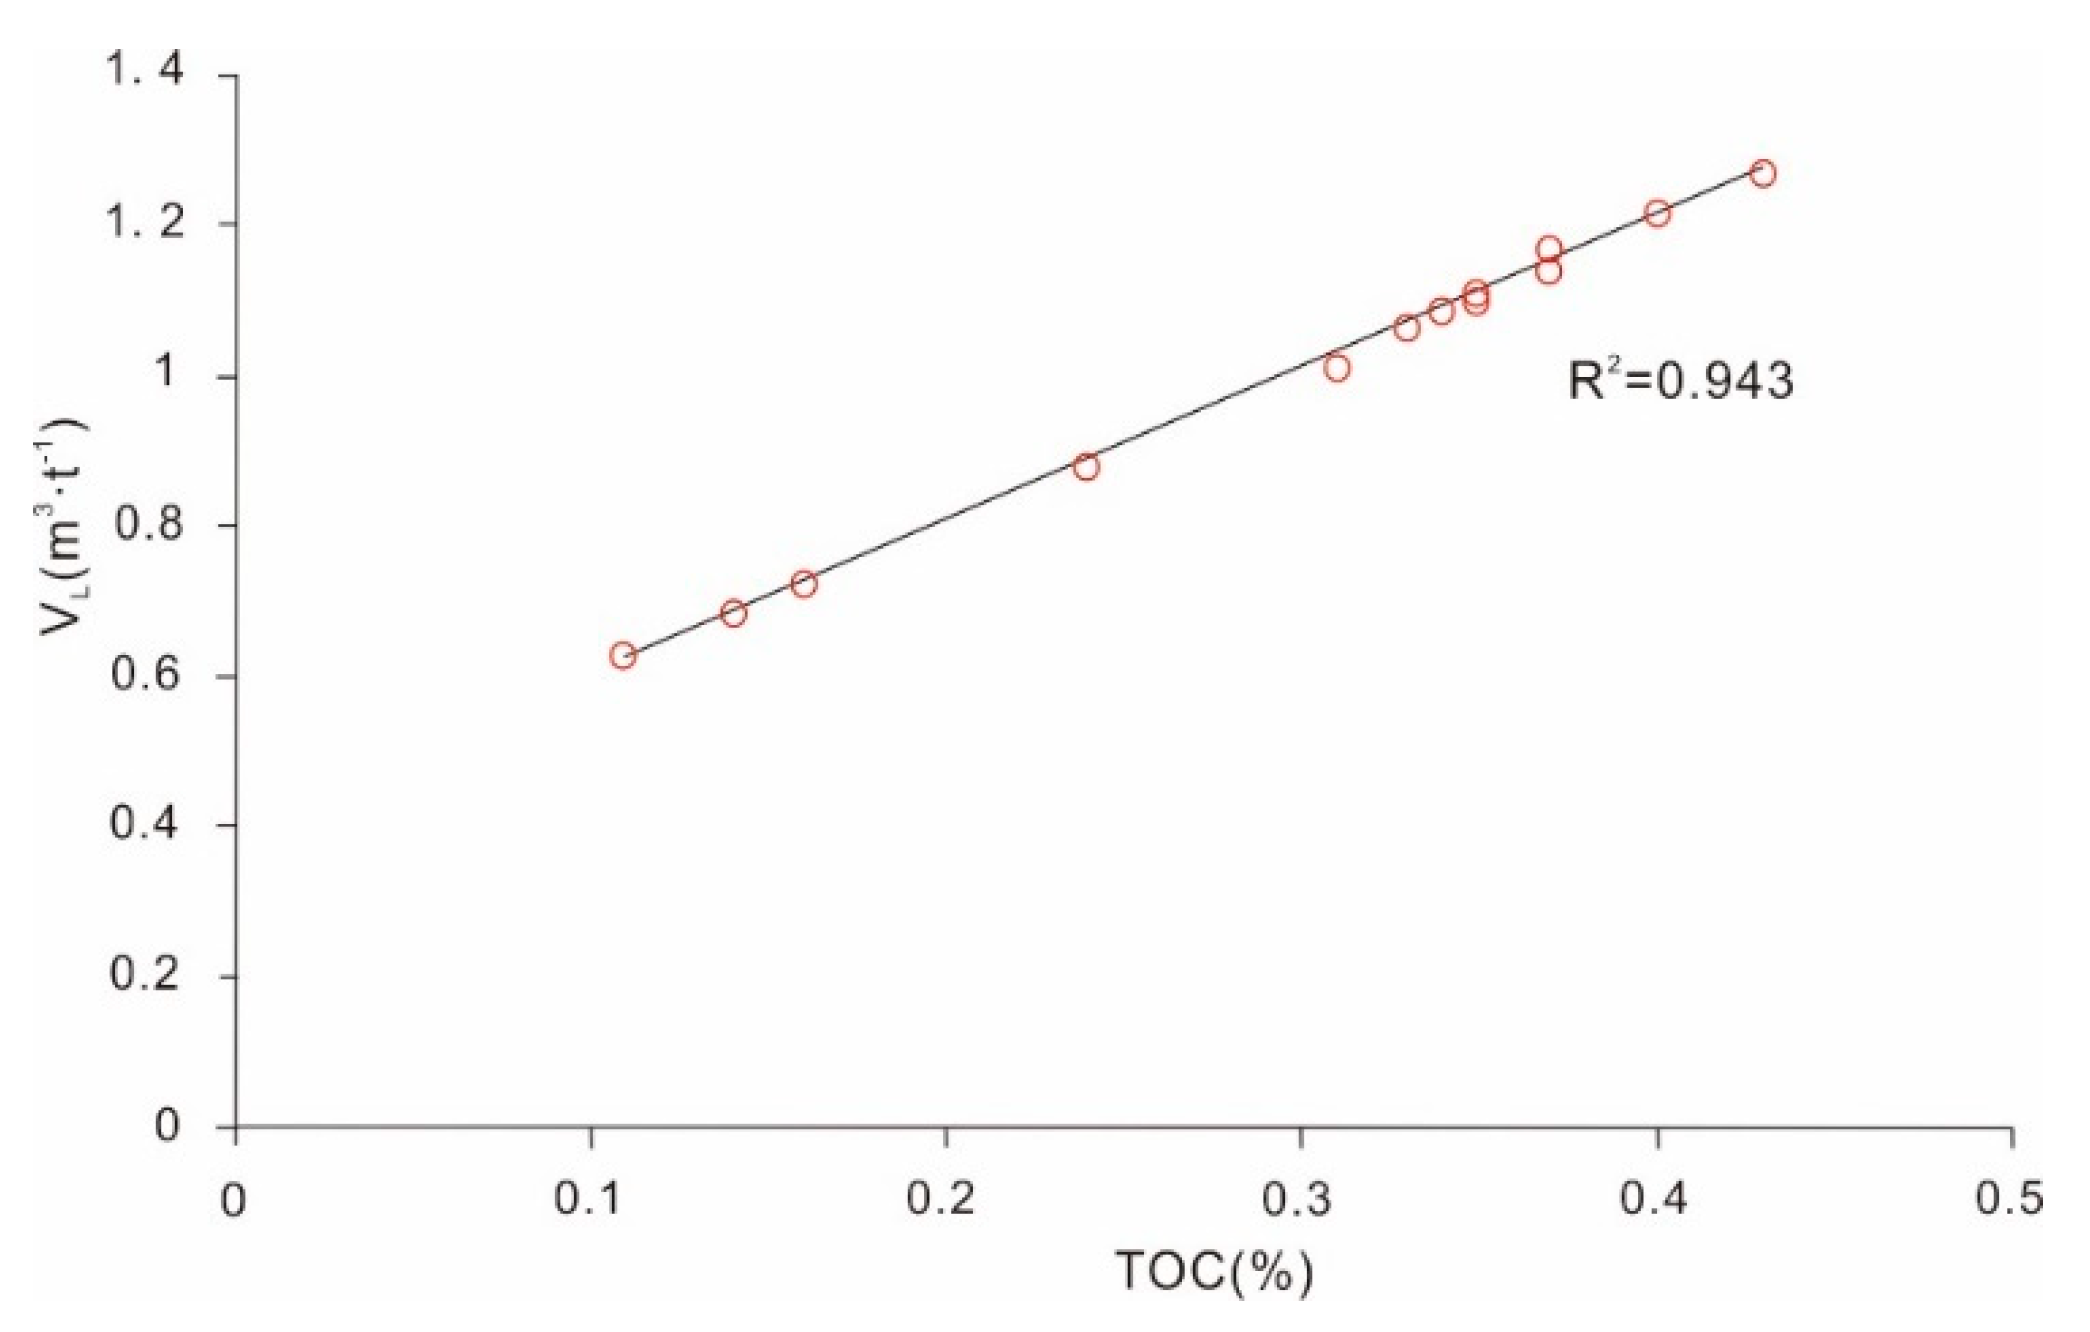
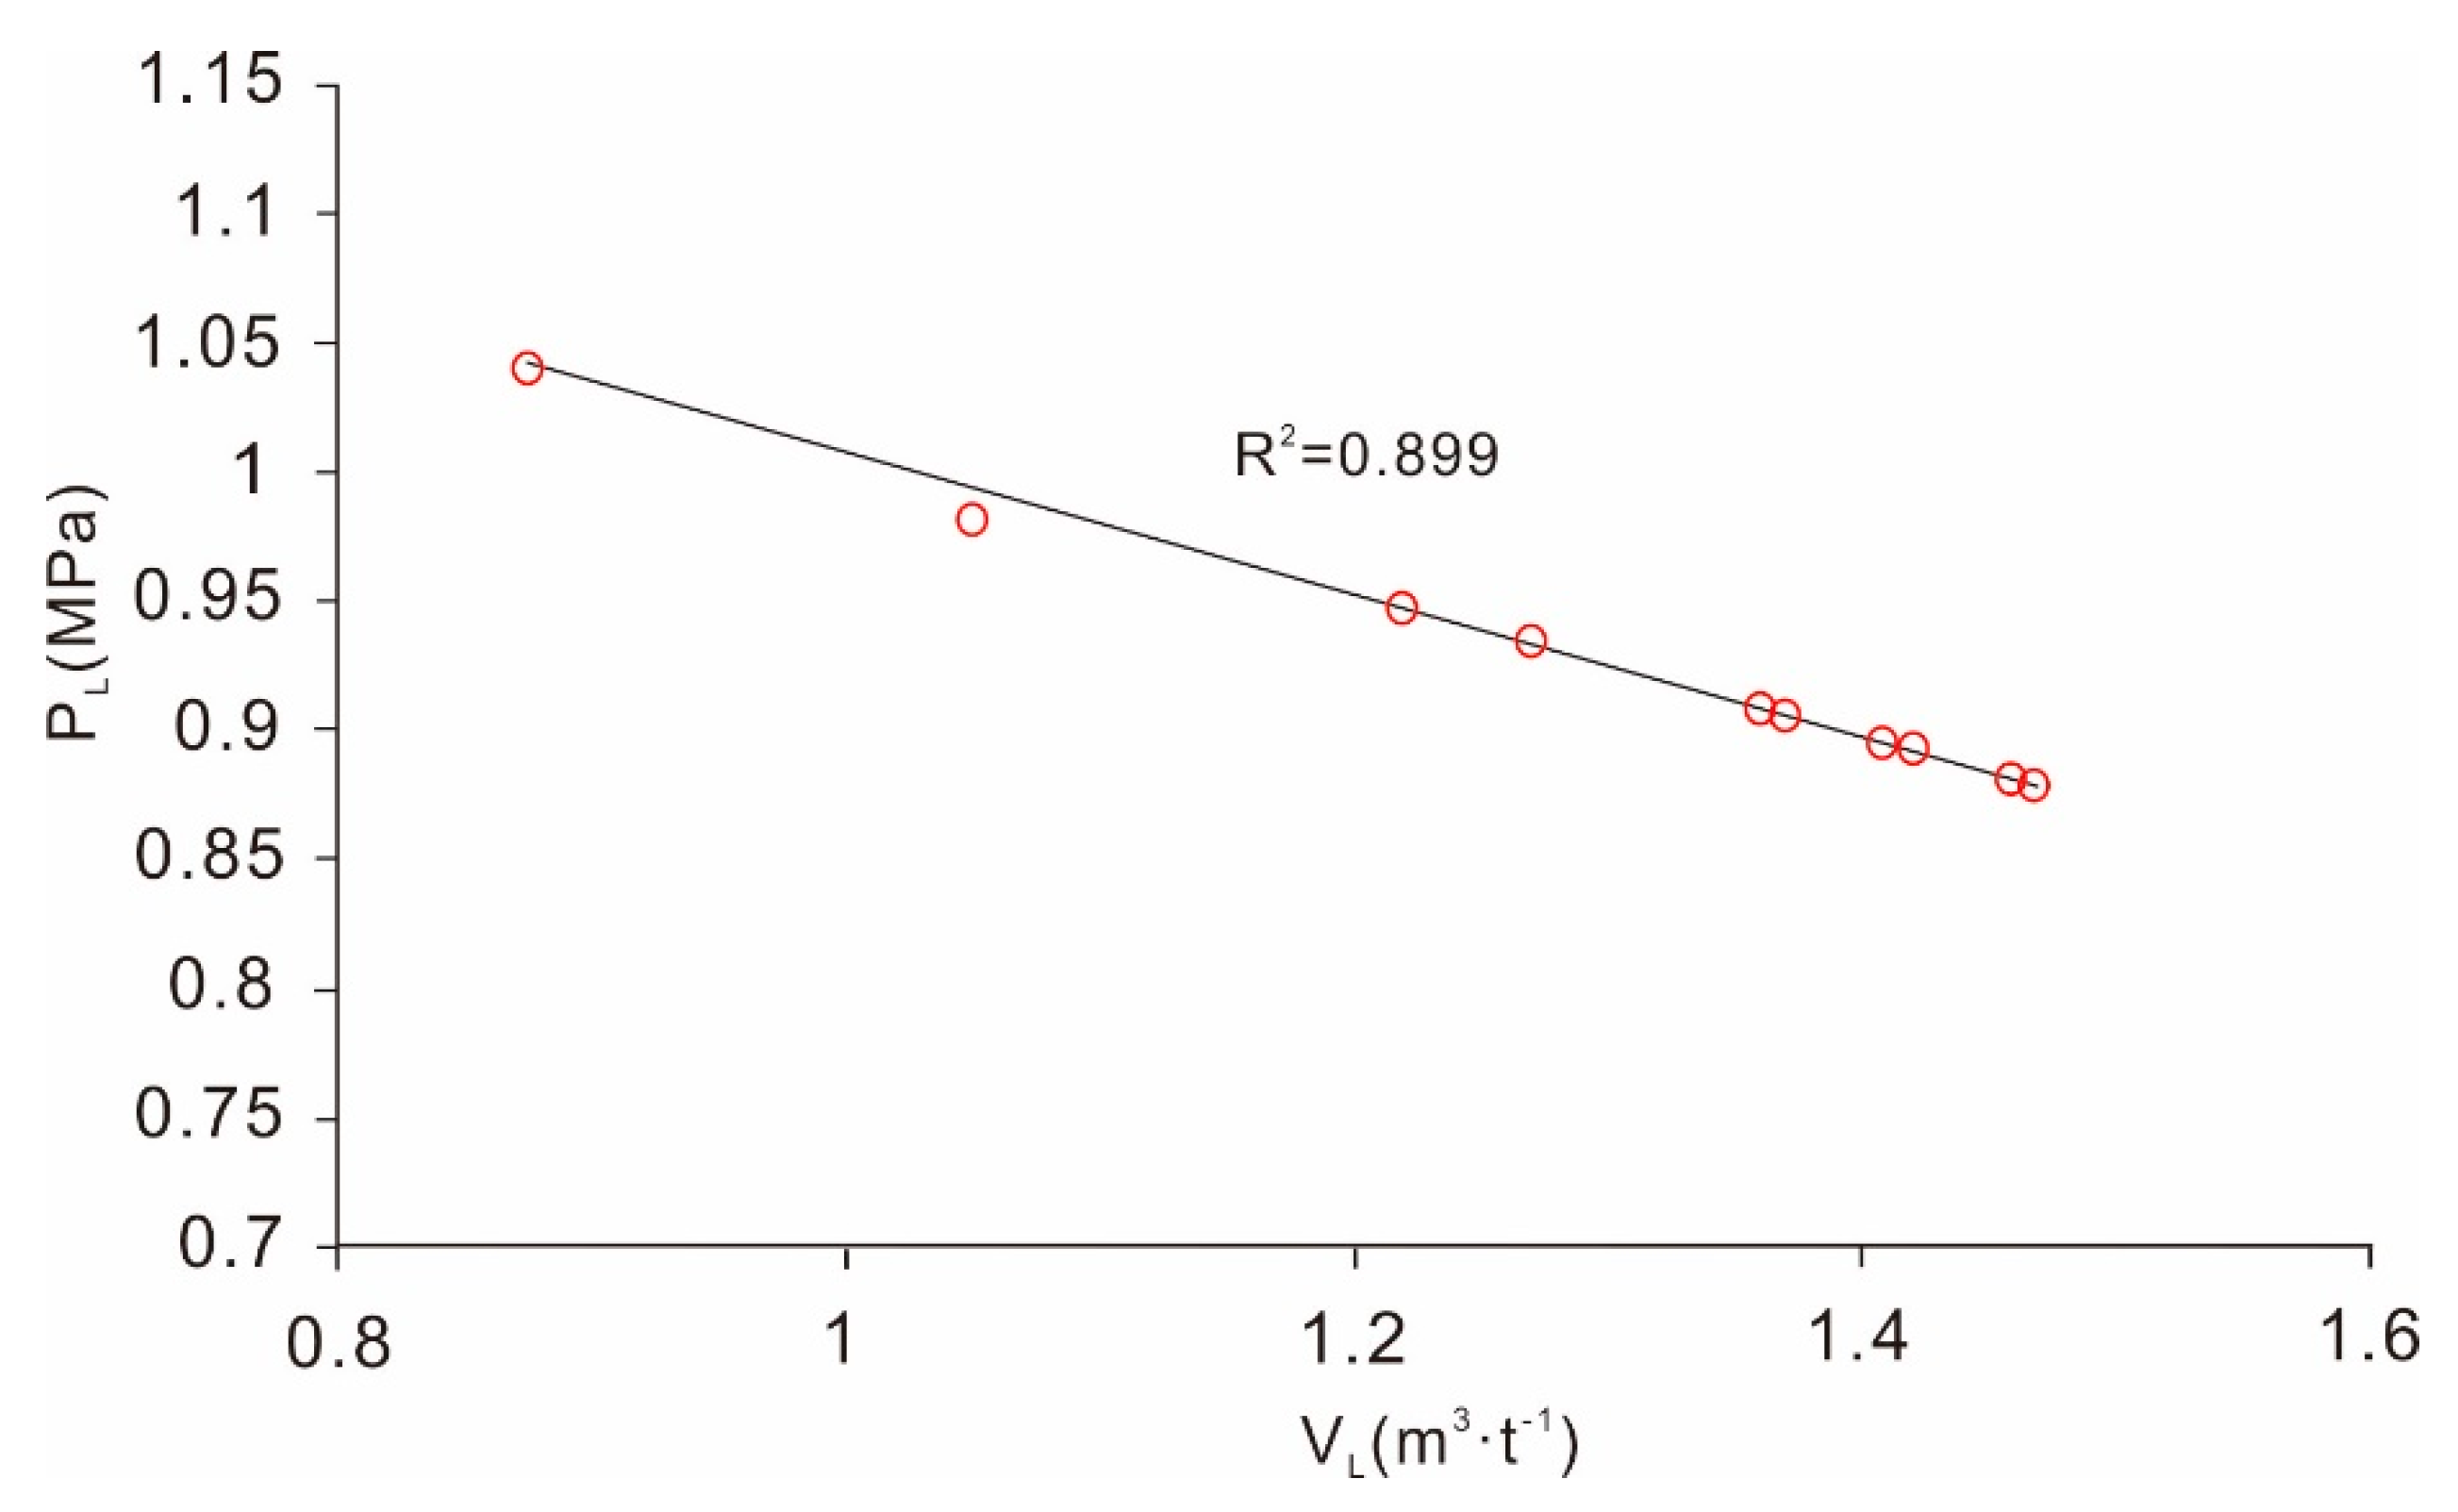
4.2. The Gas Content Measurement of Source Rock in the Shiniulan Formation

The amount of adsorbed gas with pressure changes can be divided into three stages. When the pressure is low (0.00‒2.25 MPa), the amount of adsorbed gas and the pressure are approximately linear, with rapidly increasing values; when the pressure is moderate (2.25‒11.13 MPa), the amount of adsorbed gas rises slowly with the increasing pressure. The adsorption reaches monolayer saturation when the pressure is large enough (greater than 11.13 MPa), and the amount of adsorption does not change with pressure, which is consistent with the adsorption process demonstrated by the Langmuir equation theory. Table 3 shows the experimental data of four mudstone samples of the Shiniulan Fm., indicating that the adsorption performance of mudstone in the Shiniulan Fm. is not strong based on the analysis of the result of the isothermal adsorption experiment (Figure 6).
It can be seen from Figure 7 that the TOCs of samples from Shiniulan Fm. are positively correlated with the adsorption capacity of mudstone (Figure 7). The higher the organic matter abundance, the more micropores that develop in mudstone, resulting in a greater adsorption capacity.
The isothermal adsorption experiments mentioned above also show a relationship in which the Langmuir volume is negatively correlated with the Langmuir pressure (Figure 8). The fitting coefficient (R2) reaches 0.899, indicating that the Langmuir pressure is one of the influential factors of Langmuir volume.
Adding up the data points obtained from the isothermal adsorption experiments of the samples implies a good fit for the formulas regarding the relationship between the Langmuir pressure and the Langmuir volume, and the Langmuir volume and the TOC, respectively. Consequently, the formulas for the adsorption gas content of the Shiniulan Fm. samples can be derived.
PL=−0.276 VL + 1.2839
VL = 2.0404TOC + 0.393
Substituting the fitting formula into the Langmuir model (using Equation (2)), the formation pressure is converted into an equation between the formation pressure coefficient and depth and other parameters. The adsorption gas content of calcareous mudstones (units of m3/t) was obtained based on the following equations.
P = k × Ph
Ph = ρgh
Q = ( 20 T O C + 3.8514 ) k h 506 T O C + 1173.9 + 9.8 k h
where k is the formation pressure coefficient, h is the depth, Ph is the hydrostatic pressure, ρ is the density of water, and g is the gravitational acceleration.
Through the calculated volumes of the adsorption gas and free gas from the Shiniulan Fm., the theoretical gas content of the Shiniulan Fm. gas can be obtained (Table 4).
The porosity data of core samples from the Shiniulan Fm. show a good linear correlation with the content of free gas (Figure 9). Under the condition that the amount of generated gas is definite, the volume of the free gas is mainly affected by the porosity of mudstone. The extent of the porosity is controlled by the development of the pores and the fractures. Thus, the more developed the pores and the fractures, the higher the content of free gas. In addition, a large number of fractures are conducive to the desorption of adsorbed gas, which was converted into more free gas.
Thus, the theoretical gas content of samples can be obtained by the volumes calculated of the adsorption gas and free gas together, as shown in Table 5.
Table 6 provides the results of the gas content (including the desorbed gas content and lost gas content) of the samples. The total gas contents of the mudstone in Shiniulan Fm. range from 0.065 to 0.841 m3·t−1. The total gas contents of Wufeng (2.3‒6.2 m3·t−1)-Longmaxi (3.1‒6.1 m3·t−1) Fm. are generally greater than 3 m3·t−1, even reaching 6 m3·t−1 at the depth of 2323–2326 m. It is apparent that the content of the Shiuniulan mudstone is much lower than that of the Wufeng–Longmaxi Fm. shale (Figure 10).
However, the desorbed gas contents we collected of samples with active oil-gas were especially low, ranging mainly from 0.1 to 0.2 m3·t−1; the maximum was 0.842 m3·t−1. The gas of Shiniulan mudstone mainly exists in free states. Thus, the low desorbed gas contents tend to be primarily caused by the escape of free gas from horizontal fractures (Figure 11) during the processes from lifting the drill to canning. What you should note here is that the USBM direct method is usually used to predict the gas contents of shale or coal. These data would be fairly low due to the gas samples extracted from the interbedded rock association, with only appropriate meaning as a reference.

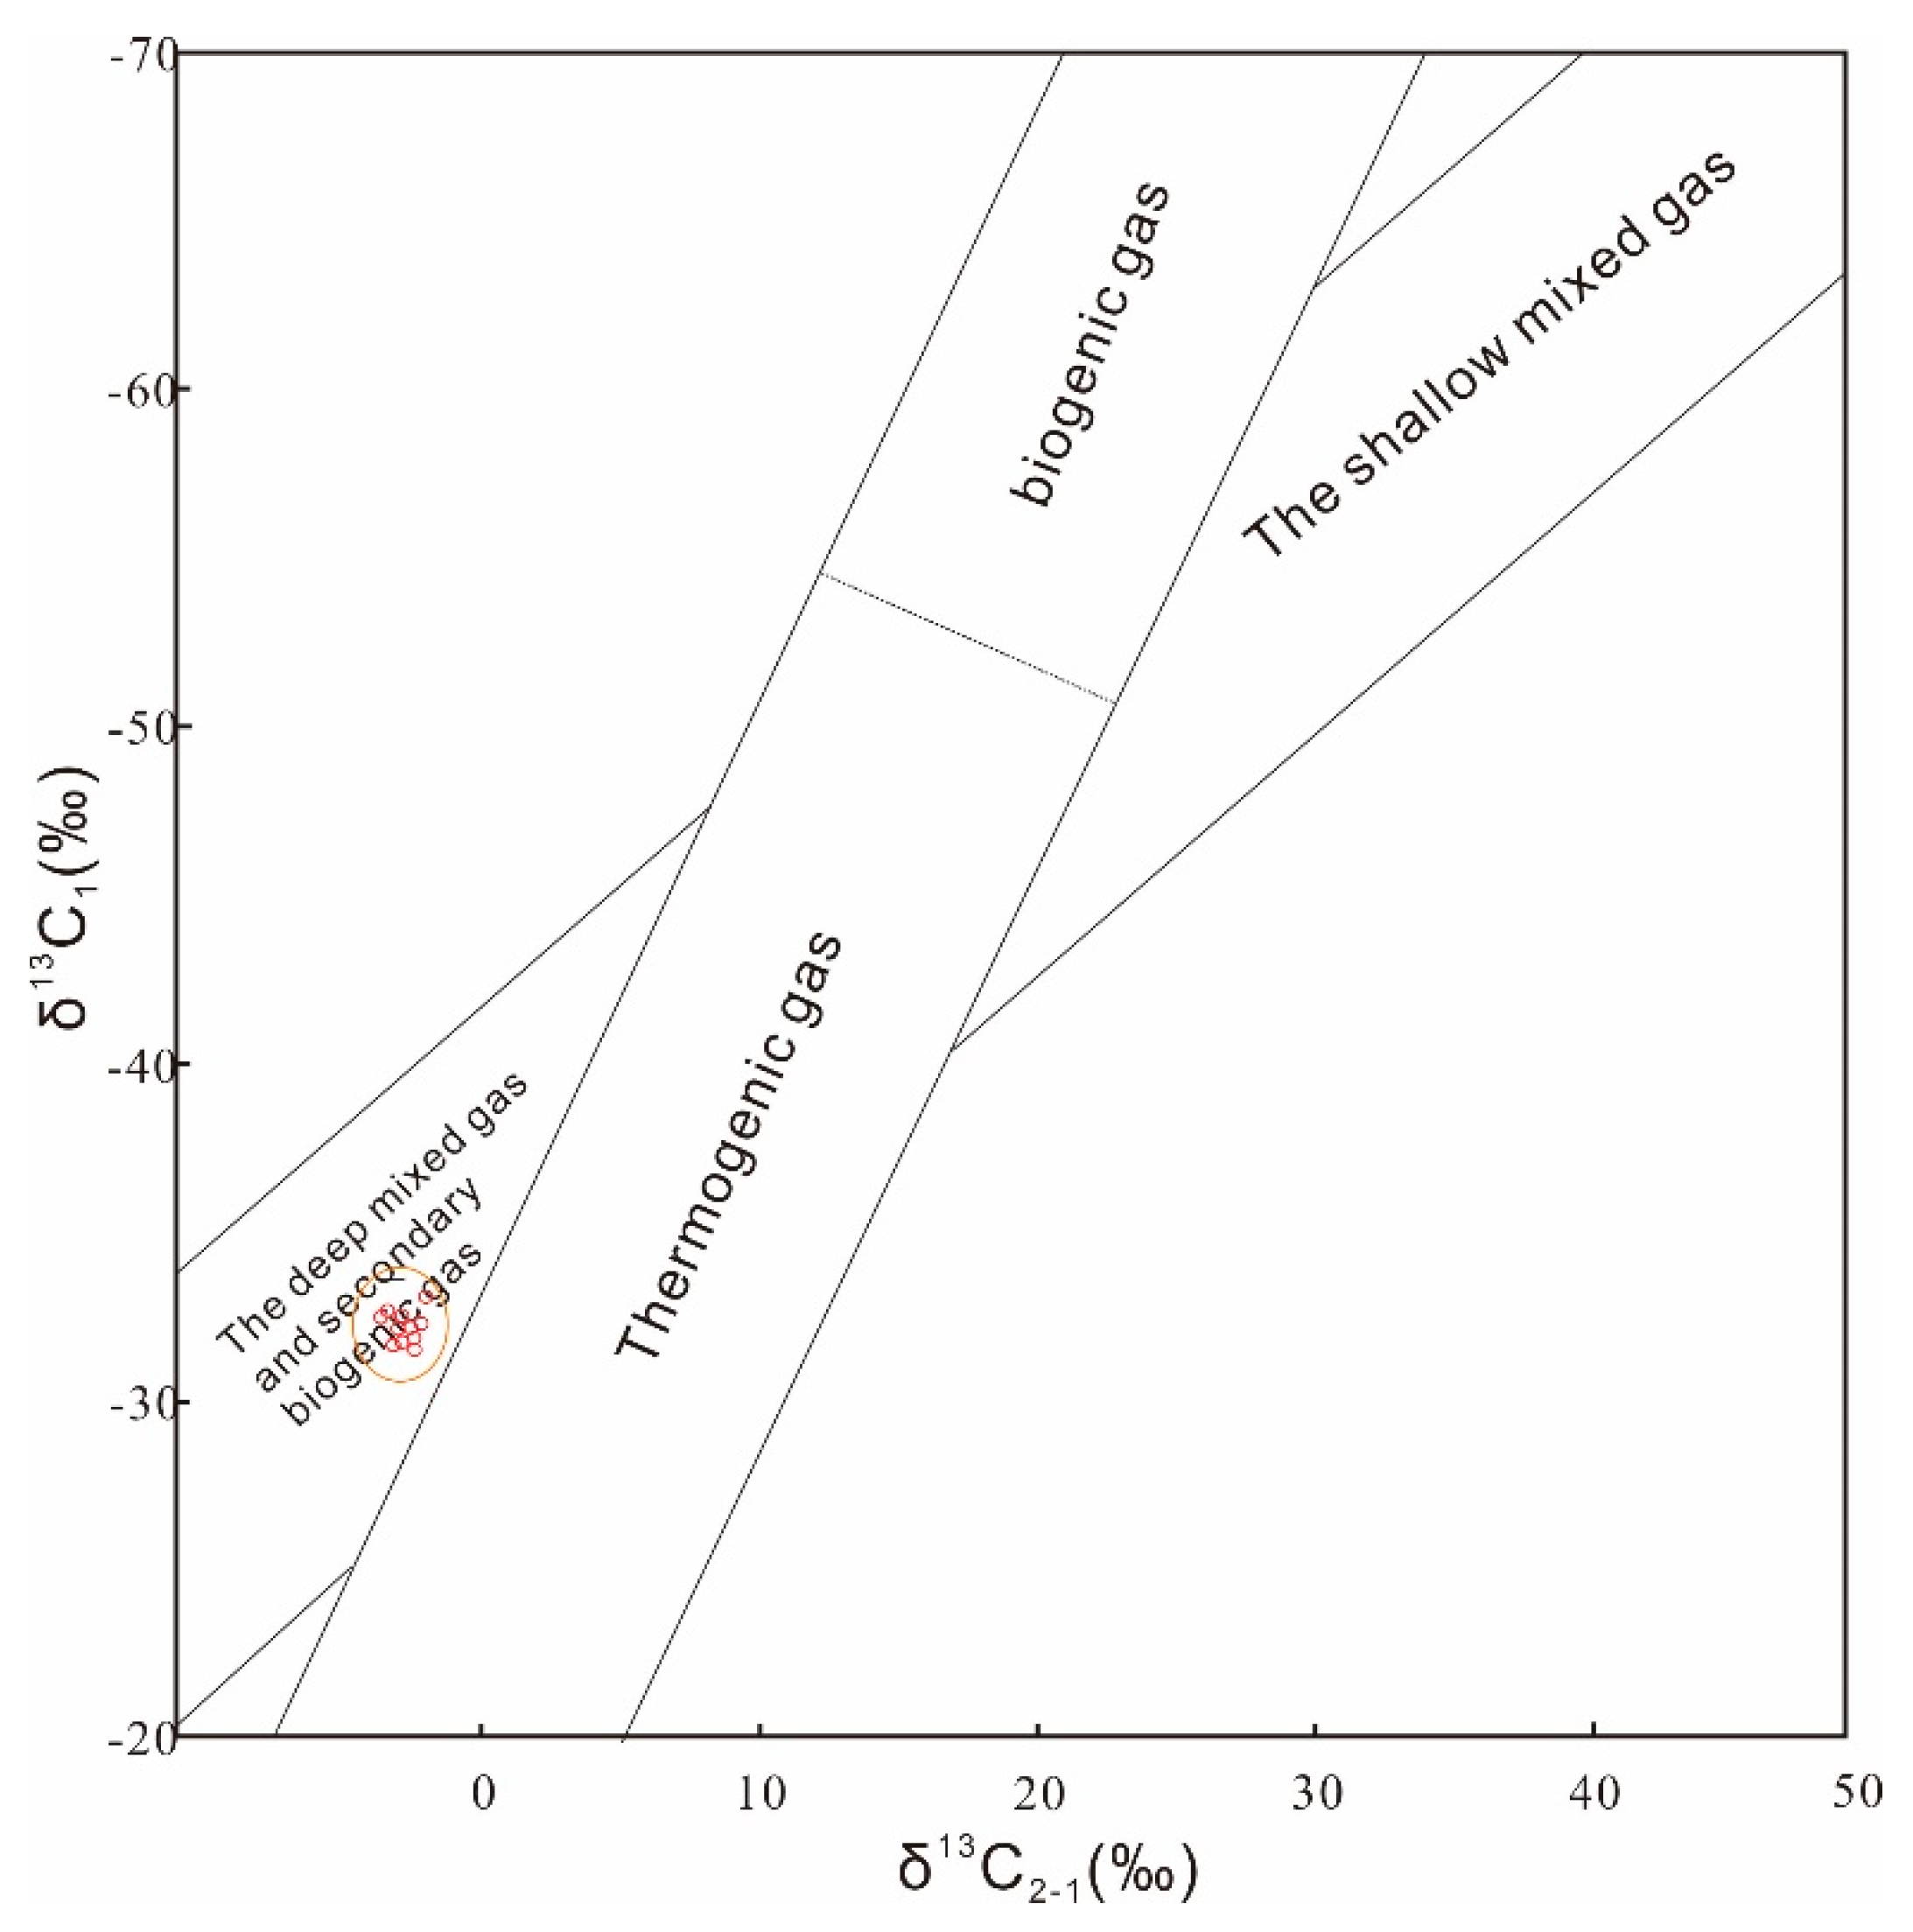
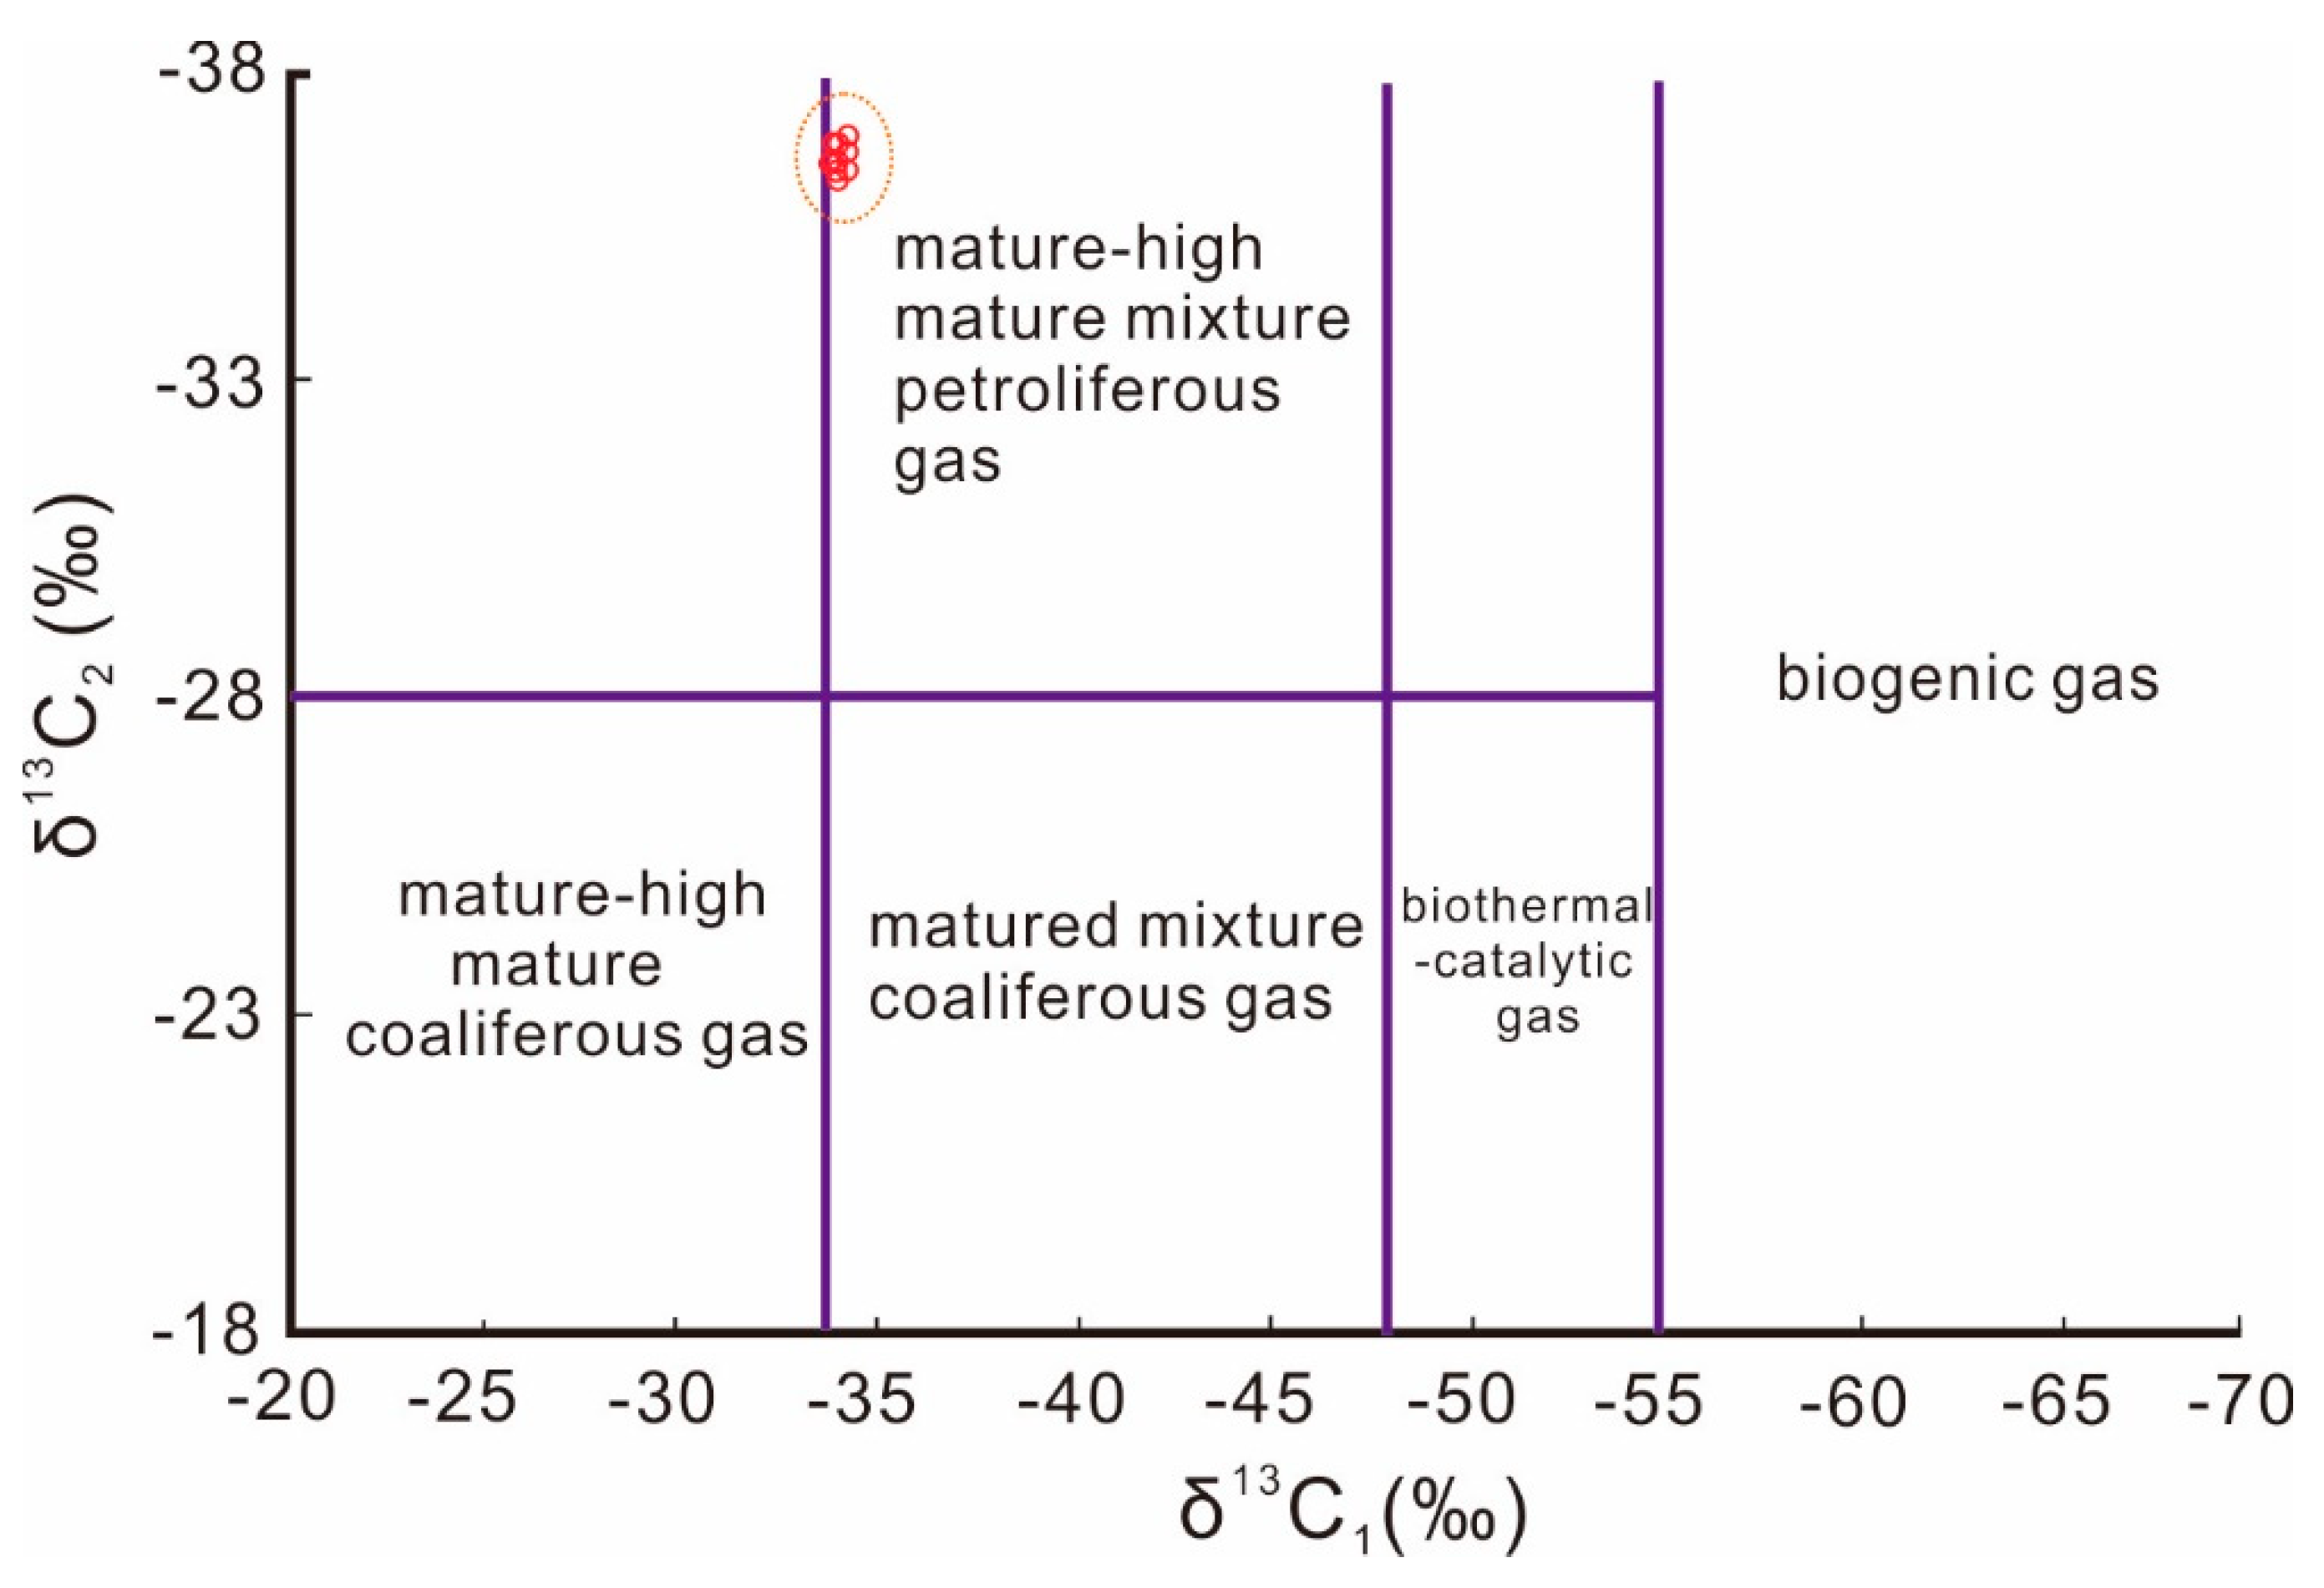
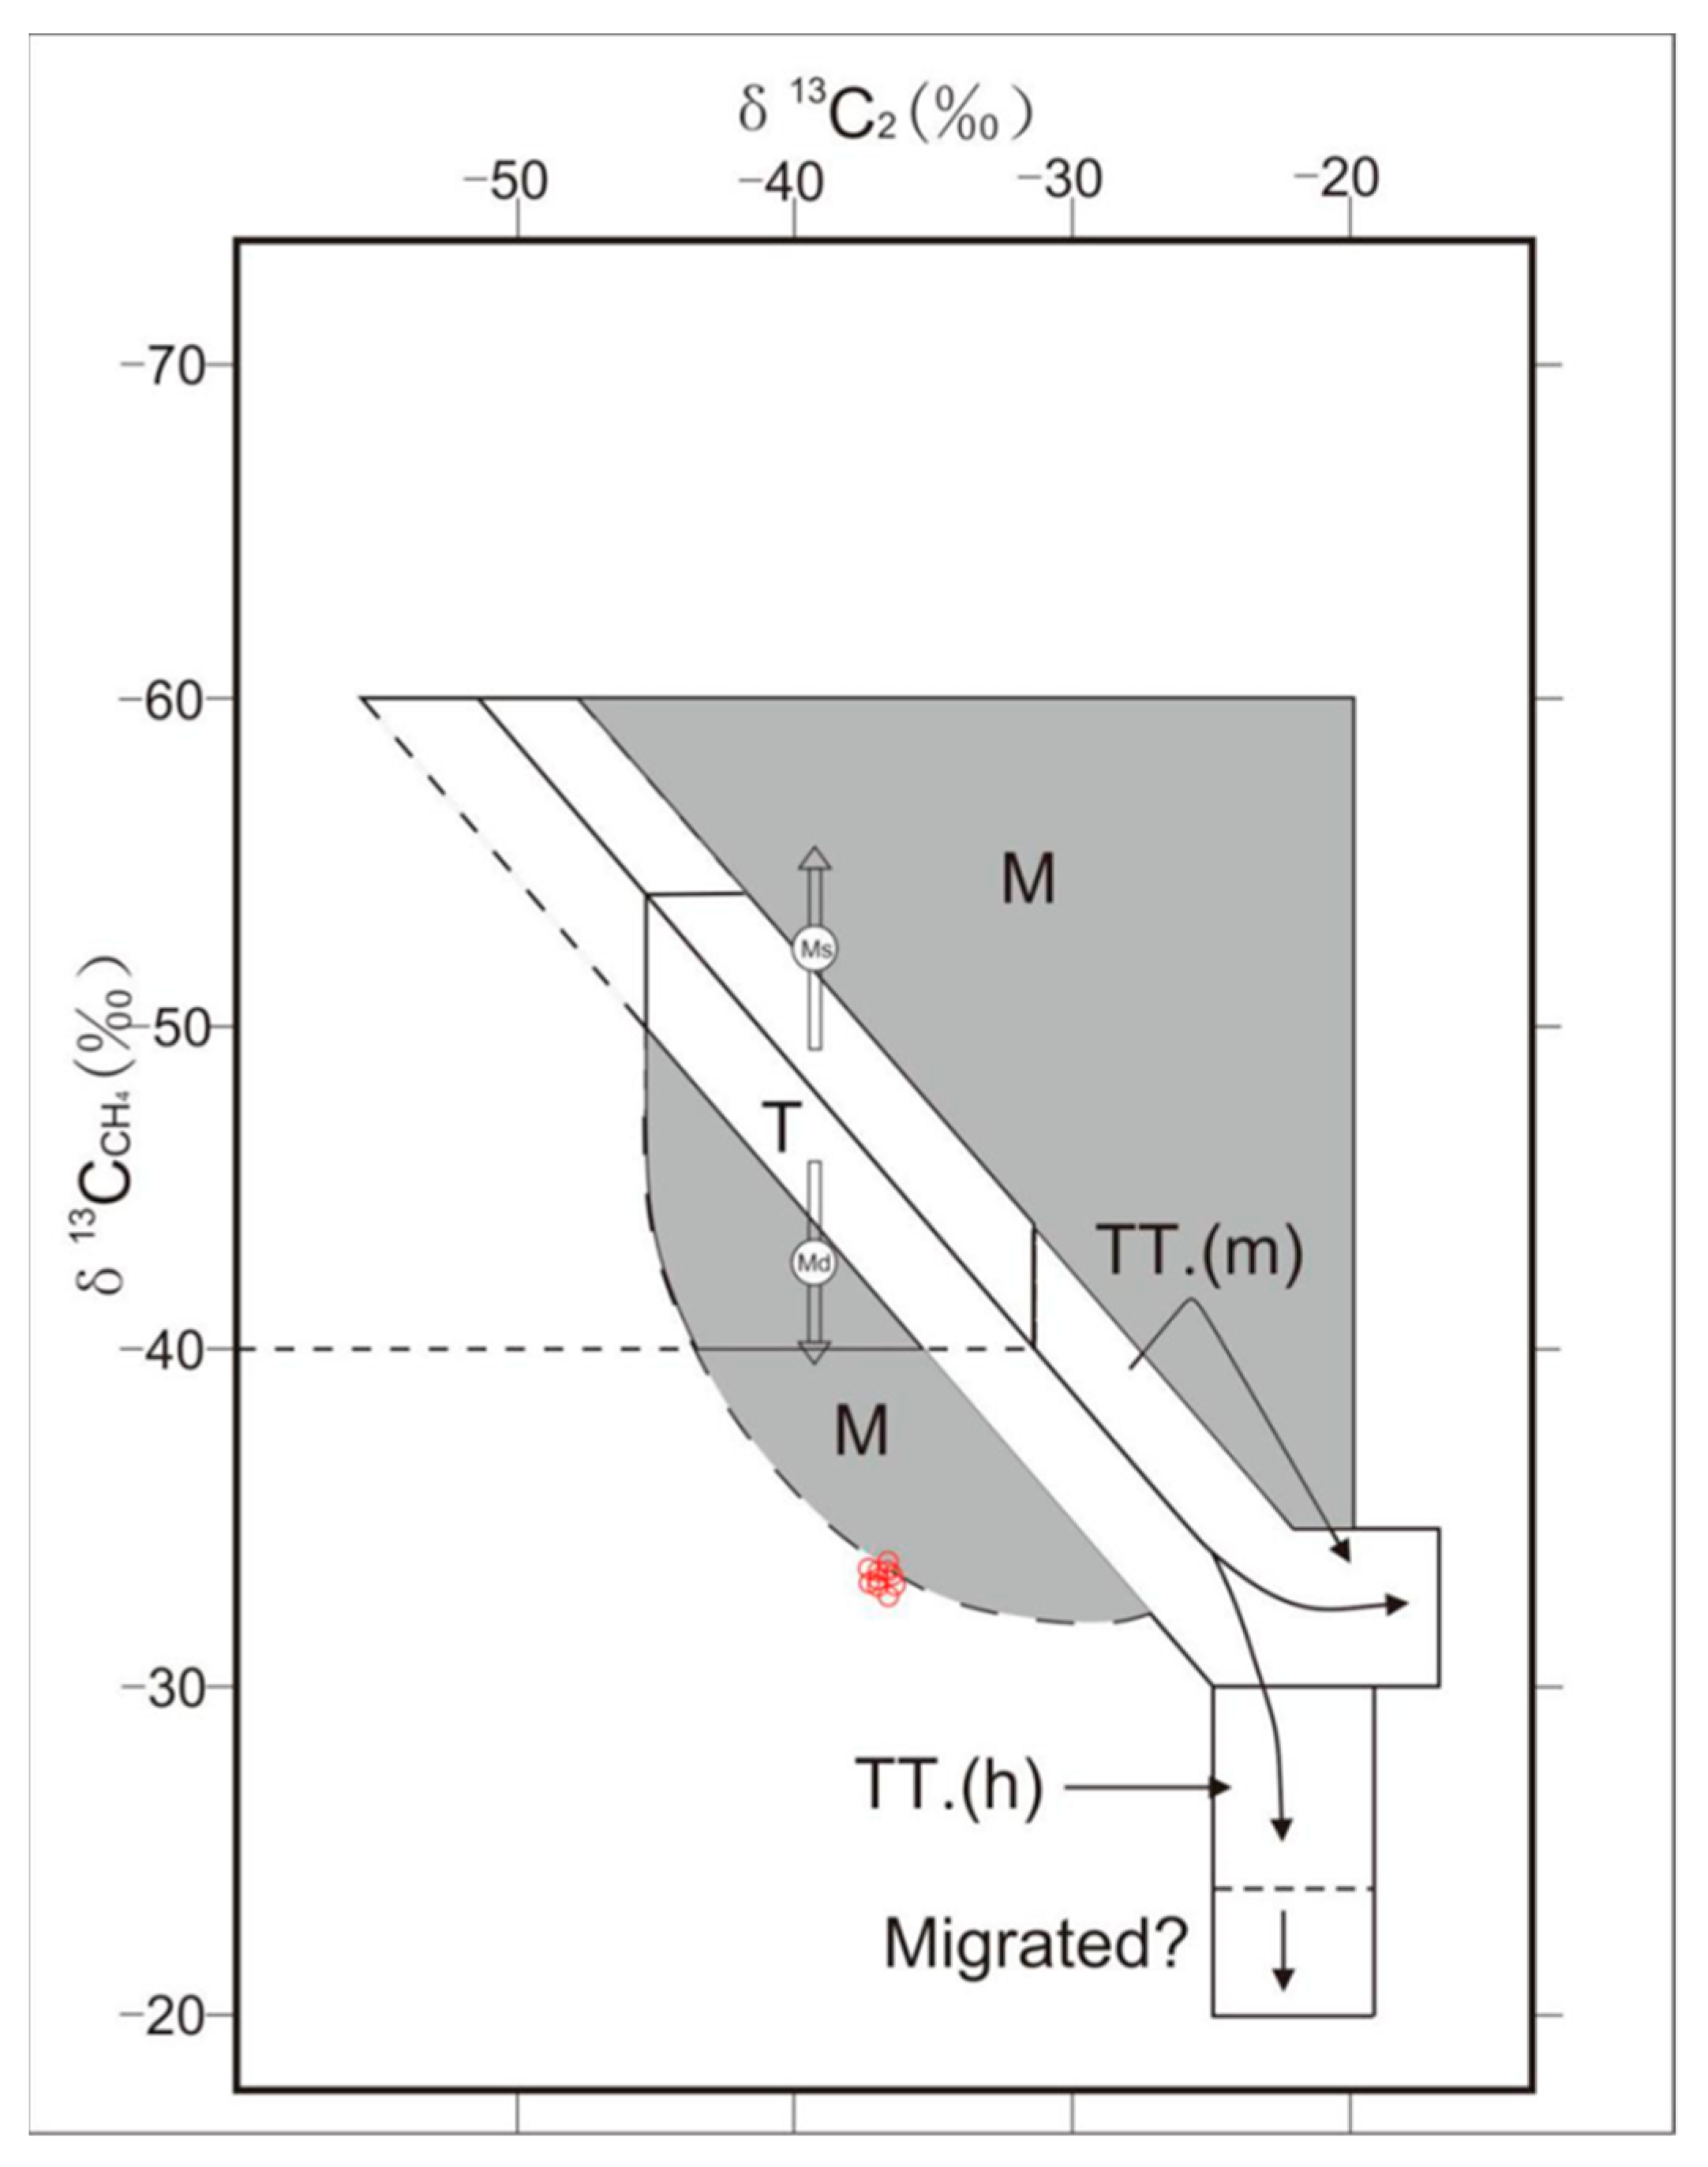
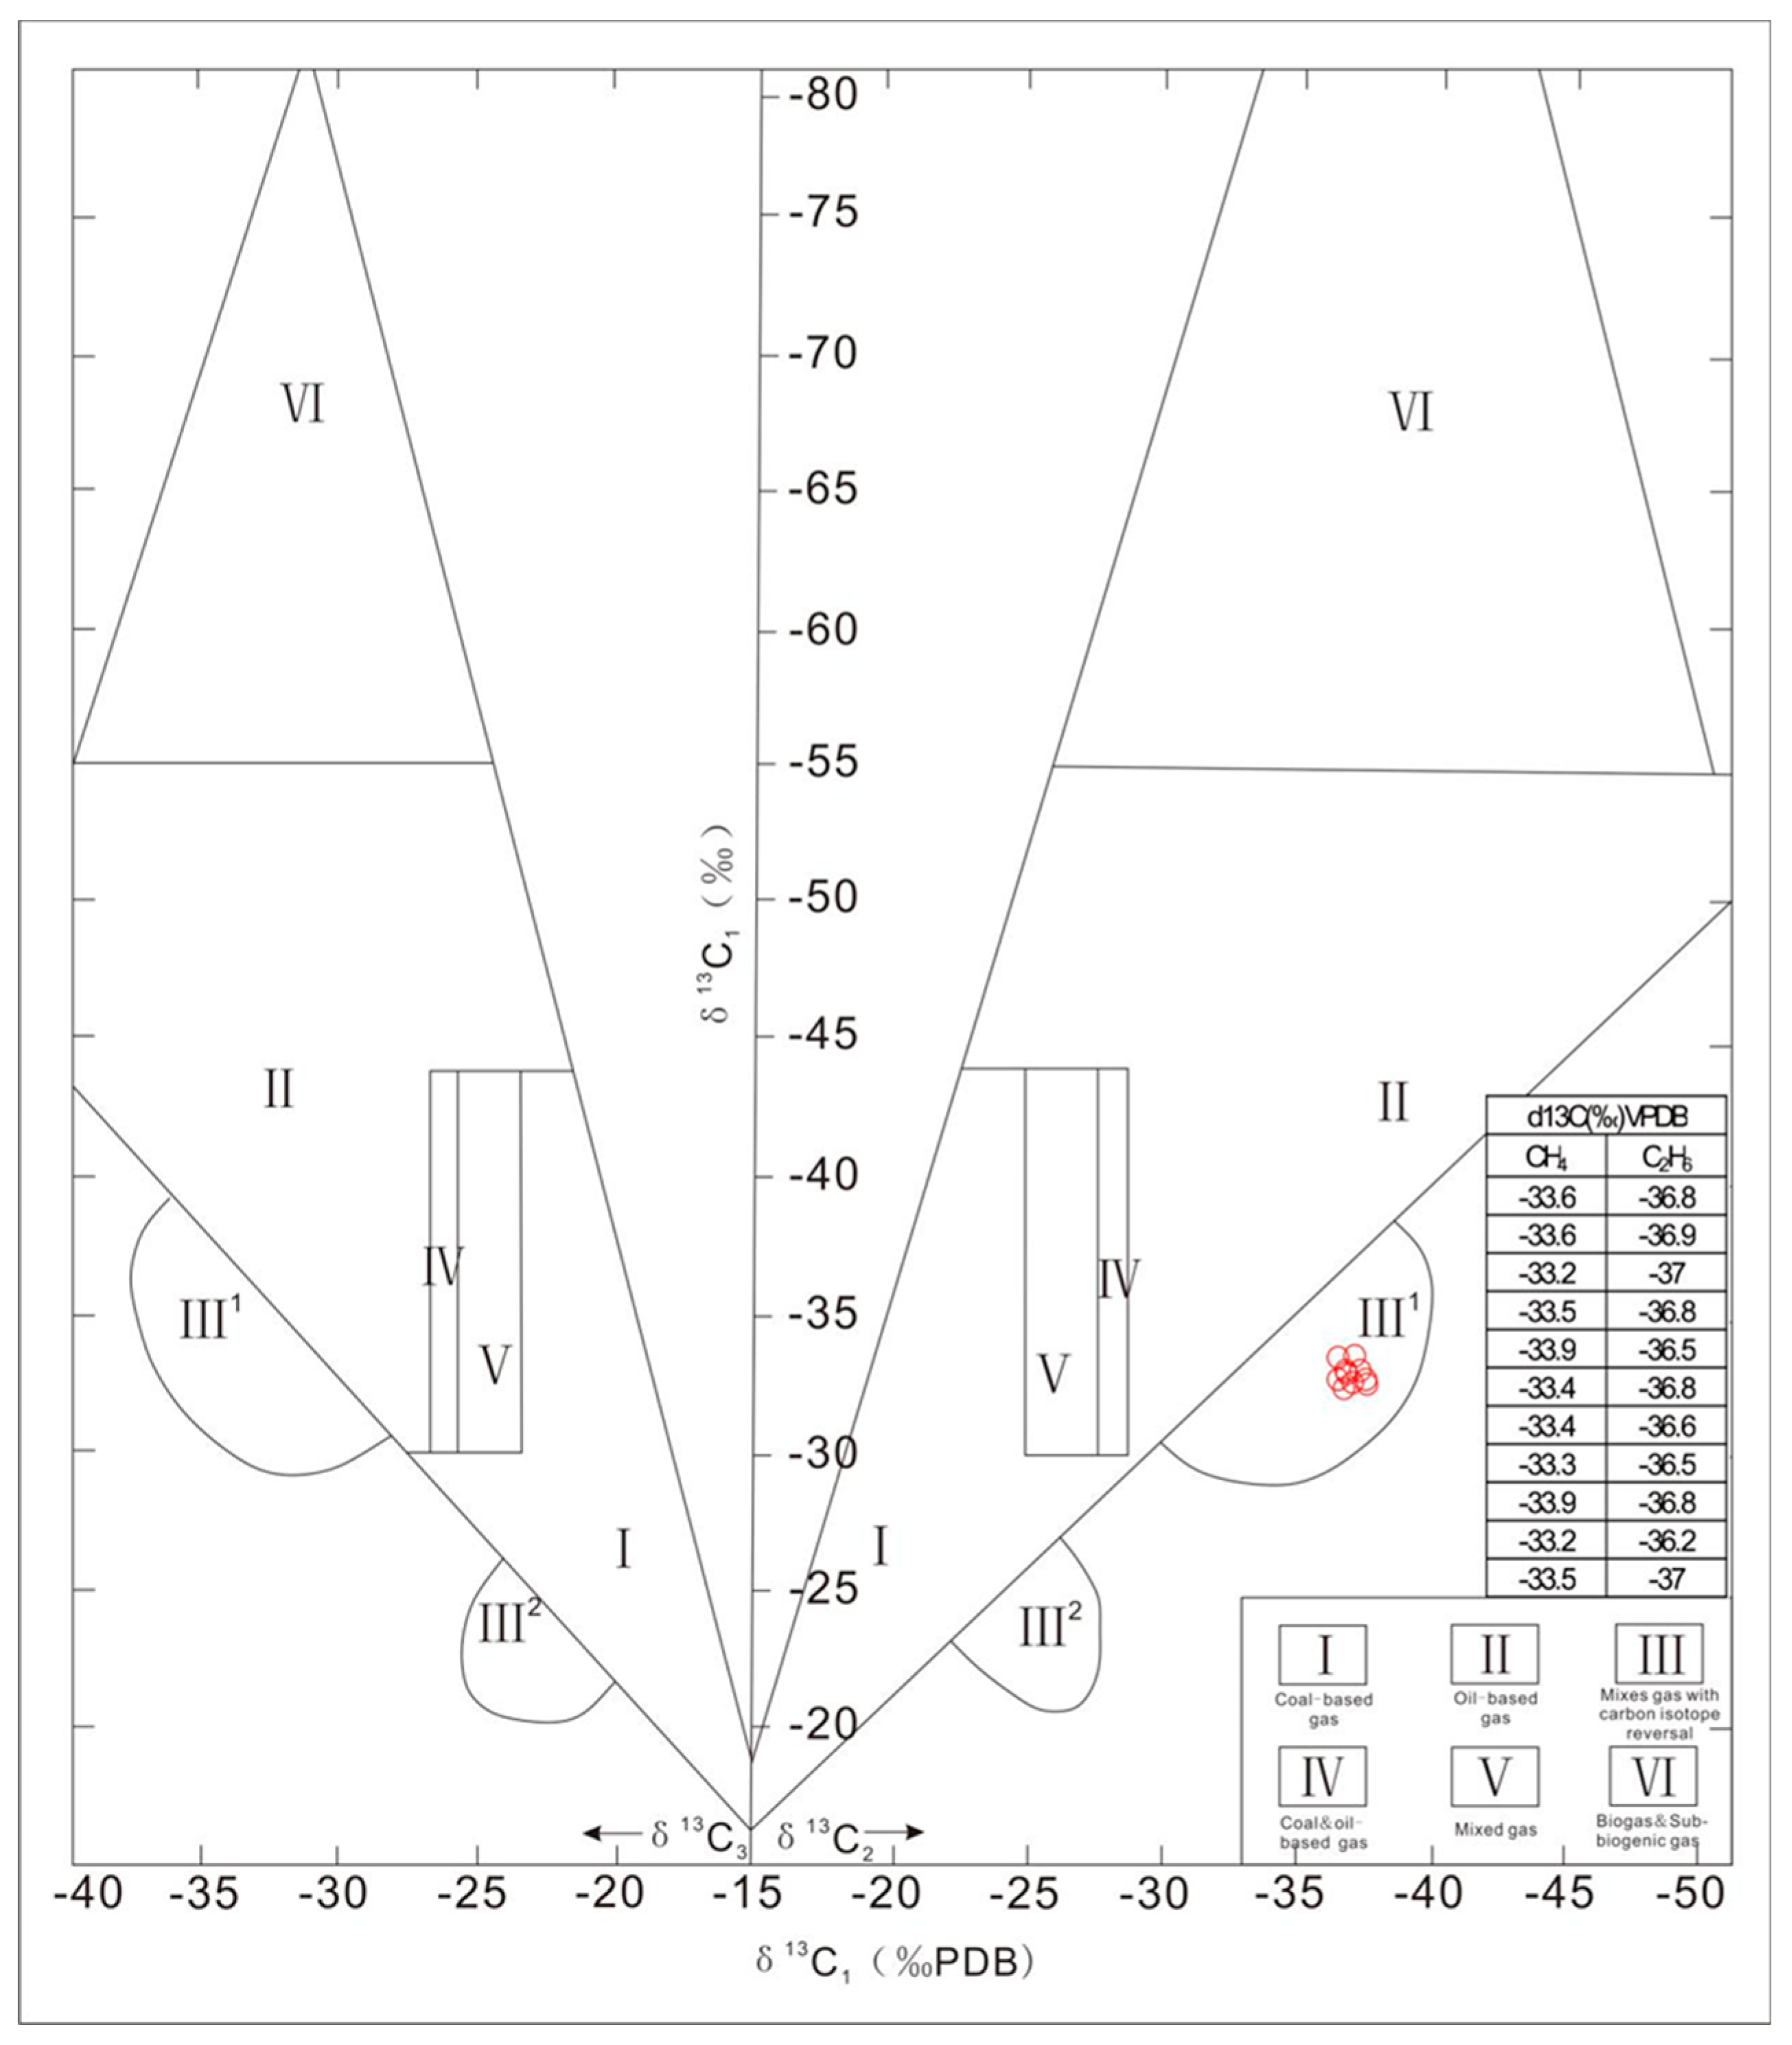
4.3. The Origin of Gas from the Siniulan Formation

Alkane gas is one of the most fundamental and major components of natural gases in the Shiniulan Fm. As shown in Table 7, for eleven gas samples from sample AY-1, the CH4 and C2-3 contents were in the range of 95.244%‒96.432% and 2.167%‒2.2%, respectively. CO2 is the most fundamental and major part of the non-hydrocarbons in the gas samples, with a content in the range of 0.709%‒0.864%.
The experimental results of the stable carbon and hydrogen isotopic compositions of alkanes indicate that the δ13C1 values in methane vary from −33.9‰ to −33.2‰ (average −33.5‰), compared with −37.0‰ to −36.2‰ (average −36.7‰) in ethane. Furthermore, the hydrogen isotope (δD) data were obtained, which are mainly distributed from −156.6‰ to −145.8‰ (average −150‰). The δ2HC2H6 values could not be detected due to the low concentration of ethane (Table 7).
The compositions of carbon and hydrogen isotopes in association with the molecular composition can be utilized extensively to discern the gas origin, as suggested by Berner and Faber [41], Chung et al. [42], Schoell [43], Whiticar [44], Strąpoć et al. [45], and Strąpoć et al. [46]. Galimov [47], Colombo et al. [48], Stahl [49], and Schoell [50] showed that the molecular composition of natural gases and the isotope ratios in the hydrocarbons are both in control of processes during the formation of the gases.
The X-identification chart, which was proposed by Zhang et al. [51] is used to determine the natural gas genetic type according to Dai. [52]. As shown in Figure 12, all gas samples from the Shiniulan Fm. could be recognized as a mixed source when deep-seated. According to the carbon isotope of methane and ethane distribution characteristics, the natural gas genetic type identification criteria and principles are used to determine the origin of the natural gas—which is a mature–highly mature oil-based mixture in the Shiniulan Fm.(Figure 13)—as presented by Ding et al. [53].
That combination of the δ13C values of ethane and methane is also useful for determining the genetic types of the gases. According to the δ13C213C1 identification chart to identify the gases from Shiniulan Fm., in the study area, they fall into field M in the chart, which might be due to the methane in over-mature zones below the formation possibly migrating through these areas (Figure 14).
In general, the carbon isotope of organic origin primary alkane gas is a series of normal carbon isotopes (δ13C1 < δ13C2 < δ13C3 < δ13C4) according to Dai et al. [54]. The cause of the reverse of the carbon isotope series of organic alkane hydrocarbons in Shiniulan Fm. is a mixed gas which is derived from the same source rock with different gas generating stages or the same genetic types in different source rocks.
Natural gas in the Shiniulan Fm. is mainly distributed in the carbon isotope inverted series gas zone based on the carbon isotope chart of methane and ethane of natural gas proposed by Dai (Figure 15) [55]. Furthermore, δ13C values of alkane gases in Shiniulan Fm. are close to those reported previously in the Wufeng–Longmaxi shale in southern Sichuan Basin, indicating that Wufeng–Longmaxi Fm. may have been a potential gas source rock for Shiniulan Fm. The isotopic rollovers of natural gas in Shiniulan Fm. may have resulted from carbon exchange at high temperature (Dai et al. [56]). The potential contribution of Wufeng–Longmaxi Fm. is also consistent with the gas content results. Through the comprehensive comparison of the in-place gas content reconstructed, the amount of gas measured by the indirect methods and direct methods from the Shiniulan calcareous mudstone samples reflect the fact that mudstone samples with lower organic abundance have certain hydrocarbon-generation potential, which is largely insufficient to satisfy the gas content currently stored within its layer. It can be preliminarily concluded that the gas source of the Shiniulan Fm. mudstone is partly derived from the gas source rocks in other formations, probably Wufeng–Longmaxi Fm. However, there are not enough figures and information to determine definite gas sources in Shiniulan Fm., and thus further studies are needed.
Through the comprehensive comparison of the reconstructed in-place gas contents, the amounts of gas measured by the indirect methods and direct methods from the Shiniulan calcareous mudstone samples reflect the fact that mudstone samples with lower organic abundance have certain hydrocarbon-generation potential, which is largely insufficient to satisfy the gas content currently stored within its layer. It can be preliminarily concluded that the gas source of the Shiniulan Fm. mudstone is partly derived from the gas source rocks in other formations. In addition, it can be concluded that there is a mixed-nature gas gathering in the Shiniulan Fm. by the isotope chart. The shale of Wufeng–Longmaxi Fm. is thought to be a potential gas source rock for Shiniulan Fm. However, there are not enough figures and information to determine definite gas sources in Shiniulan Fm., and thus further research is necessary. Through the preliminary judgment of the natural gas types in the Shiniulan Fm., the natural gas accumulation model of the Shiniulan Fm. can be further deduced.

4.4. Accumulation Factors and Natural Gas Accumulation Model of Shiniulan Formation

4.4.1. Accumulation factors of the natural gas from the Shiniulan Formation

It has been confirmed by two-dimensional seismic exploration that the direction of the Anchang slope axis is in the NW–NE direction; the southeast wing is steep, while the northwest wing is gentle. The northwest wing’s inclination angle is approximately 24°, while the southeast wing’s is approximately 30°. It gradually closes, with the increased buried depth of the strata developing near the fault of the slanting core. In the slanting direction, due to the northwest–south–eastward compression of the Yanshan movement and the north–south direction of the early Himalayan movement, three northeast–southwest strike faults were developed. The length of the fault in the bottom of the Longmaxi Fm. varies from 3 to 11 km, with a distance from 80 to 670 m and an inclination between 30° and 50°.
In addition, through the observation and measurement of the outcrop in the Lower Silurian Shiniulan Fm. (Figure 16), it was found that the structural fractures of the Shiniulan Fm. included tensile fractures and shear fractures. The shear fractures have a deep cutting-bed section, stable occurrence, and further extension, with fracture angles in the range of 45°‒90°. Tension fractures often appear in parallel and in groups, with obvious directionality and regular distribution. Structural fractures are generally filled with materials such as calcite and are produced in the areas in which the deformation is severe or the faults are well-developed.
The systematic observation (Figure 17) and statistical analyses of the fractures, in which the length of the cores was 51.5 m and the number of fractures was 1176, from cores of Shiniulan Fm., was completed.
Through the statistical analysis of core fractures, shrinkage fractures resulting from diagenesis in the Shiniulan Fm. mudstone are well-developed, while the structural fractures formed due to stress are rare (Figure 18). The microfractures that developed in mudstone are mainly caused by mineral phase transformation or shrinkage caused by water loss during diagenesis, and consolidation and had nothing to do with structuring. Moreover, most of the microfractures in the Shiniulan Fm. shale are not filled with minerals, while most of the microfractures developed in the limestone are filled with calcite.
Microfractures, as important channels for natural gas, increase the porosity and permeability, and thus improve the capacity of the reservoir, which is conducive to the increase of the free gas volume and the desorption capability of adsorbed gas. A large number of fractures due to diagenesis developed in the special combination of limestone and mudstone to accumulate free methane gas in the Shiniulan Fm. Fractures are hardly developed in limestone, so the limestone is an available cap rock to prevent the leakage of shale gas (Figure 19).
A series of oil and gas exploration practices have shown that the presence of fracture development zones in reservoirs results in high-yield zones with favorable porosity and permeability. The fractures, on the one hand, provide a storage space for oil and gas; on the other hand, they can significantly improve the matrix permeability and the pore connectivity of tight reservoirs, providing an effective channel for fluid migration.

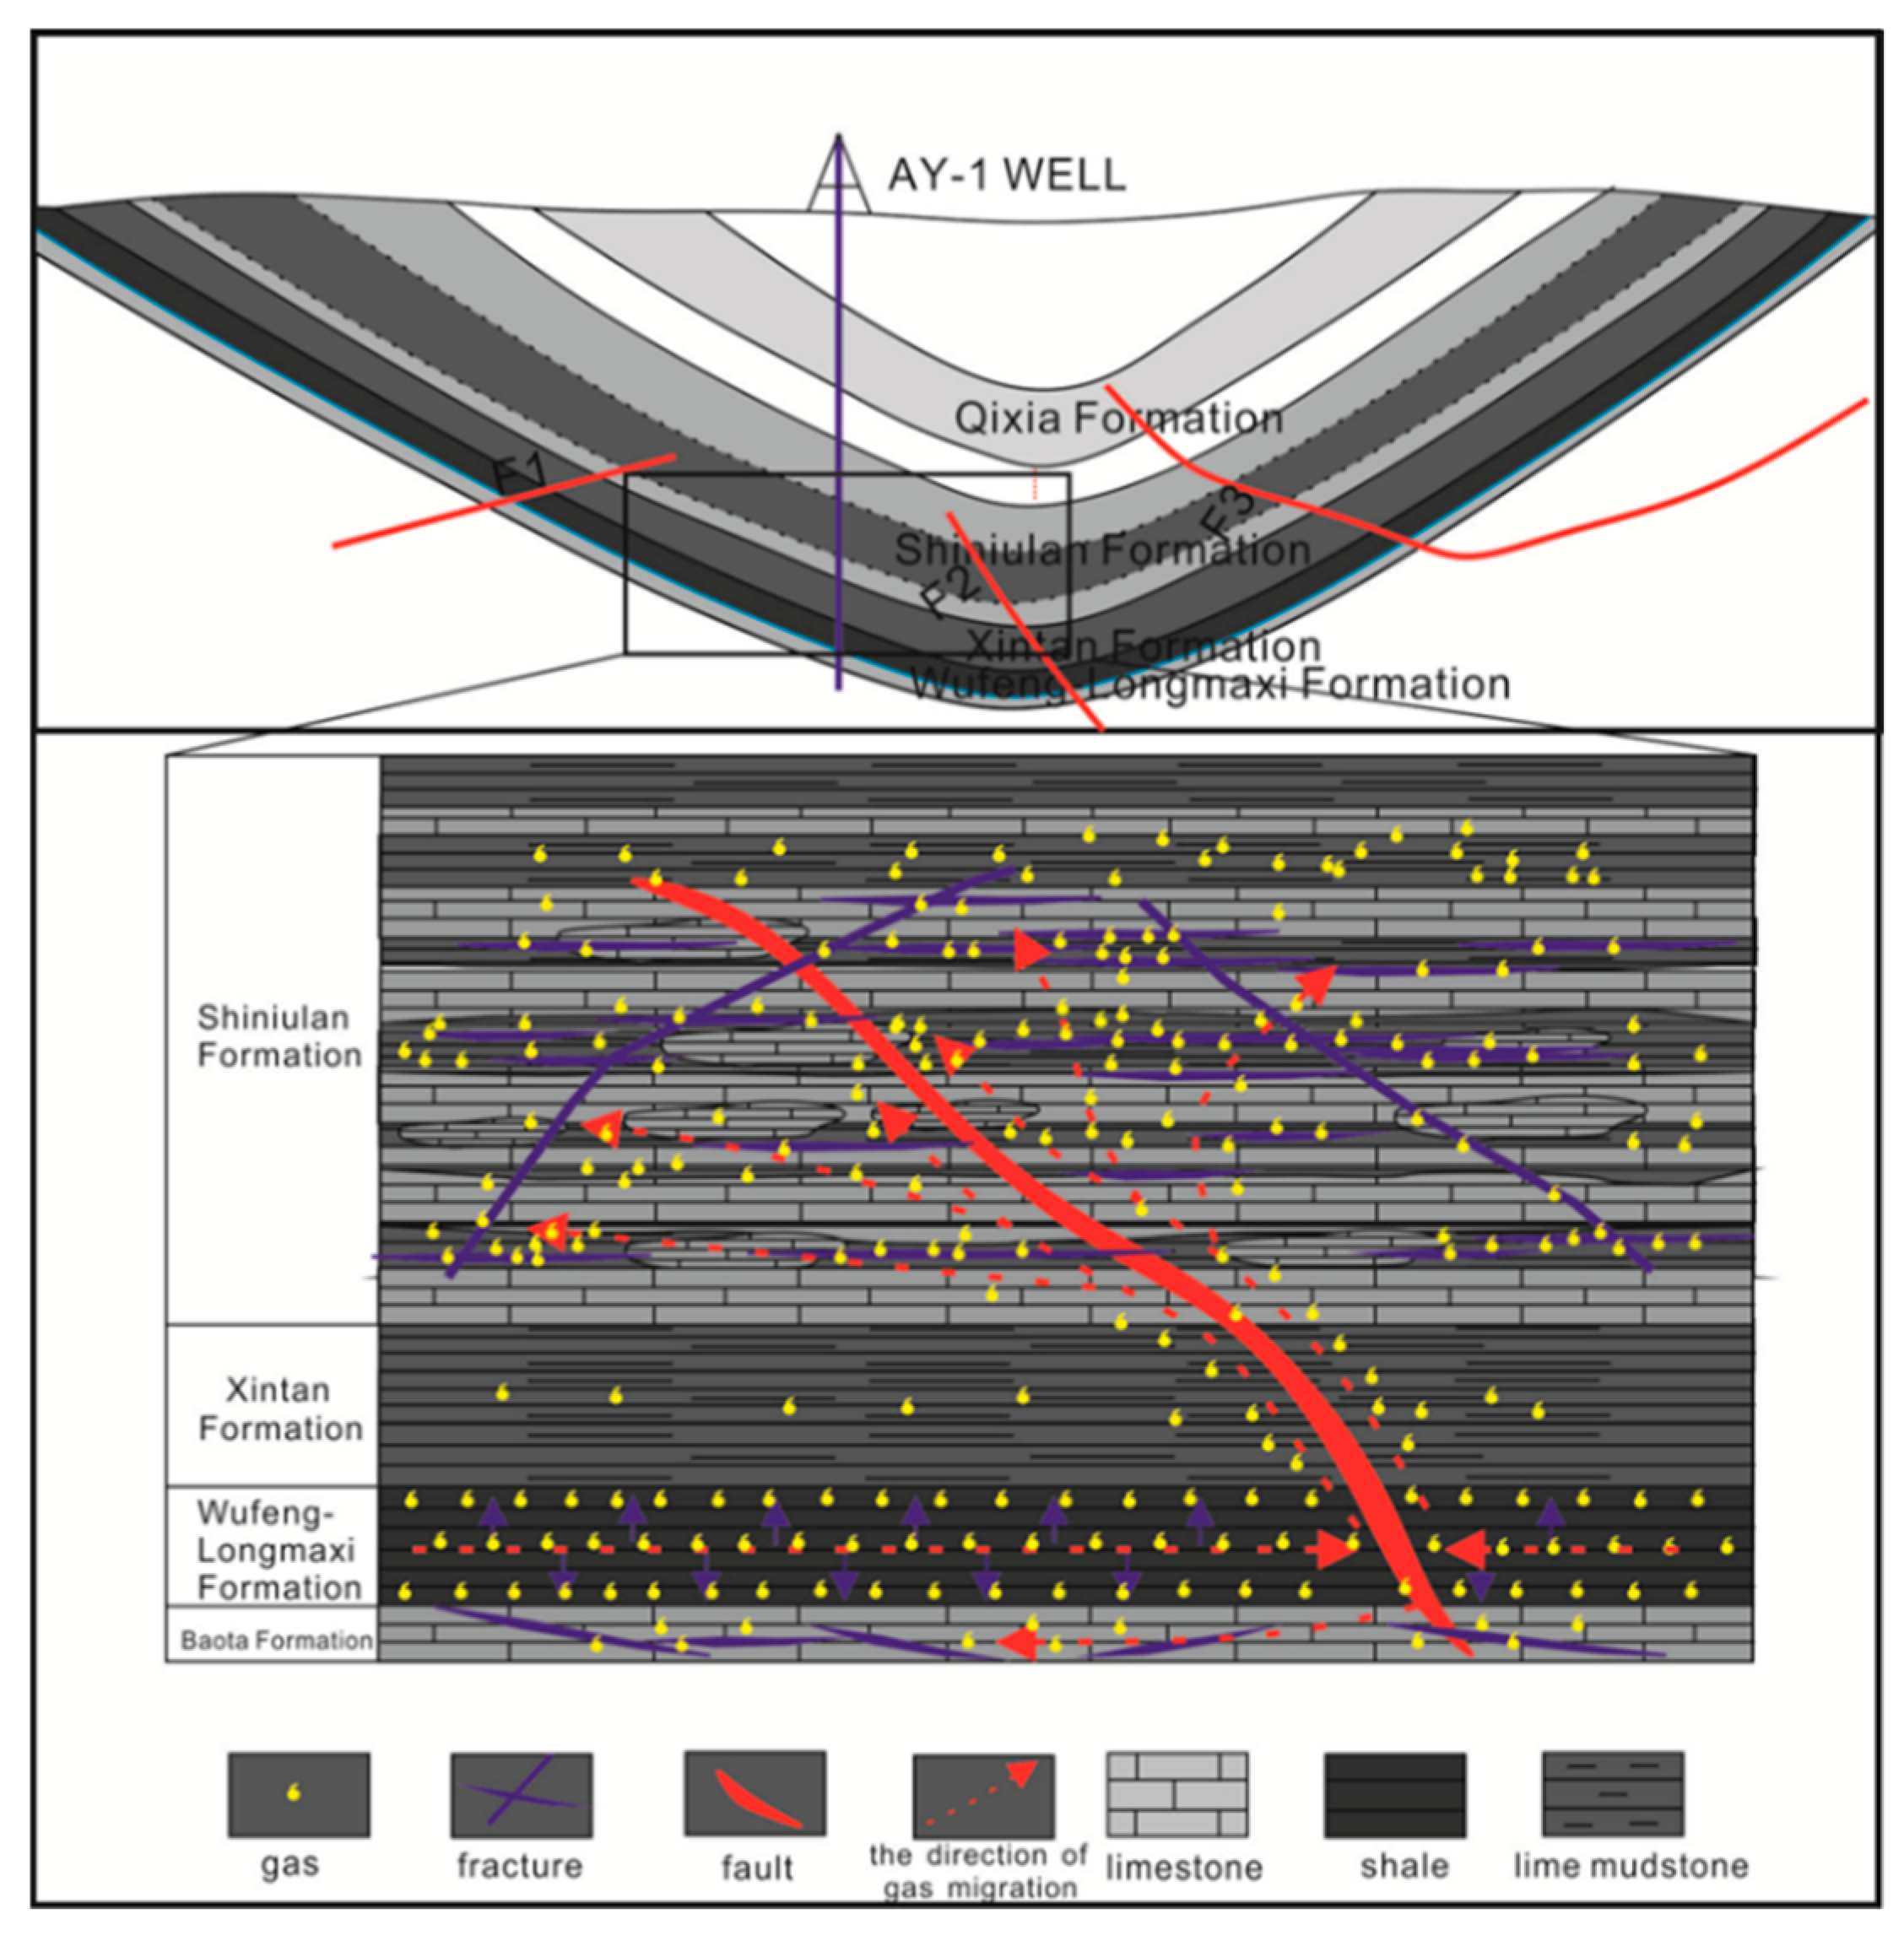
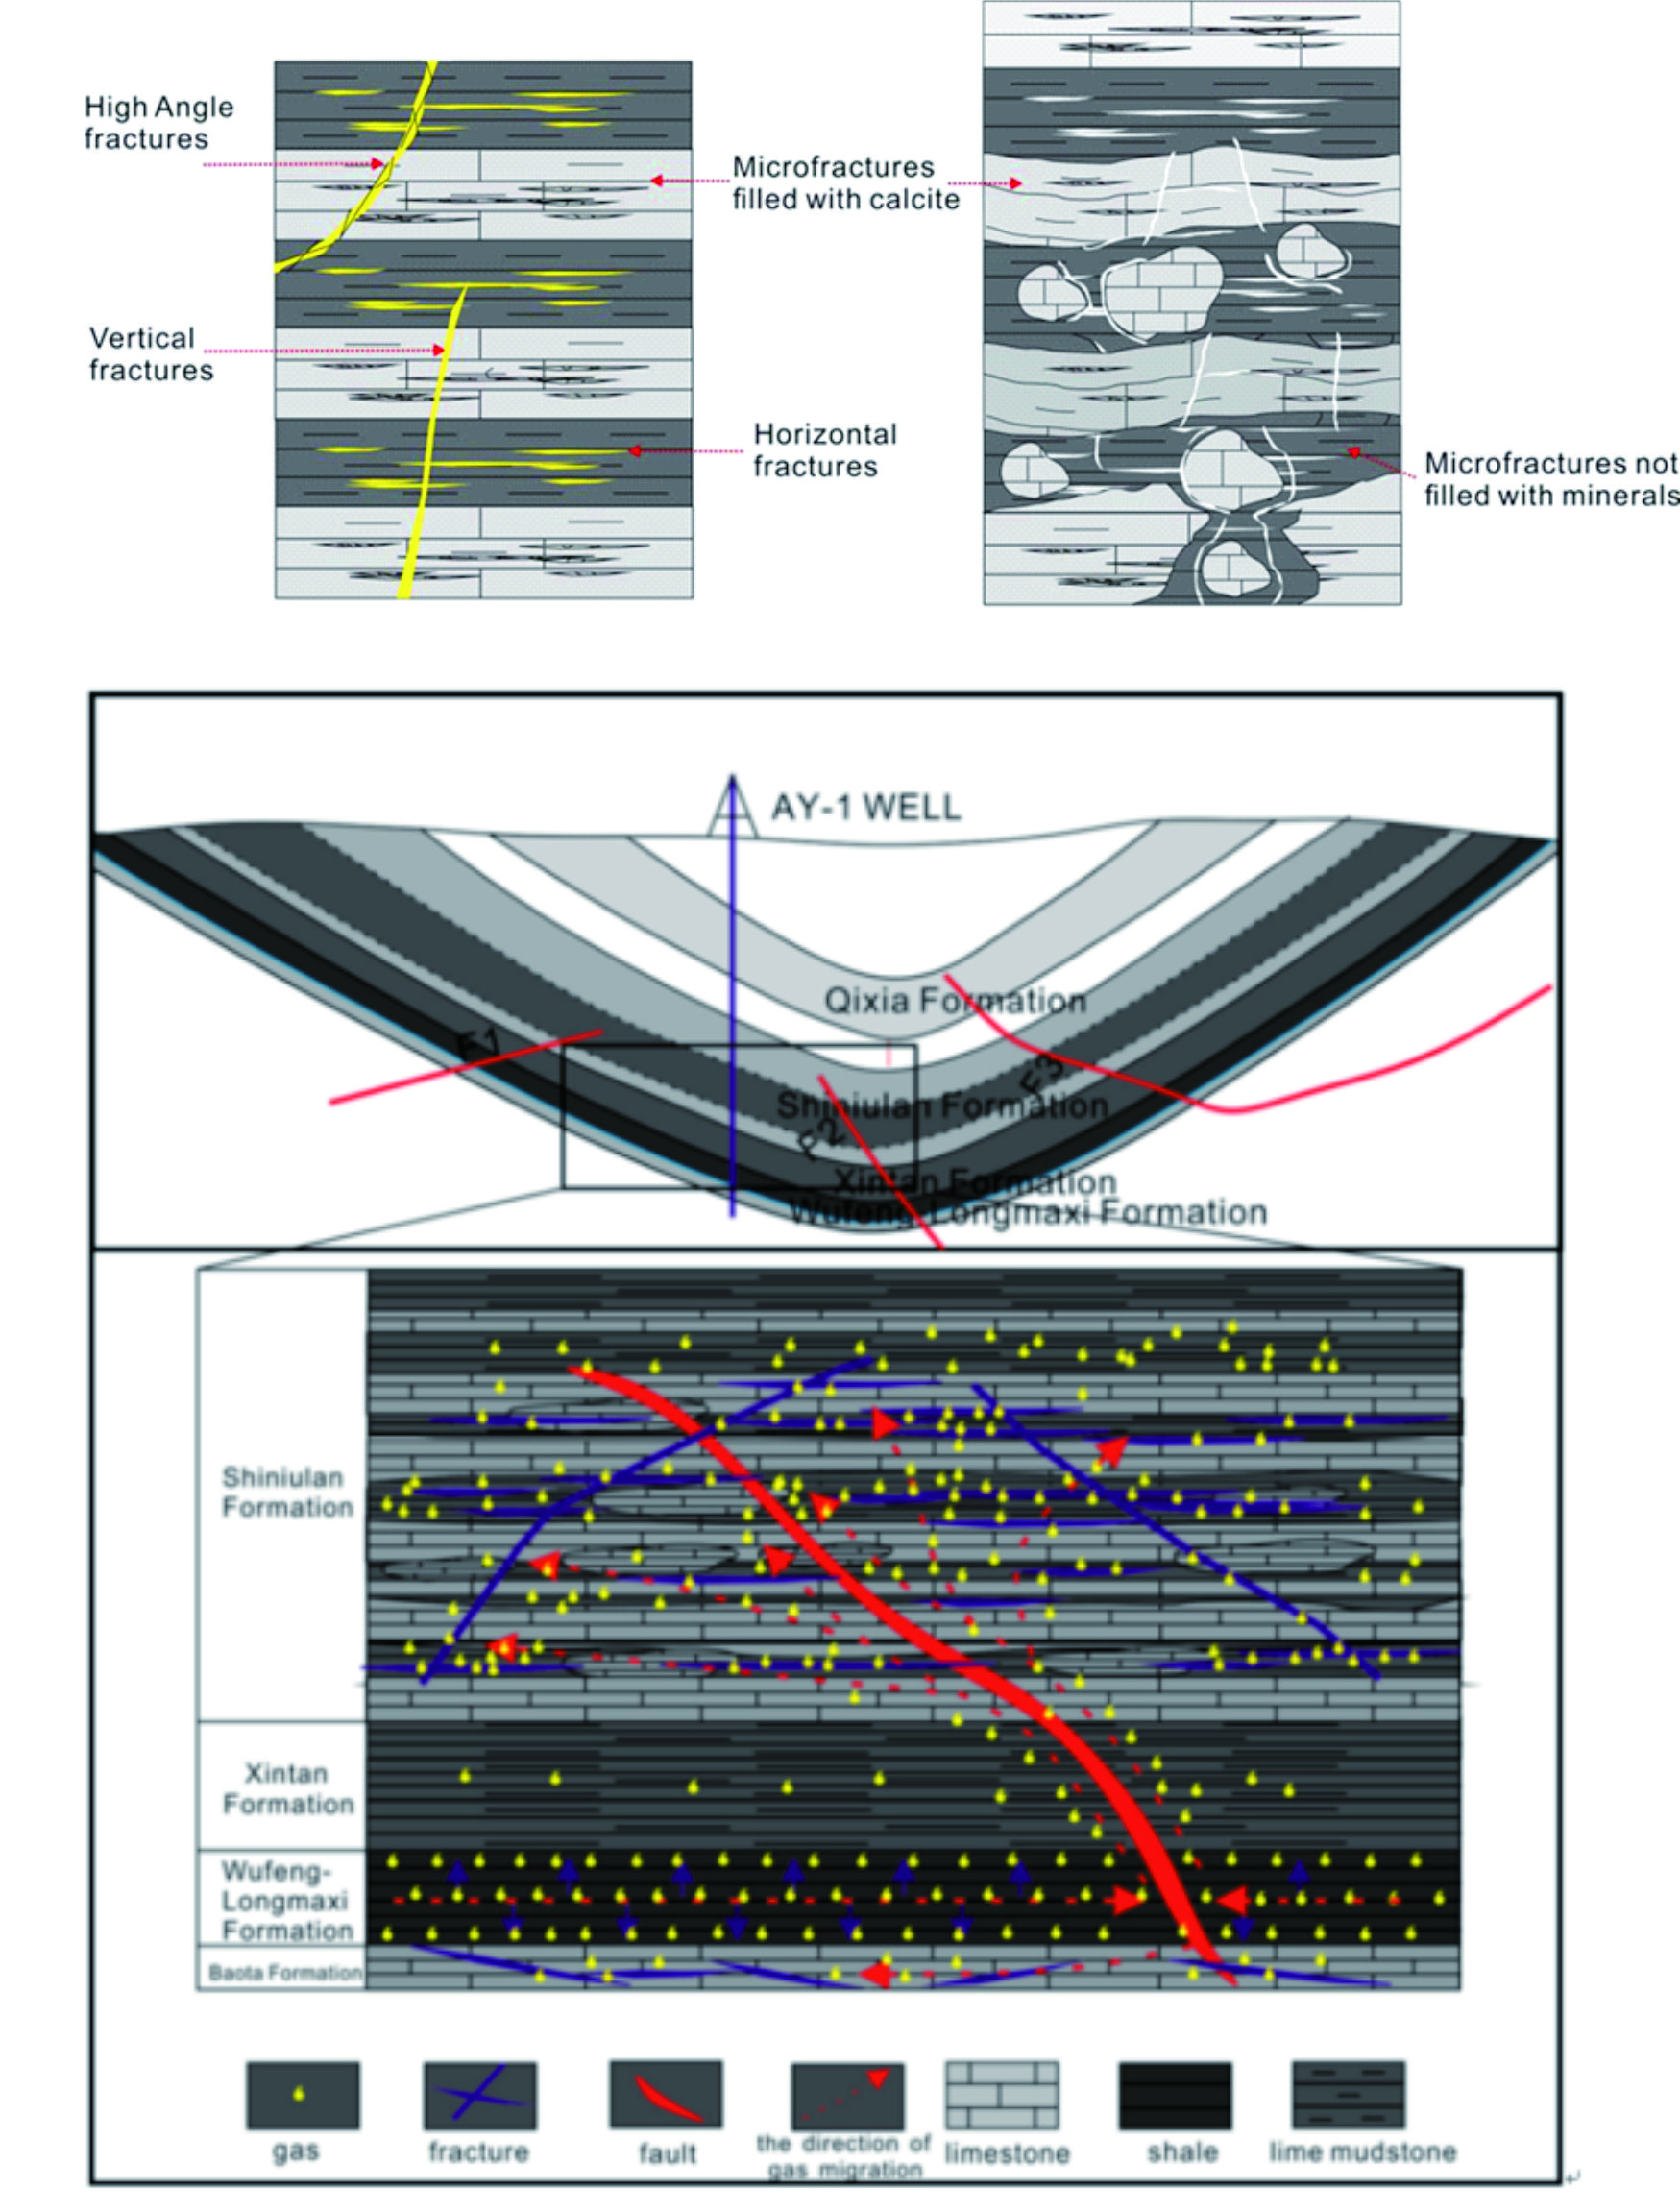
4.4.2. Natural Gas Accumulation Model of Shiniulan Formation

The origin of natural gas in Shiniulan Fm. is a special mixed gas derived from different strata. In addition, the pore size distribution of mudstone and limestone in the Shiniulan Fm. shows that the pore size of the limestone is concentrated at approximately 2.88 nm, while the pore size of the mudstone is mainly concentrated at approximately 7.13 nm. The limestone is denser than the mudstone and can effectively seal the natural gas in the mudstone. The combination of lithology as a good preservation condition makes the formation relatively closed; thus, facilitating the preservation of gas reservoirs.
Natural gas is mainly concentrated in a large number of horizontal fractures developed in mudstone. The partly-developed, high-angle fractures provide good channels for horizontal migration, which allows natural gas to migrate upwards at short distances and accumulate, causing abnormally high pressures. When the drilling reaches this layer, a local decompression occurs, which causes the natural gas in the fractures to accumulate in the wellbore. Finally, a high yield is formed where horizontal fractures develop while high-angle fractures are scarce.
The stratum of the Silurian stopped moving during the Triassic, while the three faults that developed in the Anchang syncline core continue to be active under the Yanshan–Hishan movement. Due to the simultaneous extrusion of multi-phase tectonic movements, the fractures in the oblique core are developed, accompanied by a large number of associated microfractures; thus, providing an important channel for the supply of gas to the Shiniulan Fm. from the lower formation. The well-developed fractures, which are dominated by shrinkage fractures that result from diagenesis in the Shiniulan Fm., are more conducive to the formation of a low potential area to accumulate gases. Similarly, the limestone in the Baota Fm. also developed a small amount of fractures due to the effect of fractures, while the shale gas from the Longmaxi Fm. was partially migrated and stored in the limestone of the Baota Fm. through the fractures. Therefore, a high-pressure fractured gas reservoir is predicted to be in the limestone of the Baota Fm.
The high yield in the Shiniulan Fm. is due to the accumulation of mudstone gas and the mixing of the shale gas from underlying strata. Natural gas accumulates along fractures in the Shiniulan Fm. through fault and hydrocarbon self-generation, forming a unique, abundant accumulation model in the Shiniulan Fm. (Figure 20).

5. Conclusions

  • Combined with the gas contents by different methods above, it was indicated that the Shiniulan mudstone has a certain hydrocarbon generation potential; however, it is far from enough to satisfy the gas content in the reservoir.
  • The origin of natural gas from the Shiniulan Fm. is a mixed source type. It can be considered that the gas source of the Shiniulan Fm. is not only derived from its own source rock but also migrated from other gas-source rock, such as the shale of the Wufeng–Longmaxi Fm.
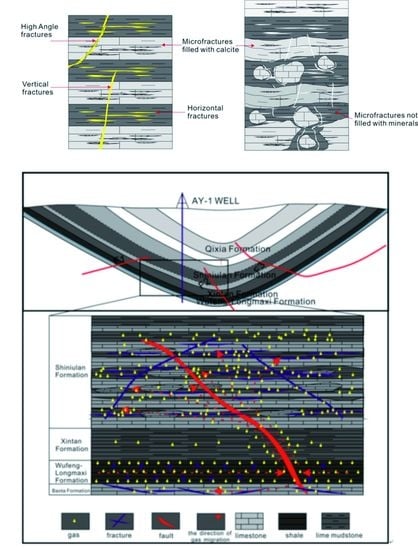
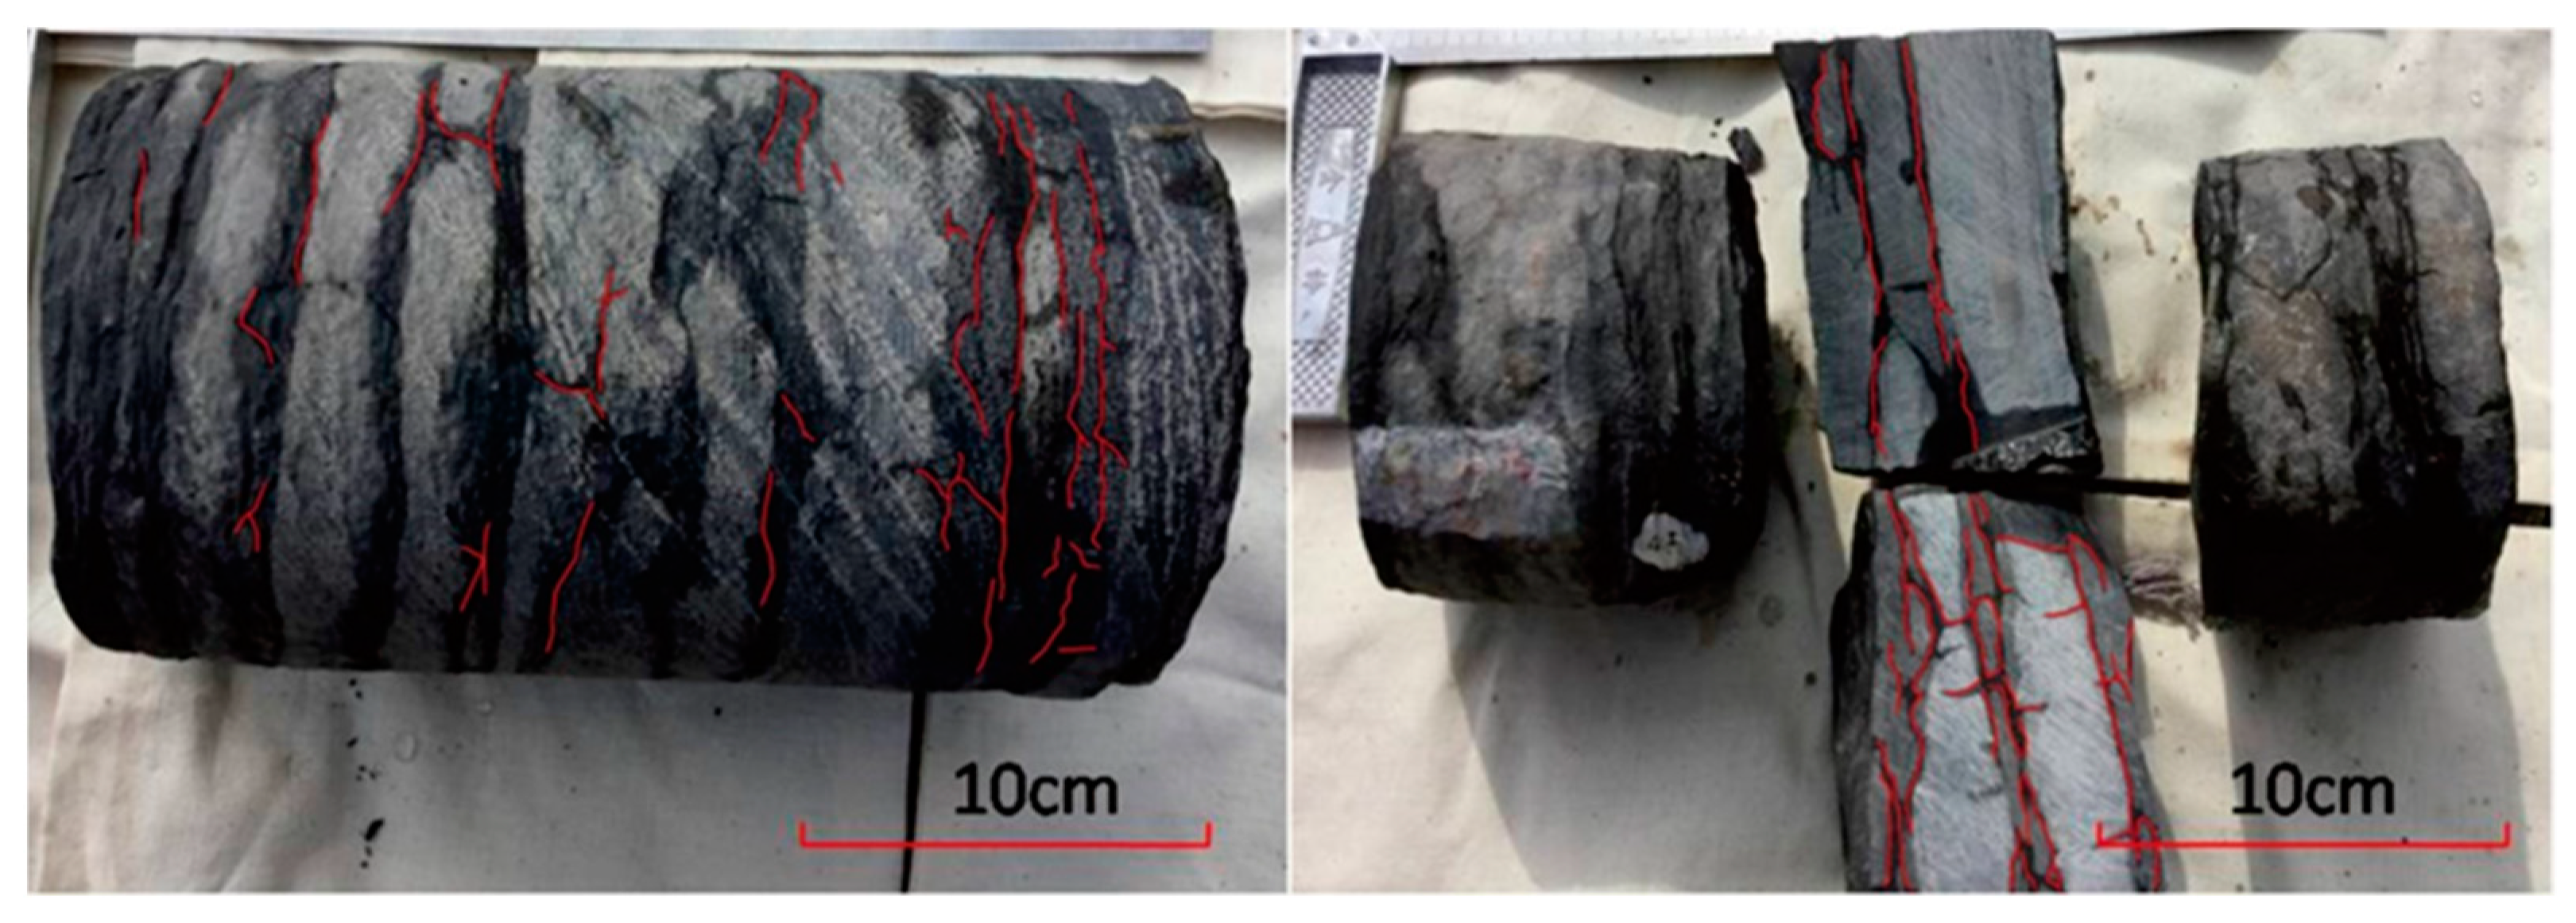
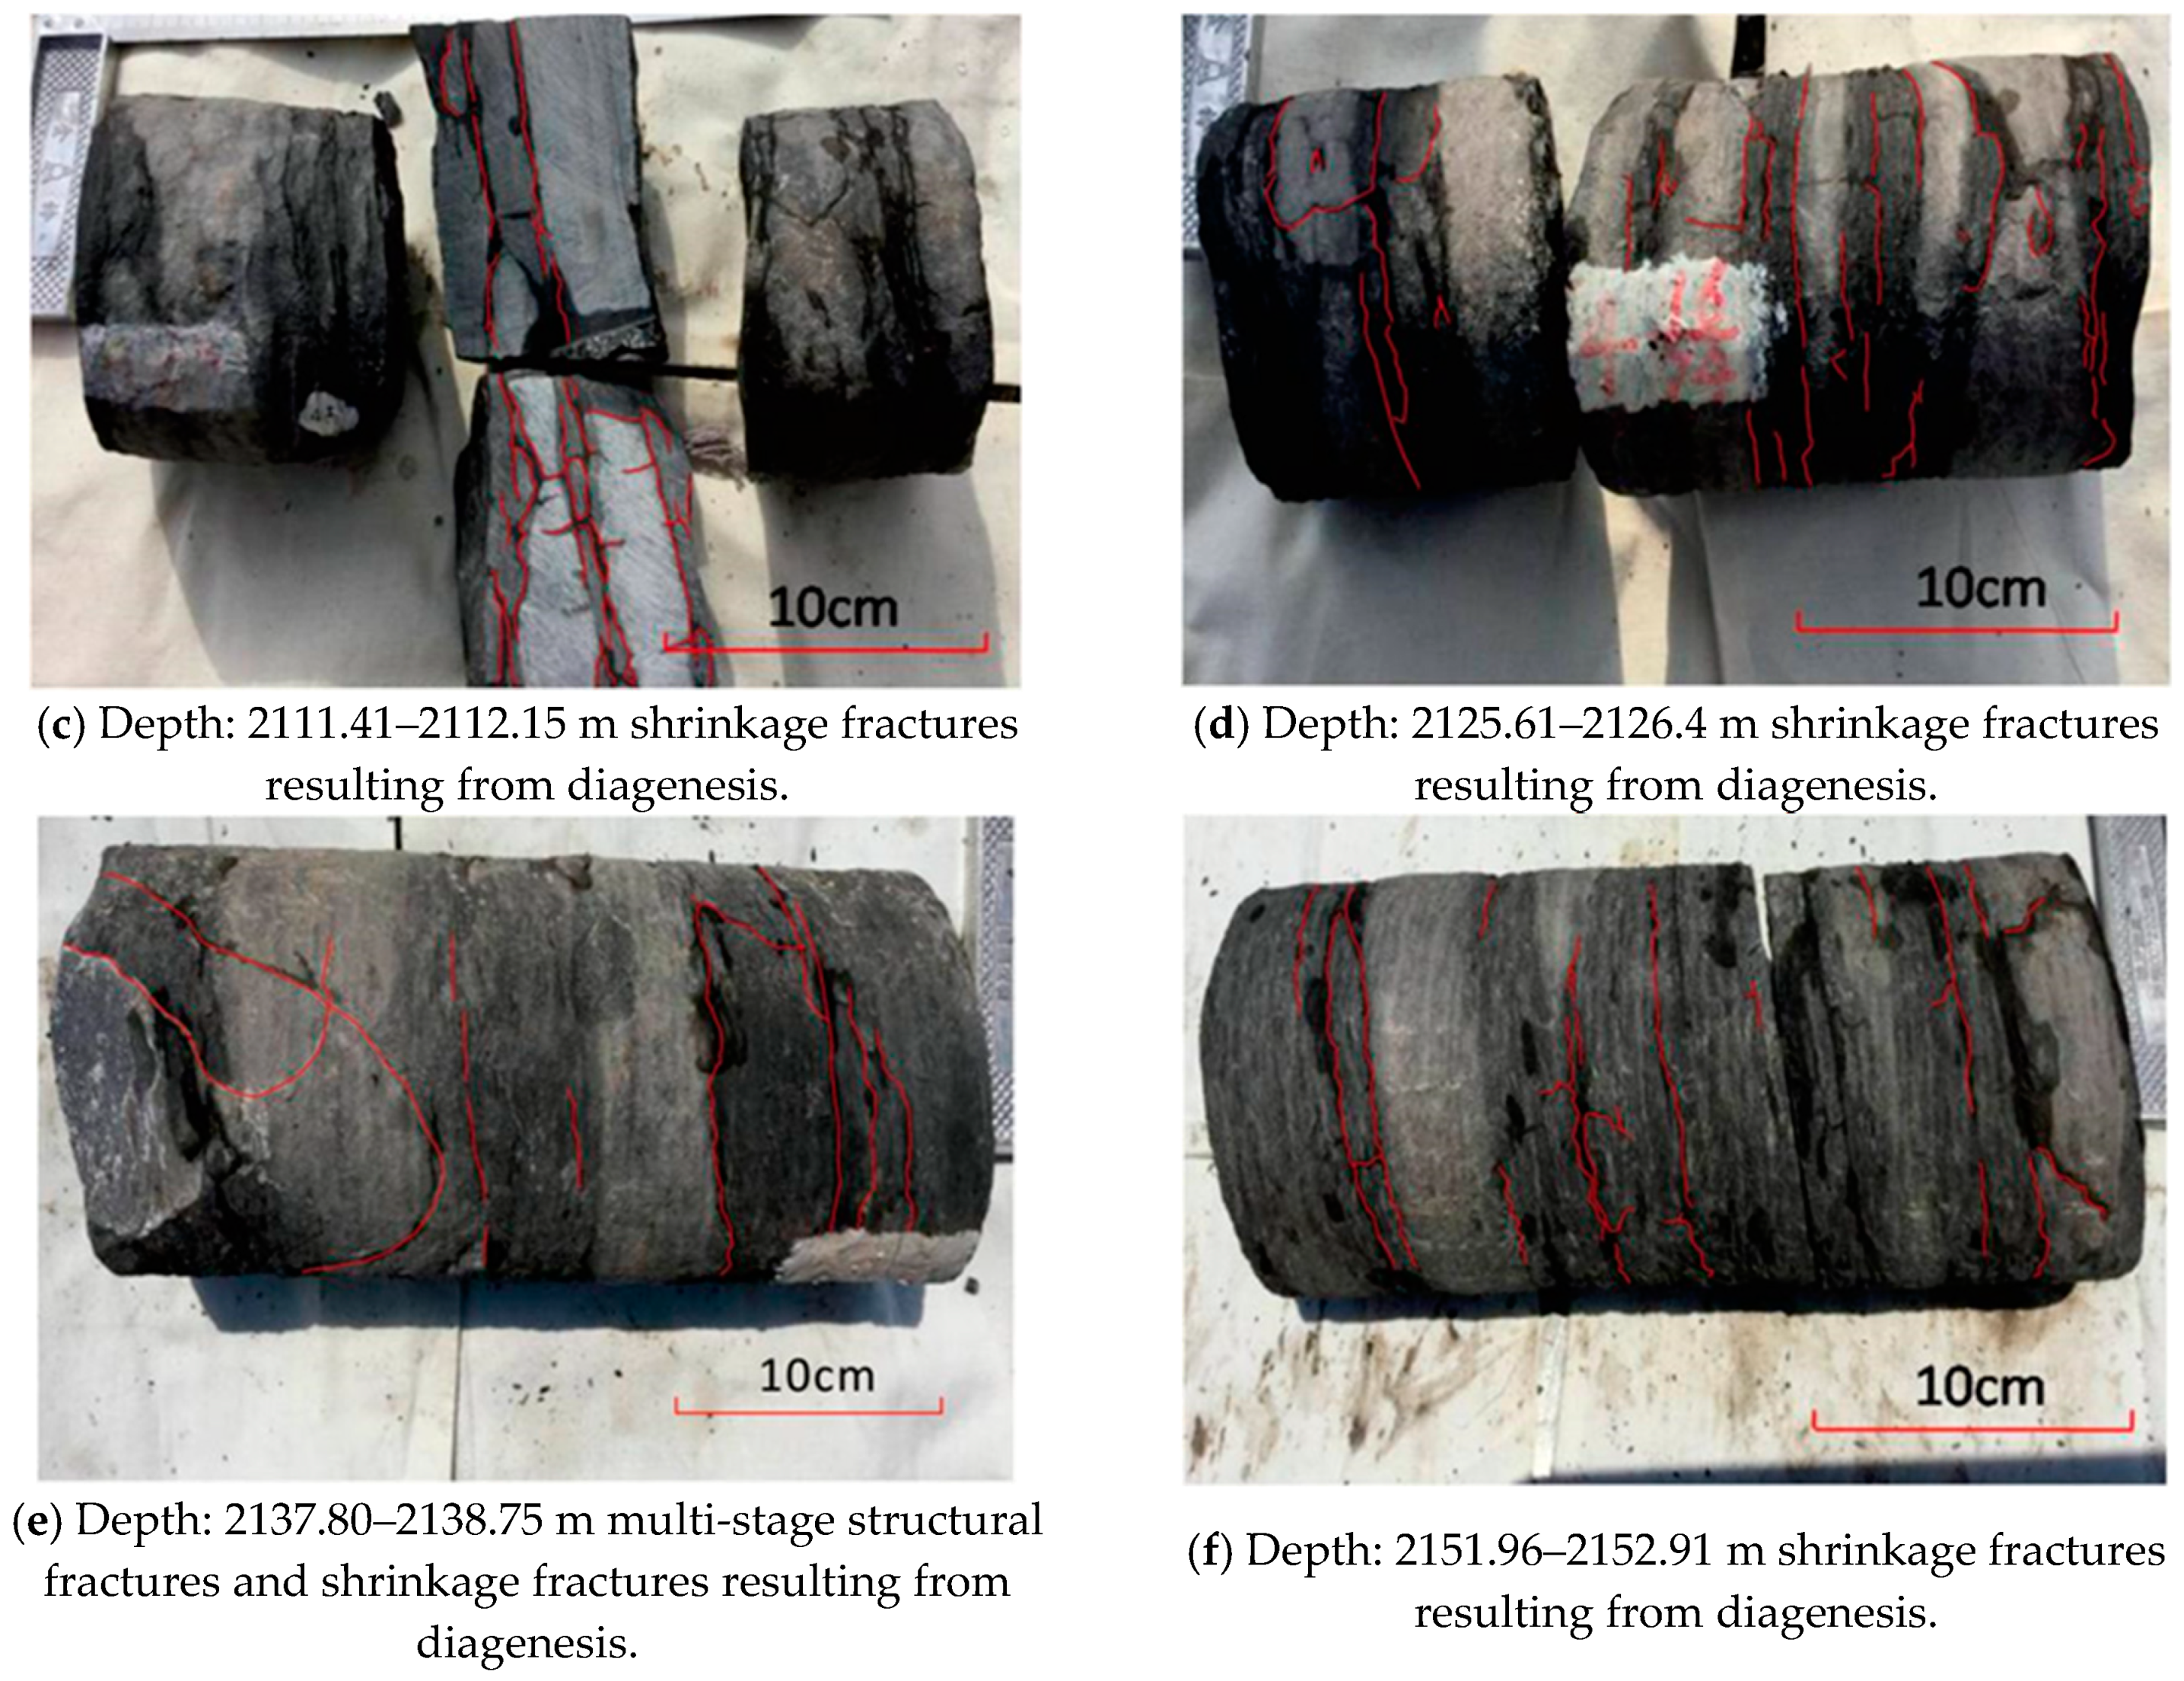
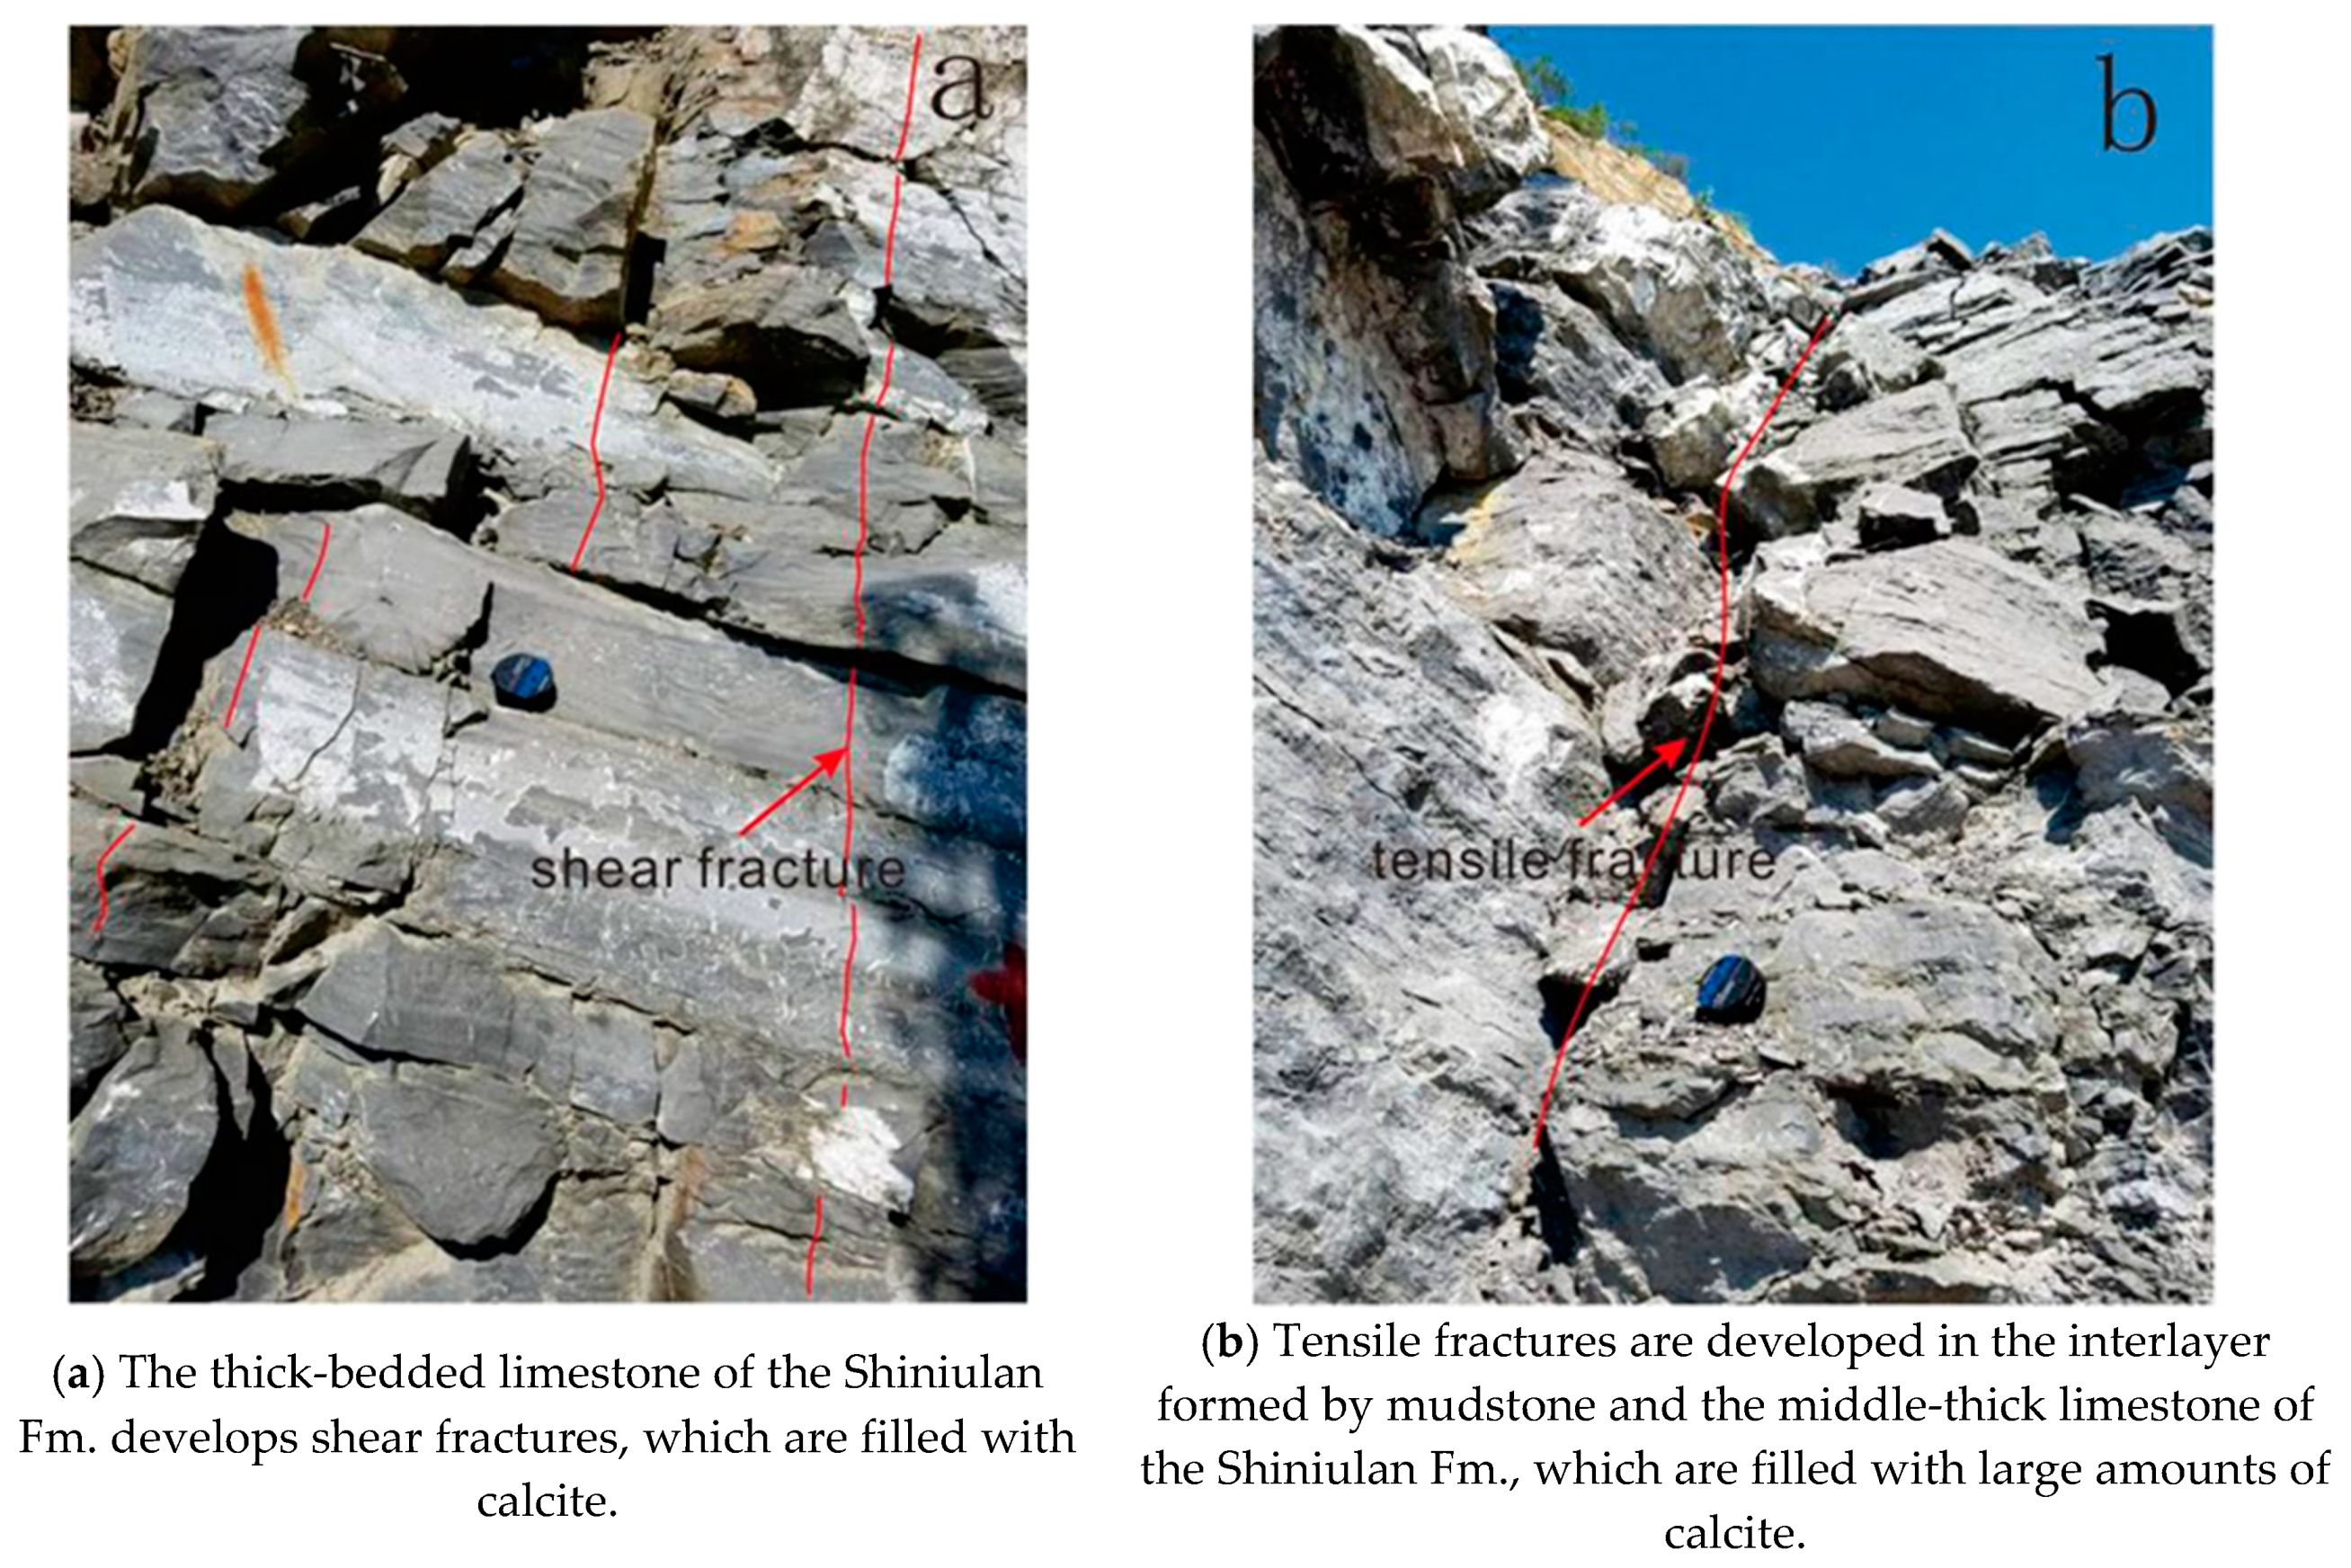
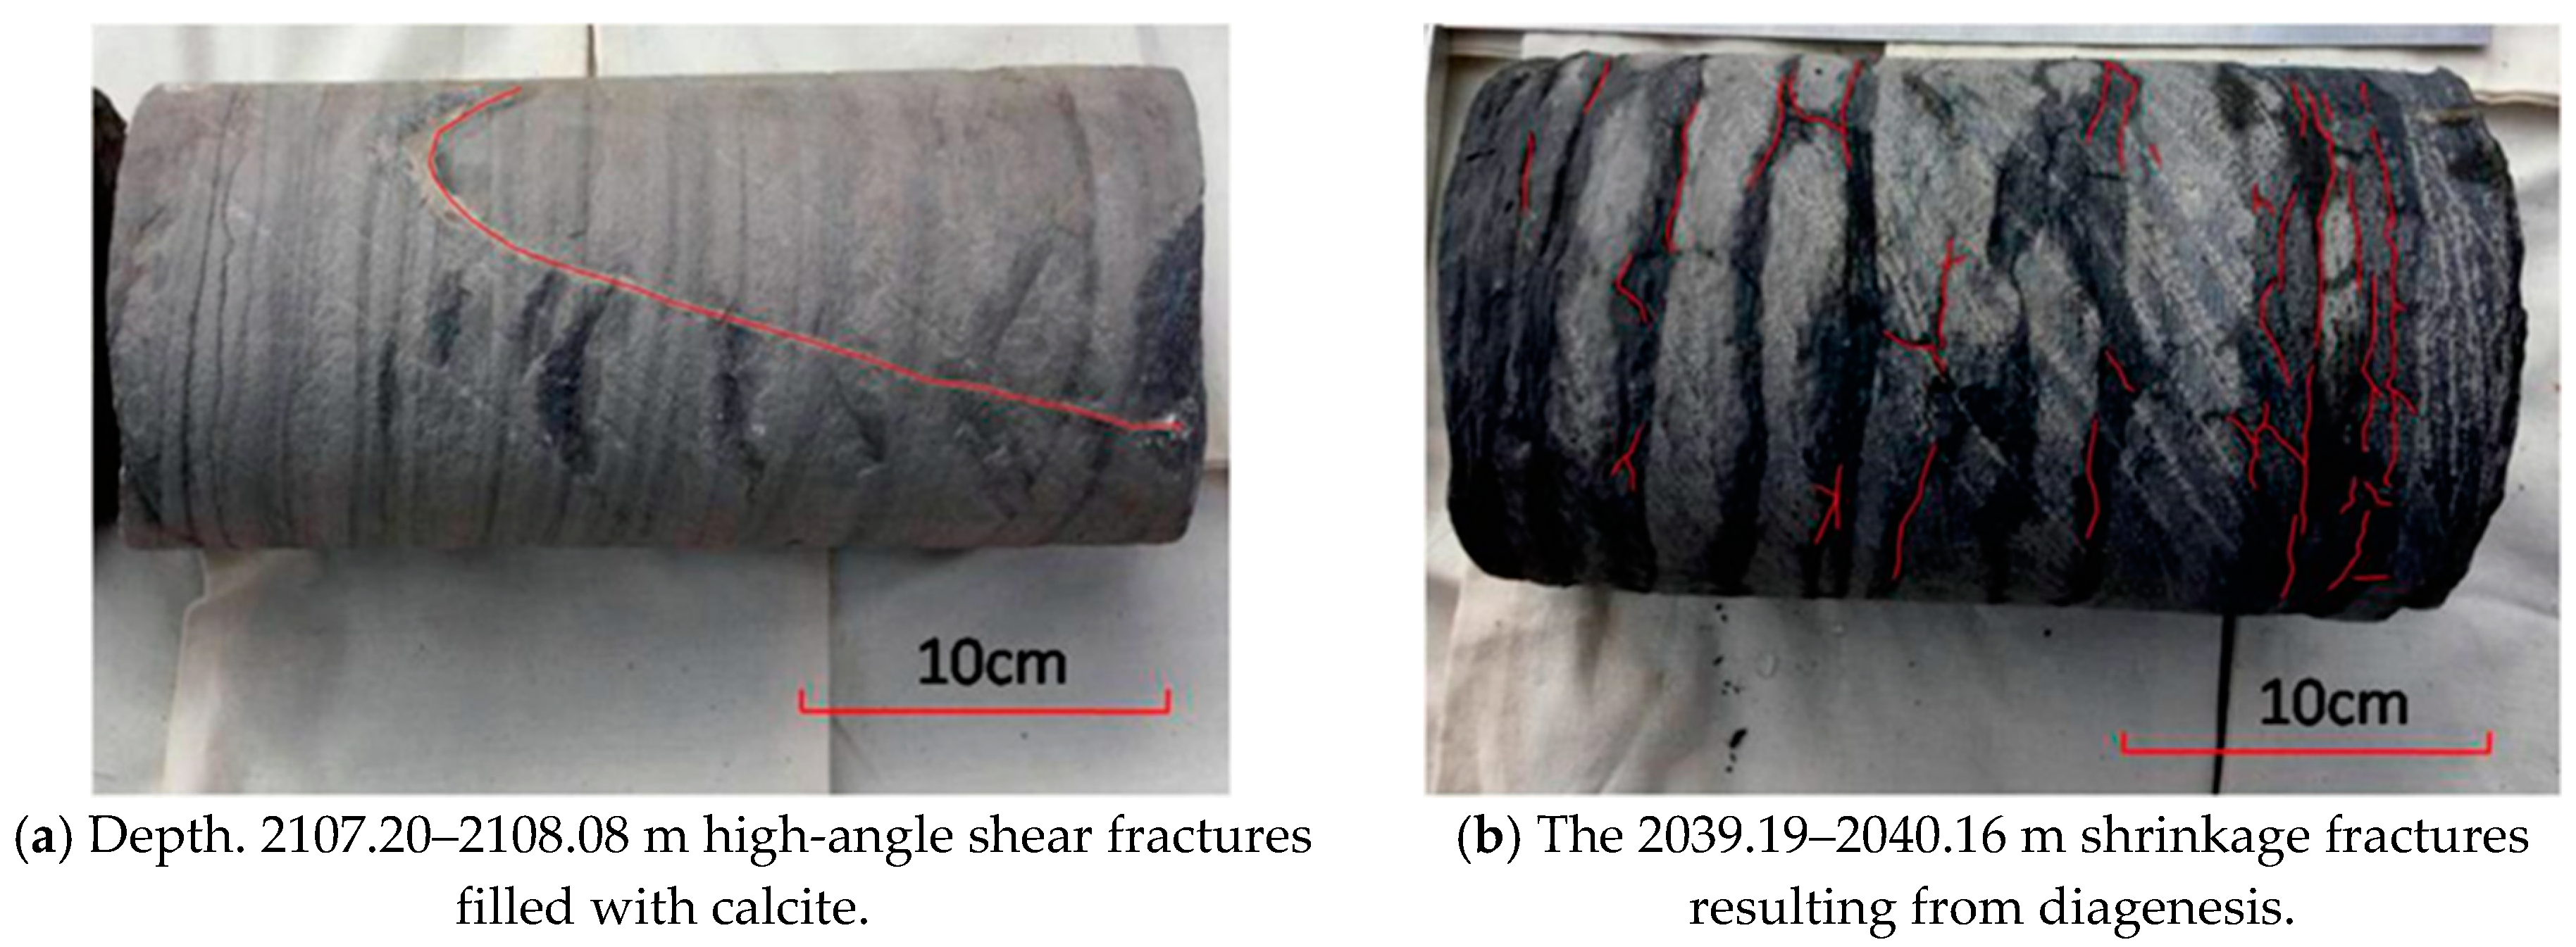
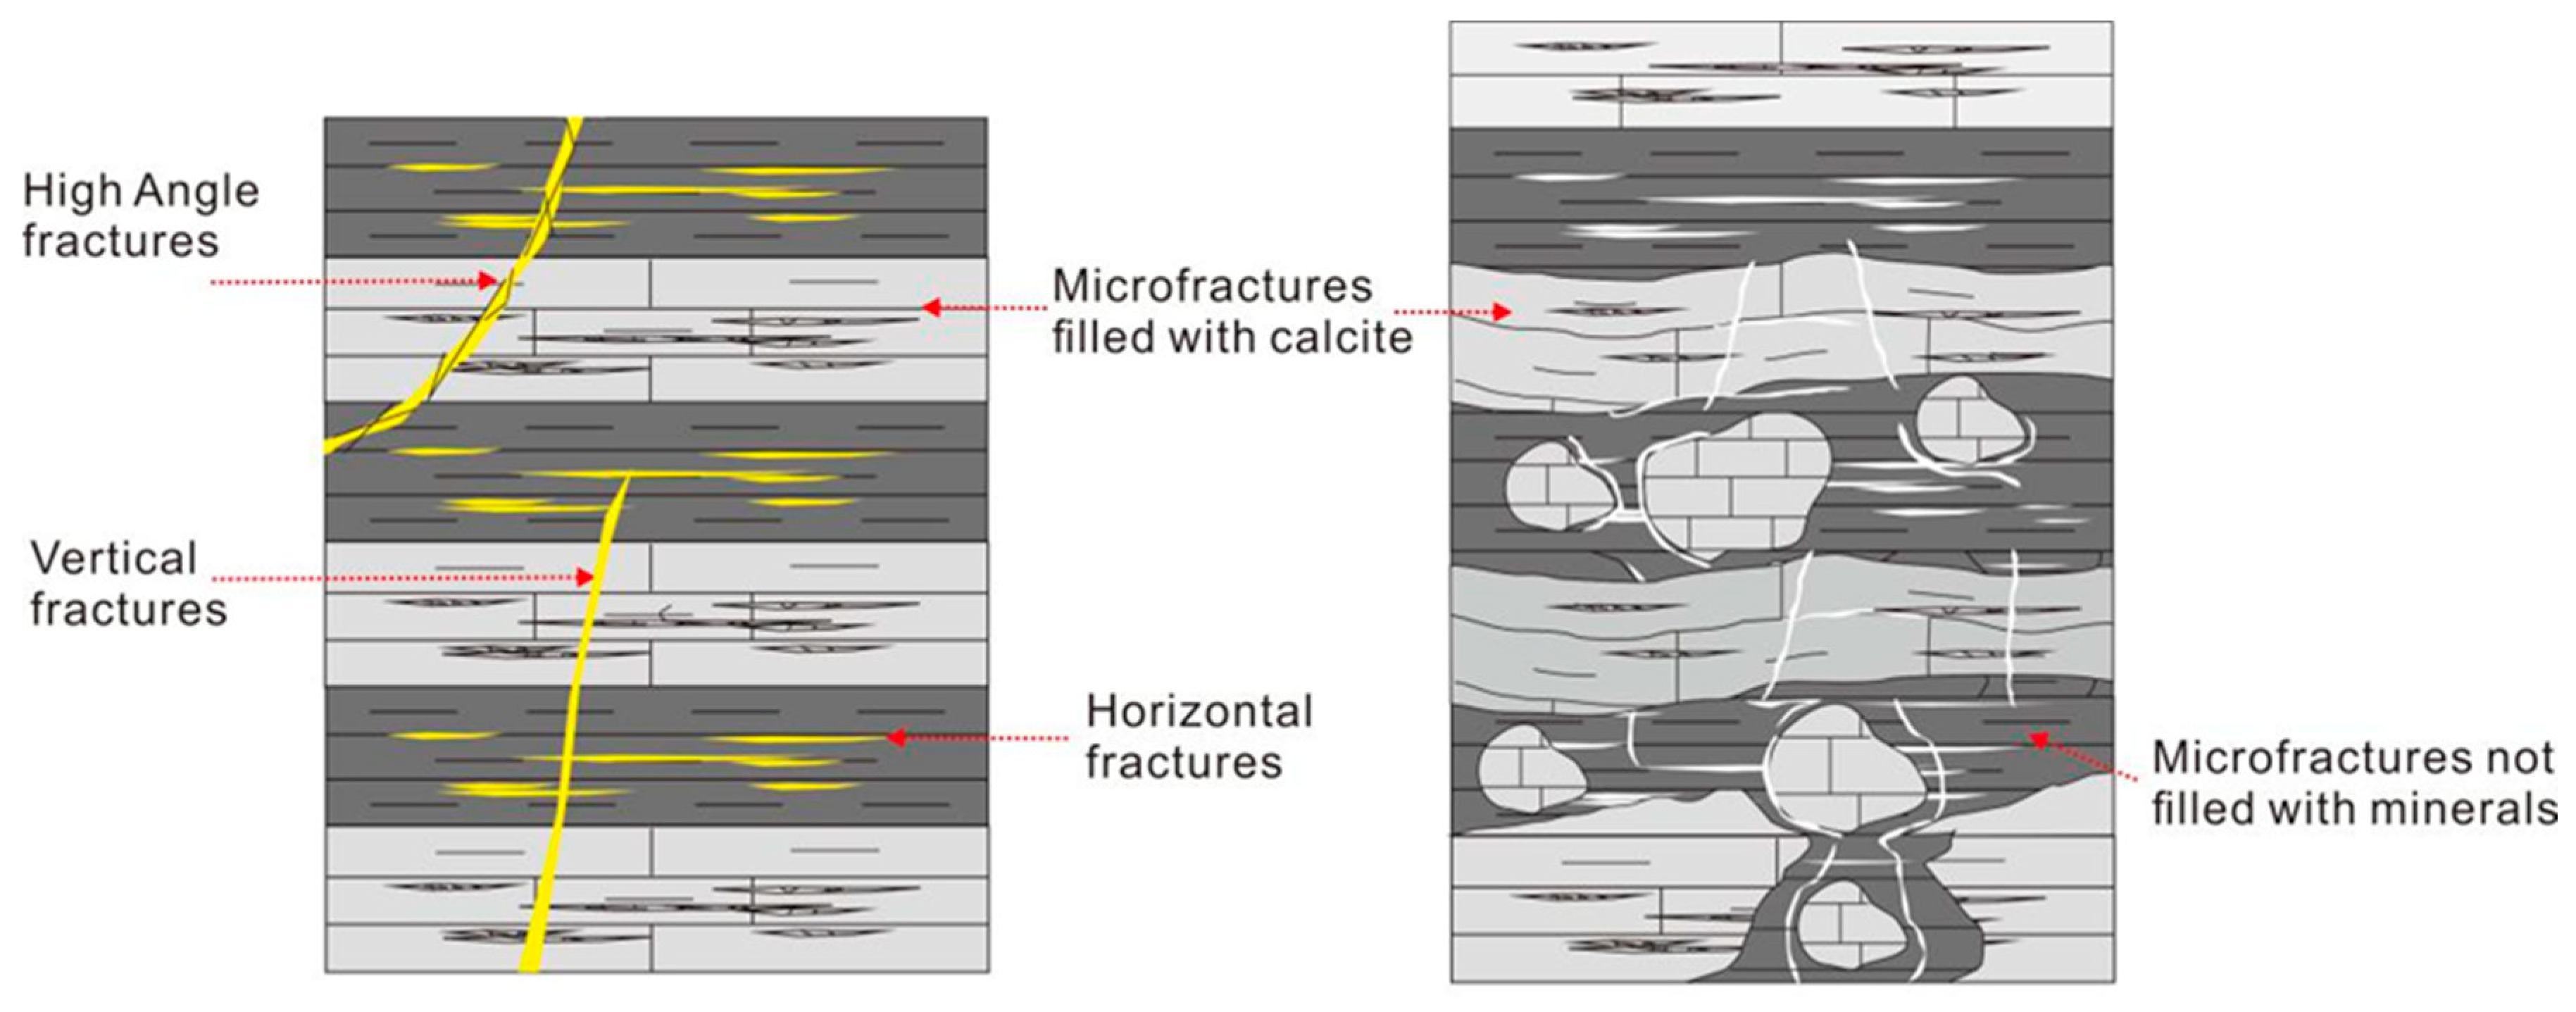
  • The diagenetic microfractures are well-developed, while the tectonic fractures formed by stress are rare. Moreover, the microfractures in the limestone are filled with calcite. This lithological association as a good element facilitates the accumulation of gas reservoirs.
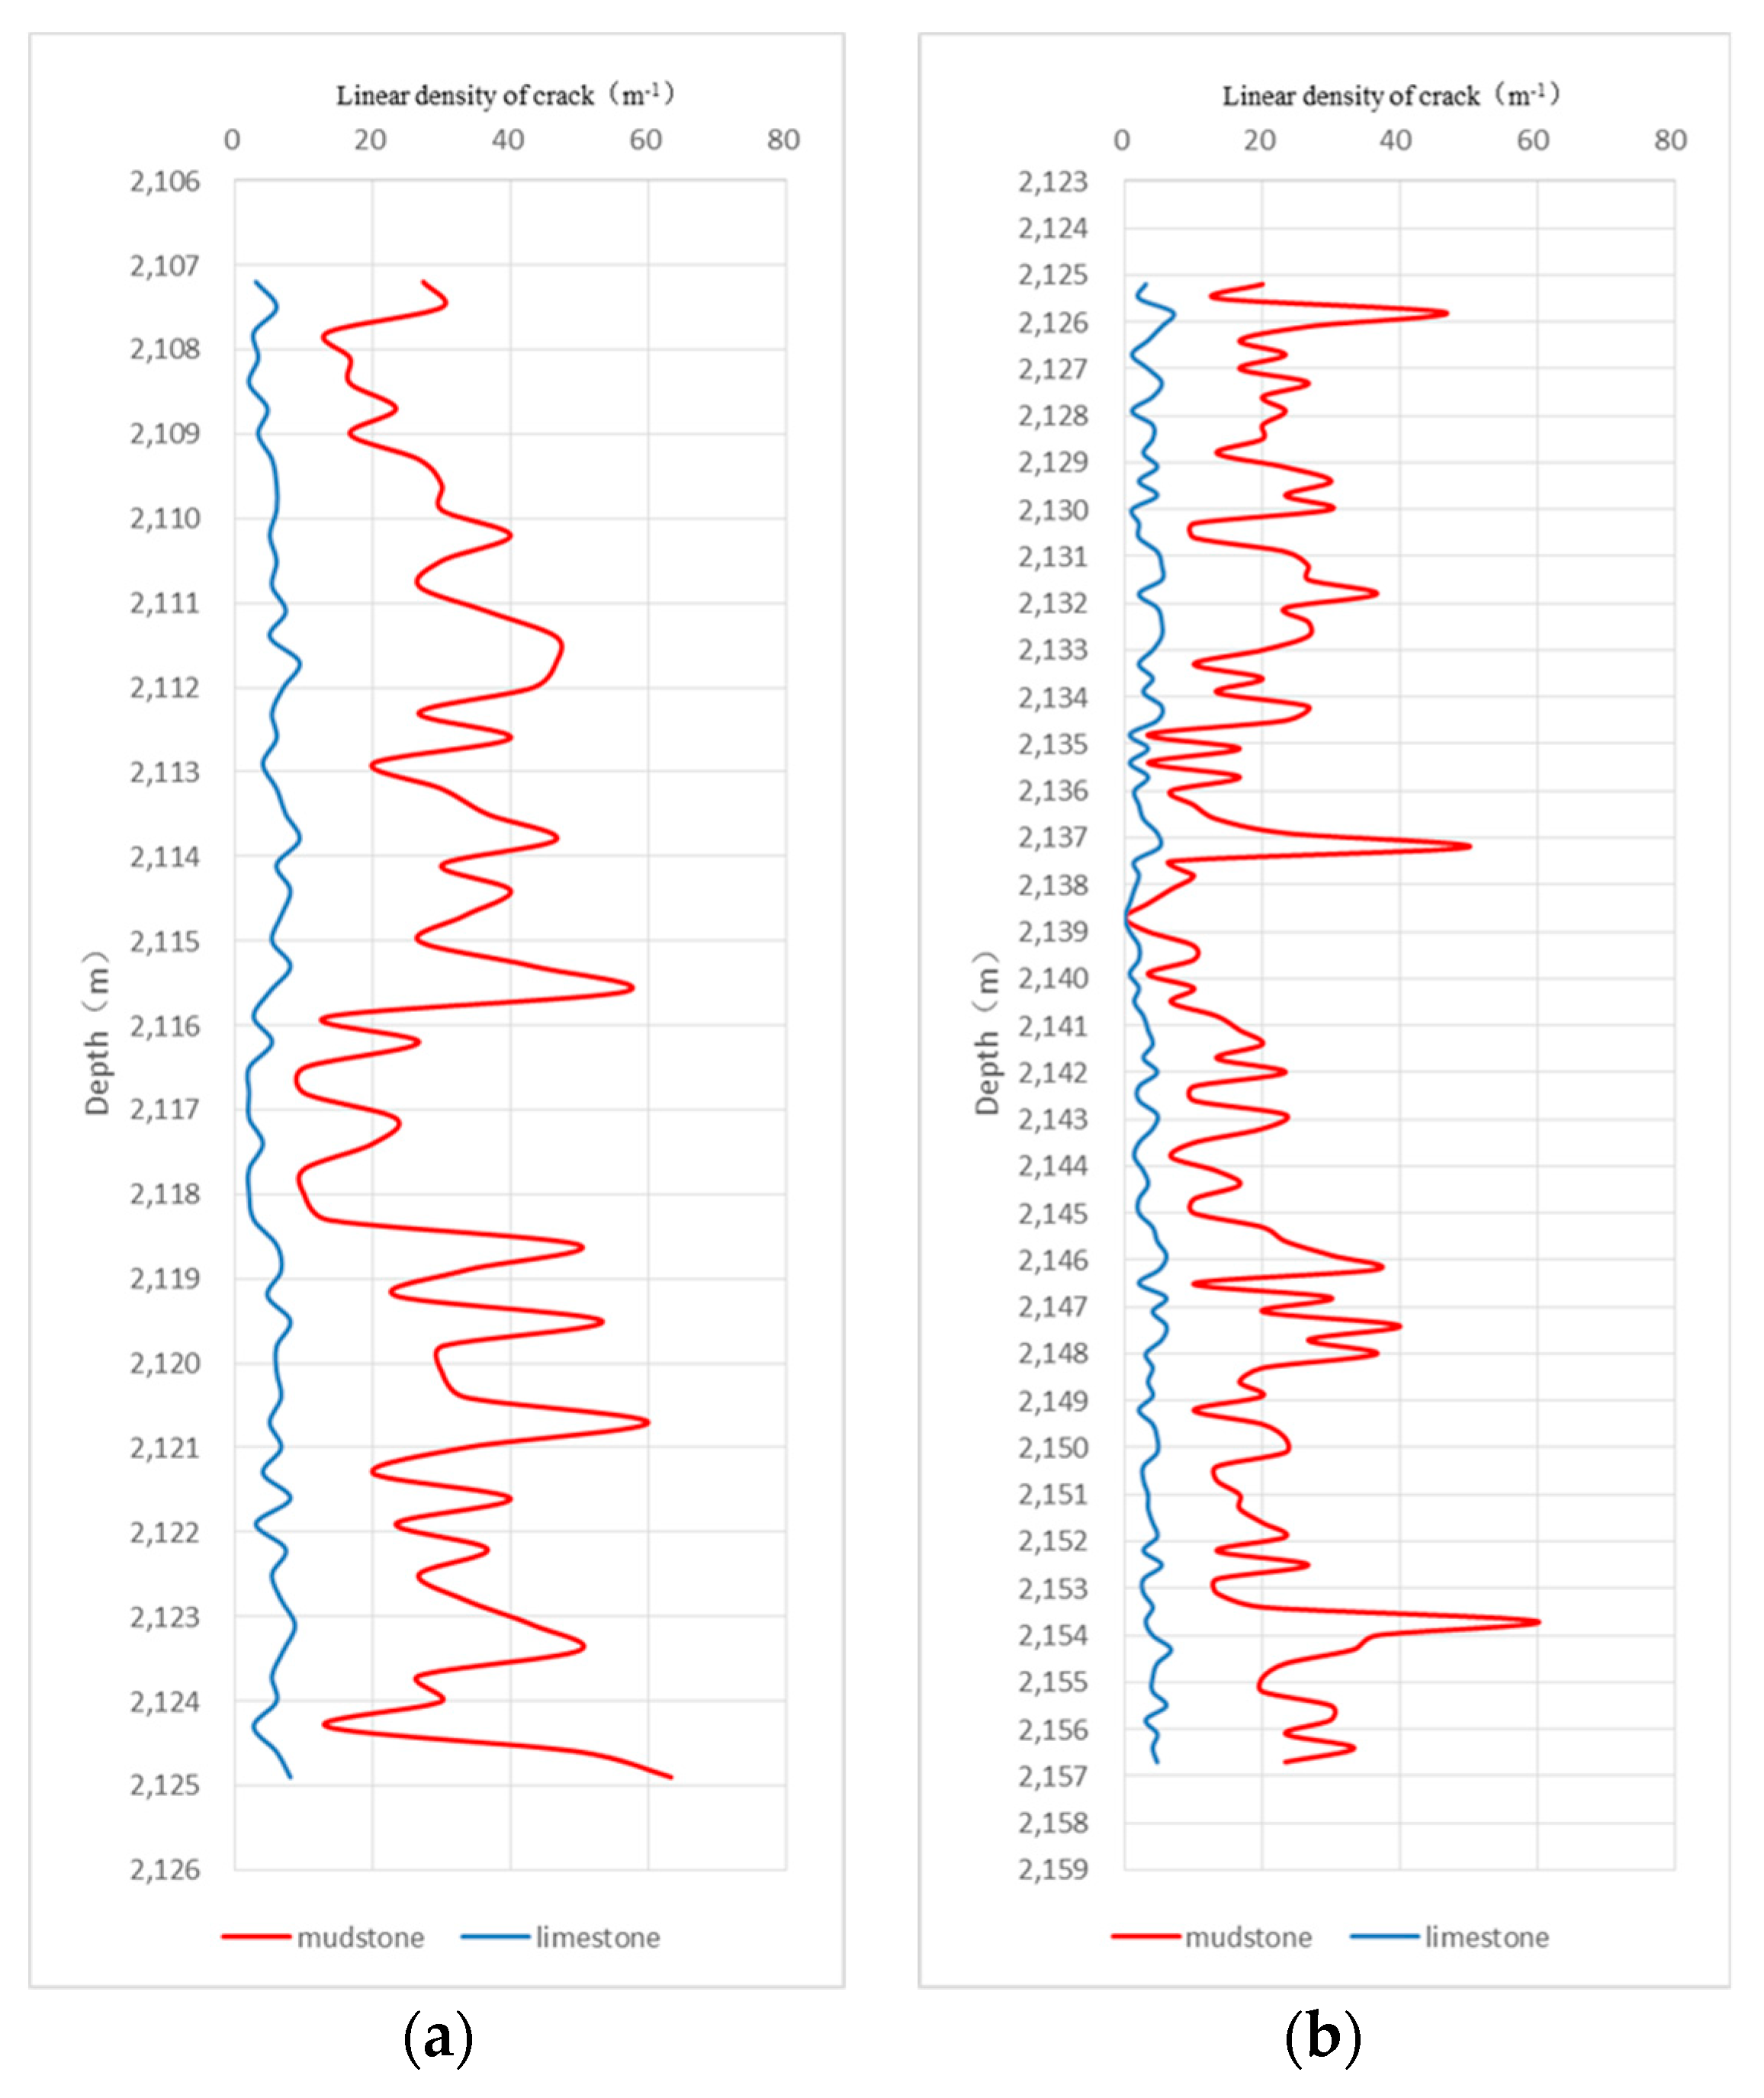
  • Due to the specific lithological association consisting of frequent calcareous mudstone and limestone interbedding, the limestone with low porosity and permeability and poorly developed fractures act as cap layers to restrain the natural gas from escaping to other layers and effectively seal the gas into well-developed fractures of mudstone.
  • The development of local faults and high-angle microfractures provides a channel for the upward and downward migration of shale gas, allowing the abundant accumulation of natural gas in horizontal fractures developed in the mudstone of the Shiniulan Fm.

Author Contributions

Conceptualization, Z.L. and R.G.; Methodology, X.T.; Software, P.Z.; Validation, R.G., P.Z. and Z.L.; Formal Analysis, R.G.; Investigation, P.Z.; Data Curation, Z.L.; Writing-Original Draft Preparation, R.G.; Writing-Review & Editing, J.Z.

Funding

This work was supported by the Research on Shale Gas Resource Potential Evaluation Method and Exploration Technology (2016ZX05034), Shale Gas Resources Evaluation and Factors Optimization in Key Areas of South China (G20171901), the Excellent Supervisor Funded Program of the Ministry of Education (grant number 2-9-2017-317), Gas accumulation model of well AY-1 in Guizhou Province, and Evaluation and parameter optimization of shale gas resources in typical areas of South China.

Acknowledgments

Many thanks to Zhang for his help with experiments in the geochemistry laboratory of Yangtze University, Jingzhou, China.

Conflicts of Interest

The authors declare no conflict of interest.

Abbreviations

FmFormation
USBMUnited States Bureau of Mine

References

  1. Jia, B.; Tsau, J.S.; Barati, R. A review of the current progress of CO2 injection EOR and carbon storage in shale oil reservoirs. Fuel 2019, 236, 404–427. [Google Scholar] [CrossRef]
  2. U.S. Crude Oil and Natural Gas Proved Reserves. Year-End 2017. U.S.; Energy Information Administration (EIA): Washington, USA, 2017. [Google Scholar]
  3. Zhang, J.C.; Nie, H.K.; Xu, B.; Jiang, S.L.; Zhang, P.X.; Wang, Z.Y. Geological condition of shale gas accumulation in Sichuan Basin. Nat. Gas Ind. 2008, 28, 151–156. [Google Scholar]
  4. Zou, C.N.; Dong, D.Z.; Wang, S.J.; Li, J.Z.; Li, X.J.; Wang, Y.M.; Li, X.J.; Wang, Y.M.; Li, D.H.; Cheng, K.M. Geological characteristics and resource potential of shale gas in China. Pet. Exp. Dev. 2010, 37, 641–653. [Google Scholar] [CrossRef]
  5. Wang, S.Q.; Chen, G.S.; Dong, D.Z.; Yang, G.; Lu, Z.G.; Xu, Y.H.; Huang, Y.B. Accumulation conditions and exploitation prospect of shale gas in the lower Paleozoic Sichuan Basin. Nat. Gas Ind. 2009, 29, 51–58. [Google Scholar]
  6. Tan, J.Q.; Weniger, P.; Krooss, B.; Merkel, A.; Horsfield, B.; Zhang, J.C. Shale gas potential of the major marine shale formations in the upper Yangtze platform, South China, Part II: Methane sorption capacity. Fuel 2014, 129, 204–218. [Google Scholar] [CrossRef]
  7. Zou, C.N.; Dong, D.Z.; Yang, H.; Wang, Y.M.; Huang, J.L.; Wang, S.F.; Fu, C.X. Conditions of shale gas accumulation and exploration practices in China. Nat. Gas Ind. 2011, 31, 26–39. [Google Scholar]
  8. Han, S.B.; Zhang, J.C.; Li, Y.X.; Horsfield, B.; Tang, X.; Jiang, W.L.; Chen, Q. Evaluation of Lower Cambrian Shale in Northern Guizhou Province, South China: Implications for Shale Gas Potential. Energy Fuels 2013, 27, 2933–2941. [Google Scholar] [CrossRef]
  9. Zhao, W.Z.; Li, J.Z.; Yang, T.; Wang, S.F.; Huang, J.L. Geological difference and its significance of marine shale gases in South China. Pet. Exp. Dev. 2016, 43, 547–559. [Google Scholar] [CrossRef]
  10. Liu, Y.; Zhang, J.C.; Zhang, P.; Liu, Z.Y.; Zhao, P.W.; Huang, H.; Mo, X.X. Origin and enrichment factors of natural gas from the Lower Silurian Songkan Formation in northern Guizhou province, south China. Int. J. Coal Geol. 2018, 187, 20–29. [Google Scholar] [CrossRef]
  11. Wang, S.J.; Wang, L.S.; Huang, J.L.; Li, X.J.; Li, D.H. Accumulation conditions of shale gas reservoirs in Silurian of the Upper Yangtze region. Nat. Gas Ind. 2009, 29, 45–50. [Google Scholar]
  12. Liang, C.; Jiang, Z.X.; Zhang, C.M.; Guo, L.; Yang, Y.T.; Li, J. The shale characteristics and shale gas exploration prospects of the Lower Silurian Longmaxi shale, Sichuan Basin, South China. J. Pet. Sci. Eng. 2014, 21, 636–648. [Google Scholar] [CrossRef]
  13. Wang, Z.H.; Tan, Q.G.; He, L.; Cheng, J.X.; Wang, R.H. Deposition and sequence stratigraphy of the Silurian Shiniulan Formation in southeastern Sichuan-northern Guizhou province. Oil Gas Geol. 2013, 34, 499–507. [Google Scholar]
  14. Supervision, G.A.O.Q. Determination of Total Organic Carbon in Sedimentary Rock; GB/T19145-2003; CHINESE GB Standards: Beijing, China, 2003. [Google Scholar]
  15. SY/T5124-1995. Method for Determining the Vitrinite Reflectance in the Sedimentary Rocks; China Petroleum Standardization Committee: Beijing, China, 1995. [Google Scholar]
  16. SY/T5125-1996. Identification and Classification Method of the Maceral Composition of Organic Matter Using Fluorescence-Fluorescent Light; China Petroleum Standardization Committee: Beijing, China, 1996. [Google Scholar]
  17. Cao, Q.Y. Identification of microcomponents and types of kerogen under transmitted light. Pet. Explor. Dev. 1985, 5, 14–23. [Google Scholar]
  18. Wang, X.; Gao, S.; Gao, C. Geological features of Mesozoic continental shale gas in south of Ordos Basin, NW China. Pet. Exp. Dev. 2014, 41, 326–337. [Google Scholar] [CrossRef]
  19. Dang, W.; Zhang, J.C.; Wei, X.L.; Tang, X.; Chen, Q.; Li, Z.M.; Zhang, M.C.; Liu, J. Geological controls on methane adsorption capacity of Lower Permian transitional black shales in the Southern North China Basin, Central China: Experimental results and geological implications. J. Pet. Sci. Eng. 2017, 152, 456–470. [Google Scholar] [CrossRef]
  20. Gasparik, M.; Bertier, P.; Gensterblum, Y.; Ghanizadeh, A.; Littke, R. Geological controls on the methane storage capacity in organic-rich shales. Int. J. Coal Geol. 2014, 123, 34–51. [Google Scholar] [CrossRef]
  21. Ji, L.; Zhang, T.; Milliken, K.; Qu, J.; Zhang, X. Experimental investigation of main controls to methane adsorption in clay-rich rocks. Appl. Geochem. 2012, 27, 2533–2545. [Google Scholar] [CrossRef]
  22. Dang, W.; Zhang, J.C.; Nie, H.K.; Wang, X.; Tang, X.; Wu, N.; Chen, Q.; Wei, X.L.; Wang, R. Isotherms, thermodynamics and kinetics of methane-shale adsorption pair under supercritical condition: Implications for understanding the nature of shale gas adsorption process. Available online: https://www.sciencedirect.com/science/article/pii/S1385894719326038 (accessed on 23 October 2019).
  23. Sudibandriyo, M.; Pan, Z.J.; Fitzgerald, J.E.; Robinson, R.L.; Gasem, K.A.M. Adsorption of methane, nitrogen, carbon dioxide, and their binary mixtures on dry activated carbon at 318.2 k and pressures up to 13.6 mpa. Langmuir 2003, 19, 5323–5331. [Google Scholar] [CrossRef]
  24. Langmuir, I. The adsorption of gases on plane surfaces of glass, mica and platinum. J. Chem. Phys. 2015, 40, 1361–1403. [Google Scholar] [CrossRef]
  25. Lewis, R.; Ingraham, D.; Sawyer, W. New Evaluation Techniques for Gas Shale Reservoirs. Reserv. Symp. 2004, 2002, 1–11. [Google Scholar]
  26. Schlumberger. Log Interpretation Volume 1: Principles; Schlumberger Education Services: Huston, TX, USA, 1972. [Google Scholar]
  27. Diamond, W.; LaScola, J.; Hyman, D. Results of Direct-method Determination of the Gas Content of US Coalbeds; Bureau of Mines Information Circular: Pittsburgh, PA, USA, 1986. [Google Scholar]
  28. Yee, D.; Seidle, J.; Hanson, W. Gas sorption on coal and measurement of gas content. AAPG Stud. Geol. 1993, 38, 203–218. [Google Scholar]
  29. Diamond, W.; Schatzel, S. Measuring the gas content of coal: A review. Int. J. Coal Geol. 1998, 35, 311–331. [Google Scholar] [CrossRef]
  30. Dang, W.; Zhang, J.C.; Tang, X.; Wei, X.L.; Li, Z.M.; Wang, C.H.; Chen, Q.; Liu, C. Investigation of gas content of organic-rich shale: A case study from Lower Permian shale in southern North China Basin, central China. Geosci. Front. 2018, 9, 559–575. [Google Scholar] [CrossRef]
  31. Behar, F.; Beaumont, V.; Penteado, H.D.B. Rock-Eval 6 technology: Performances and developments. Oil Gas Sci. Technol. 2001, 56, 111–134. [Google Scholar] [CrossRef]
  32. Jarvie, D.M.; Hill, R.J.; Ruble, T.E.; Pollastro, R.M. Unconventional shale-gas systems: The Mississippian Barnett Shale of north-central Texas as one model for thermogenic shale-gas assessment. AAPG Bull. 2007, 91, 475–499. [Google Scholar] [CrossRef]
  33. Ni, Y.Y.; Dai, J.X.; Zhu, G.Y.; Zhang, S.C.; Zhang, D.J.; Su, J.; Tao, X.W.; Liao, F.R.; Wu, W.; Gong, D.Y. Stable hydrogen and carbon isotopic ratios of coal-derived and oil-derived gases: A case study in the tarim basin, NW China. Int. J. Coal Geol. 2013, 116, 302–313. [Google Scholar] [CrossRef]
  34. Dai, J.X.; Zou, C.N.; Liao, S.M.; Dong, D.Z.; Ni, Y.Y.; Huang, J.L.; Wu, W.; Gong, D.Y.; Huang, S.P.; Hu, G.Y. Geochemistry of the extremely high thermal maturity Longmaxi shale gas, southern Sichuan Basin. Org. Geochem. 2014, 74, 3–12. [Google Scholar] [CrossRef]
  35. Dai, J.X.; Gong, D.Y.; Ni, Y.Y.; Huang, S.P.; Wu, W. Stable carbon isotopes of coal-derived gases sourced from the Mesozoic coal measures in China. Org. Geochem. 2014, 74, 123–142. [Google Scholar] [CrossRef]
  36. Boyer, C.; Kieschnick, J.; Suarez-Rivera, R.; Lewis, R.E.; Waters, G. Producing gas from its source. Oilfield Rev. 2006, 18, 36–49. [Google Scholar]
  37. Romero, A.M.; Philp, R.P. Organic geochemistry of the Woodford Shale, southeastern Oklahoma: How variable can shales be? AAPG Bull. 2012, 96, 493–517. [Google Scholar] [CrossRef]
  38. Bowker, K.A. Barnett Shale gas production, Fort Worth Basin: Issues and discussion. Aapg Bull. 2007, 91, 523–533. [Google Scholar] [CrossRef]
  39. Qin, J.; Zheng, L. Study on the restitution coefficient of original total organic carbon for high mature marine source rocks. Front. Earth Sci.-China 2007, 1, 482–490. [Google Scholar] [CrossRef]
  40. Dang, W.; Zhang, J.C.; Tang, X.; Chen, Q.; Han, S.B.; Li, Z.M.; Du, X.R.; Wei, X.L.; Zhang, M.Q.; Liu, J. Shale gas potential of Lower Permian marine-continental transitional black shales in the Southern North China Basin, central China: Characterization of organic geochemistry. J. Nat. Gas Sci. Eng. 2016, 28, 639–650. [Google Scholar] [CrossRef]
  41. Berner, U.; Faber, E. Maturity related mixing model for methane, ethane and propane, based on carbon isotopes. Org. Geochem. 1988, 13, 67–72. [Google Scholar] [CrossRef]
  42. Chung, H.M.; Gormly, J.R.; Squires, R.M. Origin of Gaseous Hydrocarbons in Subsurface Environment; Theoretical Considerations of Carbon Isotope Distribution. Chem. Geol. 1988, 71, 97–104. [Google Scholar] [CrossRef]
  43. Schoell, M. The hydrogen and carbon isotopic composition of methane from natural gases of various origins. Geochim. Cosmochim. Acta 1980, 44, 649–661. [Google Scholar] [CrossRef]
  44. Whiticar, M.J. Carbon and hydrogen isotope systematic of microbial formation and oxidation of methane. Chem. Geol. 1999, 161, 291–314. [Google Scholar] [CrossRef]
  45. Strąpoć, D.; Mastalerz, M.; Eble, C.; Schimmelmann, A. Characterization of the origin of coalbed gases in southeastern Illinois basin by compound-specific carbon and hydrogen stable isotope ratios. Org. Geochem. 2007, 38, 267–287. [Google Scholar] [CrossRef]
  46. Strąpoć, D.; Mastalerz, M.; Schimmelmann, A. Variability of geochemical properties in amicrobially dominated coalbed gas system from the eastern margin of the Illinois Basin, USA. Int. J. Coal Geol. 2008, 76, 98–110. [Google Scholar] [CrossRef]
  47. Galimov, E.M. 13C enrichment of methane during passage through rocks. Geochem. Int. USSR 1967, 4, 1180–1181. [Google Scholar]
  48. Colombo, U.; Gazzarrini, F.; Gonfiantini, R.; Tongiorgi, E.; Caflisch, L. Carbon Isotopic Study of Hydrocarbons in Italian Natural Gases. Adv. Org. Geochem. 1969, 43, 499–516. [Google Scholar]
  49. Stahl, W. Carbon isotope fractionations in natural gases. Nature 1974, 251, 134–135. [Google Scholar] [CrossRef]
  50. Schoell, M. Genetic Characterization of Natural Gases. AAPG Bull. 1983, 67, 2225–2238. [Google Scholar]
  51. Zhang, F.K.; Zhang, Y.G. Identification of carbon isotope method for natural gas. In Proceedings of the Organic Geochemistry, Beijing, China, 1 March 1987; Geological Publishing House: Beijing, China, 1987; pp. 1–14. [Google Scholar]
  52. Dai, J.X. Carbon and hydrogen isotopic compositions and origin identification of different types natural gas. Nat. Gas Geosci. 1993, 4, 1–40. [Google Scholar]
  53. Ding, W.J.; Hou, D.J.; Zhang, W.W.; He, D.S.; Cheng, X. A new genetic type of natural gases and origin analysis in Northern Songnan-Baodao Sag, Qiongdongnan Basin, South China Sea. J. Pet. Sci. Eng. 2018, 50, 384–398. [Google Scholar] [CrossRef]
  54. Dai, J.X.; Xia, X.Y.; Qin, S.F.; Zhao, J.Z. Causation of partly reversed orders of δ13C in biogenic alkane gas in China. Oil Gas J. 2003, 24, 1–6. [Google Scholar]
  55. Dai, J.X. Selected Works of Natural Gas Geology and Geochemistry: Vol. 2; Petroleum Industry Press: Beijing, China, 2000; p. 201. [Google Scholar]
  56. Dai, J.X.; Zou, C.N.; Dong, D.Z.; Ni, Y.Y.; Wu, W.; Gong, D.Y.; Wang, Y.M.; Huang, S.P.; Huang, J.L.; Fang, C.C.; et al. Geochemical characteristics of marine and terrestrial shale gas in China. Mar. Pet. Geol. 2016, 76, 444–463. [Google Scholar] [CrossRef]
Figure 1. The geological map of the study area with the location of the sampling well and outcrop profile.
Energies 12 04087 g001
Figure 2. The generalized stratigraphic column and characteristics of logging curves of the upper Ordovician Wufeng–lower Silurian Longmaxi and lower Silurian Shiniulan Formation in the northern Guizhou.
Energies 12 04087 g002
Figure 3. Microscopic compositional characteristics of organic matter in the Shiniulan Formation and Longmaxi Formation of AY (AnYe)-1.
Energies 12 04087 g003
Figure 4. The relationship of the organic matter abundance of samples and the depth of AY-1 well.
Energies 12 04087 g004
Figure 5. Relationship between maturity of samples and depth.
Energies 12 04087 g005
Figure 6. Methane adsorption isotherms of different Shiniulan mudstone samples at 30 °C.
Energies 12 04087 g006
Figure 7. The relationship of total organic carbon (TOC) of samples and adsorption capacity (VL) of mudstone.
Energies 12 04087 g007
Figure 8. The relationship of Langmuir pressure (PL) and Langmuir volume (VL).
Energies 12 04087 g008
Figure 9. The relationship of porosity of samples and the free gas content of mudstone.
Energies 12 04087 g009
Figure 10. The distribution of total gas contents from different formations in the AY-1 well.
Energies 12 04087 g010
Figure 11. The photos about fracture characteristics of cores from Shiniulan Formation.
Energies 12 04087 g011
Figure 12. X identification chart of natural gas genetic type in Shiniulan Formation (After Zhang et al. [51]).
Energies 12 04087 g012
Figure 13. Discrimination of natural gas genetic types of Shiniulan Formation (using Ding et al. [53]).
Energies 12 04087 g013
Figure 14. Carbon isotope variations in ethane related to carbon isotope variations in methane (taking after Schoell M. [50]).
Energies 12 04087 g014
Figure 15. Determination of natural gas genesis based on carbon isotope composition (using Dai. [55]).
Energies 12 04087 g015
Figure 16. Photos about the development of fractures at the outcrop.
Energies 12 04087 g016
Figure 17. Photos about the core fractures of Shiniulan Formation.
Energies 12 04087 g017aEnergies 12 04087 g017b
Figure 18. Comparison of mudstone and limestone fractures of Shiniulan Formation. (a) The variety trend of liner density of cracks from 2107 to 2125 meters. (b) The variety trend of liner density of cracks from 2125 to 2156 meters.
Energies 12 04087 g018
Figure 19. The Fractures’ development pattern in the Shiniulan Formation.
Energies 12 04087 g019
Figure 20. Natural gas accumulation model of Shiniulan Formation in AY-1 well.
Energies 12 04087 g020
Table 1. The microscopic examination of organic matter microscopic components of AY-1.
Maceral (%)Shiniulan FormationLongmaxi Formation
AY-1-1AY-1-3AY-1-4AY-1-5AY-1-6AY-1-17AY-1-18AY-1-19AY-1-20
Sapropelinite828388849695879686
Liptinite---------
Vitrinite1716101532938
Inertinite112113416
Type index687078719391769374
Type II1II1II1II1IIII1III1
Table 2. The calculated results of parameters for evaluating hydrocarbon generative potential of samples.
SampleDepth (m)FormationMeasured DataCalculated Data
S1 (mgHC·g−1 Rock)S2 (mgHC g−1 Rock)TOC (wt%)HIo (mgHC·g−1 Rock)PIpd (%)HI (mgHC·g−1Rock)TRHITOCo (wt%)S2o (mgHC·g−1 Rock)QHC (mgHC·g−1 Rock)Vre (cm3·g−1 Rock)
AY-1-12110Shiniulan0.0070.0230.126370.2334.10.970.221.391.372.14
AY-1-22116Shiniulan0.0170.0370.116430.3198.70.920.211.381.342.11
AY-1-32118Shiniulan0.0140.0350.246740.2940.90.970.493.283.245.02
AY-1-62131Shiniulan0.0120.0220.166490.3517.40.990.332.142.113.27
AY-1-72156Shiniulan0.0070.0340.146800.1724.90.980.281.881.852.88
AY-1-182318Wufeng0.0210.0214.116860.505.41.0010.8074.1074.08113.47
AY-1-232328Wufeng0.1410.0650.806920.6820.00.991.8612.8812.8119.72
AY-1-242334Wufeng0.0040.0041.207050.5022.50.992.8720.2420.2431.00
(1)
HI O = ( % type I 100 × 750 ) + ( % type II 100 × 450 ) + ( % type III 100 × 125 ) + ( % type IV 100 × 50 ) , and the % type is the percentages of kerogen macerals.
(2)
TR HI = 1 HI pd [ 1200 HI O ( 1 PI O ) ] HI O [ 1200 HI pd ( 1 PI pd ) ] ; TOC o = HI pd ( TOC pd ) × 83.33 HI O ( 1 TR HI ) ( 83.33 TOC pd ) HI pd ( TOC pd ) (83.33 is the mean number of hydrocarbons carbon). PI O = 0.02 / PI pd ;
S2o = HIo-TOCo/100, mg HC·g−1 Rock; QHC = S2o − S2, mg HC·g−1 Rock.
(3)
Vre = (n × QHC)/MCH4, where n is molar volume of gas under the experimental environment with the temperature of 25 °C and the pressure of 1.01 × 10⁵ Pa, 24.5 L/mol; MCH4 is the methane molar mass, 16 g·mol−1.
Table 3. The Langmuir fitting results and thermodynamic parameters of methane adsorption.
Adsorption Capacity under Different PressuresAdsorption ConstantsDepth (m)
Pressure (Mpa)00.351.072.254.315.256.248.7211.13VL (m3·t−1)PL (MPa)V (m3·t−1)
Adsorbed gas (m3·t−1)00.160.330.450.470.480.510.550.570.631.100.562110 (AY-1-1)
00.250.50.60.70.720.750.770.790.881.040.782120 (AY-1-5)
00.230.40.520.570.590.620.650.660.721.080.682131 (AY-1-6)
00.20.350.50.510.550.580.60.620.681.110.662156 (AY-1-7)
Table 4. Free gas content of mudstone samples using computational method.
SampleEffective Porosity (%)Gas Saturation (%)Formation Pressure (MPa)Density (g·cm−3)Compressibility FactorFormation Temperature (°C)The Free Volume (m3·t−1)
AY-1-13.403028.542.70.9470.640.96
AY-1-33.506728.642.70.9570.832.12
AY-1-63.705537.802.70.9271.142.31
AY-1-73.903641.622.70.9371.741.95
AY-1-85.005644.992.70.9372.704.19
AY-1-95.106244.562.70.9372.734.70
AY-1-104.805744.562.70.9372.754.10
AY-1-114.106544.562.70.9372.783.96
AY-1-122.207844.782.70.9372.802.56
AY-1-132.304544.782.70.9372.821.50
AY-1-142.865844.782.70.9372.852.47
AY-1-154.664944.782.70.9372.883.40
AY-1-165.705242.152.70.9372.904.17
Table 5. The results of calculated total gas content of samples.
SampleDepth(m)TOC (%)The Content of Free Gas (m3·t−1)The Content of Adsorption Gas (m3·t−1)Theoretical Gas Content (m3·t−1)
AY-1-121100.110.960.631.59
AY-1-421190.242.120.883.00
AY-1-621310.162.310.723.03
AY-1-721560.141.950.682.63
AY-1-821960.354.191.105.29
AY-1-921970.344.671.085.75
AY-1-1021980.314.101.015.11
AY-1-1121990.373.961.145.10
AY-1-1222000.332.561.063.62
AY-1-1322010.431.501.272.77
AY-1-1422020.402.501.213.71
AY-1-1522030.373.401.164.56
AY-1-1622040.354.171.115.28
Table 6. The contents of desorbed gas are measured by USBM direct method.
SampleDepth (m)FormationSample Weight (g)Desorbed Gas Content (m3·t−1)Lost Gas Content (m3·t−1)Total Gas Content (m3·t−1)
B1-32107.99Shiniulan35800.5560.0530.609
1-3 (A3)2108.88Shiniulan32910.0230.0420.065
B1-22110.27Shiniulan35280.1130.0040.117
1-2 (A2)2111.97Shiniulan37780.0320.1400.172
B1-12113.56Shiniulan34380.1040.0380.142
1-1 (A1)2114.82Shiniulan36750.0460.1700.216
B2-12119.55Shiniulan36540.1110.0290.140
2-2 (A2)2119.55Shiniulan36390.0570.1140.171
B2-22121.98Shiniulan34280.1540.0270.181
2-1 (A1)2121.98Shiniulan36540.0720.1180.190
B3-32123.66Shiniulan29320.1530.1190.272
3-4 (A5)2123.98Shiniulan37200.0700.1340.204
3-3 (A3)2129.05Shiniulan34970.0740.1370.211
B3-22130.26Shiniulan32330.1510.0780.229
3-2 (A2)2133.45Shiniulan37460.0690.1780.247
B3-12135.43Shiniulan25860.1900.1070.297
3-1 (A1)2139.46Shiniulan35970.1840.6570.841
B4-22142.67Shiniulan35450.1400.5710.711
B4-12153.33Shiniulan29100.1620.5800.742
B5-32317.86Longmaxi16261.6982.7634.461
B5-22318.19Longmaxi16181.6162.6544.270
A4-12318.41Longmaxi13421.0262.0953.121
B5-12319.20Longmaxi16091.4692.4753.944
(A8-1)2319.70Longmaxi12551.5963.5125.108
B6-42320.57Longmaxi15480.7283.2673.995
(A3-1)2322.10Longmaxi13121.5091.9843.493
B6-32323.54Longmaxi14612.2183.9266.144
B6-52324.26Longmaxi15592.3313.6665.997
(A2-1)2325.92Wufeng17411.9594.1266.085
B6-22326.10Wufeng13641.2225.0056.227
B6-12327.11Wufeng14761.4842.3853.869
(A8-2)2329.04Wufeng13371.0351.2472.282
B7-22329.66Wufeng14960.9961.6302.626
(A7-1)2331.04Wufeng17530.8001.3772.177
B7-12331.36Wufeng14711.3311.9633.294
Table 7. The molecule compositions of gas samples of AY-1 (data quoted from Liu et al. [10]).
Sample StrataGas Composition (%)δ13C(‰)VPDBδ2H(‰)VSMOW
CH4C2H6C3H8CO2CH4C2H6CO2CH4
1S1s96.2892.0670.1390.795−33.6 −36.8−18.6−149
2S1s95.3752.0410.1260.864−33.6 −36.9−18.1−156.6
3S1s96.4322.0820.1430.709−33.2 −37.0−17.6−145.8
4S1s96.2762.0580.1320.798−33.5 −36.8
5S1s95.2442.0420.1240.864−33.9 −36.5
6S1s95.6822.0630.1270.823−33.4 −36.8
7S1s96.2782.0530.1340.805−33.4 −36.6
8S1s96.2582.0490.1280.821−33.3 −36.5
9S1s96.2742.0520.1320.812−33.9 −36.8−20.8−150
10S1s95.8742.0650.1310.818−33.2 −36.2−20.6−153.9
11S1s95.9462.0660.1340.806−33.5 −37.0−19.4−146
Footnote: S1s: the Shiniulan Formation of the Silurian.

