The Efficiency of the Sustainable Development Policy for Energy Consumption under Environmental Law in Thailand: Adapting the SEM-VARIMAX Model


Abstract
1. Introduction
2. Literature Review
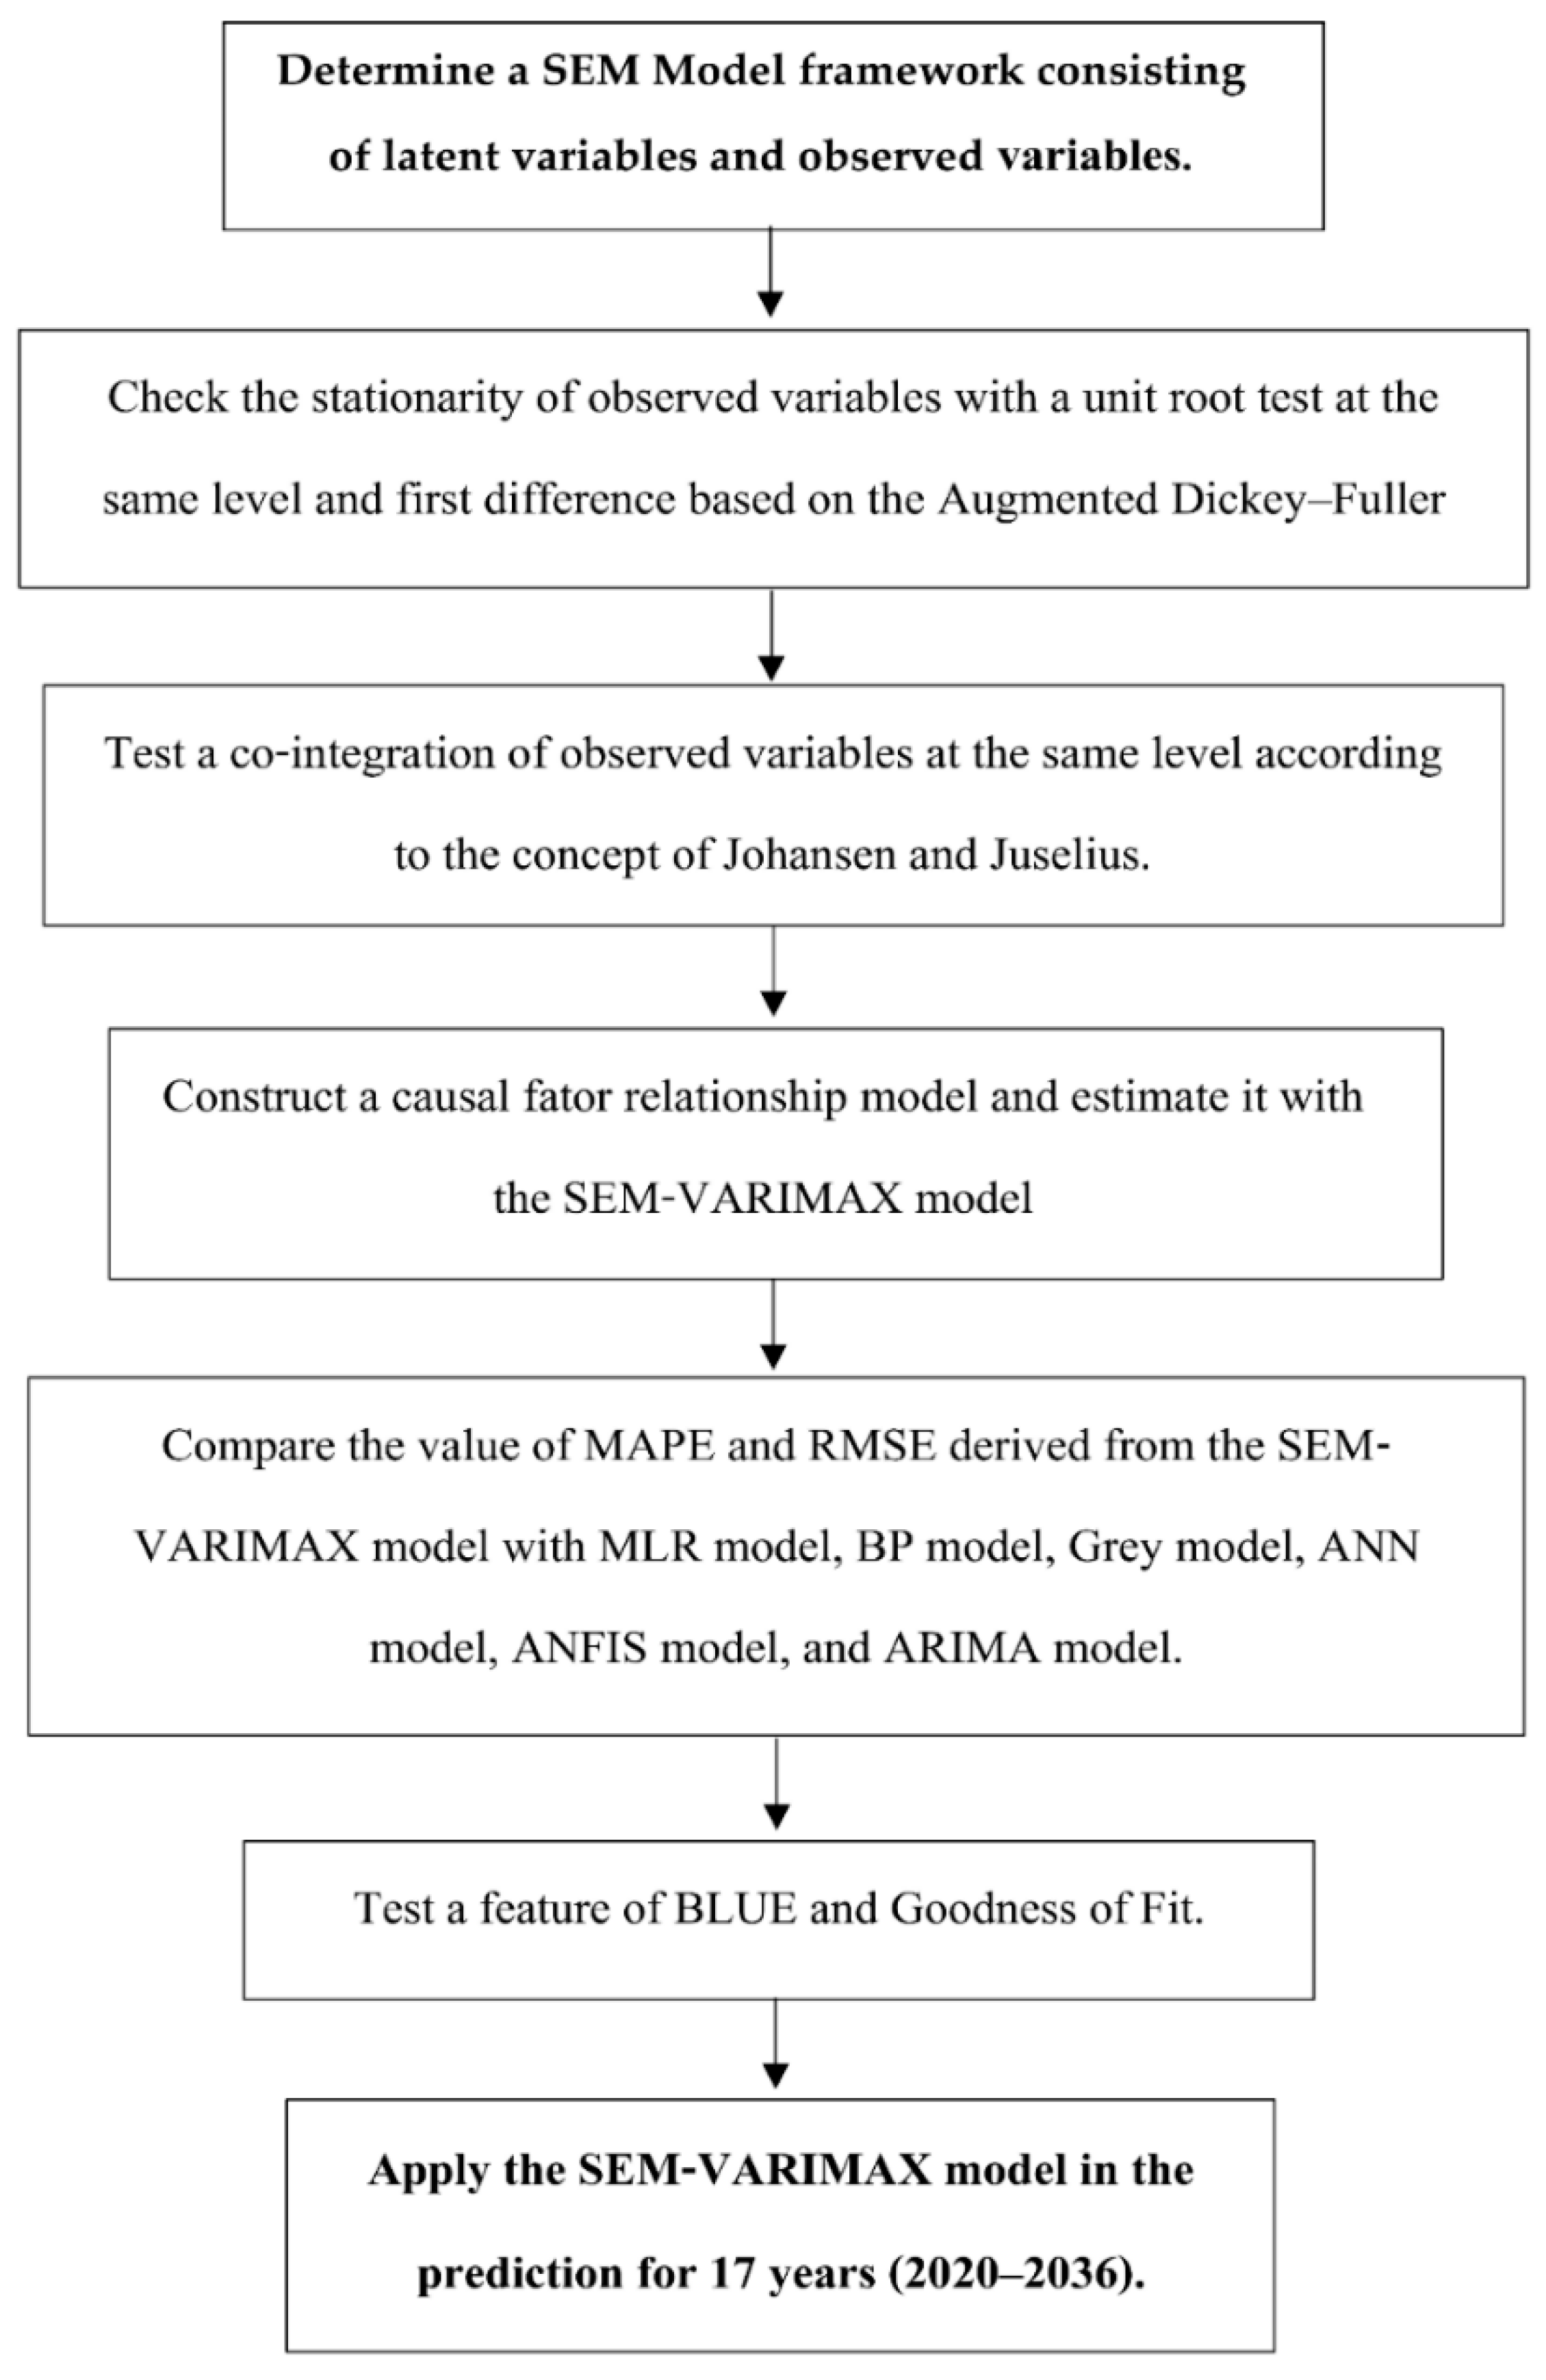
- Determine a variable framework based on the SEM-VARIMAX model, which contains both latent variables of Sustainable development policy under environmental law , economic , social , and environmental , and observed variables of Sustainable development policy under environmental law indicators, Error Correction Mechanism and energy consumption . As of the economic indicators, there are per capita GDP , urbanization rate , industrial structure , net exports , indirect foreign investment , foreign tourists . The social indicators are employment , health and illness , social security , consumer protection . The environmental indicators include Carbon Dioxide Emissions and energy intensity .
- Examine and check the stationarity of observed variables with a unit root test based on the concept of the Augmented Dickey–Fuller [96].
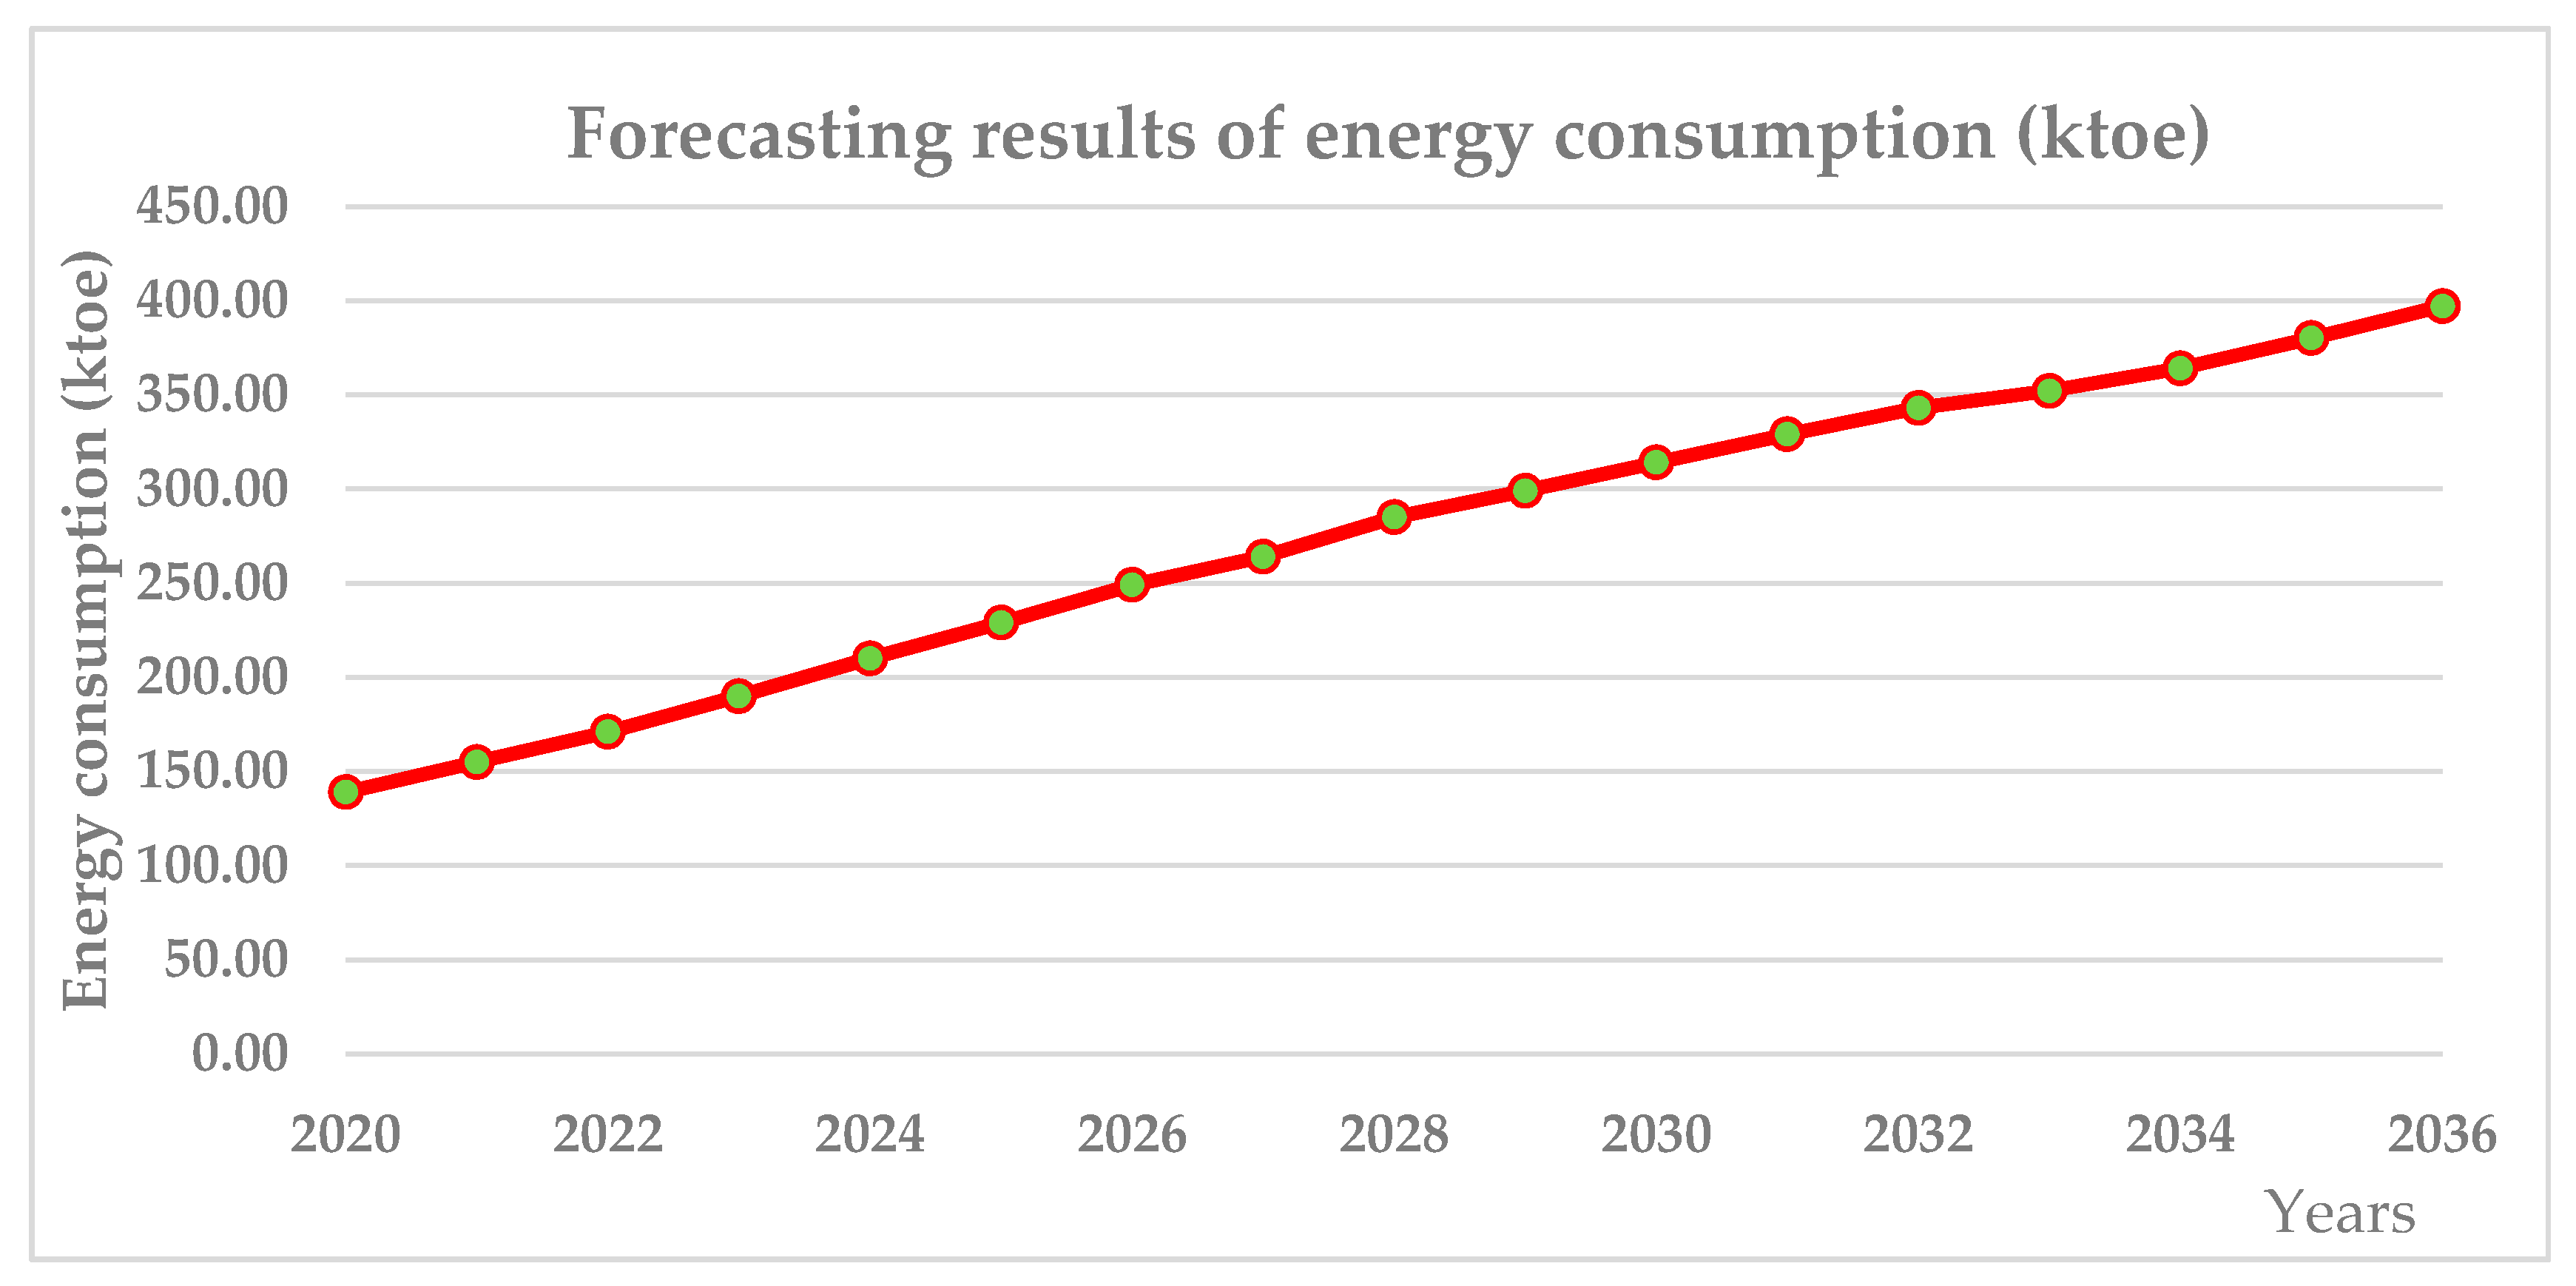
- Forecast the future Sustainable Development policy for energy consumption under Environmental Law with the use of a sample indicator, which is energy consumption , by deploying the SEM-VARIMAX model for the year of 2020 to 2036, totaling 17 years. The flowchart of the SEM-VARIMAX model is shown below.
3. Materials and Methods
3.1. SEM-VARIMAX Model
- The parameters in the VAR(1) model are actually caused by the parameters in the SEM-VARIMAX(1) model, or the parameters of both models are related.
- The number of parameters in the VAR(1) model was 9, namely the , parameters of , the parameters of and the parameter of .
- The number of parameters in the SEM-VARIMAX(1) model was 10, namely the , parameters of and the parameters of .
3.2. Measurement of the Forecasting Performance
4. Empirical Analysis
4.1. Screening of Influencing Factors for Model Input
4.2. Analysis of Co-Integration
4.3. Formation of Analysis Modeling with the SEM-VARIMAX Model
4.4. The Forecasting Model and the Efficiency of the Sustainable Development Policy for Energy Consumption under Environmental Law in Thailand based on the SEM-VARIMAX model
5. Conclusions and Discussion
Author Contributions
Funding
Acknowledgments
Conflicts of Interest
References
- Savaresi, A. The Paris Agreement: An Early Assessment. Environ. Policy Law 2016, 46, 14–18. [Google Scholar]
- Laina, E. Sustainable Development in Operation. Environ. Policy Law 2016, 46, 47–49. [Google Scholar]
- Sustainable Development Goals. Available online: http://www.solarimpulse.com/sustainable-development-goals? (accessed on 30 June 2019).
- Krapp, R. Sustainable Development in the Second Committee. Environ. Policy Law 2016, 46, 10–13. [Google Scholar]
- Uddin, M.K. Climate Change and Global Environmental Politics: North-South Divide. Environ. Policy Law 2017, 46, 106–114. [Google Scholar] [CrossRef]
- Moore, P.; Pereira, E.S.; Duggin, G. Developing Environmental Law for All Citizens. Environ. Policy Law 2015, 45, 88–98. [Google Scholar]
- Global Goals and the Environment: Progress and prospects. Available online: https://www.iisd.org/library/global-goals-and-environment-progress-and-prospects (accessed on 30 June 2019).
- Savaresi, A. Developments in Environmental Law. Environ. Policy Law 2012, 42, 365–369. [Google Scholar]
- Office of Natural Resources and Environmental Policy and Planning. Available online: http://www.onep.go.th (accessed on 1 April 2019).
- Office of the National Economic and Social Development Board (NESDB). Available online: http://www.nesdb.go.th/nesdb_en/more_news.php?cid=154&filename=index (accessed on 1 April 2019).
- National Statistic Office Ministry of Information and Communication Technology. Available online: http://web.nso.go.th/index.htm (accessed on 1 April 2019).
- Department of Alternative Energy Development and Efficiency. Available online: http://www.dede.go.th/ewtadmin/ewt/dede_web/ewt_news.php?nid=47140 (accessed on 2 April 2019).
- Thailand Greenhouse Gas Management Organization (Public Organization). Available online: http://www.tgo.or.th/2015/thai/content.php?s1=7&s2=16&sub3=sub3 (accessed on 2 April 2019).
- Achawangkul, Y. Thailand’s Alternative Energy Development Plan. Available online: http://www.unescap.org/sites/default/files/MoE%20_%20AE%20policies.pdf (accessed on 3 April 2019).
- Zhou, K.; Zhang, H.; Baum, J.; Chen, W. The Evolution of Policy and Law for Sustainable Development in China. Front. Law China 2014, 9, 389–402. [Google Scholar]
- Fan, K.-K.; Feng, T.-T. Discussion on Sustainable Development Strategies of the Traditional Handicraft Industry Based on Su-Style Furniture in the Ming Dynasty. Sustainability 2019, 11, 8. [Google Scholar] [CrossRef]
- Boyd, E.; Hultman, N.; Roberts, J.T.; Corbera, E.; Cole, J.; Bozmoski, A.; Ebeling, J.; Tippman, R.; Mann, P.; Brown, K.; et al. Reforming the CDM for sustainable development: Lessons learned and policy futures. Environ. Sci. Policy 2009, 12, 280–831. [Google Scholar] [CrossRef]
- Joseph, C. Understanding sustainable development concept in Malaysia. Soc. Responsib. J. 2013, 9, 441–453. [Google Scholar] [CrossRef]
- Bahauddin, K.M. Environmental system management and governance needs in a developing country. Environ. Syst. Decis. 2014, 34, 342–357. [Google Scholar] [CrossRef]
- Rivera, M. Political Criteria for Sustainable Development Goal (SDG) Selection and the Role of the Urban Dimension. Sustainability 2013, 5, 5034–5051. [Google Scholar] [CrossRef]
- Ali, S.; Bibi, M.; Rabbi, F. A New Economic Dimension to the Environmental Kuznets Curve: Estimation of Environmental Efficiency in Case of Pakistan. Asian Econ. Financ. Rev. 2014, 4, 68–79. [Google Scholar]
- Pinkse, J.; Kolk, A. Addressing the Climate Change—Sustainable Development Nexus: The Role of Multistakeholder Partnerships. Bus. Soc. 2012, 51, 176–210. [Google Scholar] [CrossRef]
- Choi, S.; Ng, A. Environmental and Economic Dimensions of Sustainability and Price Effects on Consumer Responses. J. Bus. Ethics 2011, 104, 269–282. [Google Scholar] [CrossRef]
- Amesheva, I. Environmental Degradation and Economic Development in China: An Interrelated Governance Challenge. Law Dev. Rev. 2017, 10, 425–450. [Google Scholar] [CrossRef]
- Bakari, M.E.K. Sustainable Development in a Global Context: A Success or a Nuisance? New Glob. Stud. 2015, 9, 27–56. [Google Scholar] [CrossRef]
- Martin, E.J. Economic rights, sustainable development, and environmental management. Public Adm. Manag. 2011, 16, 121–144. [Google Scholar]
- United Nations Secretariat. Urbanization and sustainable development in Asia and the Pacific: Linkages and policy implications. Available online: https://www.unescap.org/commission/73/document/E73_16E.pdf (accessed on 1 April 2019).
- Khalifa, M.A.; Connelly, S. Monitoring and guiding development in rural Egypt: Local sustainable development indicators and local Human Development Indices. Environ. Dev. Sustain. 2009, 11, 1175–1196. [Google Scholar] [CrossRef]
- Wuelser, G.; Pohl, C.; Hadorn, G.H. Structuring complexity for tailoring research contributions to sustainable development: A framework. Sustain. Sci. 2012, 7, 81–93. [Google Scholar] [CrossRef]
- Mueller, M.; Dos Santos, V.G.; Seuring, S. The Contribution of Environmental and Social Standards towards Ensuring Legitimacy in Supply Chain Governance. J. Bus. Ethics 2009, 89, 509–523. [Google Scholar] [CrossRef]
- Zhang, L.; Dzakpasu, M.; Chen, R.; Wang, X.C. Validity and utility of ecological footprint accounting: A state-of-the-art review. Sustain. Cities Soc. 2017, 32, 411–416. [Google Scholar] [CrossRef]
- Wang, Y.; Jiang, Y.; Zheng, Y.; Wang, H. Assessing the Ecological Carrying Capacity Based on Revised Three-Dimensional Ecological Footprint Model in Inner Mongolia, China. Sustainability 2019, 11, 2002. [Google Scholar] [CrossRef]
- Singh, R.; Debnath, R.M. Modeling sustainable development: India’s strategy for the future. World J. Sci. Technol. Sustain. Dev. 2012, 9, 120–135. [Google Scholar] [CrossRef]
- Giddings, B.; Hopwood, B.; O’Brien, G. Environment, economy and society: Fitting them together into sustainable development. Sustain. Dev. 2002, 10, 187–196. [Google Scholar] [CrossRef]
- Sapukotanage, S.; Warnakulasuriya, B.N.F.; Yapa, S.T.W.S. Outcomes of Sustainable Practices: A Triple Bottom Line Approach to Evaluating Sustainable Performance of Manufacturing Firms in a Developing Nation in South Asia. Int. Bus. Res. 2018, 11, 89–104. [Google Scholar] [CrossRef]
- Sutthichaimethee, P. Forecasting Economic, Social and Environmental Growth in the Sanitary and Service Sector Based on Thailand’s Sustainable Development Policy. J. Ecol. Eng. 2018, 19, 205–210. [Google Scholar] [CrossRef]
- Greaker, M.; Stoknes, P.E.; Alfsen, K.H.; Ericson, T. A Kantian approach to sustainable development indicators for climate change. Ecol. Econ. 2013, 91, 10–18. [Google Scholar] [CrossRef]
- Cetindamar, D.; Husoy, K. Corporate Social Responsibility Practices and Environmentally Responsible Behavior: The Case of the United Nations Global Compact. J. Bus. Ethics 2007, 76, 163–176. [Google Scholar] [CrossRef]
- Bedore, J. An Evaluation of Canada’s Environmental Sustainability Planning System and the Federal Sustainable Development. Act. Master’s Thesis, Queen’s University, Kingston, ON, Canada, 2008. [Google Scholar]
- Lee, D.; Park, H.; Park, S.K. Policy Issues for Contributing ODA to Sustainable Development in Developing Countries: An Analysis of Korea’s ODA and Sri Lankan Practices. Asian Perspect. 2018, 42, 623–646. [Google Scholar] [CrossRef]
- Aguilera-Caracuel, J.; Aragon-Correa, J.A.; Hurtado-Torres, N.E.; Rugman, A.M. The Effects of Institutional Distance and Headquarters’ Financial Performance on the Generation of Environmental Standards in Multinational Companies. J. Bus. Ethics 2012, 105, 461–474. [Google Scholar] [CrossRef]
- Pires, S.M.; Fidélis, T.; Ramos, T.B. Measuring and comparing local sustainable development through common indicators: Constraints and achievements in practice. Cities 2014, 39, 1–9. [Google Scholar] [CrossRef]
- Giannetti, B.F.; Demétrio, J.F.C.; Bonilla, S.H.; Agostinho, F.; Almeidan, C.M.V.B. Emergy diagnosis and reflections towards Brazilian sustainable development. Energy Policy 2013, 63, 1002–1012. [Google Scholar] [CrossRef]
- Wysokińska, Z. Millenium Development Goals/UN and Sustainable Development Goals/UN as Instruments for Realising Sustainable Development Concept in the Global Economy. Comp. Econ. Res. 2017, 20, 101–118. [Google Scholar] [CrossRef]
- Pânzaru, S.; Dragomir, C. The Considerations of the Sustainable Development and Eco-Development in National and Zonal Context. Rev. Int. Comp. Manag. 2012, 13, 823–831. [Google Scholar]
- Byrch, C.; Kearins, K.; Milne, M.; Morgan, R. Sustainable “what”? A cognitive approach to understanding sustainable development. Qual. Res. Account. Manag. 2007, 4, 26–52. [Google Scholar] [CrossRef]
- Casey, G.; Galor, O. Population Growth and Carbon Emissions. Available online: https://www.brown.edu/academics/economics/sites/brown.edu.academics.economics/files/uploads/2016-8_paper_0.pdf (accessed on 1 April 2019).
- Ramakrishnan, S.; Hishan, S.S.; Nabi, A.A.; Arshad, Z.; Kanjanapathy, M.; Zaman, K.; Khan, F. An interactive environmental model for economic growth: Evidence from a panel of countries. Environ. Sci. Pollut. Res. 2016, 23, 14567–14579. [Google Scholar] [CrossRef]
- Ladan, M.T. Achieving Sustainable Development Goals through Effective Domestic Laws and Policies on Environment and Climate Change. Environ. Policy Law 2018, 48, 42–63. [Google Scholar] [CrossRef]
- Craig, K.R.; Garmestani, A.S.; Allen, C.R.; Arnold, C.A.; Birgé, H.; DeCaro, D.A.; Fremier, A.K.; Gosnell, H.; Schlager, E. Balancing stability and flexibility in adaptive governance: An analysis of tools available in U.S. environmental law. Ecol. Soc. 2017, 22, 3. [Google Scholar] [CrossRef]
- Wang, A.L. The Search for Sustainable Legitimacy: Environmental Law and Bureaucracy in China. Harv. Environ. Law Rev. 2013, 37, 365–440. [Google Scholar] [CrossRef]
- Bartel, R.; Barclay, E. Motivational postures and compliance with environmental law in Australian agriculture. J. Rural Stud. 2011, 27, 153–170. [Google Scholar] [CrossRef]
- Kim, R.E.; Mackey, B. International environmental law as a complex adaptive system. Int. Environ. Agreem. 2014, 14, 5–23. [Google Scholar] [CrossRef]
- Huber, B.R. Transition Policy in Environmental Law. Harv. Environ. Law Rev. 2011, 35, 91–130. [Google Scholar]
- Tecklin, D.; Bauer, C.; Prieto, M. Making environmental law for the market: The emergence, character, and implications of Chile’s environmental regime. Environ. Politics 2011, 20, 879–898. [Google Scholar] [CrossRef]
- Zeben, J.V. Subsidiarity in European Environmental Law: A Competence Allocation Approach. Harv. Environ. Law Rev. 2014, 38, 415–464. [Google Scholar]
- Bodansky, D. The Legitimacy of International Governance: A Coming Challenge for International Environmental Law? Am. J. Int. Law 1999, 93, 596–624. [Google Scholar] [CrossRef]
- Heinzerling, L. New directions in environmental law: A climate of possibility. Harv. Environ. Law Rev. 2011, 35, 263–273. [Google Scholar]
- Chang, Y.-C.; Wang, N. Environmental regulations and emissions trading in China. Energy Policy 2010, 38, 3356–3364. [Google Scholar] [CrossRef]
- Periconi, J.J.; Jokajtys, M.R. Shining Some Light Back on the Dark Ages: New York State’s Early Environmental Law and Its Implications for Today’s Environmental Insurance Coverage Disputes. Environ. Claims J. 2014, 26, 287–300. [Google Scholar] [CrossRef]
- Latham, M.; Schwartz, V.E.; Appel, C.E. The intersection of tort and environmental law: Where the twains should meet and depart. Law Rev. 2011, 80, 737–773. [Google Scholar]
- Wood, M.C. “You Can’t Negotiate with a Beetle”: Environmental Law for a New Ecological Age. Nat. Resour. J. 2010, 50, 167–210. [Google Scholar]
- Gibson, R.B. In full retreat: The Canadian government’s new environmental assessment law undoes decades of progress. Impact Assess. Proj. Apprais. 2012, 30, 179–188. [Google Scholar] [CrossRef]
- Fast, H.; Fitzpatrick, P. Modernizing environmental protection in Manitoba: The environmental bill of rights as one component of environmental reform. J. Environ. Law Pract. 2017, 30, 295–320. [Google Scholar]
- De Moerloose, S. Law and Development as a Field of Study: Connecting Law with Development. Law Dev. Rev. 2017, 10, 179–186. [Google Scholar] [CrossRef]
- Tania, S.J. Is There a Linkage Between Sustainable Development and Market Access of LDCs? Law Dev. Rev. 2013, 6, 143–223. [Google Scholar] [CrossRef]
- Chepaitis, D.J.; Panagakis, A. Individualism Submerged: Climate Change and the Perils of an Engineered Environment. UCLA J. Environ. Law Policy 2010, 28, 291–342. [Google Scholar]
- Miao, H. Sustainable Development through the Right to Access to Justice in Environmental Matters in China. Sustainability 2019, 11, 900. [Google Scholar]
- Pourhashemi, S.A.; Khoshmaneshzadeh, B.; Soltanieh, M.; Hermidasbavand, D. Analyzing the individual and social rights condition of climate refugees from the international environmental law perspective. Int. J. Environ. Sci. Technol. 2012, 9, 57–67. [Google Scholar] [CrossRef]
- Ruhl, J.B. Climate Change Adaptation and the Structural Transformation of Environmental Law. Environ. Law 2009, 40, 363–431. [Google Scholar]
- Moreno, E.M.O.; de Luna, E.B.; Gómez, M.D.C.O.; López, E.J. Structural Equations Model (SEM) of a questionnaire on the evaluation of intercultural secondary education classrooms. Suma Psicol. 2014, 21, 107–115. [Google Scholar] [CrossRef]
- Boccia, F.; Sarnacchiaro, P. Structural Equation Model for the Evaluation of Social Initiatives on Customer Behaviour. Procedia Econ. Financ. 2014, 17, 211–220. [Google Scholar] [CrossRef][Green Version]
- Baumgartnar, H.; Homburg, C. Applications of Structural equation modeling in marketing and consumer research: A review. Int. J. Res. Mark. 1996, 13, 139–161. [Google Scholar] [CrossRef]
- Mai, Y.; Zhang, Z.; Wen, Z. Comparing Exploratory Structural Equation Modeling and Existing Approaches for Multiple Regression with Latent Variables. Struct. Equ. Model. Multidiscip. J. 2018, 25, 737–749. [Google Scholar] [CrossRef]
- Ryu, E.; Mehta, P. Multilevel Factorial Invariance in n-Level Structural Equation Modeling (NSEM). Struct. Equ. Model. Multidiscip. J. 2017, 24, 936–959. [Google Scholar] [CrossRef]
- Lei, M.; Lomax, R.G. The Effect of Varying Degrees of Nonnormality in Structural Equation Modeling. Struct. Equ. Model. Multidiscip. J. 2005, 12, 1–27. [Google Scholar] [CrossRef]
- Cugnata, F.; Kenett, R.; Salini, S. Bayesian Network Applications to Customer Surveys and InfoQ. Procedia Econ. Financ. 2014, 17, 3–9. [Google Scholar] [CrossRef]
- Nylund, K.L.; Asparouhov, T.; Muthen, B.O. Deciding on the Number of classes in Latent Class Analysis and Growth Mixture Modeling: A Monte Carlo Simulation Study. Struct. Equ. Model. Multidiscip. J. 2007, 14, 534–569. [Google Scholar] [CrossRef]
- Saito, M.; Kato, T.; Tang, Y. Temperature controls ecosystem CO2 exchange of an alpine meadow on the northeastern Tibetan Plateau. Glob. Chang. Biol. 2009, 15, 221–228. [Google Scholar] [CrossRef]
- Yang, M.; Yuan, K.H. Optimizing Ridge Generalized Least Squares for Structural Equation Modeling. Struct. Equ. Model. Multidiscip. J. 2019, 26, 24–38. [Google Scholar] [CrossRef]
- Chang, C.J.; Li, G.; Zhang, S.Q.; Yu, K.P. Employing a Fuzzy-Based Grey Modeling Procedure to Forecast China’s Sulfur Dioxide Emissions. Int. J. Environ. Res. Public Health 2019, 16, 2504. [Google Scholar] [CrossRef]
- Wang, H.; Huang, J.; Zhou, H.; Zhao, L.; Yuan, Y. An Integrated Variational Mode Decomposition and ARIMA Model to Forecast Air Temperature. Sustainability 2019, 11, 4018. [Google Scholar] [CrossRef]
- Ma, L.; Wu, M.; Tian, X.; Zheng, G.; Du, Q.; Wu, T. China’s Provincial Vehicle Ownership Forecast and Analysis of the Causes Influencing the Trend. Sustainability 2019, 11, 3928. [Google Scholar] [CrossRef]
- Zhao, L.T.; Liu, L.N.; Wang, Z.J.; He, L.Y. Forecasting Oil Price Volatility in the Era of Big Data: A Text Mining for VaR Approach. Sustainability 2019, 11, 3892. [Google Scholar] [CrossRef]
- Xiong, P.; Shi, J.; Pei, L.; Ding, S. A Novel Linear Time-Varying GM(1,N) Model for Forecasting Haze: A Case Study of Beijing, China. Sustainability 2019, 11, 3832. [Google Scholar] [CrossRef]
- Zhao, L.; Liu, Z.; Mbachu, J. Energy Management through Cost Forecasting for Residential Buildings in New Zealand. Energies 2019, 12, 2888. [Google Scholar] [CrossRef]
- Barari, M.; Kundu, S. The Role of the Federal Reserve in the U.S. Housing Crisis: A VAR Analysis with Endogenous Structural Breaks. J. Risk Financ. Manag. 2019, 12, 125. [Google Scholar] [CrossRef]
- Tucki, K.; Orynycz, O.; Świć, A.; Wojtanek, M.M. The Development of Electromobility in Poland and EU States as a Tool for Management of CO2 Emissions. Energies 2019, 12, 2942. [Google Scholar] [CrossRef]
- Ahmed, M.; Sultan, M.; Elbayoumi, T.; Tissot, P. Forecasting GRACE Data over the African Watersheds Using Artificial Neural Networks. Remote Sens. 2019, 11, 1769. [Google Scholar] [CrossRef]
- Ramsauer, F.; Min, A.; Lingauer, M. Estimation of FAVAR Models for Incomplete Data with a Kalman Filter for Factors with Observable Components. Econometrics 2019, 7, 31. [Google Scholar] [CrossRef]
- Sutthichaimethee, P.; Kubaha, K. The Efficiency of Long-Term Forecasting Model on Final Energy Consumption in Thailand’s Petroleum Industries Sector: Enriching the LT-ARIMAXS Model under a Sustainability Policy. Energies 2018, 11, 2063. [Google Scholar] [CrossRef]
- Sutthichaimethee, P.; Kubaha, K. A Relational Analysis Model of the Causal Factors Influencing CO2 in Thailand’s Industrial Sector under a Sustainability Policy Adapting the VARIMAX-ECM Model. Energies 2018, 11, 1704. [Google Scholar] [CrossRef]
- Jöreskog, K.G.; Sörbom, D. New Features in LISREL 8; Chicago Scientific Software International: Chicago, IL, USA, 1993. [Google Scholar]
- Hunter, M.D. State Space Modeling in an Open Source, Modular. Struct. Equ. Model. Multidiscip. J. 2018, 25, 304–324. [Google Scholar] [CrossRef]
- Sutthichaimethee, P.; Dockthaisong, B. A Relationship of Causal Factors in the Economic, Social, and Environmental Aspects Affecting the Implementation of Sustainability Policy in Thailand: Enriching the Path Analysis Based on a GMM Model. Resources 2018, 7, 87. [Google Scholar] [CrossRef]
- Dickey, D.A.; Fuller, W.A. Likelihood ratio statistics for autoregressive time series with a unit root. Econometrica 1981, 49, 1057–1072. [Google Scholar] [CrossRef]
- Johansen, S.; Juselius, K. Maximum likelihood estimation and inference on cointegration with applications to the demand for money. Oxf. Bull. Econ. Stat. 1990, 52, 169–210. [Google Scholar] [CrossRef]
- Johansen, S. Likelihood-Based Inference in Cointegrated Vector Autoregressive Models; Oxford University Press: New York, NY, USA, 1995. [Google Scholar]
- MacKinnon, J. Critical Values for Cointegration Test in Long-Run Economic Relationships; Engle, R., Granger, C., Eds.; Oxford University Press: Oxford, UK, 1991. [Google Scholar]
- Wall, M.M.; Li, R. Comparison of multiple regression to two latent variable techniques for estimation and prediction. Stat. Med. 2003, 22, 3671–3685. [Google Scholar] [CrossRef]
- Enders, W. Applied Econometrics Time Series; Wiley Series in Probability and Statistics; University of Alabama: Tuscaloosa, AL, USA, 2010. [Google Scholar]
- Harvey, A.C. Forecasting, Structural Time Series Models and the Kalman Filter; Cambridge University Press: Cambridge, UK, 1989. [Google Scholar]
- Lim, S.; Melville, N.P. Robustness of Structural Equation Modeling to Distributional Misspecification: Empirical Evidence & Research Guidelines. Available online: http:// ssrn.com/abstract=1375251 (accessed on 31 August 2019).
- Sutthichaimethee, P.; Ariyasajjakorn, D. Forecast of Carbon Dioxide Emissions from Energy Consumption in Industry Sectors in Thailand. Environ. Clim. Technol. 2018, 22, 107–117. [Google Scholar] [CrossRef]
- Sutthichaimethee, P.; Ariyasajjakorn, D. The revised input-output table to determine total energy content and total greenhouse gas emission factors in Thailand. J. Ecol. Eng. 2017, 18, 166–170. [Google Scholar] [CrossRef]
- Sutthichaimethee, P. Varimax Model to Forecast the Emission of Carbon Dioxide from Energy Consumption in Rubber and Petroleum Industries Sectors in Thailand. J. Ecol. Eng. 2017, 18, 112–117. [Google Scholar] [CrossRef][Green Version]
- Sutthichaimethee, P.; Ariyasajjakorn, D. Forecasting Model of GHG Emission in Manufacturing Sectors of Thailand. J. Ecol. Eng. 2017, 18, 18–24. [Google Scholar] [CrossRef][Green Version]
- Sutthichaimethee, P. Modeling Environmental Impact of Machinery Sectors to Promote Sustainable Development of Thailand. J. Ecol. Eng. 2016, 17, 18–25. [Google Scholar] [CrossRef]
- Sutthichaimethee, P. Model of Environmental Problems Priority Arising from the Use of Environmental and Natural Resources in Machinery Sectors of Thailand. Environ. Clim. Technol. 2016, 17, 18–29. [Google Scholar] [CrossRef]
- Grewal, R.; Cote, J.A.; Baumgartner, H. Multicollinearity and Measurement Error in Structural Equation Models: Implications for Theory Testing. Mark. Sci. 2004, 23, 519–529. [Google Scholar] [CrossRef]


| Stationary | MacKinnon Critical Value | |||
|---|---|---|---|---|
| Variables | Tau Test | 1% | 5% | 10% |
| −5.69 *** | −4.15 | −3.20 | −2.50 | |
| −5.21 *** | −4.15 | −3.20 | −2.50 | |
| −5.16 *** | −4.15 | −3.20 | −2.50 | |
| −4.65 *** | −4.15 | −3.20 | −2.50 | |
| −5.05 *** | −4.15 | −3.20 | −2.50 | |
| −4.50 *** | −4.15 | −3.20 | −2.50 | |
| −4.32 *** | −4.15 | −3.20 | −2.50 | |
| −4.29 *** | −4.15 | −3.20 | −2.50 | |
| −4.68 *** | −4.15 | −3.20 | −2.50 | |
| −4.91 *** | −4.15 | −3.20 | −2.50 | |
| −5.01 *** | −4.15 | −3.20 | −2.50 | |
| −5.85 *** | −4.15 | −3.20 | −2.50 | |
| −5.34 *** | −4.15 | −3.20 | −2.50 | |
| Variables | Co-Integration Test | Mackinnon Critical Value | ||
|---|---|---|---|---|
| , , , , , , , , , , , , | Trace statistic test | Max-Eigen statistic test | 1% | 5% |
| 215.75 *** | 121.01 *** | 15.25 | 11.75 | |
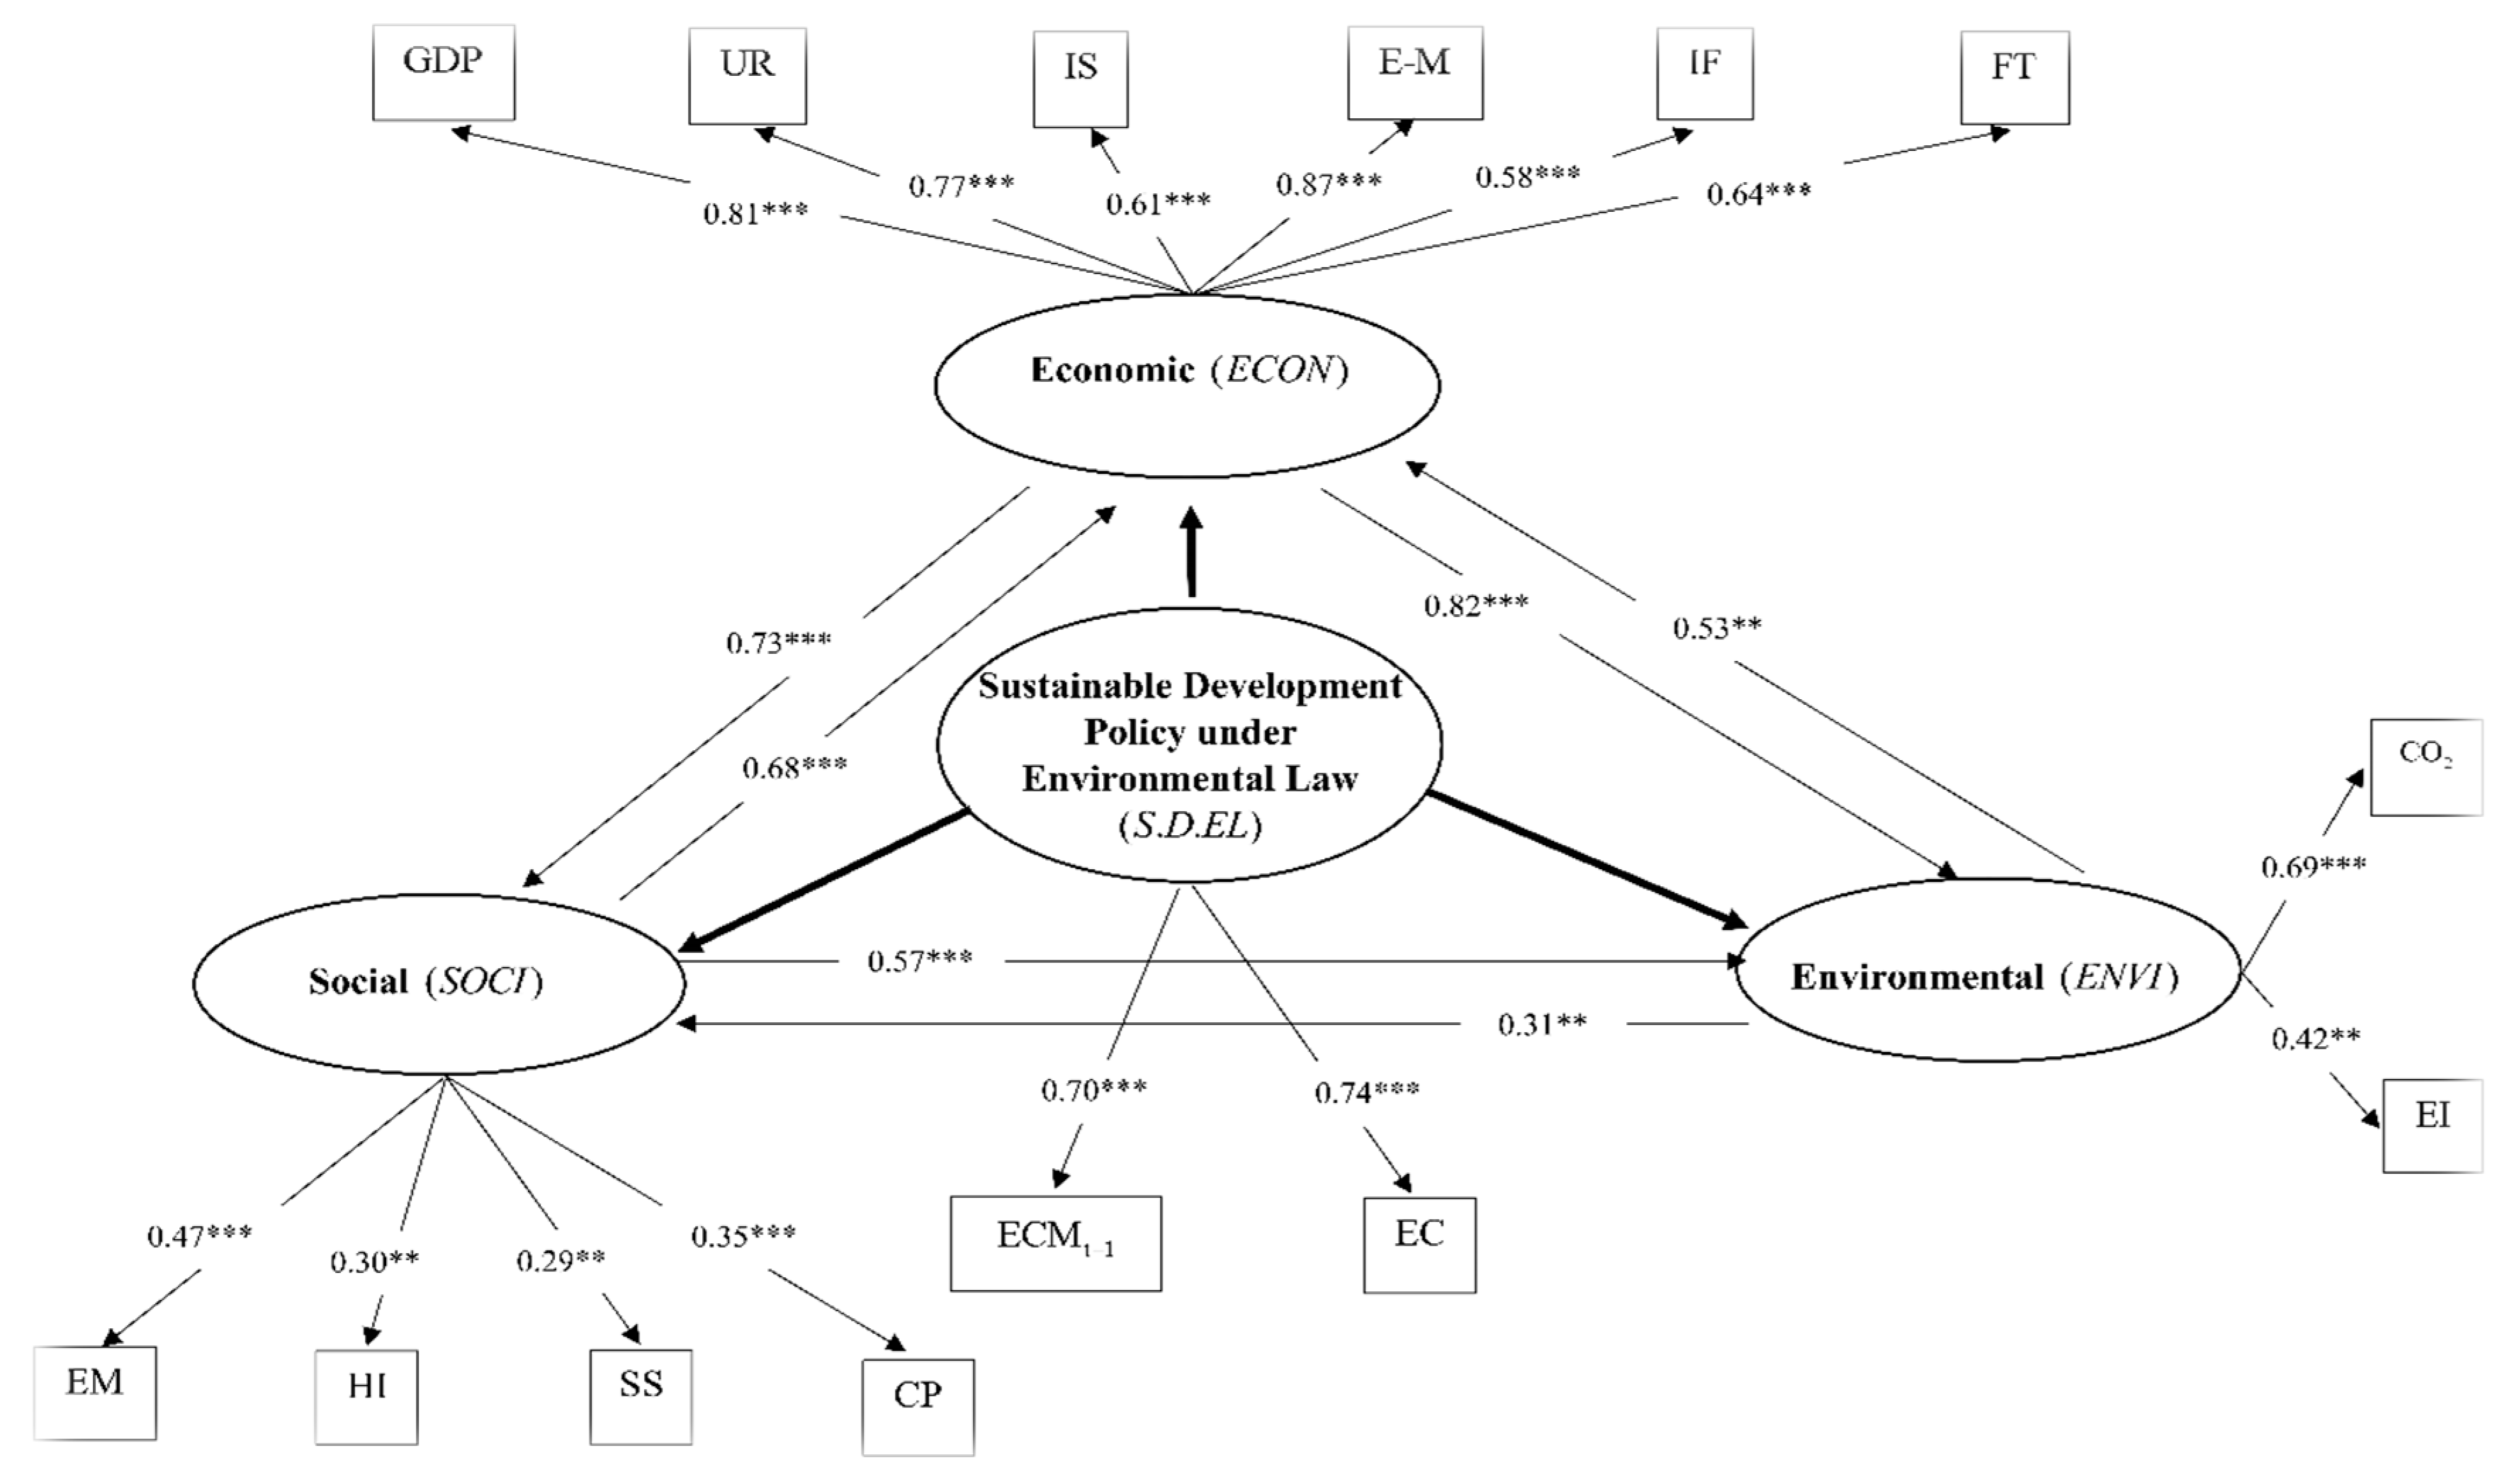
| Dependent Variables | Type of Effect | Independent Variables | |||
|---|---|---|---|---|---|
| Economic | DE | - | 0.68 *** | 0.53 ** | −0.39 *** |
| IE | - | 0.05 *** | 0.02 ** | - | |
| Social | DE | 0.73 *** | - | 0.31 ** | −0.26 *** |
| IE | - | - | 0.09 ** | - | |
| Environmental | DE | 0.82 *** | 0.57 *** | - | −0.05 *** |
| IE | 0.12 *** | 0.09 *** | - | - | |
| Forecasting Model | MAPE (%) | RMSE (%) |
|---|---|---|
| MLR model | 20.06 | 22.91 |
| BP model | 13.50 | 16.87 |
| Grey model | 12.11 | 14.48 |
| ANN model | 8.65 | 10.15 |
| ANFIS model | 6.42 | 6.89 |
| ARIMA model | 6.29 | 3.41 |
| SEM-VARIMAX model | 1.06 | 1.19 |
© 2019 by the authors. Licensee MDPI, Basel, Switzerland. This article is an open access article distributed under the terms and conditions of the Creative Commons Attribution (CC BY) license (http://creativecommons.org/licenses/by/4.0/).
Share and Cite
Sutthichaimethee, P.; Naluang, S. The Efficiency of the Sustainable Development Policy for Energy Consumption under Environmental Law in Thailand: Adapting the SEM-VARIMAX Model. Energies 2019, 12, 3092. https://doi.org/10.3390/en12163092
Sutthichaimethee P, Naluang S. The Efficiency of the Sustainable Development Policy for Energy Consumption under Environmental Law in Thailand: Adapting the SEM-VARIMAX Model. Energies. 2019; 12(16):3092. https://doi.org/10.3390/en12163092
Chicago/Turabian StyleSutthichaimethee, Pruethsan, and Sthianrapab Naluang. 2019. "The Efficiency of the Sustainable Development Policy for Energy Consumption under Environmental Law in Thailand: Adapting the SEM-VARIMAX Model" Energies 12, no. 16: 3092. https://doi.org/10.3390/en12163092
APA StyleSutthichaimethee, P., & Naluang, S. (2019). The Efficiency of the Sustainable Development Policy for Energy Consumption under Environmental Law in Thailand: Adapting the SEM-VARIMAX Model. Energies, 12(16), 3092. https://doi.org/10.3390/en12163092