Communication

Proof-of-Concept of Spent Mushrooms Compost Torrefaction—Studying the Process Kinetics and the Influence of Temperature and Duration on the Calorific Value of the Produced Biocoal

1
Faculty of Life Sciences and Technology, Institute of Agricultural Engineering, Wrocław University of Environmental and Life Sciences, 37/41 Chełmońskiego Str., 51-630 Wroclaw, Poland
2
Department of Agricultural and Biosystems Engineering, Iowa State University, Ames, IA 50011, USA
*
Author to whom correspondence should be addressed.
Energies 2019, 12(16), 3060; https://doi.org/10.3390/en12163060
Submission received: 17 July 2019 / Revised: 4 August 2019 / Accepted: 6 August 2019 / Published: 8 August 2019

Abstract

:
Poland, being the 3rd largest and growing producer of mushrooms in the world, generates almost 25% of the total European production. The generation rate of waste mushroom spent compost (MSC) amounts to 5 kg per 1 kg of mushrooms produced. We proposed the MSC treatment via torrefaction for the production of solid fuel—biocoal. In this research, we examined the MSC torrefaction kinetics using thermogravimetric analyses (TGA) and we tested the influence of torrefaction temperature within the range from 200 to 300 °C and treatment time lasting from 20 to 60 min on the resulting biocoal’s (fuel) properties. The estimated value of the torrefaction activation energy of MSC was 22.3 kJ mol−1. The highest calorific value = 17.9 MJ kg−1 d.m. was found for 280 °C (60 min torrefaction time). A significant (p < 0.05) influence of torrefaction temperature on HHV increase within the same group of torrefaction duration, i.e., 20, 40, or 60 min, was observed. The torrefaction duration significantly (p < 0.05) increased the HHV for 220 °C and decreased HHV for 300 °C. The highest mass yield (98.5%) was found for 220 °C (60 min), while the highest energy yield was found for 280 °C (60 min). In addition, estimations of the biocoal recirculation rate to maintain the heat self-sufficiency of MSC torrefaction were made. The net quantity of biocoal (torrefied MSC; 65.3% moisture content) and the 280 °C (60 min) torrefaction variant was used. The initial mass and energy balance showed that MSC torrefaction might be feasible and self-sufficient for heat when ~43.6% of produced biocoal is recirculated to supply the heat for torrefaction. Thus, we have shown a concept for an alternative utilization of abundant biowaste (MSC). This research provides a basis for alternative use of an abundant biowaste and can help charting improved, sustainable mushroom production.

1. Introduction

The production of mushrooms in Poland is growing rapidly. During 2006–2018, the production of mushrooms increased from 196 thousand Mg·year−1 to 325 thousand Mg·year−1, which currently accounts for 24.15% of the total production in the European Union (EU) [1,2]. Poland is the largest grower of mushrooms in Europe and the third in the world. One of the abundant wastes arising during the cultivation of mushrooms is a worn-out substrate—mushroom spent compost (MSC)—which accounts to ~5 kg of MSC per 1 kg of produced mushrooms [3]. This amounts to 5.6 and 1.6 million Mg·year−1 of MSC, in the EU and Poland, respectively [1,4].
The sustainable management of MSC is an important issue for the industry. The MSC is currently considered as an ‘industrial waste’ (020199 code, according to European Waste Classification), which is classified as wastes from agriculture [5]. Potential waste treatment methods depend on MSC properties. For example, a white mushroom (Agaricus bisporus) is grown on a bedding consisting mainly of straw and poultry manure. The manure also contains gypsum, urea, peat, coconut, and soy proteins [6]. The mushroom production cycle takes about 6 to 8 weeks on this bedding with three harvestings of mushrooms. After this period, the MSC cannot be regenerated and used again for production. It is a waste which needs to be treated [7]. The MSC is a source of biogenic elements, such as C, N, P, K, and S (Table 1). The low level of heavy metals content allows the MSC to be considered as an organic fertilizer [8]. In addition, the MSC also contains a residual fraction of organic compounds, humic and fulvic acids, fraction decalcification, and bitumen [7]. An overview of the properties of the MSC is presented in Table 1.
Thus far, various methods for MSC management have been developed and used. Those methods were aimed to obtain compost, bioethanol, biogas, enzyme lactase, xylooligosaccharides, or hydrogen. The most popular use of MSC is composting due to its organic nature and balanced ratio of C/N 12.3–18:1 (Table 1). The work of Kalembasa et al. [7] showed that compost from MSC could be an excellent fertilizer for improving soil structure. However, research to date shows some concerns as well [13]. For example, compost from MSC can be highly variable and does not always meet the legal criteria for a fertilizer [8]. This is due to the high variability of the compost parameters such as N, P, and K, biogenic elements, C/N ratio, pH, electrolytic conductivity, and the Ca, Na, Mg, Cu, Fe, Zn, Mn, Cr, Cd, Pb, and Ni content. The share and content of hemicellulose, cellulose, and lignin can also vary [14]. Thus, the variable MSC composition may cause technological problems of the process and heterogeneity of the obtained fertilizer quality.
Bioethanol production from MSC can be facilitated via hydrolysis with acids or bases, physical treatment using steam followed by fermentation. The difficulty comes from high lignin content. Steam explosion is used for delignification (the breakdown of lignin structures) into simpler cellulose. The literature shows that the highest potential of conversion of MSC to bioethanol requires 20 bar steam pressure [15]. Research on MSC hydrolysis with the addition of surfactants was published [16].
The MSC may also be a source of valuable substances. During the hydrothermal conversion of MSC rich in nutrients (e.g., proteins), production of xylooligosaccharides may be possible [17,18]. Thanks to the high purity of the obtained product, this process has industrial potential [15]. The MSC may also be an efficient source of lactase enzyme, which is widely used in paper, clothing, and food production [4].
Biogas production is also feasible. However, it has been found that this process is not as effective as fermentation of other biomass. Anaerobic fermentation of MSC generates ~122 dm3·kg−1 d.m. of biomethane, while corn silage can produce 320 dm3·kg−1 d.m. [19]. The biogas yield from other available substrates: cattle manure (324 ± 15.5 dm3·kg–1 d.m.), corn silage (653 ± 28.8 dm3·kg–1 d.m.), waste fruit and vegetables (678 ± 15.8 dm3·kg–1 d.m.), sugar beet pulp (634 ± 235 dm3·kg–1 d.m.), whey (736 ± 15.5 dm3·kg–1 d.m.) [20], shows that biogas production from MSC is not competitive enough. Another interesting use of MSC is the production of hydrogen, which has already been tested at the lab-scale. Two-step hydrolysis with acid and base resulted in 2.52 moles of H2·g COD−1 [21].
Law regulations regarding the management of waste from mushroom production allow using MSC for energy purposes [22]. The 2009/28/WE (23 April 2009) [23] indicates the possibility of considering the MSC as biomass, and in consequence, the energy produced from MSC as energy from a renewable source. However, due to the high moisture, MSC is considered as fuel with low calorific value (Table 1) [24]. The MSC, with approximately 70% moisture, has an LHV of ~4.6 MJ·kg−1 d.m. [3]. MSC’s characteristics (Table 1) do not indicate high profitability of the incineration process [25].
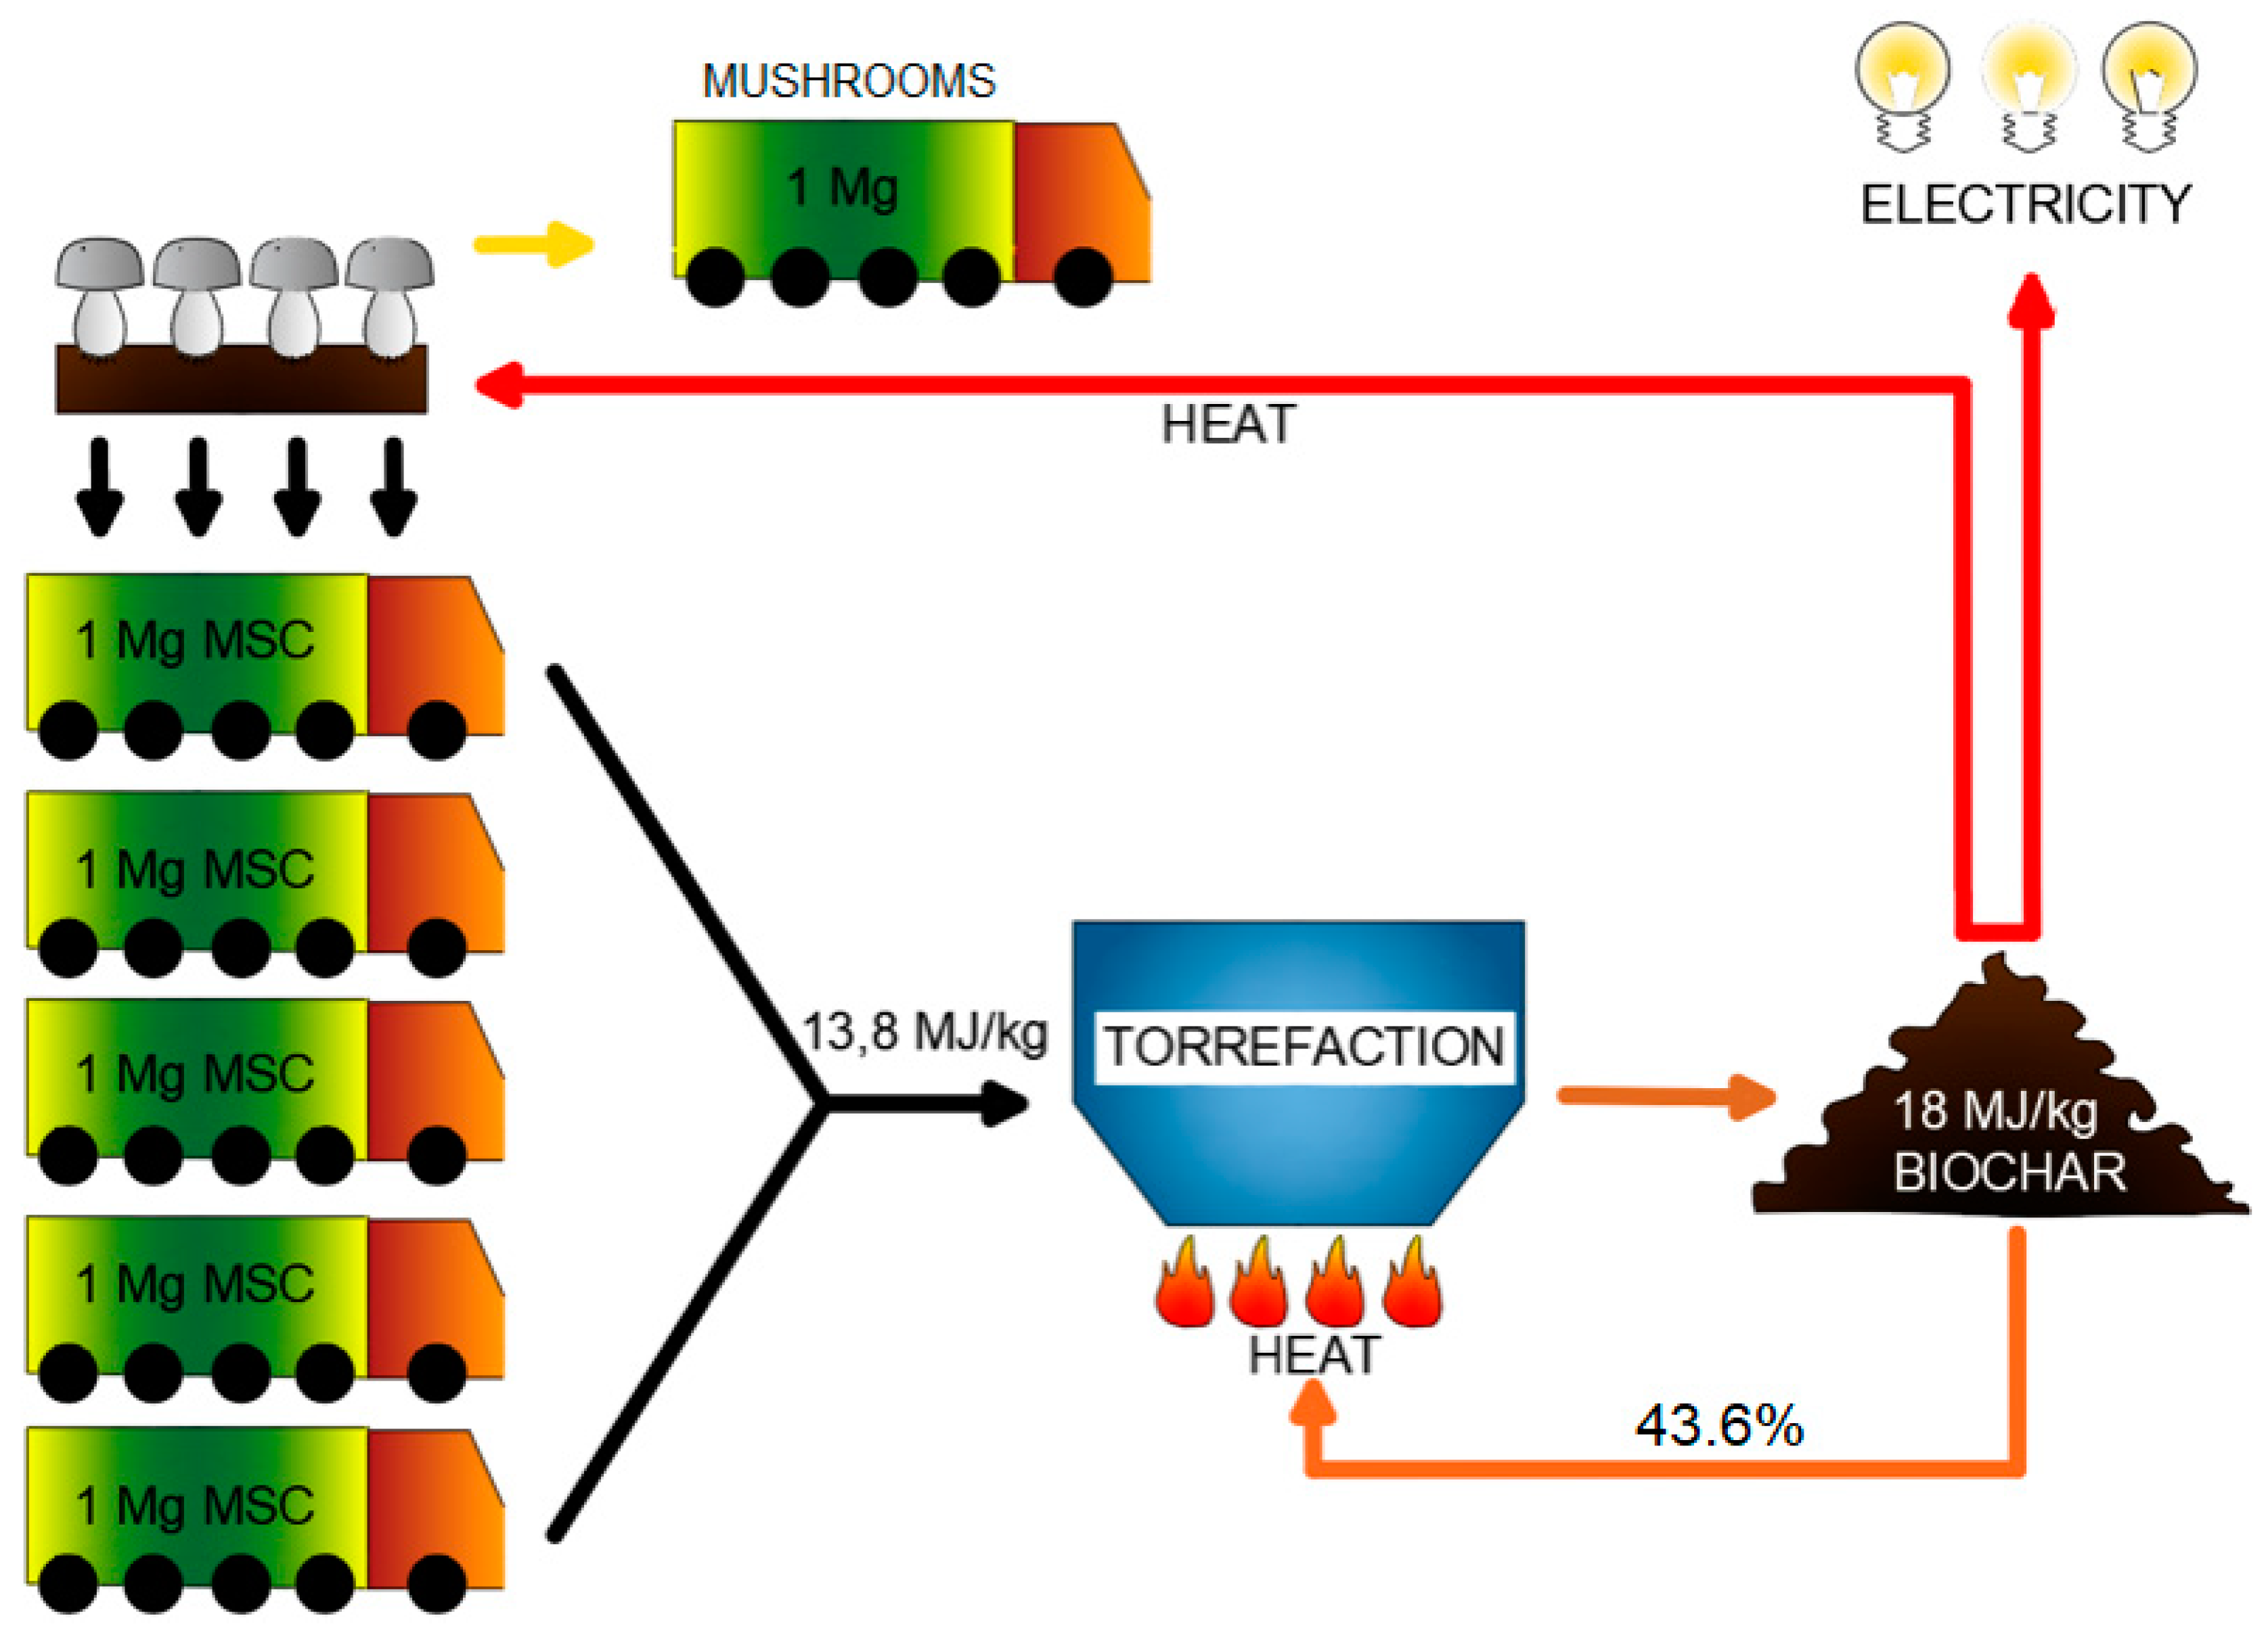
We propose to convert the MSC into a more efficient solid fuel, according to the ‘Waste to Carbon’ approach [26] (Figure 1). One of the ways of MSC conversion is the process of torrefaction, otherwise known as high-temperature drying, low-temperature pyrolysis, or biomass ‘roasting’. It consists of roasting the organic compounds of plant origin out of a substance [27]. Torrefaction is characterized by the range of temperatures 200–300 °C [28], while according to the act on renewable sources energy [29], the temperature range is 200–320 °C. The residence (process) time of torrefaction depends on the water or volatile content, as well as the type of reactor or substrate type [30]. The residence time usually does not exceed 60 min. The products of torrefaction are solid biocoal and gas (‘torgas’). Torgas consists of nonflammable substances such as water or CO2 and flammable substances such as CO, CH4, or H2 [31]. Depending on process parameters and properties of the substrate, a different ratio of flammable to noncombustible parts may be achieved [28]. The torgas is not an attractive product of torrefaction due to the high content of nonflammable substances [32,33].
The main product of the torrefaction, biocoal, according to Polish regulations, should have LHV not less than 21 MJ·kg−1 d.m. and the feedstock should be from solid biomass/waste of vegetable, animal, or biodegradable origin to be considered as a ‘renewable source of energy’ [29].
During the torrefaction process, the loss of mass, as well as the loss of chemical energy from raw material, is observed. However, the degree of mass loss is between 30 and 40%, while the energy content drop does not exceed 10%. Due to this difference, energy densification in solid fuels occurs [28]. However, the bulk density of the product is increasing, which positively affects the logistics of fuel [25] transport. Torrefaction increases the C content in the biocoal, which improves its calorific value. The product also becomes more homogenous. This affects the further thermal transformation of biocoal as a fuel. Because the abrasiveness is reduced, the mechanical grinding requires less energy compared to the raw substrate. There is also a possibility of pelletization of biocoal from torrefaction [34]. Additionally, the ratios of H/C and O/C are reduced, which improves the fuel properties of the biocoal in relation to the used substrate [35,36].
Torrefaction of waste is a growing research area. Examples include fractions of industrial and municipal wastes [27,37], sewage sludge [38], brewers’ spent grain [39], Oxytree biomass [40] prunings, woodchips, olives waste, and Virginia mallow (considered as a potential energy crop) [22]. High-quality fuels can be obtained due to the torrefaction process. Therefore, it is necessary to carry out research on new substrates, aimed to optimize the torrefaction process to obtain the highest calorific value. For torrefaction optimization, it is necessary to determine the appropriate temperature and residence time for a given substrate to achieve the most beneficial fuel parameters [25,41].
The MSC is a new substrate which has not yet been tested for its conversion to solid fuel during the torrefaction process. The torrefaction of MSC and reusing part of the heat from biocoal combustion for torrefaction energy demand and MSC farm energy demand is at the early stage of technology readiness. Therefore, the aim of this study was the determination of the MSC torrefaction process kinetics parameters and the preliminary selection of technological parameters under which biocoal with the highest calorific value may be obtained. This article presents pioneering, novel research as a proof-of-concept of a new technology of MSC reuse, by conversion to high-quality solid fuel, which may be internally reused to achieve heat self-sufficiency (Figure 1).

2. Materials and Methods

2.1. The Properties of MSC

The samples of MSC originated from a mushroom farm in Gogołowo, Poland. According to Dudek et al. [39], MSC samples were first dried for 24 h in a WAMED lab dryer (KBC-65W, Warsaw, Poland) under the temperature of 105 °C. Then, dry MSC sample was ground through a 0.1 mm screen. For grinding, the laboratory knife mill TESTCHEM, model LMN-100 (Pszów, Poland), was used. The raw biomass of MSC was characterized by the determination of moisture content, volatile solids (VS) content, ash content, and higher heating value (HHV) (Table 2).

2.2. MSC Torrefaction Kinetics Measurements

The thermogravimetric analysis (TGA) of the MSC torrefaction was done according to the methodology given by Pulka et al. [38]. To obtain an atmosphere without oxygen, CO2 was injected with a flow rate of 0.6 mL·min−1. The tested sample of MSC was located inside the cuvette and placed in the center of the reactor. The cuvette containing the sample was combined with a precise (0.01 g resolution) electronic balance for the determination of the mass drop during the process. The readings (temperature, and mass of the sample) were recorded by PC. Dried samples with a mass of 2.25 g were treated under temperatures in the range from 200 to 300 °C (with an interval of 20 °C) for up to 60 min. The chosen temperatures were in the range of the torrefaction previously used by Bialowiec et al. [37]. The torrefaction rate constant (k) was determined using the first-order equation [42]:
M s = M s 0 × e x p k × t
l n M s 0 / M s = k × t
where: M s 0 = initial MSC mass, g, M s = mass after time t, g, k = torrefaction rate constant, s−1, t = time, s.
The Arrhenius equation expresses the relationship between k and temperature (T):
k ( T ) = A e x p E a / R T
and it may be given in the logarithmic form:
l n k ( T ) = l n A E a / R T
where: A = frequency factor; E a = activation energy; J·mol−1; R = gas constant, 8.314, J·(mol·K)−1; T = temperature, K.
Ea was determined with the application of k and the Arrhenius equation, with the assumption that ln(k) is a linear function of 1/T:
y = a x + b
where: y = l n ( k ) , b = l n A , a = E a / R .

2.3. MSC Torrefaction and Torrefied Biomass Generation

MSC torrefaction was executed in accordance with Syguła et al. [43] in a muffle furnace, which is capable of maintaining heating rate, the desired temperature for the desired time, and has a current temperature indication (thermocouple) inside the furnace (SNOL 8.1/1100, Utena, Lithuania). CO2 with the flow rate of 10 dm3·h−1 was used to establish oxygen-free conditions. The process was carried out under temperatures from 200 °C to 300 °C with intervals of 20 °C. For each temperature, torrefaction was carried out with 20, 40, and 60 min retention time. The samples were heated with a heating rate of 50 °C·min−1 from 20 °C to the torrefaction setpoint temperature. Ten grams (± 0.5 g) of the dry mass of the sample was used for the tests. The biocoals were removed from the muffle furnace when the interior temperature was lower than 200 °C (temperature was monitored by an internal thermocouple and visualized on the screen of the furnace). The approximate times of cooling from 300 °C, 280 °C, 260 °C, 240 °C, and 220 °C to 200 °C were 38, 33, 29, 23, and 13.5 min, respectively. The approximate cooling time from 300 °C to room temperature (~20 °C) was around 6 h. Analyses of three replicates were carried out.
Mass yield, energy densification ratio, and energy yield were determined based on Equations (6)–(8) [44].
M a s s   y i e l d = M a s s   o f   d r y   b i o c h a r   M a s s   o f   d r i e d   r a w   M S C · 100
E n e r g y   d e n s i f i c a t i o n   r a t i o = H H V   o f   b i o c h a r   H H V   o f   r a w   M S C
E n e r g y   y i e l d = m a s s   y i e l d · e n e r g y   d e n s i f i c a t i o n   r a t i o
where:
  • Mass of dry biocoal—mass of (dry) biocoal after the process of torrefaction, g;
  • Mass of dried raw MSC—dried mass of MSC used in the process of torrefaction, g;
  • 100—conversion to percent;
  • HHV of biocoal—higher heating value of biocoal after the process of torrefaction, J∙g−1;
  • HHV of raw MSC—higher heating value of dried MSC (raw material) used for torrefaction, J∙g−1.

2.4. Proximate Analysis

The samples were tested in three replicates for:
  • Moisture content, determined in accordance with [45], by means of the lab dryer (WAMED, KBC-65W, Warsaw, Poland) (Raw MSC and biocoals).
  • Volatile solids, determined in accordance with [46], by means of the SNOL 8.1/1100 lab muffle furnace (Utena, Lithuania) (Raw MSC).
  • Ash content, determined in accordance with [47], by means of the SNOL 8.1/1100 lab muffle furnace (Utena, Lithuania) (Raw MSC).
  • High heating value (HHV), determined in accordance with [48], by means of the IKA C2000 calorimeter (Raw MSC and biocoals).
The obtained data are presented in our previous article [43] and detailed in the Supplementary Material file “MSC torrefaction data.xlsx”. The data article contains the results of the raw MSC and obtained biocoal’s fuel properties and TGA analysis.

2.5. Torrefaction Process Models

Polynomial functions describing the influence of torrefaction temperature and its duration on mass yield and energy yield of the torrefaction process and the higher heating value of biocoal were built using the raw data [43]. The model parameters were estimated by nonlinear regression analysis. Regression analysis used a two-degree polynomial with a general form, with intercept (a1) and five regression coefficients (a2–6) (Equation (9)).
f ( T , t ) = a 1 + a 2 · T + a 3 · T 2 + a 4 · t + a 5 · t 2 + a 6 · T · t
where:
  • f (T,t)—the biocoal property obtained under T—temperature, and t—residence time conditions,
  • a1—intercept (-),
  • a2-6—regression coefficient (-),
  • T—temperature, T = 200–300 °C,
  • t—residence time, t = 0–60 min.
The regression analysis was done with the software Statistica 13 (StatSoft, Inc., TIBCO Software Inc. Palo Alto, CA, USA). For the determination of model parameters and the degree of matching to raw data, the determination coefficient (R2) was calculated.

2.6. Torrefaction Mass and Energy Balance Evaluation

Based on the results and using the best variant (T and t), a simple model [49] was proposed for estimating the possibility of obtaining the heat self-sufficiency of biocoal production. The model also calculates the theoretical mass yield after biocoal recirculation of the torrefied biomass to maintain the torrefaction process itself (biocoal recirculation—Figure 1).
Data for calculations:
  • mass of MSC, Mg, assumed 1 Mg,
  • moisture content of MSC, %, assumed 65.32% (Table 2),
  • torrefaction parameters of temperature and time assumed 280 °C and 60 min, respectively.
Main properties of torrefied biomass calculations:
Mass yield (MY) of torrefaction was used for calculation of mass of torrefied biomass after torrefaction:
m t b = m r d · M Y
where:
  • mtb—mass of torrefied MSC after torrefaction process at T, and t conditions, kg, MY—mass yield of biocoal, %/%, mrd—dry mass of MSC, kg.
HHV of torrefied MSC was based on Figure 2. The chemical energy in torrefied MSC:
E t b = m t b · H H V
where:
  • Etb—chemical energy in torrefied biomass, kJ.
Heat need for torrefaction process:
Data for calculations [49]:
  • Ta—ambient temperature, °C, assumed 15 °C,
  • Tb—boiling point of water, 100 °C,
  • latent heat of the vaporization of water, 2500 kJ·kg−1 [50],
  • water specific heat, 4.18 kJ·kg−1 [51],
  • wood specific heat (assumed for these calculations), kJ·kg−1, assumed 1.6 kJ·kg−1 [51].
The heat needed to heat water contained in MSC:
E w = m w · C p w a t e r · ( T b T a )
where:
  • Ew—heat needed to heat water contained in MSC, kJ
  • Cpwater—water specific heat, 4.18 kJ·kg−1,
  • mw—mass of water in MSC, Mg.
The heat needed to water vaporization:
E e v = m w · L h
where:
  • Eev—heat needed to vaporization of water contained in MSC, kJ
  • Lh—latent heat of water vaporization, kJ·kg−1.
The heat needed to heat MSC during torrefaction:
E h w = m r d · C p w o o d · ( T T a )
where:
  • Ehw—heat needed to heat MSC from ambient to torrefaction temperature, kJ
  • Cpwood—specific heat of wood (assumed for these calculations), kJ·kg−1.
Total heat needed to torrefied 1 MG of MSC:
E = E w + E e v + E h w
where:
  • E—heat needed to torrefied MSC
Estimation of the biocoal recirculation rate to obtain heat self-sufficiency of MSC torrefaction
It has been assumed that the boiler and torrefaction unit heat exchange efficiency is 80%. Therefore, the practical heat demand for torrefaction of 1 Mg of MSC Ep may be calculated:
E p = E · 100 % 80 %
Therefore, the biocoal recirculation rate should be:
μ e = E p E t b
where:
  • μe—the biocoal recirculation rate to obtain the heat self-sufficiency.

3. Results

The k values significantly (p < 0.05) increased with the temperature of the torrefaction process. The lowest k value was recorded at 200 °C (k = 1.7 × 10⁻⁵ s−1) and the highest (k = 4.6 × 10⁻⁵ s−1) at 300 °C (Table 3). Similar dependence was confirmed by Dhanavath et al. [52]. However, the increase in k in relation to torrefaction temperature was not linear. Significant (p < 0.05) differences between the k values observed for 300 °C and the values obtained in temperatures between 200 and 260 °C; however, no significant increase between 200 °C and 260 °C was observed (Table A1). Torrefaction at 280 °C caused a significant increase of the k value in comparison to 200 °C. The results indicate that the temperature must be >280 °C to achieve significant acceleration of the torrefaction process.
Similar to [53,54], we estimated the activation energy for the whole torrefaction process. On the base of estimated k values, the activation energy of MSC torrefaction, reaching about 22.3 kJ·mol−1, was determined (Table 3). The obtained Ea value is low in comparison with typical woody biomass, where, for example, for beech and spruce, these values are 150 and 155 kJ·mol−1, respectively [55], for willow from 46 to 152 kJ·mol−1, [56] pine 131 kJ·mol−1, and fir 128 kJ·mol−1 [57]. However, these values have been determined by different methods and models. The model used in the present work had a global first-order character, as it was part of the preliminary study. This model allows estimating solid mass yield at a specific temperature and time of the process. Because of the high ash content in MSC and the narrow range of used temperatures, we recommend additional experiments on the kinetics of the process, using more complex models based on first-order kinetics with distributed activation energy models (DAEMs), pseudokinetics, or multicomponent first-order kinetic models.
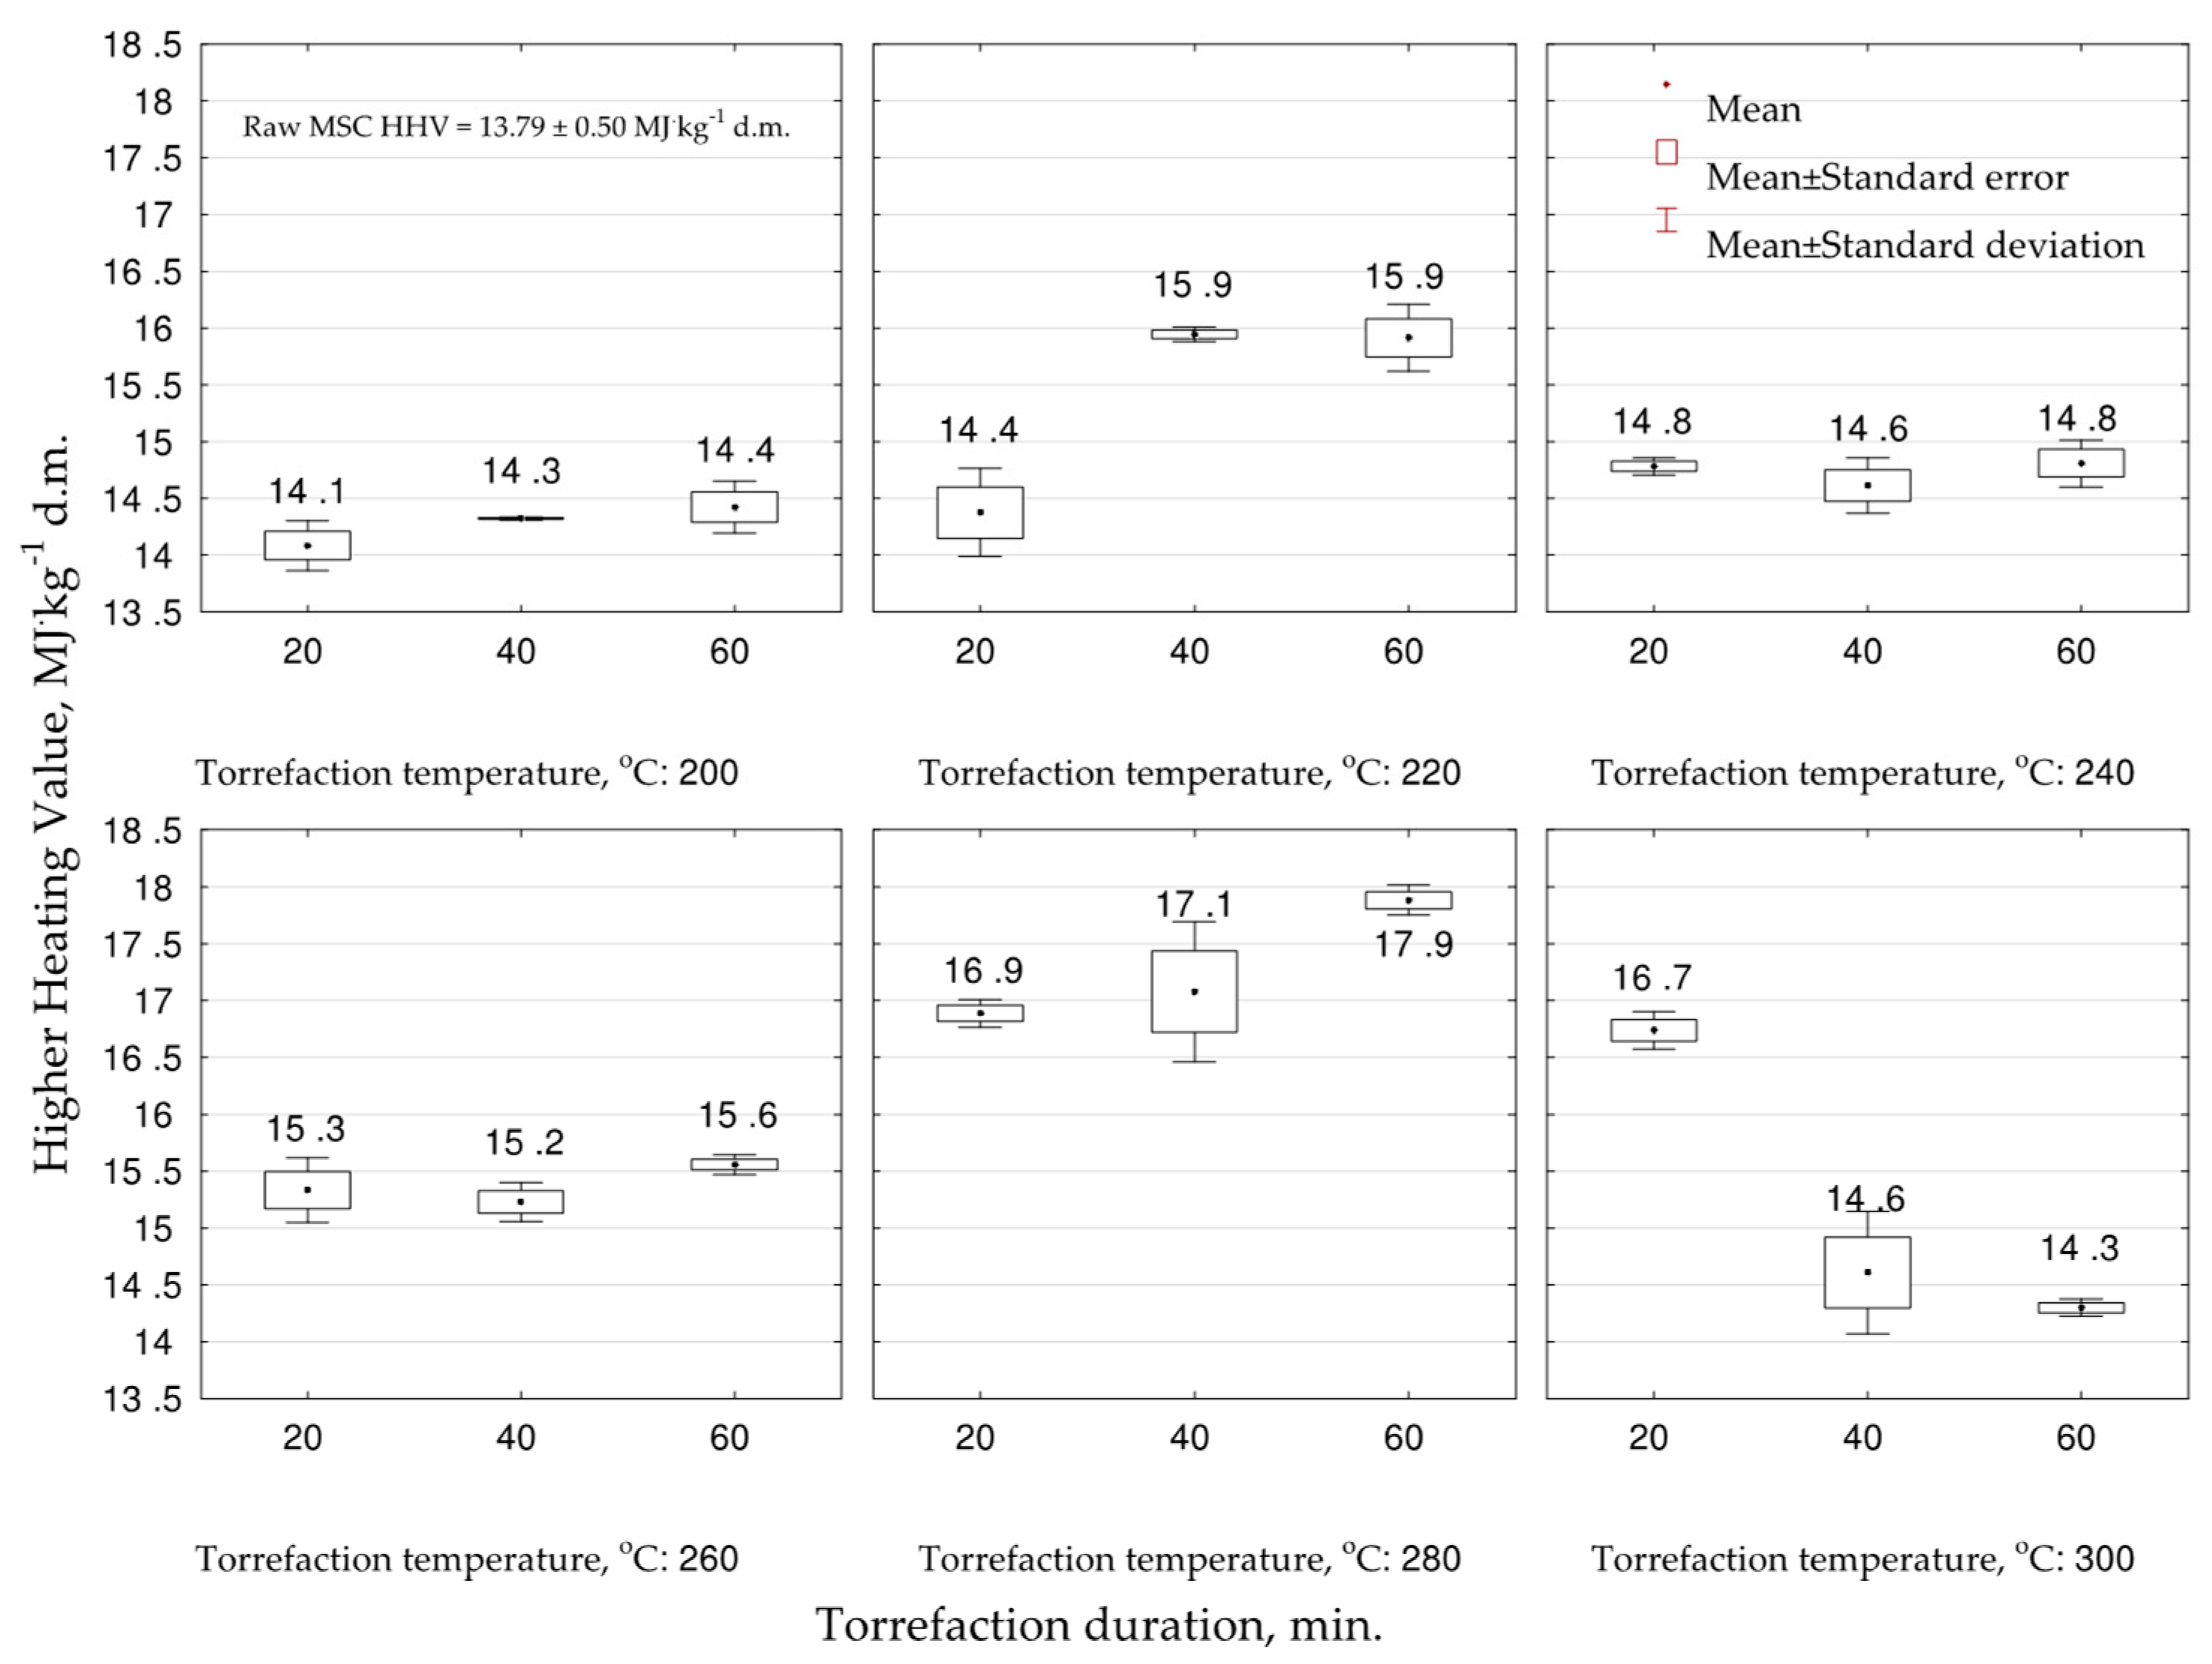
The experiment showed that the HHV increased due to torrefaction in all studied variants in comparison to raw MSC biomass (13.7 MJ·kg−1 d.m.) (Figure 2). The significantly (p < 0.05) lowest values were noted for temperature 200 °C (all durations) from 14.1 to 14.4 MJ·kg−1 d.m. The best (p < 0.05) fuel properties were noted for biocoals obtained from MSC under 280 °C 16.9–17.9 MJ·kg−1 d.m. In the case of 220 °C, a significant (p < 0.05) influence of torrefaction duration on the increase of HHV was noted (Table A2). On the other hand, the increase of torrefaction time decreased (p < 0.05) the HHV under the temperature of 300 °C, which could be related to organic matter volatilization and mineralization. Additionally, the increase of the temperature from 200 to 280 °C, for the same duration, increased (p < 0.05) the HHV (Figure 2, Table A2). The experiment showed that to achieve the highest HHV of the biocoal, MSC should be torrefied under the temperature of 280 °C for a duration of 60 min.
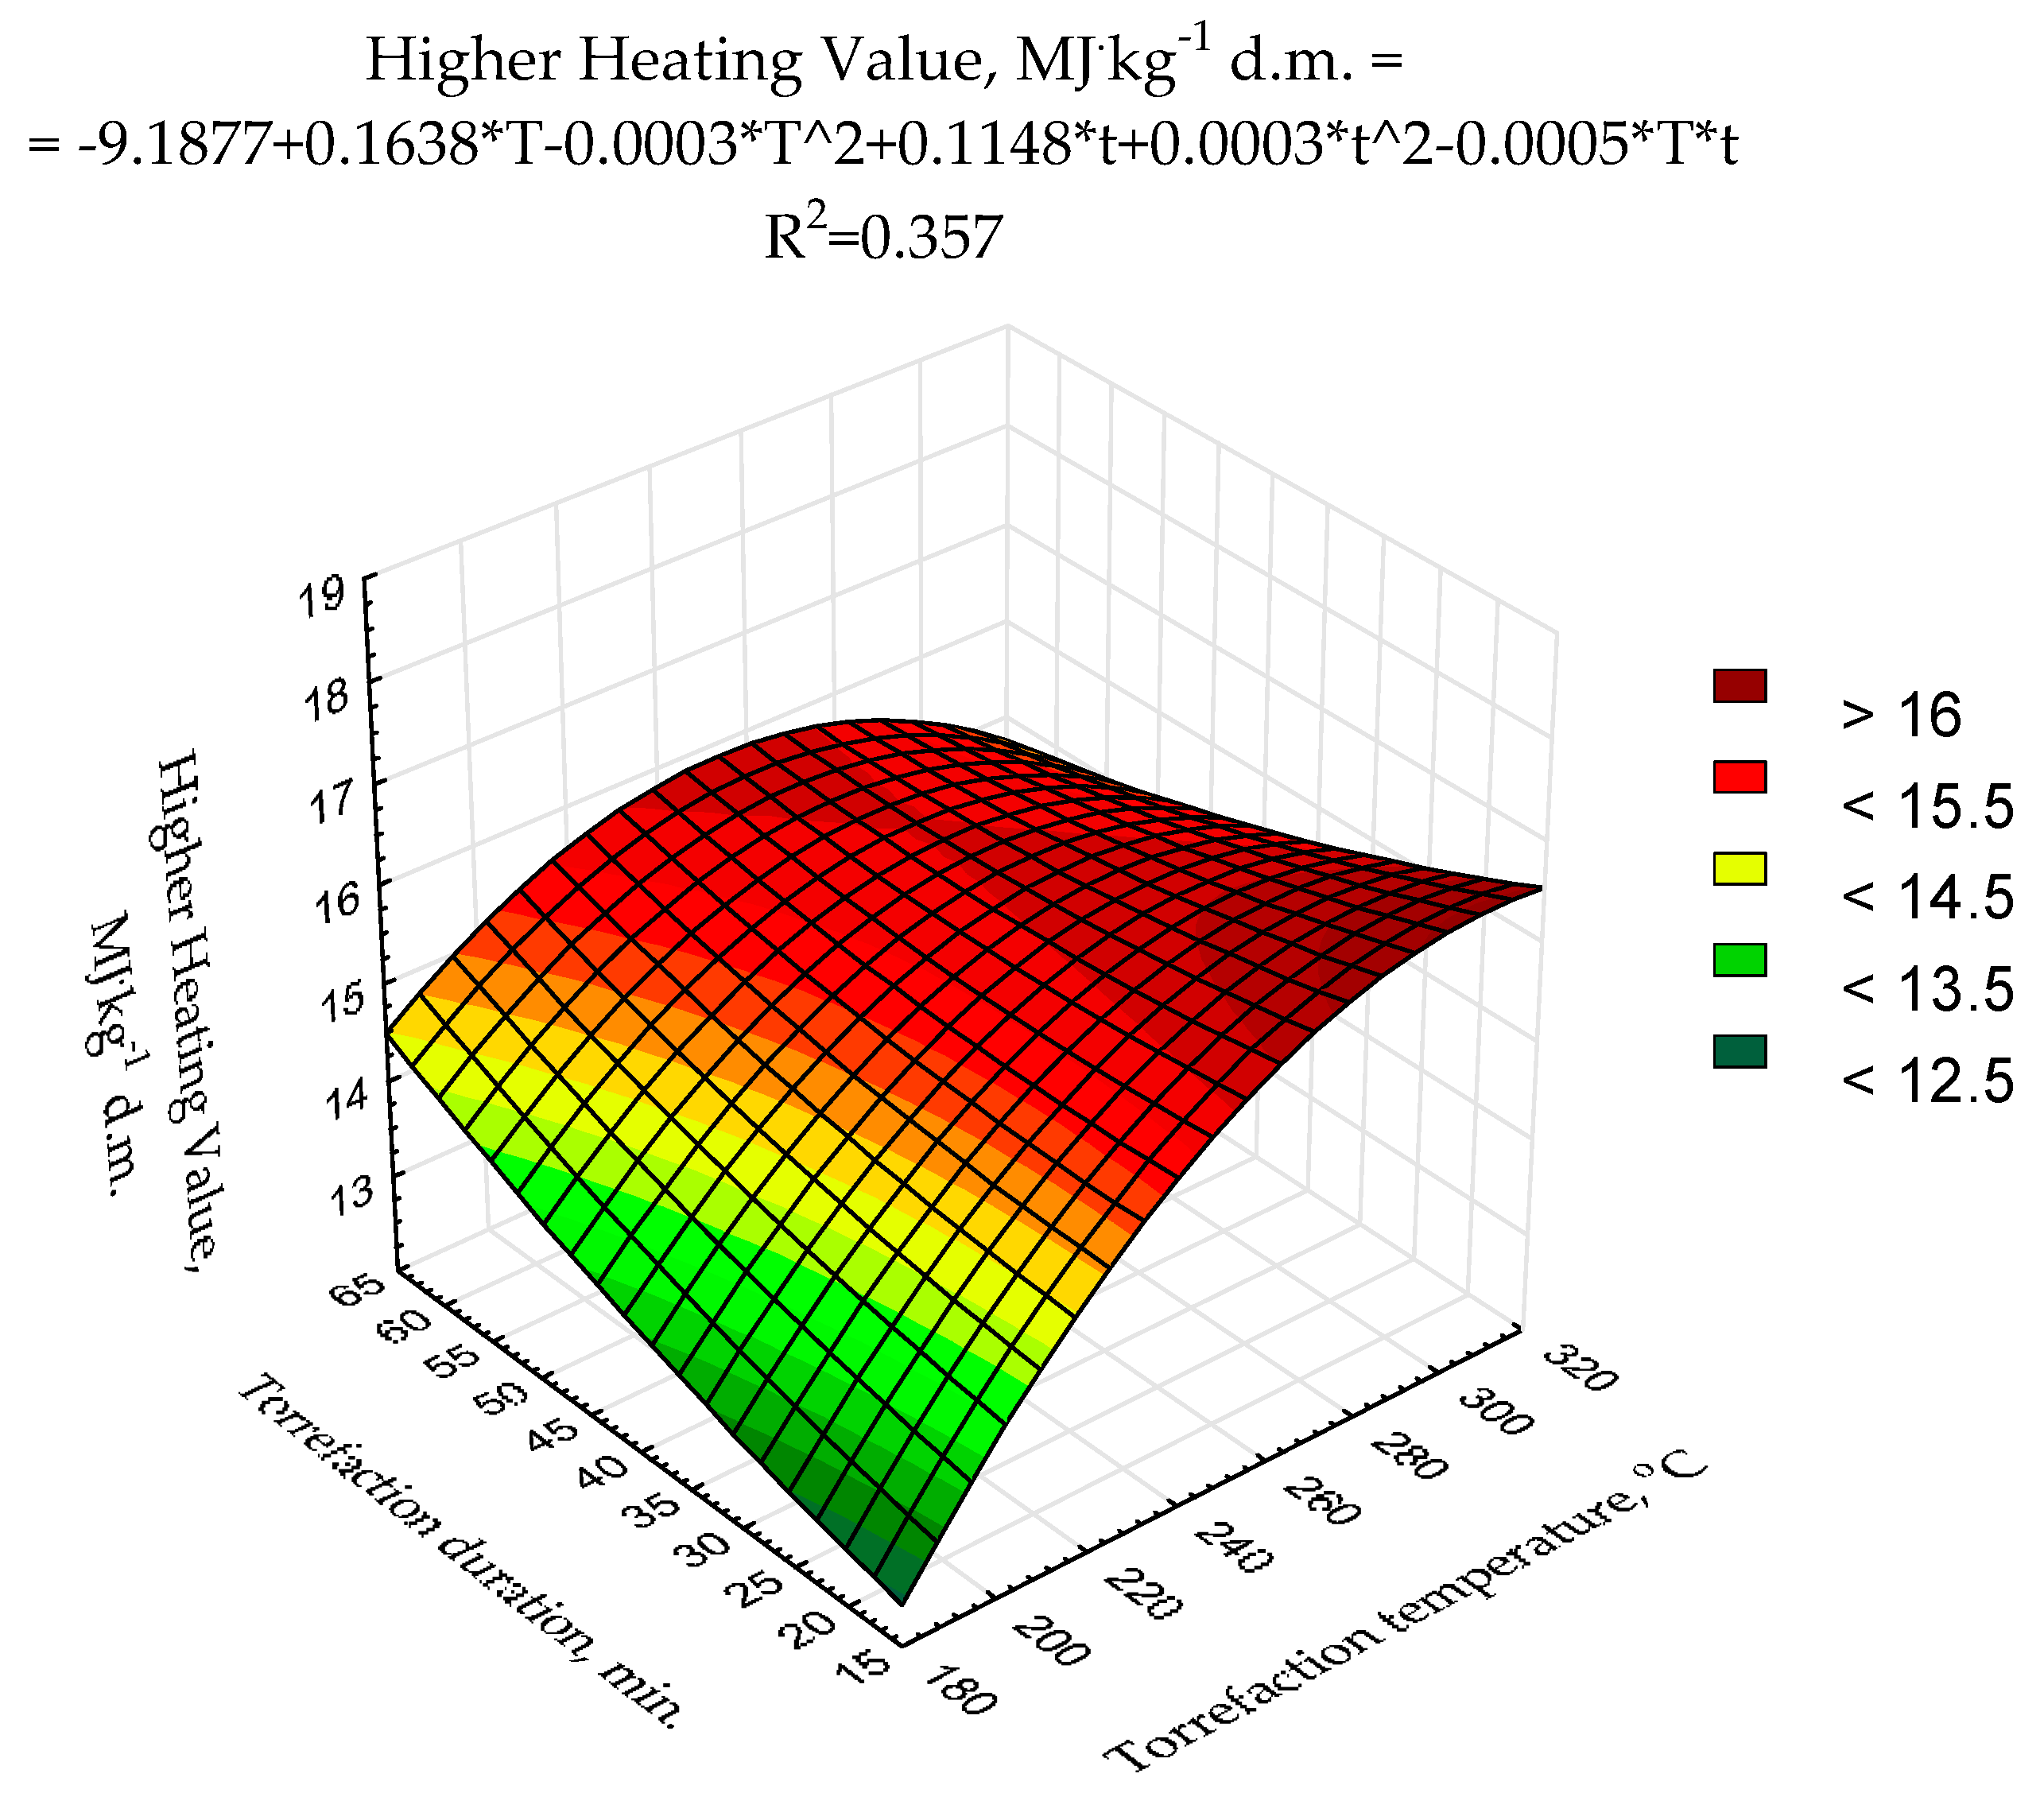
The second-degree polynomial model of torrefaction temperature and duration influence on HHV was proposed (Figure 3) using raw data presented previously [43]. The statistical evaluation showed that the determination coefficient was relatively low (0.357) (Figure 3) and only two model regression coefficients (a3, and a6) were statistically significant (p < 0.05) (Table A3). Such a low fitting degree of the model parameters to existing data could be due to a relatively low number of repetitions (n = 3 for each variant) and/or a low degree of the polynomial. To achieve better results suitable for MSC torrefaction optimization, more sophisticated research with a higher number of repetitions (to reduce the degree of the heterogeneity of the results) with the application of better-fitting models is required.
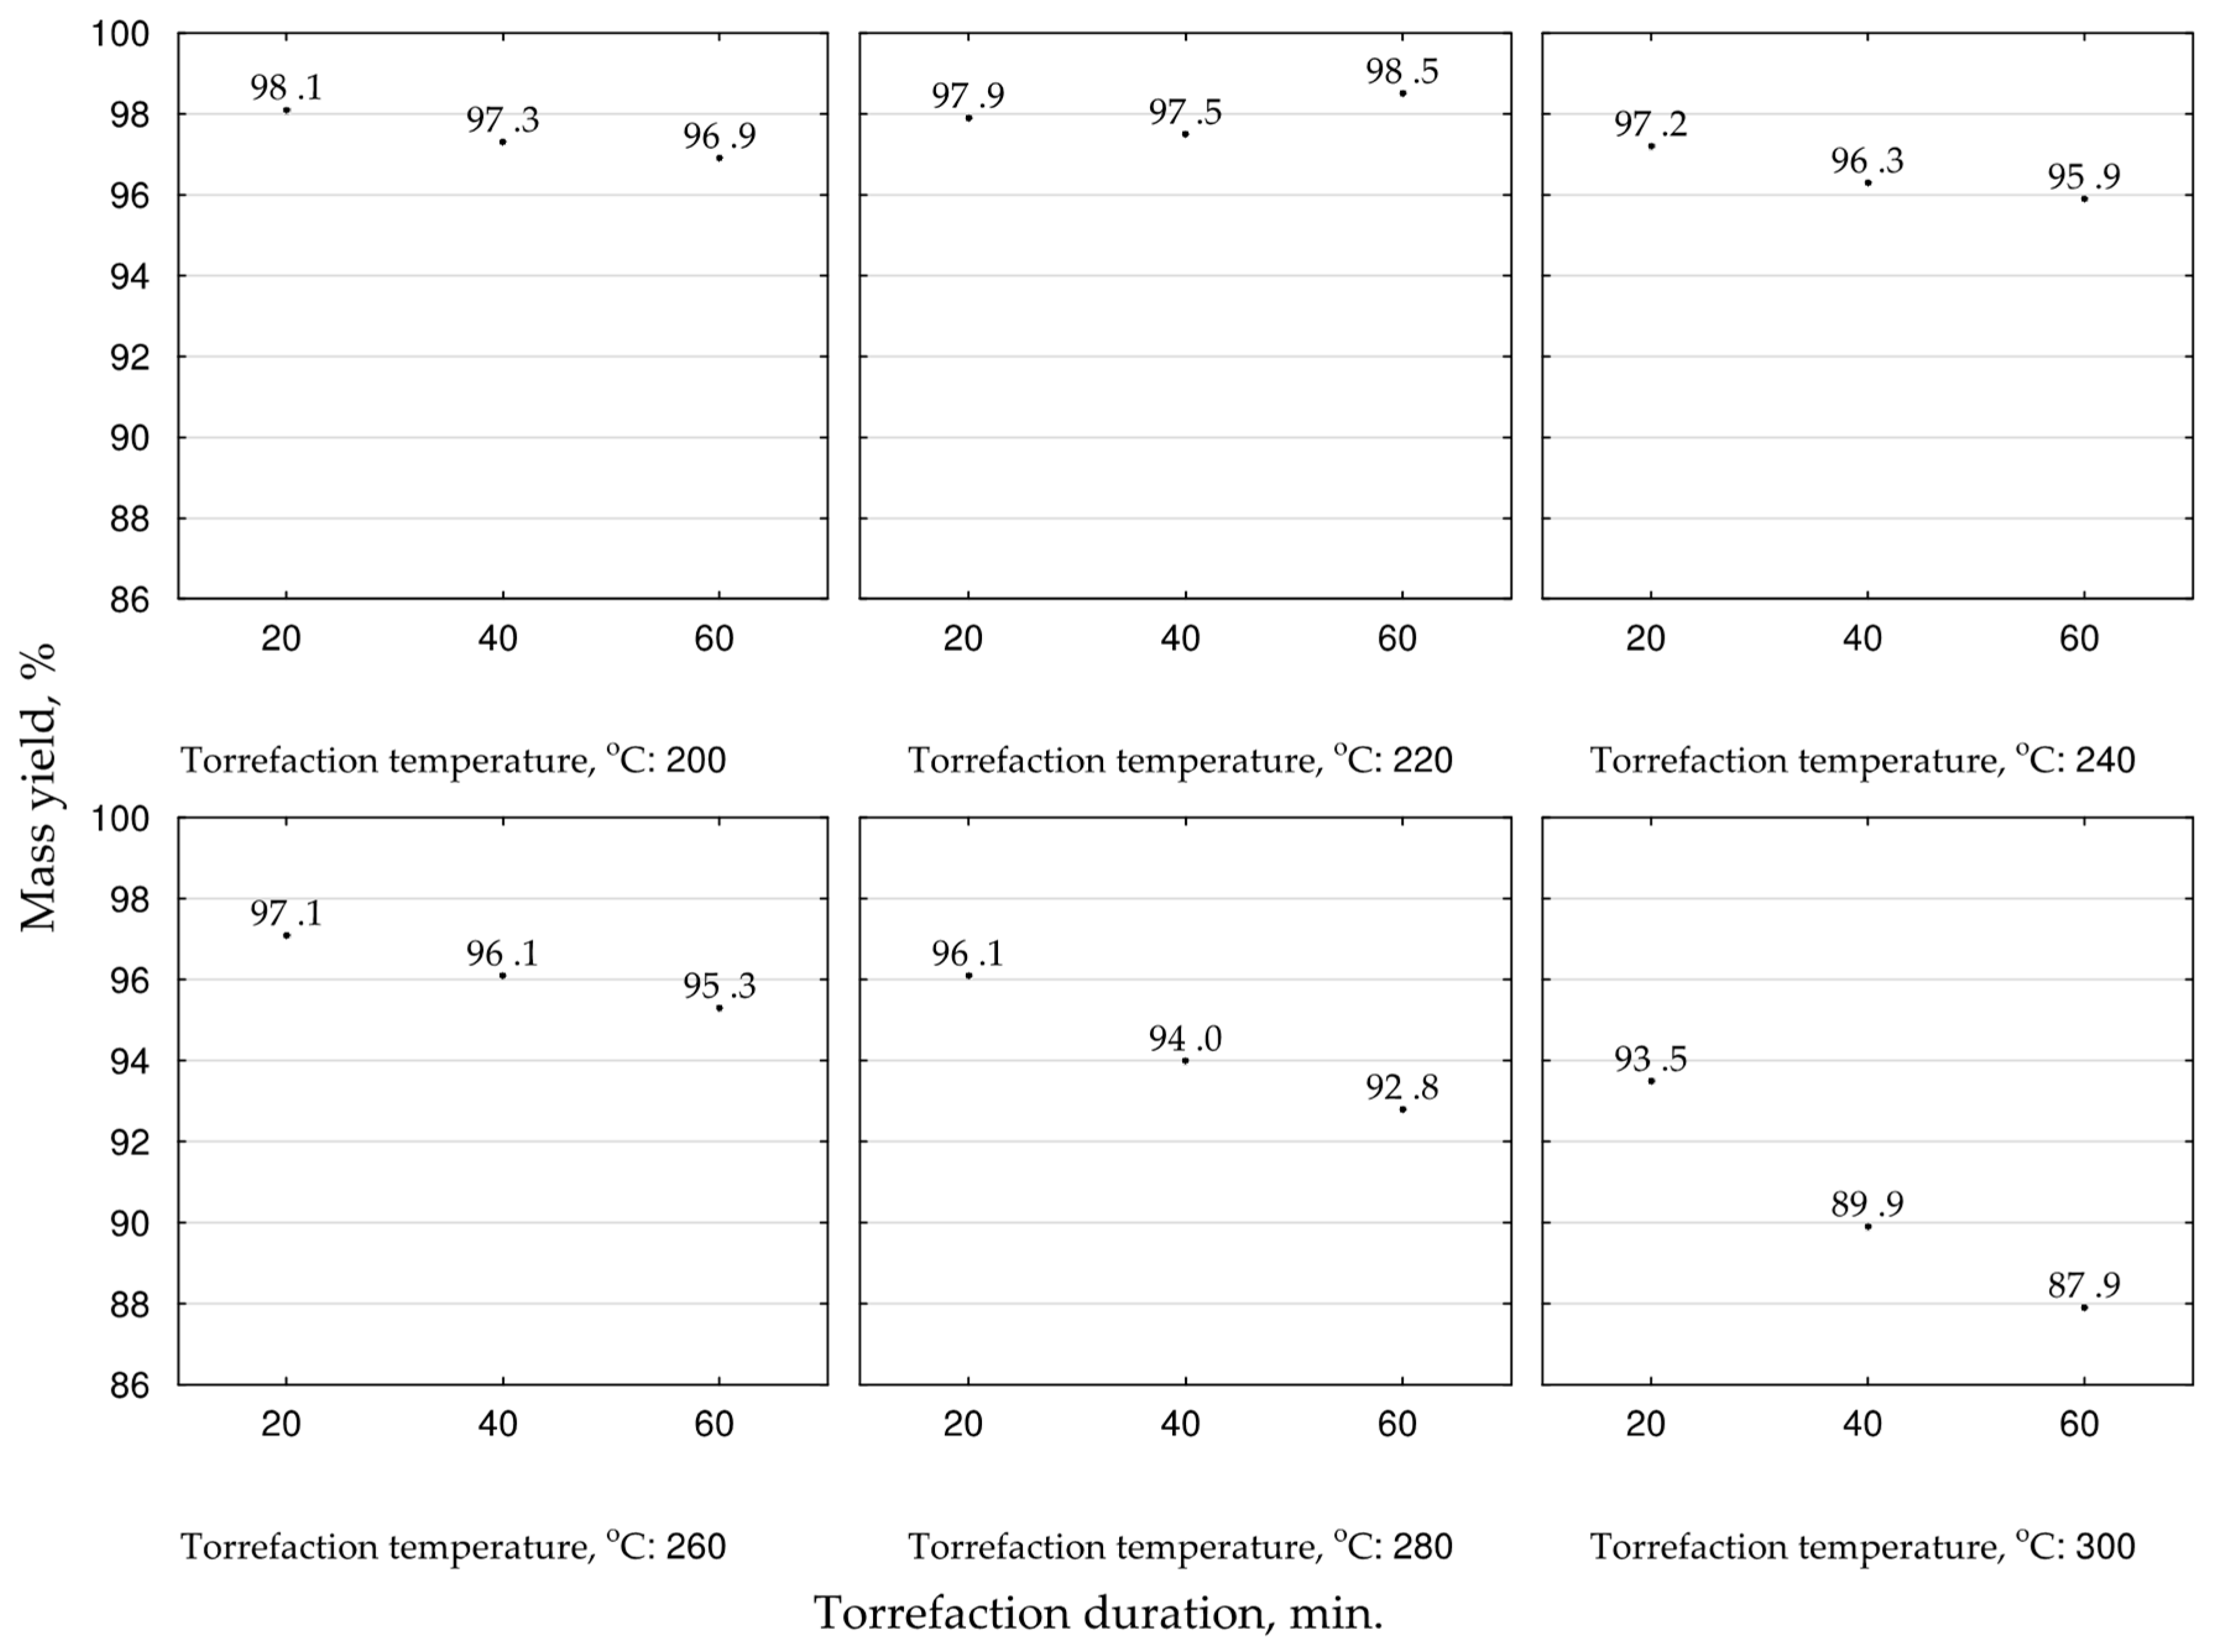
We determined the mass yields and energy yields to analyze the treatment efficiency. These parameters were calculated according to Equations (6)–(8) on the base of the mean values of HHV and masses from the TGA [43] for a given torrefaction temperature and duration. The highest mass yield of biocoal was achieved for temperatures 200 and 220 °C and ranged between 96.9 and 98.5%, respectively (Figure 4). The mass yield under higher temperatures decreased and depended on torrefaction duration. The increase of torrefaction time decreased the mass yield. The lowest achieved value, 87.9%, was in the case of 300 °C, and 60 min duration (
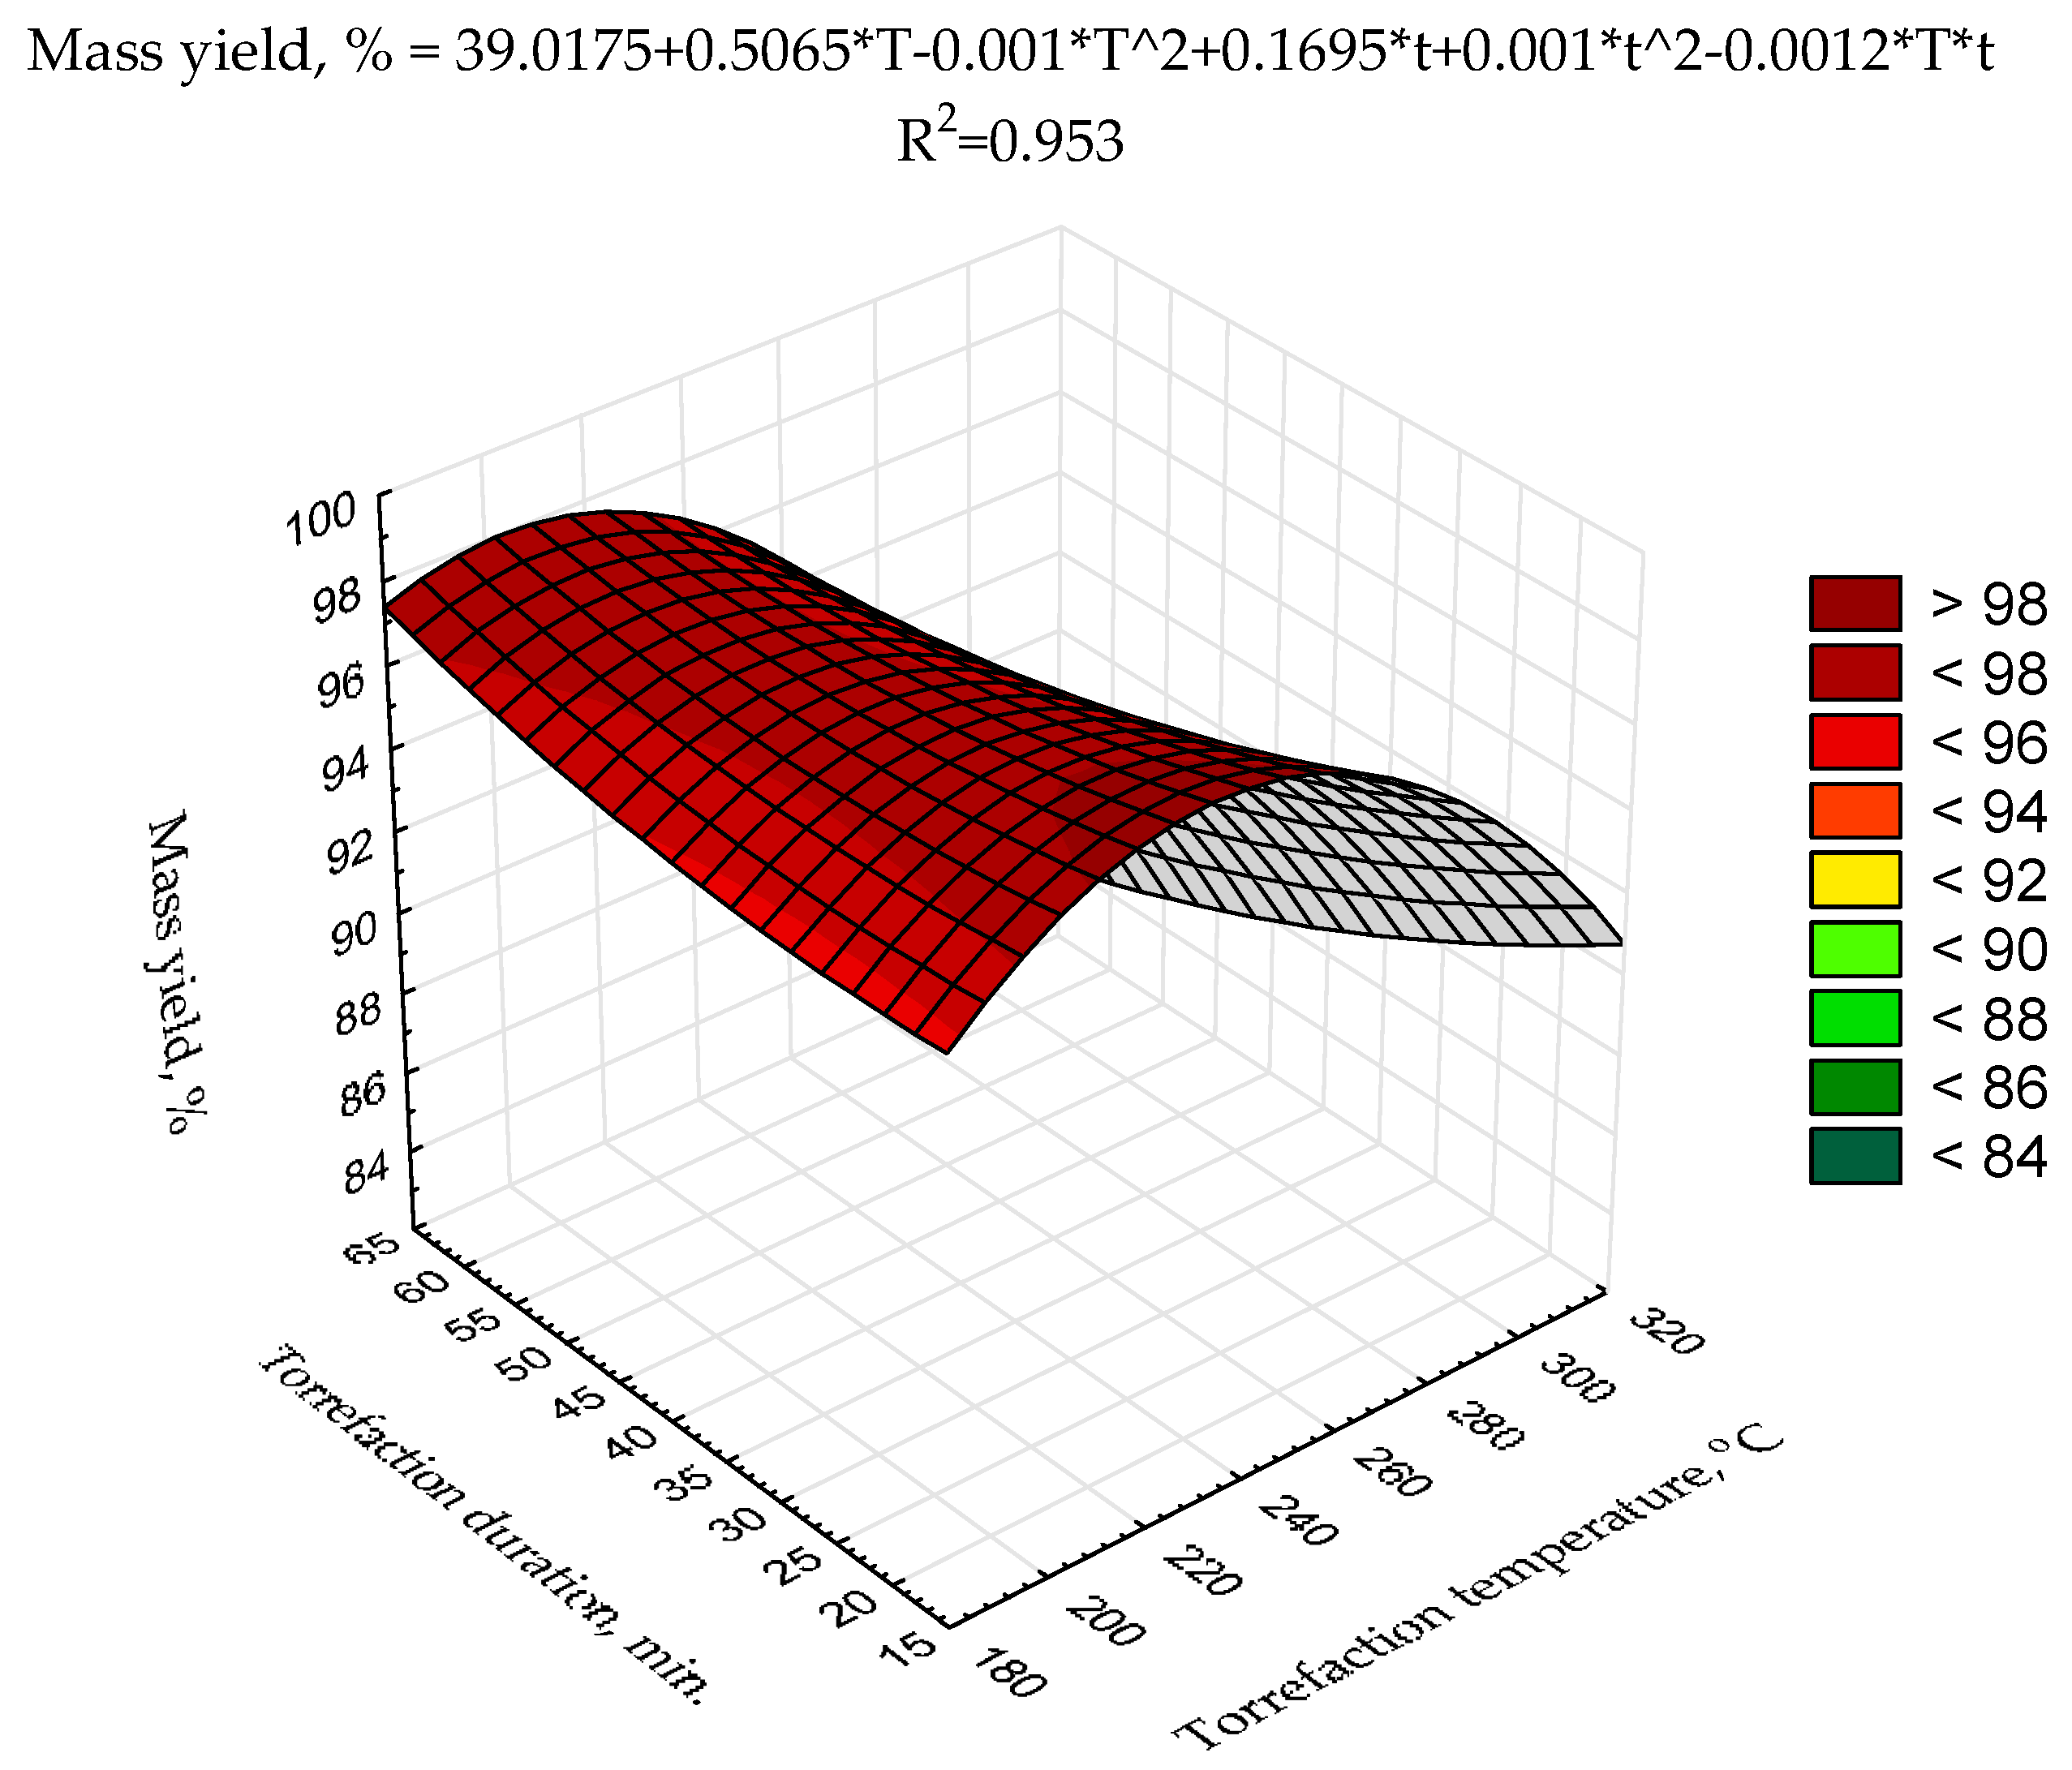
Figure 4). For scaling-up the process, high mass yield is important when biomass or waste is converted to biocoal for agricultural purposes. Therefore, for the optimization of that goal, the second-degree polynomial model of torrefaction temperature and duration influence on biocoals’ mass yield was proposed (Figure 5). The statistical evaluation showed that the determination coefficient was high (0.953) (Figure 5), but only the model regression coefficients related to torrefaction temperature (a2, a3, and a6) and the intercept (a1) were statistically significant (p < 0.05) (Table A4).
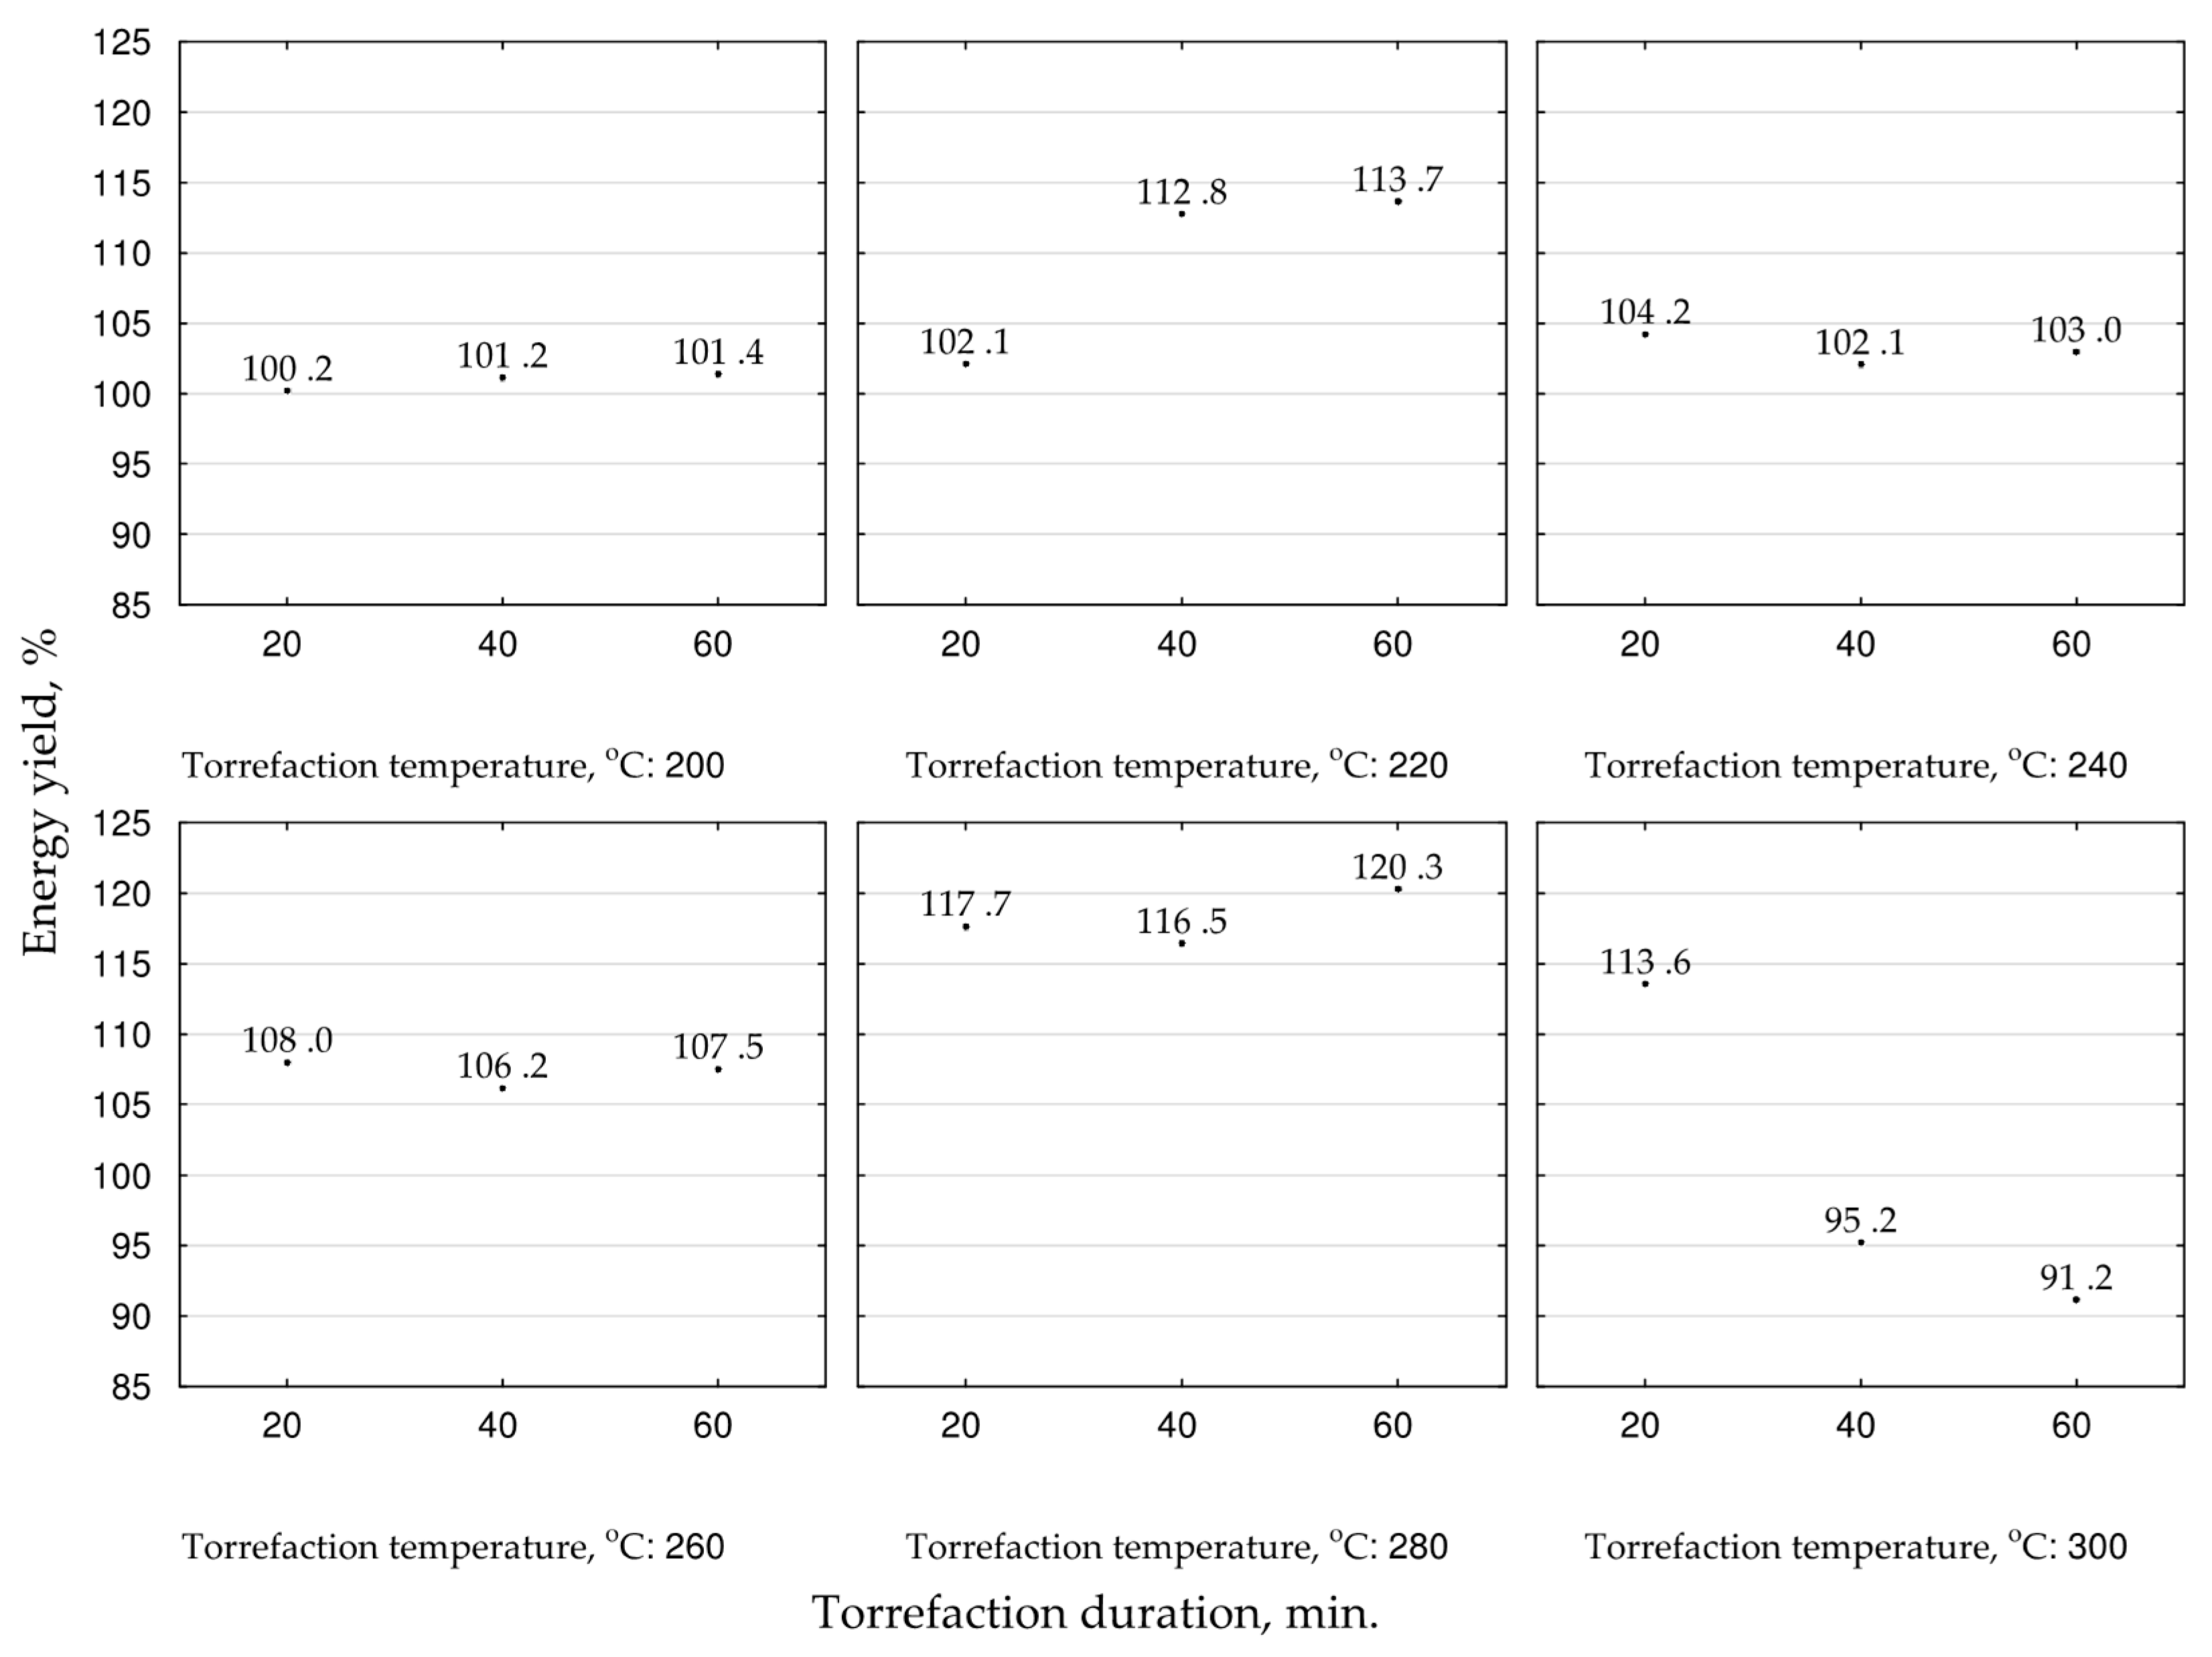
The energy yield in biocoal indicates the efficiency of the chemical energy densification due to thermochemical processes concerning the mass loss of the treated MSC. The highest energy yield values, exceeding 116.5–120.3%, were noted at 280 °C, and were correlated with process duration. The increase of the temperature to 300 °C decreased the energy yield to 91%. Thus, for fuel production, the temperature of 280 °C and the process duration of 60 min should be applied (
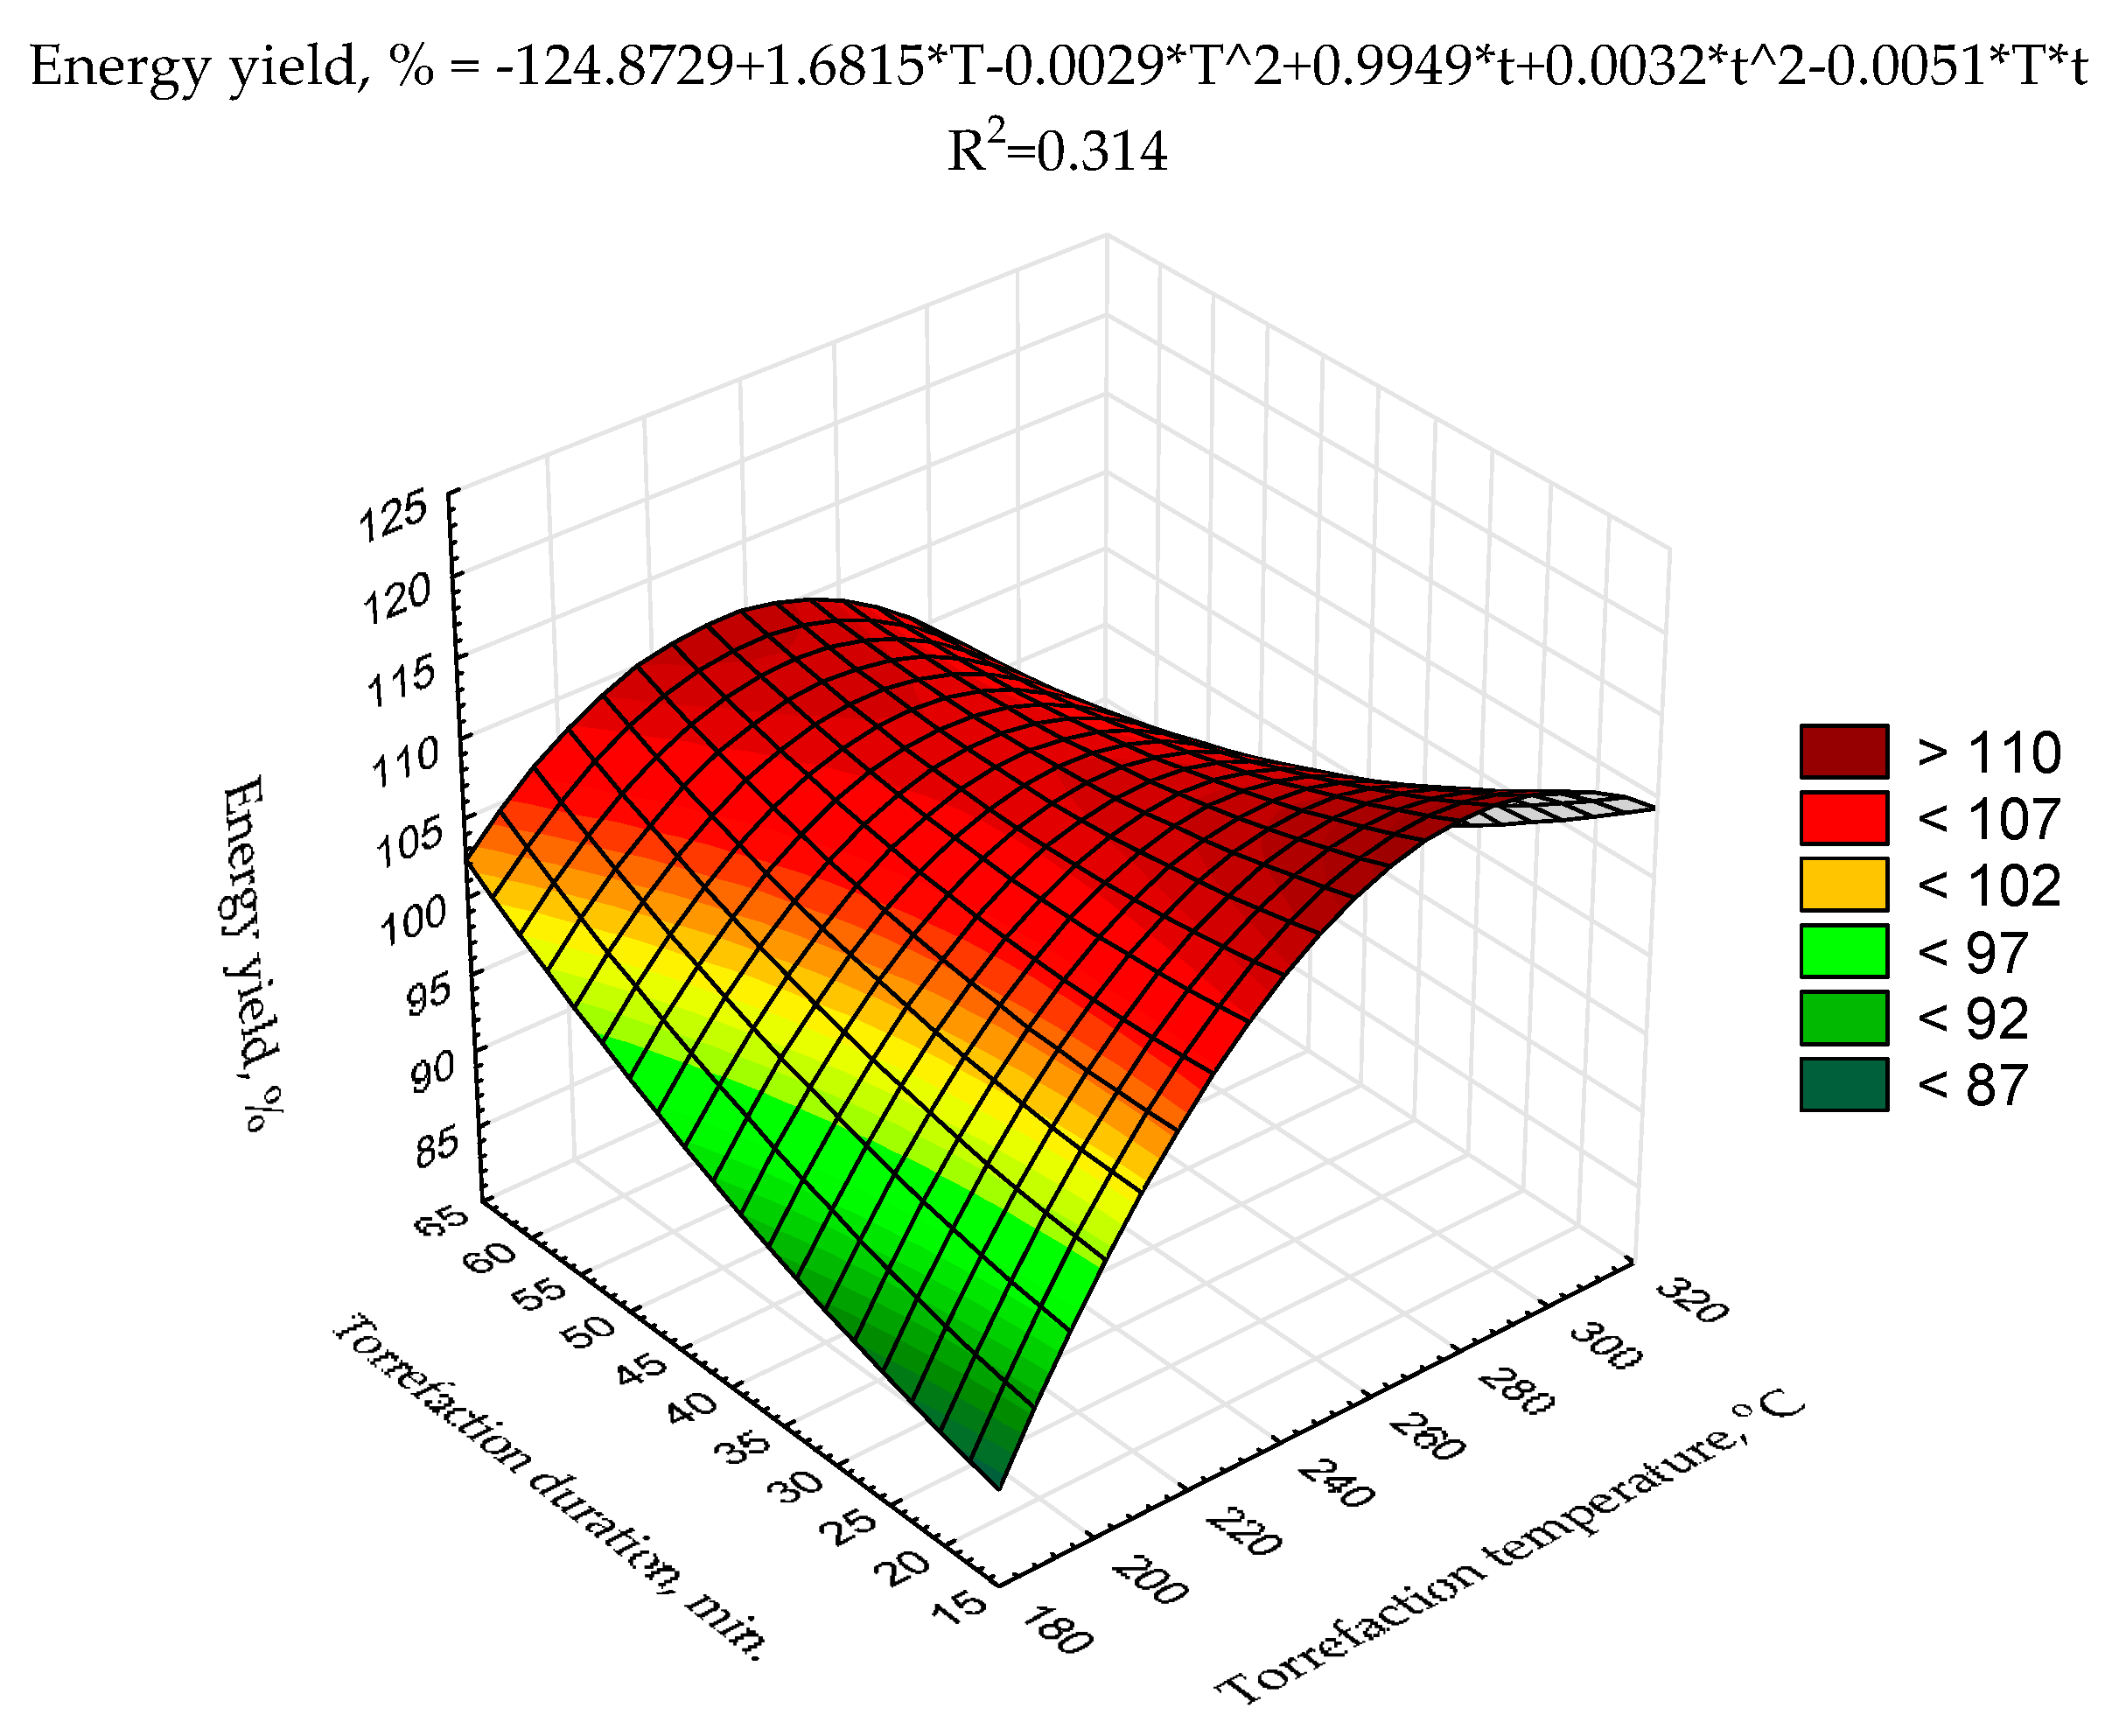
Figure 6). Additionally, for optimization of MSC conversion to biocoal for energy purposes, the second-degree polynomial model of torrefaction temperature and duration influence on biocoals’ energy yield was proposed (Figure 7). The statistical evaluation showed that determination coefficient was not high (0.314) (Figure 7); however, all the regression coefficients were significant (p < 0.05) (Table A5). The low degree of model fitting to the obtained data could be related to a similarly low degree of fitting of the model proposed for the HHV. HHV values are used for energy yield calculations. Similarly, to achieve better results suitable for MSC torrefaction optimization, more complex research with a higher number of repetitions (to reduce the degree of the HHV results’ heterogeneity) with the application of better-fitting models is required.
We have shown an alternative utilization of abundant biowaste (MSC). MSC has potential for improved management that is both sustainable and economical [1,2,3,4,5,6,7,8,9,10,11,12,13,14,15,16,17,18,19,20,21,22,23,24,25]. We have proposed treating MSC via torrefaction to produce biocoal with improved fuel properties. This research showed that by using torrefaction at 280 °C for 60 min, it is possible to increase the HHV of raw MSC from ~13.7 MJ·kg−1 to ~18 MJ·kg−1. This calorific value of obtained biocoal is comparable with nonagglomerating highly volatile coals (HHV from 17.4 to 23.9 MJ·kg−1) or lignite coal (HHV below 17.4 MJ·kg−1) [58]. Our research also showed that the highest efficiency (i.e., the energy yield) was achieved at the temperature of 280 °C for a duration of 60 min.
Based on these results and using the best variant (T and t), a simple model [49] was proposed (after some modifications) for estimating the possibility of achieving heat self-sufficiency of biocoal production. The model also calculates the theoretical mass yield after biocoal recirculation of the torrefied biomass to maintain the torrefaction process itself (biocoal recirculation—Figure 1). The calculations and results were gathered in Table 4.
The estimated value of torrefied MSC recirculation rate was obtained for 1 Mg of wet MSC (65.32% moisture content). For MSC torrefaction (280 °C, 60 min), the mass yield of MSC biocoal was 92.8%, and HHV of torrefied MSC was 17.9 MJ·kg−1. For these conditions, the estimated biocoal recirculation rate for obtaining the MSC torrefaction heat self-sufficiency was 43.6%. Therefore the 56.4% of produced biocoal (181.6 kg produced form 1 Mg of wet MSC) may be used for heating the mushroom farm (Figure 1) or be sold to external users.
The presented simplified calculation of the biocoal (considered as a fuel) recirculation rate is the first step for the evaluation of the feasibility of utilization of torrefaction technology for MSC treatment. The model was based on simple assumptions. Therefore, more advanced and precise models with a comprehensive analysis of mass and energy balances are warranted as a separate work.

4. Conclusions

The presented research revealed that it is possible to produce biocoal from MSC. The obtained biocoal has HHV similar to a good quality lignite coal. Reaction kinetics analyses of MSC torrefaction showed that the intensive organic matter decomposition started above 280 °C. Considering the application of produced biocoal from MSC for agriculture, the highest mass yield was obtained under 220 °C. If the MSC biocoal production is dedicated to solid fuel production, the torrefaction temperature of 280 °C and process duration of 60 min should be applied to maximize the energy yield. For MSC torrefaction (280 °C, 60 min), the mass yield of MSC biocoal was 92.8%, and HHV of torrefied MSC was 17.9 MJ·kg−1. For these conditions, the estimated biocoal recirculation rate to obtain MSC torrefaction self-sufficiency was 43.6%. The net mass obtained after torrefaction and biocoal recirculation was 0.182 Mg d.m. Second-degree polynomial models for optimization of the torrefaction process were proposed. However, more complex research is required for model calibration and up-scaling. The initial mass and energy balances evaluation showed that MSC torrefaction might be self-sufficient for heat, and therefore feasible. This research provides a basis for alternative use of an abundant biowaste and can help chart improved, sustainable mushroom production.

Supplementary Materials

The following are available online at https://www.mdpi.com/1996-1073/12/16/3060/s1. Syguła, E.; A. Koziel, J.; Białowiec, A. Waste to Carbon: Preliminary Research on Mushroom Spent Compost Torrefaction. Preprints 2019, 2019060189 (doi: 10.20944/preprints201906.0189.v1). File “MSC torrefaction data.xlsx”.

Author Contributions

Conceptualization, A.B.; methodology, A.B., E.S.; software, E.S.; validation, E.S., A.B., and J.A.K.; formal analysis, E.S.; investigation, E.S.; resources, E.S., A.B., and J.A.K.; data curation, E.S., A.B.; writing—original draft preparation, E.S., A.B.; writing—review and editing, E.S., A.B. and J.A.K.; supervision, A.B and J.A.K.; project administration, A.B.; funding acquisition, A.B., and J.A.K.

Funding

The authors would like to thank the Fulbright Foundation for funding the project titled “Research on pollutants emission from Carbonized Refuse-Derived Fuel into the environment,” completed at the Iowa State University. In addition, this paper preparation was partially supported by the Iowa Agriculture and Home Economics Experiment Station, Ames, Iowa. Project no. IOW05556 (Future Challenges in Animal Production Systems: Seeking Solutions through Focused Facilitation) sponsored by Hatch Act and State of Iowa funds.

Conflicts of Interest

The authors declare no conflict of interest. The funders had no role in the design of the study; in the collection, analyses, or interpretation of data; in the writing of the manuscript; or in the decision to publish the results.

Appendix A

Table A1. Calculated values of probability ‘p’ of ANOVA analysis with Tukey’s Test RSD of variable: torrefaction constant rate (k). Highlighted (in bold) differences are significant at p < 0.05000.
Torrefaction Temperature, °CCalculated Values of Probability ‘p
200220240260280
200
2200.998400
2400.9762320.999461
2600.4010480.6186190.793686
2800.0302150.0588940.0993190.572968
3000.0002910.0004070.0005620.0032670.051587
Table A2. Calculated values of probability ‘p’ of ANOVA analysis with Tukey’s Test RSD of variable: Higher Heating Value of biocoal. Highlighted differences are significant at p < 0.05000.
Torrefaction Temperature, °CTorrefaction Duration, minCalculated Values of Probability ‘p
200200200220220220240240240260260260280280280300300
2040602040602040602040602040602040
20020
200400.9996
200600.98061.0000
220200.99601.00001.0000
220400.00020.00020.00020.0002
220600.00020.00020.00020.00021.0000
240200.18150.80980.96800.91090.00090.0012
240400.61470.99651.00000.99960.00020.00031.0000
240600.14250.74190.94260.86360.00120.00171.00001.0000
260200.00040.00570.01910.01050.36750.44700.54340.14610.6228
260400.00110.02020.06210.03610.15460.20090.83560.35180.88871.0000
260600.00020.00040.00120.00070.93860.96750.08650.01240.11270.99980.9862
280200.00020.00020.00020.00020.01250.00880.00020.00020.00020.00020.00020.0002
280400.00020.00020.00020.00020.00120.00090.00020.00020.00020.00020.00020.00021.0000
280600.00020.00020.00020.00020.00020.00020.00020.00020.00020.00020.00020.00020.00670.0632
300200.00020.00020.00020.00020.06940.05090.00020.00020.00020.00020.00020.00071.00000.97990.0011
300400.63090.99721.00000.99970.00020.00031.00001.00001.00000.13890.33820.01160.00020.00020.00020.0002
300600.99991.00001.00001.00000.00020.00020.73920.99090.66400.00410.01460.00030.00020.00020.00020.00020.9924
Table A3. Statistical parameters of the polynomial model of the influence of torrefaction temperature and process time on the higher heating value of biocoal. Regression analysis used a 2-degree polynomial with a general form, with intercept (a1) and 5 regression coefficients (a2–6) (Equation (9)). Highlighted values are significant at p < 0.05000.
Regression CoefficientsValue of Regression CoefficientStandard ErrorT Value, df = 156Determined p-ValueLower Range of Confidence IntervalUpper Range of Confidence Interval
a1 (intercept)−9.187728.404435−1.093200.279763−26.08607.710533
a2−0.000250.000130−1.945930.057531−0.00050.000008
a30.163820.0656752.494360.0161140.03180.295867
a40.000310.0006870.453330.652351−0.00110.001692
a50.114830.0803281.429470.159347−0.04670.276336
a6−0.000550.000232−2.358090.022491−0.0010−0.000081
Table A4. Statistical parameters of the polynomial model of the influence of torrefaction temperature and process time on the dry mass yield value of biocoal. Regression analysis used a 2-degree polynomial with a general form, with intercept (a1) and 5 regression coefficients (a2–6) (Equation (9)). Highlighted values are significant at p < 0.05000.
Regression CoefficientsValue of Regression CoefficientStandard ErrorT Value, df = 12Determined p-ValueLower Range of Confidence IntervalUpper Range of Confidence Interval
a1 (intercept)39.0174411.294493.454550.00476514.4088663.62603
a20.506520.088265.739040.0000930.314220.69882
a3−0.001050.00017−6.005370.000062−0.00143−0.00067
a40.169520.107951.570390.142306−0.065680.40473
a50.001040.000921.128460.281182−0.000970.00305
a6−0.001220.00031−3.914080.002057−0.00190−0.00054
Table A5. Statistical parameters of the polynomial model of the influence of torrefaction temperature and process time on energy yield value of biocoal. Regression analysis used a 2-degree polynomial with a general form, with intercept (a1) and 5 regression coefficients (a2–6) (Equation (9)).
Regression CoefficientsValue of Regression CoefficientStandard ErrorT Value, df = 12Determined p ValueLower Range of Confidence IntervalUpper Range of Confidence Interval
a1 (intercept)−124.873119.6896−1.043310.317370−385.654135.9085
a21.6810.93531.797810.097396−0.3563.7193
a3−0.0030.0018−1.557850.145239−0.0070.0011
a40.9951.14400.869670.401540−1.4983.4874
a50.0030.00980.322660.752508−0.0180.0245
a6−0.0050.0033−1.552900.146412−0.0120.0021

References

  1. Czop, M.; Kłapcia, E. Termiczne przekształcanie jako sposób zagospodarowania podłoża pieczarkowego po zakończonym cyklu produkcyjnym ‘Thermal transformation as a way of developing a mushroom substrate after a completed production cycle’. Inżynieria i Ochrona Środowiska 2016, 19, 67–80. [Google Scholar] [CrossRef]
  2. Kurczewski, R. Odpady Organiczne, Czyli Resztki z Pańskiego Stołu ‘Organic Waste, or Leftovers from Your Table’. Available online: https://sozosfera.pl/ochrona-przyrody/odpady-organiczne-czyli-resztki-panskiego-stolu/ (accessed on 1 June 2019).
  3. Finney, K.N.; Ryu, C.; Sharifi, V.N.; Swithenbank, J. The reuse of spent mushroom compost and coal tailings for energy recovery: Comparison of thermal treatment technologies. Bioresour. Technol. 2009, 100, 310–315. [Google Scholar] [CrossRef] [PubMed]
  4. Singha, A.; Bajara, S.; Bishnoia, N.R.; Singha, N. Laccase production by Aspergillus heteromorphous using distillery spent wash and lignocellulosic biomass. J. Haz. Mat. 2010, 176, 1079–1082. [Google Scholar] [CrossRef] [PubMed]
  5. Commission Regulation (EU) 2015/2002 of 10 November 2015 amending Annexes IC and V to Regulation (EC) No. 1013/2006 of the European Parliament and of the Council on shipments of Waste (Text with EEA relevance). Available online: https://publications.europa.eu/en/publication-detail/-/publication/6e580883-8837-11e5-b8b7-01aa75ed71a1/language-en (accessed on 29 May 2019).
  6. Becher, M. Skład chemiczny podłoża po uprawie pieczarki jako odpadowego materiału organicznego ‘Chemical composition of the substrate after cultivation of the mushroom as waste organic material’. Ekonomia Środowisko 2013, 4, 207–213. [Google Scholar]
  7. Kalembasa, D.; Becher, M.; Bik, B.; Makolewski, A. Właściwości materii organicznej podłoża po uprawie pieczarki ‘Properties of the organic matter of the substrate after growing the mushrooms’. Acta Agrophysica 2012, 19, 713–723. [Google Scholar]
  8. Regulation (EC) No. 2003/2003 of the European Parliament and of the Council of 13 October 2003 Relating to Fertilisers (Text with EEA Relevance). Available online: http://data.europa.eu/eli/reg /2003/2003/oj (accessed on 28 May 2019).
  9. Jordan, S.; Mullen, G.; Murphy, M. Composition variability of spent mushroom compost in Ireland. Bioresour. Technol. 2008, 99, 411–418. [Google Scholar] [CrossRef] [PubMed]
  10. Wiśniewska-Kadżajan, B. Ocena przydatności podłoża po uprawie pieczarki do nawożenia roślin ‘Evaluation of the suitability of the substrate after cultivation of mushrooms for fertilizing plants’. Ochrona Środowiska i Zasobów Naturalnych 2012, 23, 165–176. [Google Scholar]
  11. Majchrowska-Safaryan, A.; Tkaczuk, C. Possibility to use the spent mushroom substrate in soil fertilization as one of its disposal methods. J. Res. Appl. Agric. Eng. 2013, 58, 57–62. [Google Scholar]
  12. Garrido, R.; Ruiz-Felix, M.N.; Satrio, J.A. Effects of Hydrolysis and Torrefaction on Pyrolysis Product Distribution of Spent Mushroom Compost (SMC). Int. J. Environ. Pollut. Remediat. 2012, 1, 98–103. [Google Scholar] [CrossRef]
  13. Zhou, A.; Du, J.; Varrone, C.; Wang, Y.; Wang, A.; Liu, W. VFAs bioproduction from waste activated sludge by coupling pretreatments with Agaricus bisporus substrates conditioning. Process. Biochem. 2014, 49, 283–289. [Google Scholar] [CrossRef]
  14. Song, H.; Yim, G.-J.; Ji, S.-W.; Neculita, C.M.; Hwang, T. Pilot-scale passive bioreactors for the treatment of acid mine drainage: Efficiency of mushroom compost vs. mixed substrates for metal removal. J. Environ. Manag. 2012, 111, 150–158. [Google Scholar] [CrossRef] [PubMed]
  15. Asada, C.; Asakawa, A.; Sasaki, C.; Nakamura, Y. Characterization of the steam-exploded spent Shiitake mushroom medium and its efficient conversion to ethanol. Bioresour. Technol. 2011, 102, 10052–10056. [Google Scholar] [CrossRef] [PubMed]
  16. Kapu, N.; Manning, M.; Hurley, T.; Voigt, J.; Cosgrove, D.; Romaine, C. Surfactant-assisted pretreatment and enzymatic hydrolysis of spent mushroom compost for the production of sugars. Bioresour. Technol. 2012, 114, 399–405. [Google Scholar] [CrossRef] [PubMed]
  17. Sato, N.; Shinji, K.; Mizuno, M.; Nozaki, K.; Suzuki, M.; Makishima, S.; Shiroishi, M.; Onoda, T.; Takahashi, F.; Kanda, T.; et al. Improvement in the productivity of xylooligosaccharides from waste medium after mushroom cultivation by hydrothermal treatment with suitable pretreatment. Bioresour. Technol. 2010, 101, 6006–6011. [Google Scholar] [CrossRef] [PubMed] [Green Version]
  18. Jurak, E.; Kabel, M.A.; Gruppen, H. Carbohydrate composition of compost during composting and mycelium growth of Agaricus bisporus. Carbohydr. Polym. 2014, 101, 281–288. [Google Scholar] [CrossRef] [PubMed]
  19. Bisaria, R.; Vasudevan, P.; Bisaria, V. Utilization of spent agro-residues from mushroom cultivation for biogas production. Appl. Microbiol. Biotechnol. 1990, 33, 607–609. [Google Scholar] [CrossRef]
  20. Żak, A.; Montusiewicz, A. Analiza opłacalności wybranych substratów wykorzystywanych w biogazowniach rolniczych ‘Analysis of the profitability of selected substrates used in agricultural biogas plants’. Acta Sci. Pol. Biotechnol. 2018, 17, 5–12. [Google Scholar] [CrossRef]
  21. Ya-Chieh, L.; Shu-Yii, W.; Chen-Yeon, C.; Hsin-Chieh, H. Hydrogen production from mushroom farm waste with a two-step acid hydrolysis process. Int. J. Hydrog. Energy 2011, 36, 14245–14251. [Google Scholar] [CrossRef]
  22. Zuwała, J.; Kopczyński, M.; Kazalski, K. Koncepcja systemu uwierzytelniania biomasy toryfikowanej w perspektywie wykorzystania paliwa na cele energetyczne ‘The concept of a biomass biomass authentication system in the perspective of using fuel for energy purposes’. Polityka Energetyczna 2015, 18, 89–100. [Google Scholar]
  23. Directive 2009/28/EC of the European Parliament and of Council of 23 April 2009 on the Promotion of the Use of Energy from Renewable Sources and Amending and Subsequently Repealing Directive 2001/77/EC and 2003/30/EC (Text with EEA Relevance). Available online: http://data.europa.eu/eli/dir/2009/28/2015-10-05 (accessed on 27 May 2019).
  24. Sładeczek, F.; Głodek-Bucyk, E. Badania wykorzystania niskotemperaturowej pirolizy do przetwarzania biomasy odpadowej na biowęgiel w instalacji testowej ‘Research on the use of low-temperature pyrolysis for the conversion of waste biomass into biochar in a pilot-scale installation’. ICiMB 2017, 28, 50–60. [Google Scholar]
  25. Koppejan, J.; Sokhansanj, S.; Melin, S.; Madrali, S. Status Overview of Torrefaction Technologies. IEA Bioenergy Task 32 Report. Final Report. Enschede 2012. ISBN 978-1-910154-23-6. Available online: http://task40.ieabioenergy.com/wp-content/uploads/2013/09/IEA_Bioenergy_T32_Torrefaction_review.pdf (accessed on 8 August 2019).
  26. Białowiec, A.; Micuda, M.; Koziel, J.A. Waste to Carbon: Densification of Torrefied Refuse-Derived Fuel. Energies 2018, 11, 3233. [Google Scholar] [CrossRef]
  27. Dębowski, M.; Pawlak-Kruczek, H.; Czerep, M.; Brzdękiewicz, A.; Słomczyński, Z. Technologie produkcji biowęgla- zalety i wady ‘Biochar production technologies—Advantages and disadvantages’. ICiMB 2016, 26, 26–39. [Google Scholar]
  28. Kopczyński, M.; Zuwała, J. Biomasa toryfikowana–Nowe paliwo dla energetyki ‘Torrefied biomass–A new fuel for the power industry’. Chemik 2013, 67, 540–551. [Google Scholar]
  29. The Act of 20 February 2015 on Renewable Energy Sources (Journal of Laws of 2018, Item 2389, as Amended). Available online: http://prawo.sejm.gov.pl/isap.nsf/download.xsp/WDU20150000478/U/D20150478Lj.pdf (accessed on 27 May 2019).
  30. Bajpai, P. Pretreatment of Lignocellulosic Biomass for Biofuel Production; SpringerBriefs in Green Chemistry for Sustainability, Springer: Singapore, 2016; Volume 22, pp. 1–24. [Google Scholar]
  31. Basu, P. Biomass Gasification, Pyrolysis and Torrefaction: Practical Design and Theory, 3rd ed.; Elsevier: Halifax, NS, Canada, 2013; pp. 44–139. ISBN 9780128130407. [Google Scholar]
  32. Kordylewski, W.; Tatarek, A. Wybrane właściwości toryfikatów z krajowych i importowanych biomas ‘Selected properties of biochars from domestic and imported sources of biomass’. Arch. Spalania 2012, 12, 109–116. [Google Scholar]
  33. Jakubiak, M.; Kordylewski, W. Toryfikacja biomasy ‘Biomass torrefaction’. Pol. Inst. Spalania 2010, 10, 11–25. [Google Scholar]
  34. Ryu, C.; Finney, K.; Sharifi, J. Pelletised fuel production from coal tailings and spent mushroom compost —Part I Identification of pelletisation parameter. Fuel Process. Technol. 2008, 89, 269–275. [Google Scholar] [CrossRef]
  35. Yusup, S.; Ahmad, M.; Melati, U.; Yoshimitsu, R.; Mahari, A.; Azlin Suhaida, A.; Mas Fatiha, M.; Sean Lim, L. Pretreatment Techniques for Biofuels and Biorefineries; Springer: Berlin, Heidelberg, Germany, 2013; pp. 59–75. [Google Scholar]
  36. Sobolewski, A.; Wasielewski, R.; Dreszer, K.; Stelmach, S. Technologie otrzymywania i kierunki zastosowań paliw alternatywnych otrzymywanych z odpadów ‘Production technologies and applications of alternative fuels derived from waste’. Instytut Chemicznej Przeróbki Węgla 2006, 85, 1080–1084. [Google Scholar]
  37. Białowiec, A.; Pulka, J.; Gołaszewski, J.; Manczarski, P.; Stępień, P. The RDF torrefaction: An effect of temperature on characterization of the product—Carbonized Derived Fuel. Waste Manag. 2017, 70, 91–100. [Google Scholar] [CrossRef]
  38. Pulka, J.; Manczarski, P.; Koziel, J.A.; Białowiec, A. Torrefaction of Sewage Sludge: Kinetics and Fuel Properties of Biochars. Energies 2019, 12, 565. [Google Scholar] [CrossRef]
  39. Dudek, M.; Świechowski, K.; Manczarski, P.; Koziel, J.A.; Białowiec, A. The Effect of Biochar Addition on the Biogas Production Kinetics from the Anaerobic Digestion of Brewers’ Spent Grain. Energies 2019, 12, 1518. [Google Scholar] [CrossRef]
  40. Świechowski, K.; Liszewski, M.; Bąbelewski, P.; Koziel, J.A.; Białowiec, A. Fuel Properties of Torrefied Biomass from Pruning of Oxytree. Data 2019, 4, 55. [Google Scholar] [CrossRef]
  41. Kopczyński, M.; Plis, A.; Zuwała, J. Thermogravimetric and Kinetic Analysis of Raw and Torrefied Biomass Combustion. Chem. Process. Eng. 2015, 36, 209–223. [Google Scholar] [CrossRef] [Green Version]
  42. Bates, R.B.; Ghoniem, A.F. Biomass torrefaction: Modeling of volatile and solid product evolution kinetics. Bioresour. Technol. 2012, 124, 460–469. [Google Scholar] [CrossRef] [PubMed]
  43. Syguła, E.; Koziel, J.A.; Białowiec, A. Waste to Carbon: Preliminary Research on Mushroom Spent Compost Torrefaction. 2019. Available online: https://www.preprints.org/manuscript/201906.0189/v1 (accessed on 16 July 2019).[Green Version]
  44. Zhang, B.; Heidari, M.; Regmi, B.; Salaudeen, S.; Arku, P.; Thimmannagari, M.; Dutta, A. Hydrothermal Carbonization of Fruit Wastes: A Promising Technique for Generating Hydrochar. Energies 2018, 11, 2022. [Google Scholar] [CrossRef]
  45. Polish Committee for Standardization. Solid biofuels–Determination of Moisture Content—Drying Method—Part 3: Moisture in a Sample for General Analysis. PN-EN ISO 18134-3:2015-11, 27 November 2015. [Google Scholar]
  46. Polish Committee for Standardization. Solid Biofuels–Determination of Volatile Matter Content. PN-EN ISO 18123:2016-01, 29 January 2016. [Google Scholar]
  47. Polish Committee for Standardization. Solid Biofuels—Determination of Ash Content. PN-EN ISO 18122:2016-01, 29 January 2016. [Google Scholar]
  48. Polish Committee for Standardization. Solid Biofuels—Determination of Calorific Value. PN-EN ISO 18125:2017-07, 12 July 2017. [Google Scholar]
  49. Świechowski, K.; Liszewski, M.; Bąbelewski, P.; Koziel, J.A.; Białowiec, A. Oxytree Pruned Biomass Torrefaction: Mathematical Models of the Influence of Temperature and Residence Time on Fuel Properties Improvement. Materials 2019, 12, 2228. [Google Scholar] [CrossRef] [PubMed]
  50. Brusseau, M.; Walker, D.; Fitzsimmons, K. Physical-Chemical Characteristics of Water. In Environmental and Pollution Science, 3rd ed.; Brusseau, M., Pepper, I.L., Gerba, C.P., Eds.; Academic Press: Amsterdam, The Netherlands, 2019; pp. 23–45. [Google Scholar] [CrossRef]
  51. Radmanović, K.; Đukić, I.; Pervan, S. Specific Heat Capacity of Wood. Drv. Ind. 2014, 65, 151–157. [Google Scholar] [CrossRef] [Green Version]
  52. Dhanavath, K.N.; Bankupalli, S.; Bhargava, S.K.; Parthasarathy, R. An experimental study to investigate the effect of torrefaction temperature on the kinetics of gas generation. J. Environ. Chem. Eng. 2018, 6, 3332–3341. [Google Scholar] [CrossRef]
  53. Walkowiak, M.; Bartkowiak, M. The kinetics of the thermal decomposition of the willow wood (Salix viminalis L.) exposed to the torrefaction process. Drewno. Pr. Nauk. Doniesienia. Komun. 2012, 55, 37–49. [Google Scholar]
  54. Saddawi, A.; Jones, J.M.; Williams, A.; Wójtowicz, M.A. Kinetics of the Thermal Decomposition of Biomass. Energy Fuels 2010, 24, 1274–1282. [Google Scholar] [CrossRef]
  55. Cavagnol, S.; Roesler, J.; Sanz, E.; Nastoll, W.; Lu, P.; Perre, P. Exothermicity in wood torrefaction and its impact on product mass yields: from micro to pilot scale. Can. J. Chem. Eng. 2015, 93, 331–339. [Google Scholar] [CrossRef]
  56. Prins, M.J.; Ptasinski, K.J.; Janssen, F.J. Torrefaction of wood. J. Anal. Appl. Pyrolysis 2006, 77, 28–34. [Google Scholar] [CrossRef]
  57. Peng, J.H. A Study of Softwood Torrefaction and Densification for the Production of High Quality Wood Pellets, The University of British Columbia. 2012. Available online: https://www.collectionscanada.gc.ca/obj/thesescanada/vol2/BVAU/TC-BVAU-42654.pdf (accessed on 29 June 2019).
  58. Mandil, C. Energy Statistics Manual. IEA Publications, OECD/IEA/EUROSTAT, Paris. 2004. Available online: http://ec.europa.eu/eurostat/ramon/statmanuals/files/Energy_statistics_manual_2004_EN.pdf (accessed on 29 June 2019).
Figure 1. The proposed concept of valorizing mushroom spent compost (MSC) via torrefaction. Resulting biocoal can be renewable fuel, and the process of torrefaction may be self-sufficient for heat due to the reuse of a part of produced biocoal.
Energies 12 03060 g001
Figure 2. The mean higher heating value of raw MSC and biocoals produced from MSC in relation to torrefaction temperature and torrefaction duration.
Energies 12 03060 g002
Figure 3. The influence of torrefaction temperature and torrefaction time on HHV of biocoals produced from MSC. The mathematical model (Equation (9)) includes parameters and the determination coefficient of the model’s fit to the experimental data (R2).
Energies 12 03060 g003
Figure 4. The dry matter mass yield values of biocoals produced from MSC in relation to torrefaction temperature and torrefaction duration.
Energies 12 03060 g004
Figure 5. The influence of torrefaction temperature and torrefaction time on the dry matter mass yield of biocoals produced from MSC. The mathematical model (Equation (9)) includes parameters and the determination coefficient of the model’s fit to the experimental data (R2).
Energies 12 03060 g005
Figure 6. The energy yield values of biocoals produced from MSC in relation to torrefaction temperature and torrefaction duration.
Energies 12 03060 g006
Figure 7. The influence of torrefaction temperature and torrefaction duration on energy yield in biocoals produced from MSC. The mathematical model (Equation (9)) includes parameters and the determination coefficient of the model’s fit to the experimental data (R2).
Energies 12 03060 g007
Table 1. The properties of mushroom spent compost (MSC) given in the literature [1,6,9,10,11,12].
ParameterUnitValues
Bulk densitykg·m3196.5
pH-6.23–7.15
Moisture%68.7–56.24
Volatile solids% d.m.53.97–65.18
Ash% d.m.22.43–38.3
Higher Heating Value, HHVMJ·kg–1 d.m.4.06–12.98
Lower Heating Value, LHVMJ·kg–1 d.m.2.03–10.17
C% d.m.27.8–40.73
H% d.m.3.40–4.86
N% d.m.1.80–6.00
S% d.m.2.12–2.99
Cl% d.m.0.1
O% d.m.18.94–26.99
Pg·kg–1 d.m.9.06–18.00
Kg·kg–1 d.m.15.2–20.00
C/N-12.3–18.0:1
Cag·kg−1 d.m.28–109
Mgg·kg–1 d.m.3.6–18.0
Nag·kg–1 d.m.1.60–1.68
Lignin% d.m.25
Cellulose% d.m.38
Hemicellulose% d.m.19
Cumg·kg–1 d.m.18.3–54.0
Znmg·kg–1 d.m.143.0–168.1
Mnmg·kg–1 d.m.164.0–336.8
Femg·kg–1 d.m.4.7–4494.5
Momg·kg−1 d.m.1.51–2.13
Almg·kg−1 d.m.987
Bmg·kg−1 d.m.12.5–47.7
Semg·kg−1 d.m.2.25
Limg·kg−1 d.m.3.27
Timg·kg−1 d.m.18.0
Pbmg·kg−1 d.m.2.47–10.40
Cdmg·kg−1 d.m.0.089–6.200
Crmg·kg−1 d.m.0.21–5.80
Nimg·kg−1 d.m.2.75–13.30
Table 2. The properties of MSC used for torrefaction.
ParameterUnitMean ± Standard Deviation
Moisture%65.32 ± 0.05
VS% d.m.71.60 ± 2.31
Ash% d.m.28.40 ± 2.31
HHVMJ·kg−1 d.m.13.79 ± 0.50
Table 3. The kinetic parameters of MSC torrefaction: torrefaction constant rate (k) for given temperatures (with values of determination coefficients (R2) for k estimation), Equation (5) parameters, determination coefficient of Equation (5) parameters estimation, and activation energy of MSC torrefaction.
Constant RateTemperature, °C
200220240260280300
k1, s−10.000008 (0.902)0.000020 (0.847)0.000024 (0.821)0.000028 (0.914)0.000030 (0.930)0.000047 (0.845)
k2, s−10.000020 (0.891)0.000018 (0.823)0.000023 (0.901)0.000023 (0.953)0.000032 (0.957)0.000039 (0.942)
k3, s−10.000022 (0.812)0.000017 (0.802)0.000012 (0.883)0.000024 (0.925)0.000034 (0.947)0.000052 (0.870)
Mean ± standard deviation, s−10.000017 ± 7.5 × 10−60.000018 ± 1.5 × 10−60.000020 ± 6.5 × 10−60.000025 ± 2.7 × 10−60.000032 ± 1.7 × 10−60.000046 ± 6.3 × 10⁻⁶
Equation (5) parametersy = −2678.7 × −5.5
Determination coefficient (R2) of Equation (5) parameters estimation0.893
Activation energy, J.mol−1,22271.4
Table 4. Calculation of MSC torrefaction mass and energy balance parameters.
ParameterSymbolCalculationUnit
Mass of torrefied MSC after torrefaction process at T, and t conditionsmtb 346.8 · 0.928 = 322.0 kg
Chemical energy in torrefied biomassEtb 322.0 · 17900 = 5763800 kJ
The heat needed to heat water contained in MSCEw 653 , 2 · 4.18 · ( 100 15 ) = 232082 kJ
The heat needed to vaporization of water contained in MSCEev 653.2 · 2500 = 1633000 kJ
The heat needed to heat MSC from ambient to torrefaction temperatureEhw 346.8 · 1.6 · ( 280 15 ) = 147043 kJ
Total heat needed to torrefied 1 Mg of MSCE 232082 + 1633000 + 147043 = 2012125 kJ
The practical heat demand for torrefaction of 1 Mg of MSCEp 2012125 · 100 % 80 % = 2515156 kJ
The biocoal recirculation rate μ e 2515156 5763800 = 0.436 -

