Retention of Hydraulic Fracturing Water in Shale: The Influence of Anionic Surfactant

 , , ,
, , ,
Abstract
1. Introduction
2. Materials and Methods
2.1. Shales
2.2. Surfactant
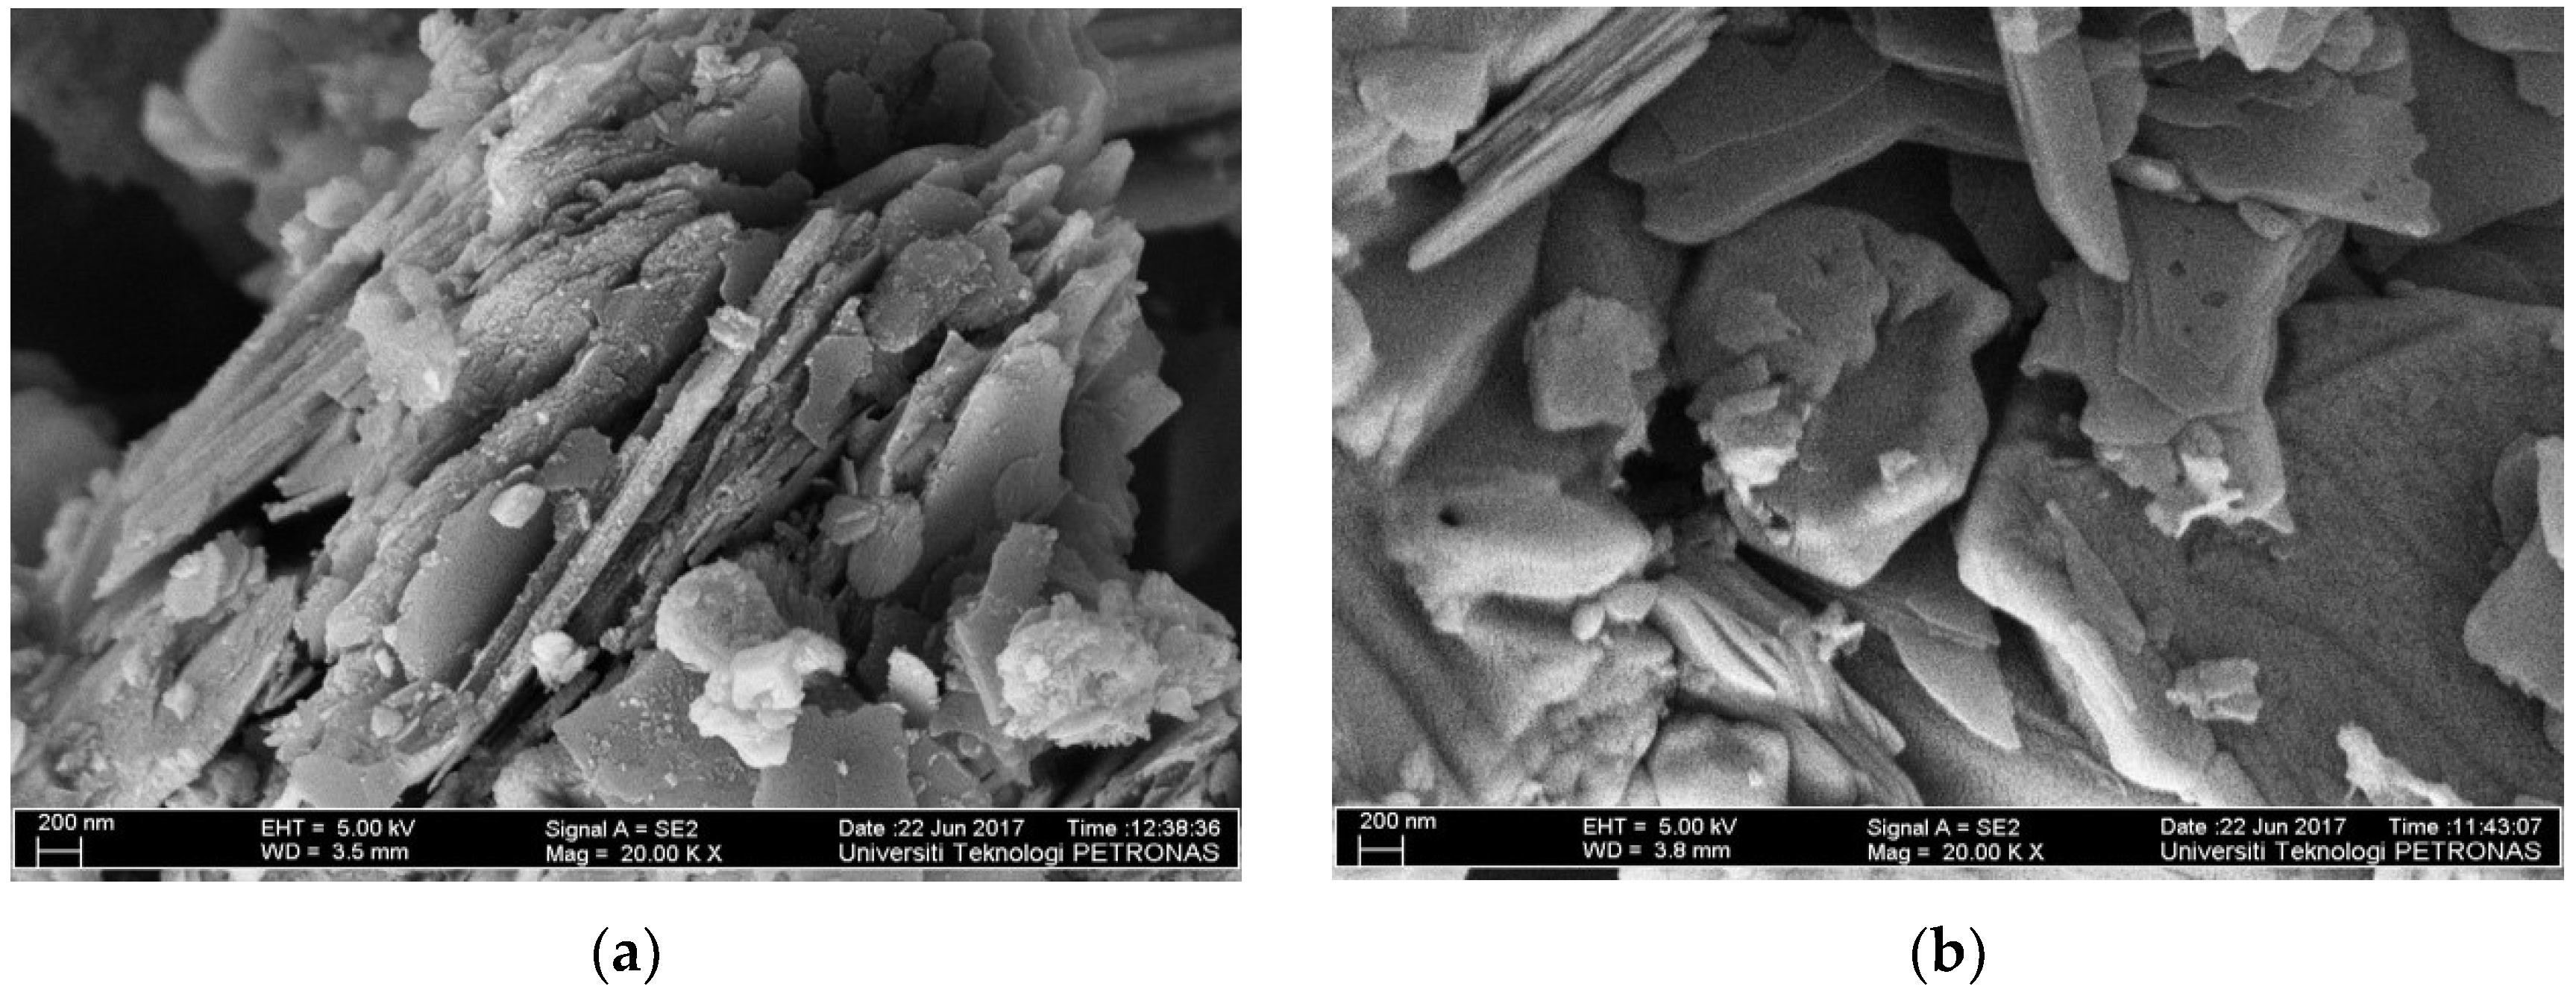
2.3. Mineralogy and Topology
2.4. TOC
2.5. Fourier-Transform Infrared Spectroscopy (FTIR)
2.6. Wettability Measurement
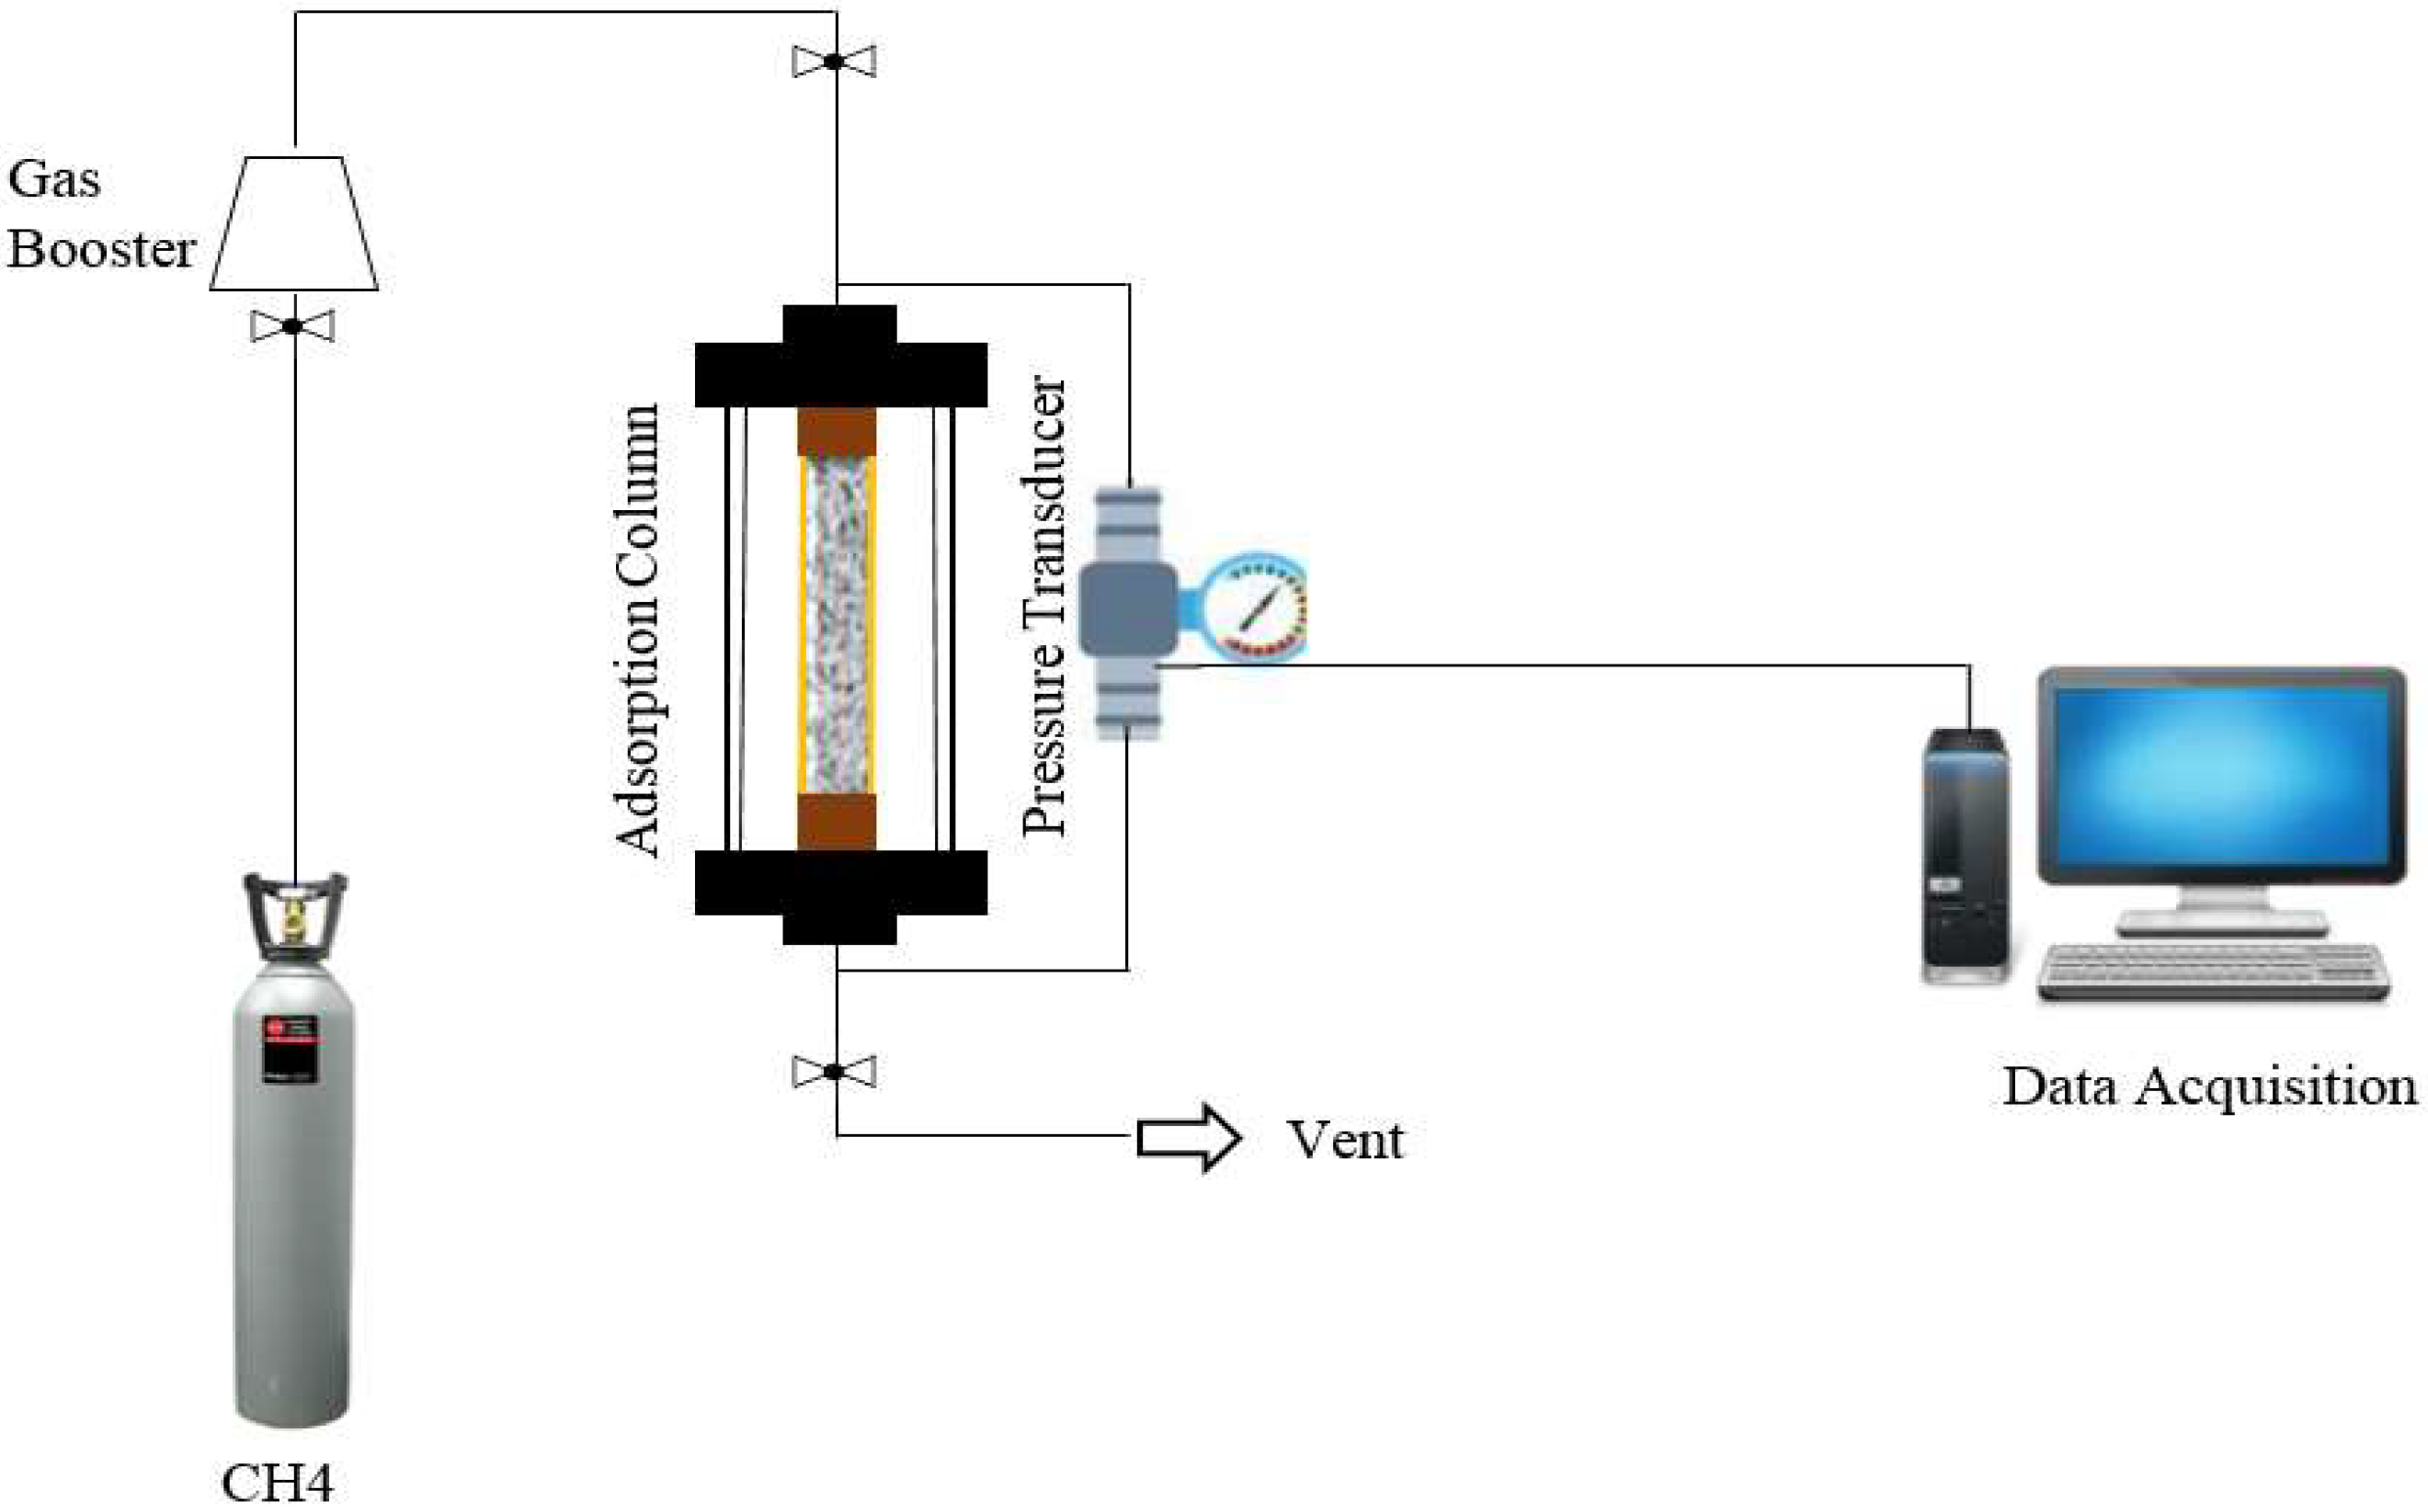
2.7. Direct Measurement of Water Retention
2.8. Indirect Measurement of Water Retention
3. Results and Discussion
3.1. Mineralogy of Shales
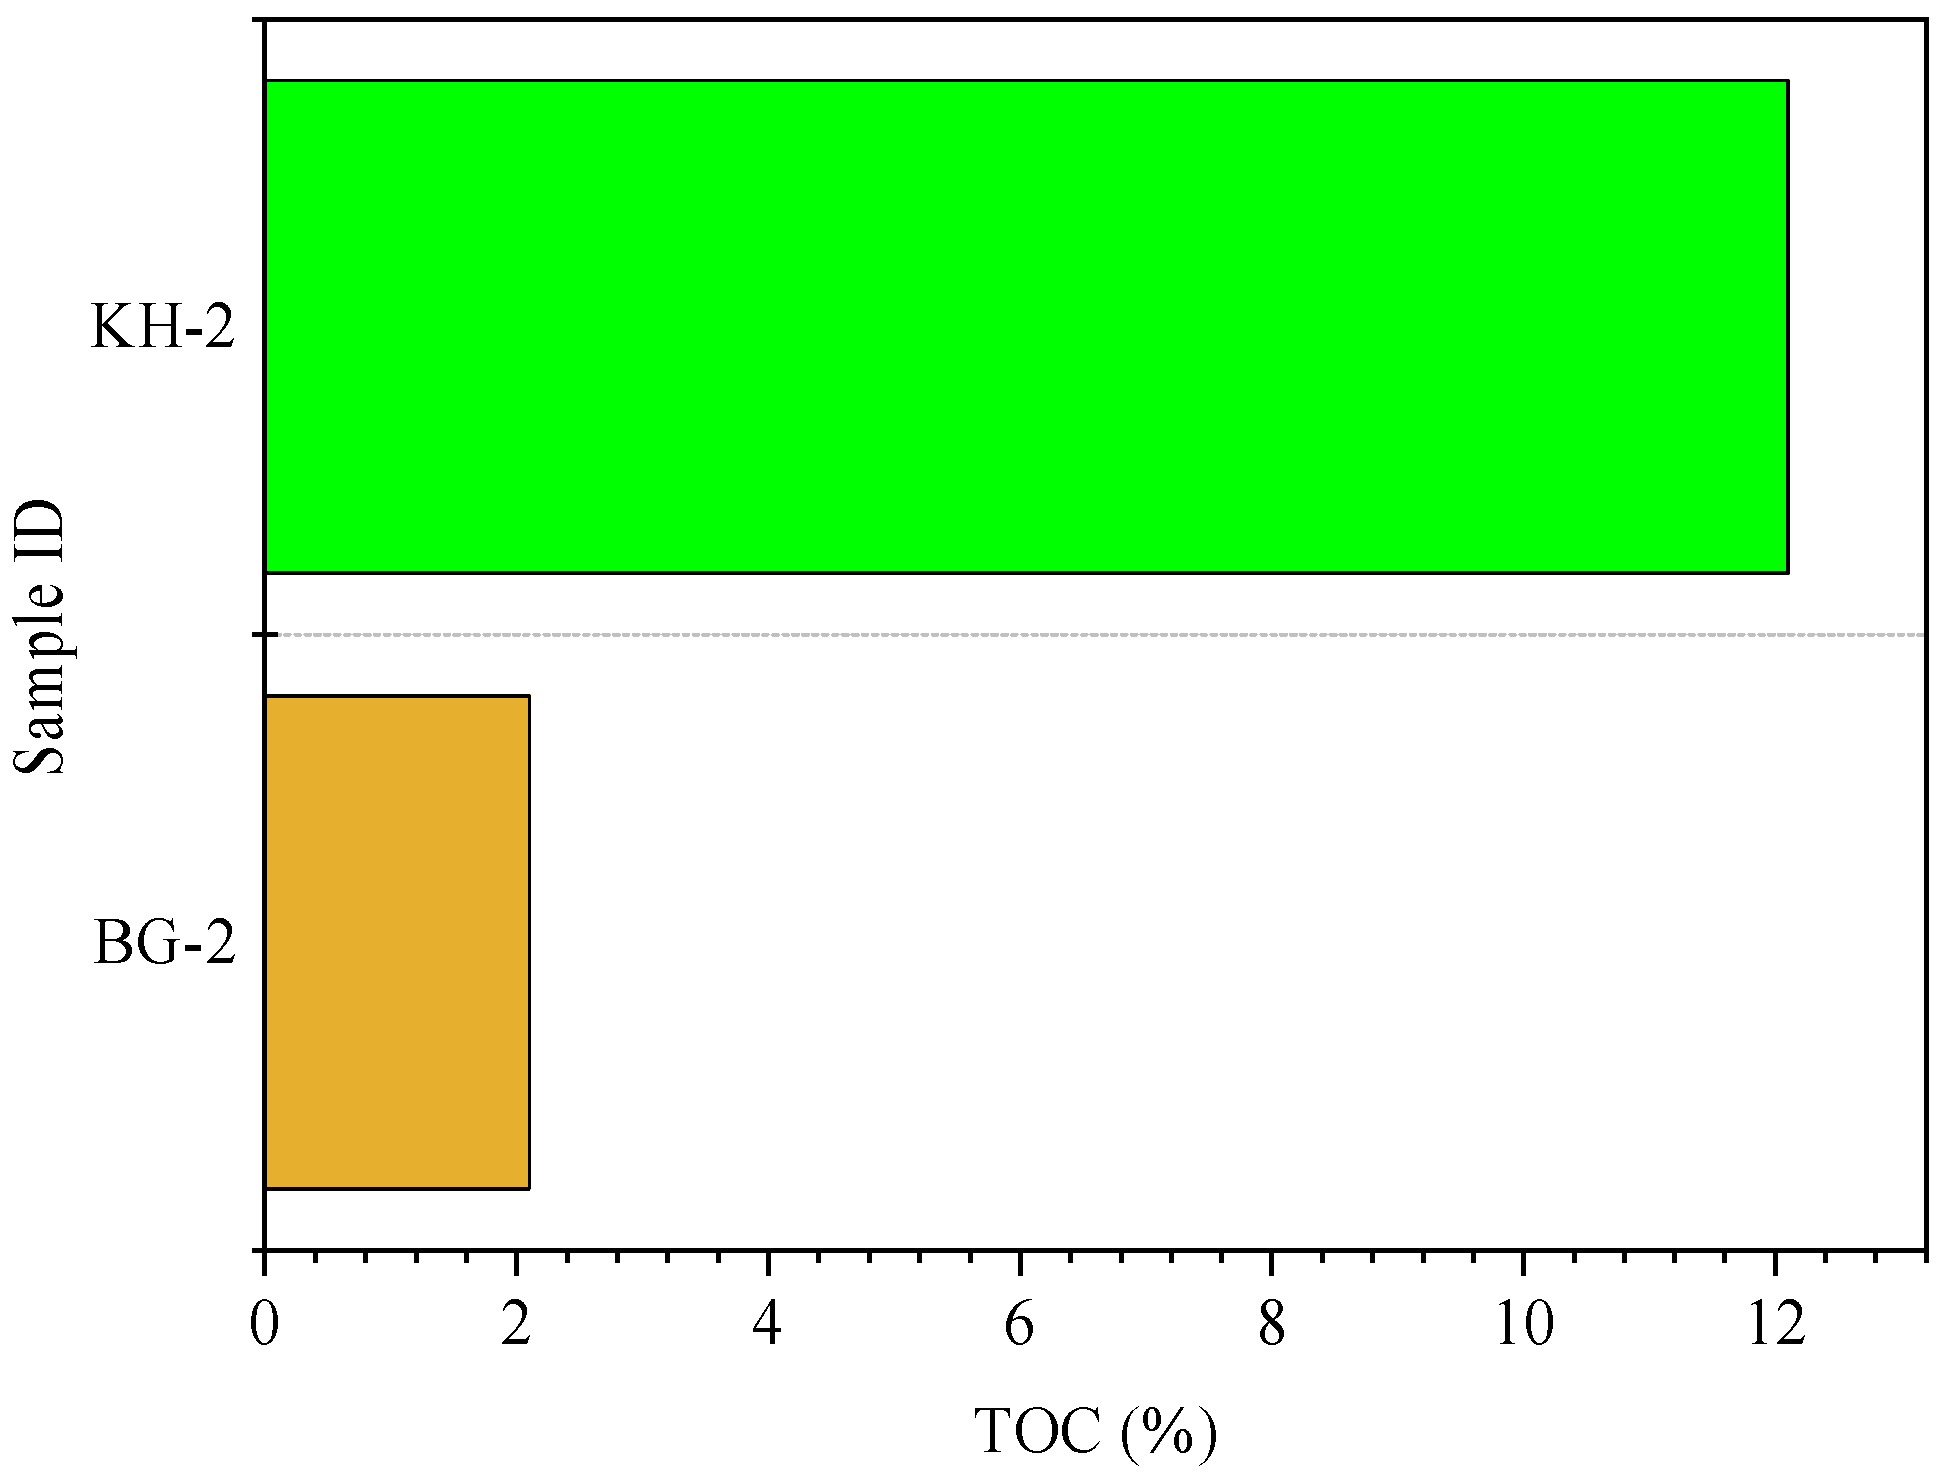
3.2. TOC
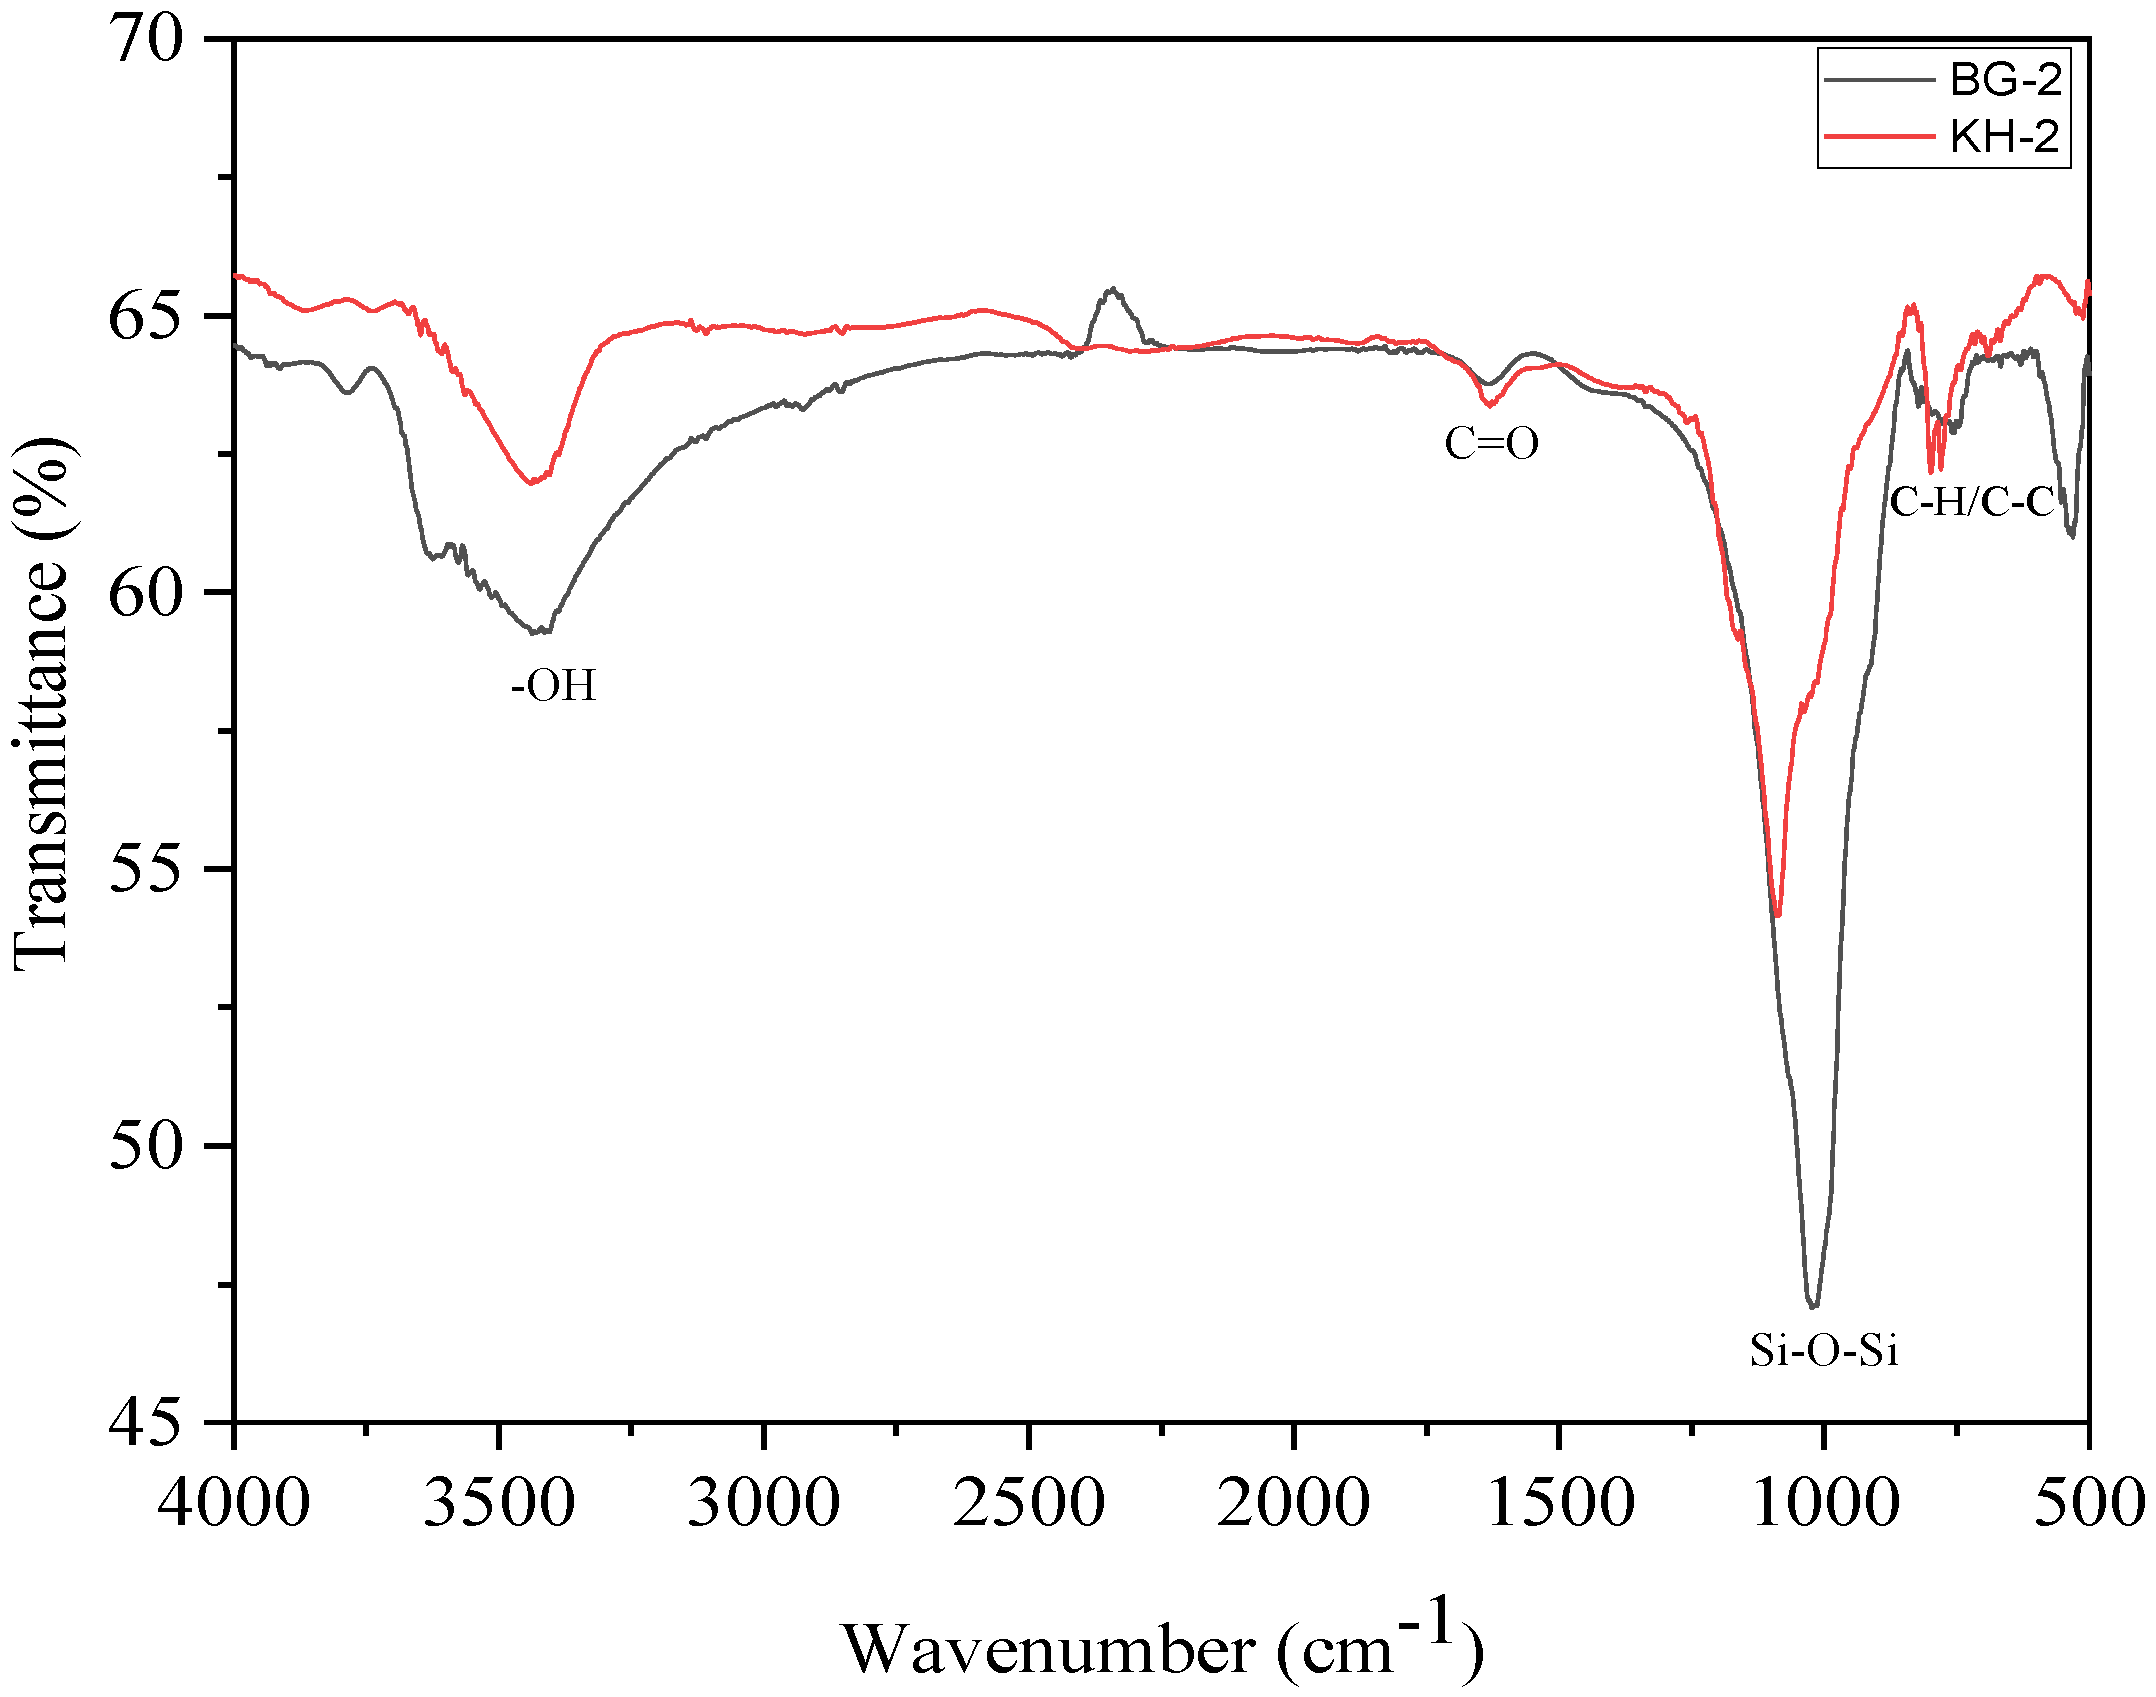
3.3. Fourier-Transform Infrared Spectroscopy (FTIR)
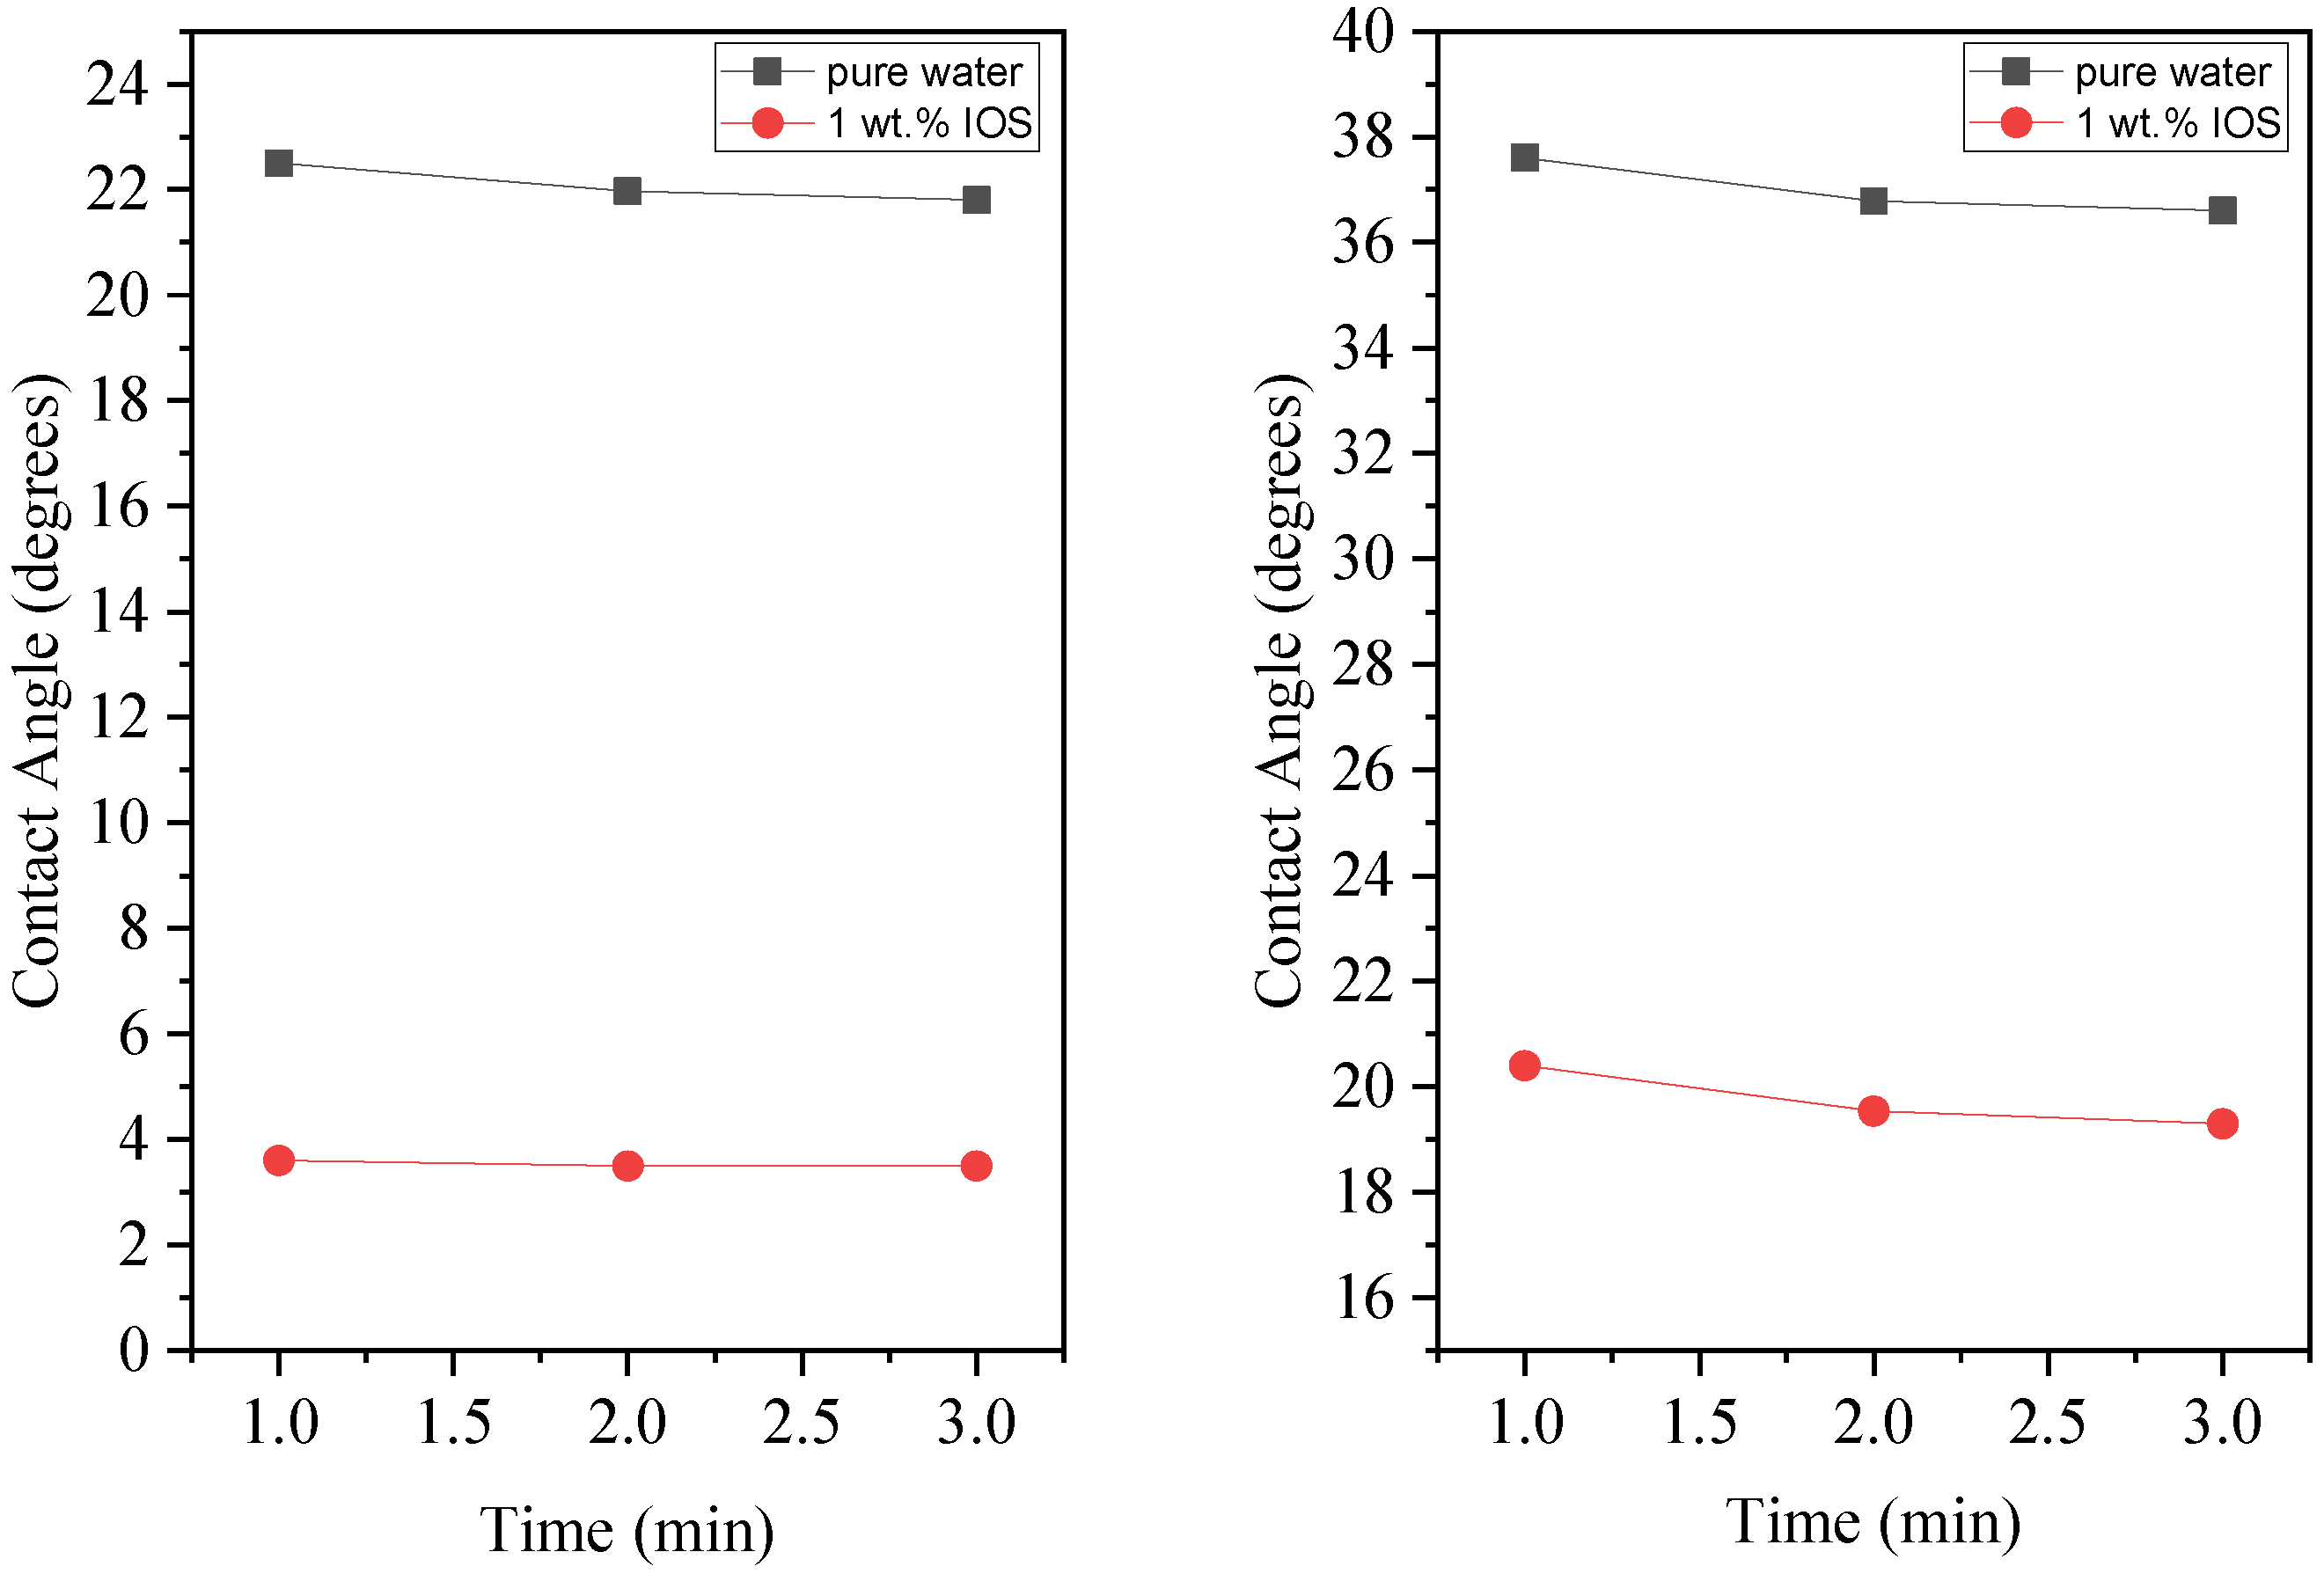
3.4. Wettability
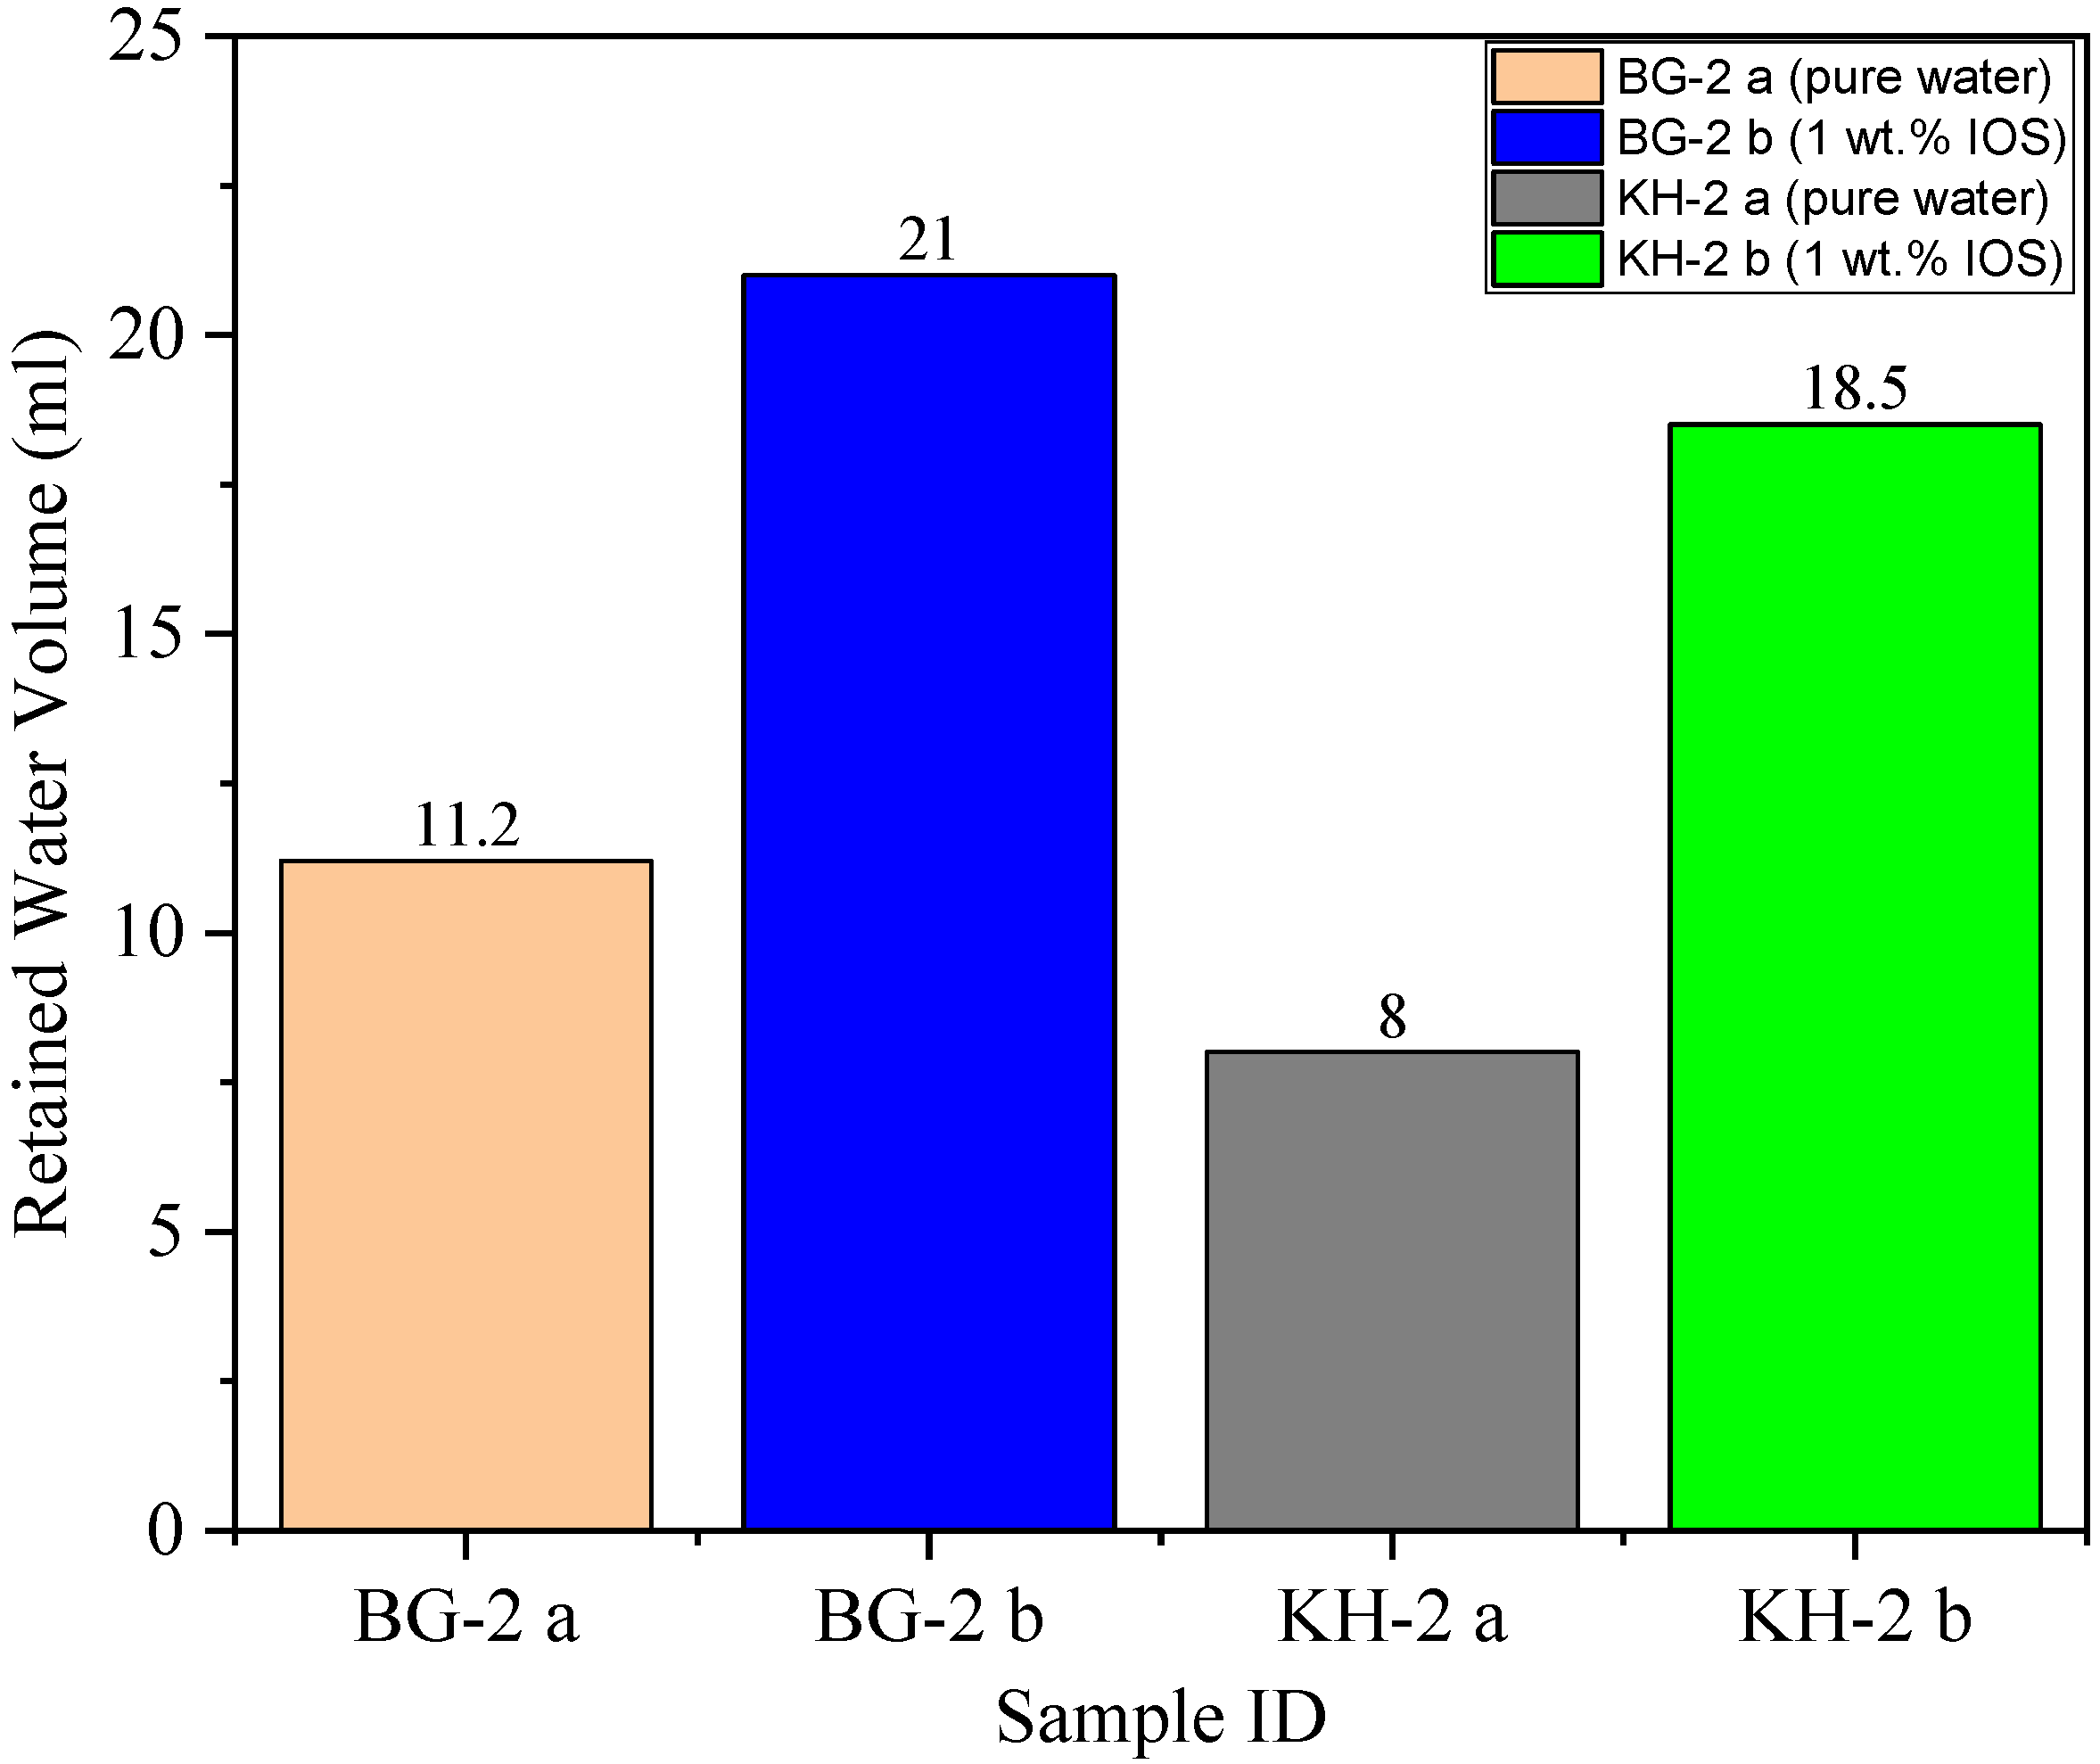
3.5. Water Uptake
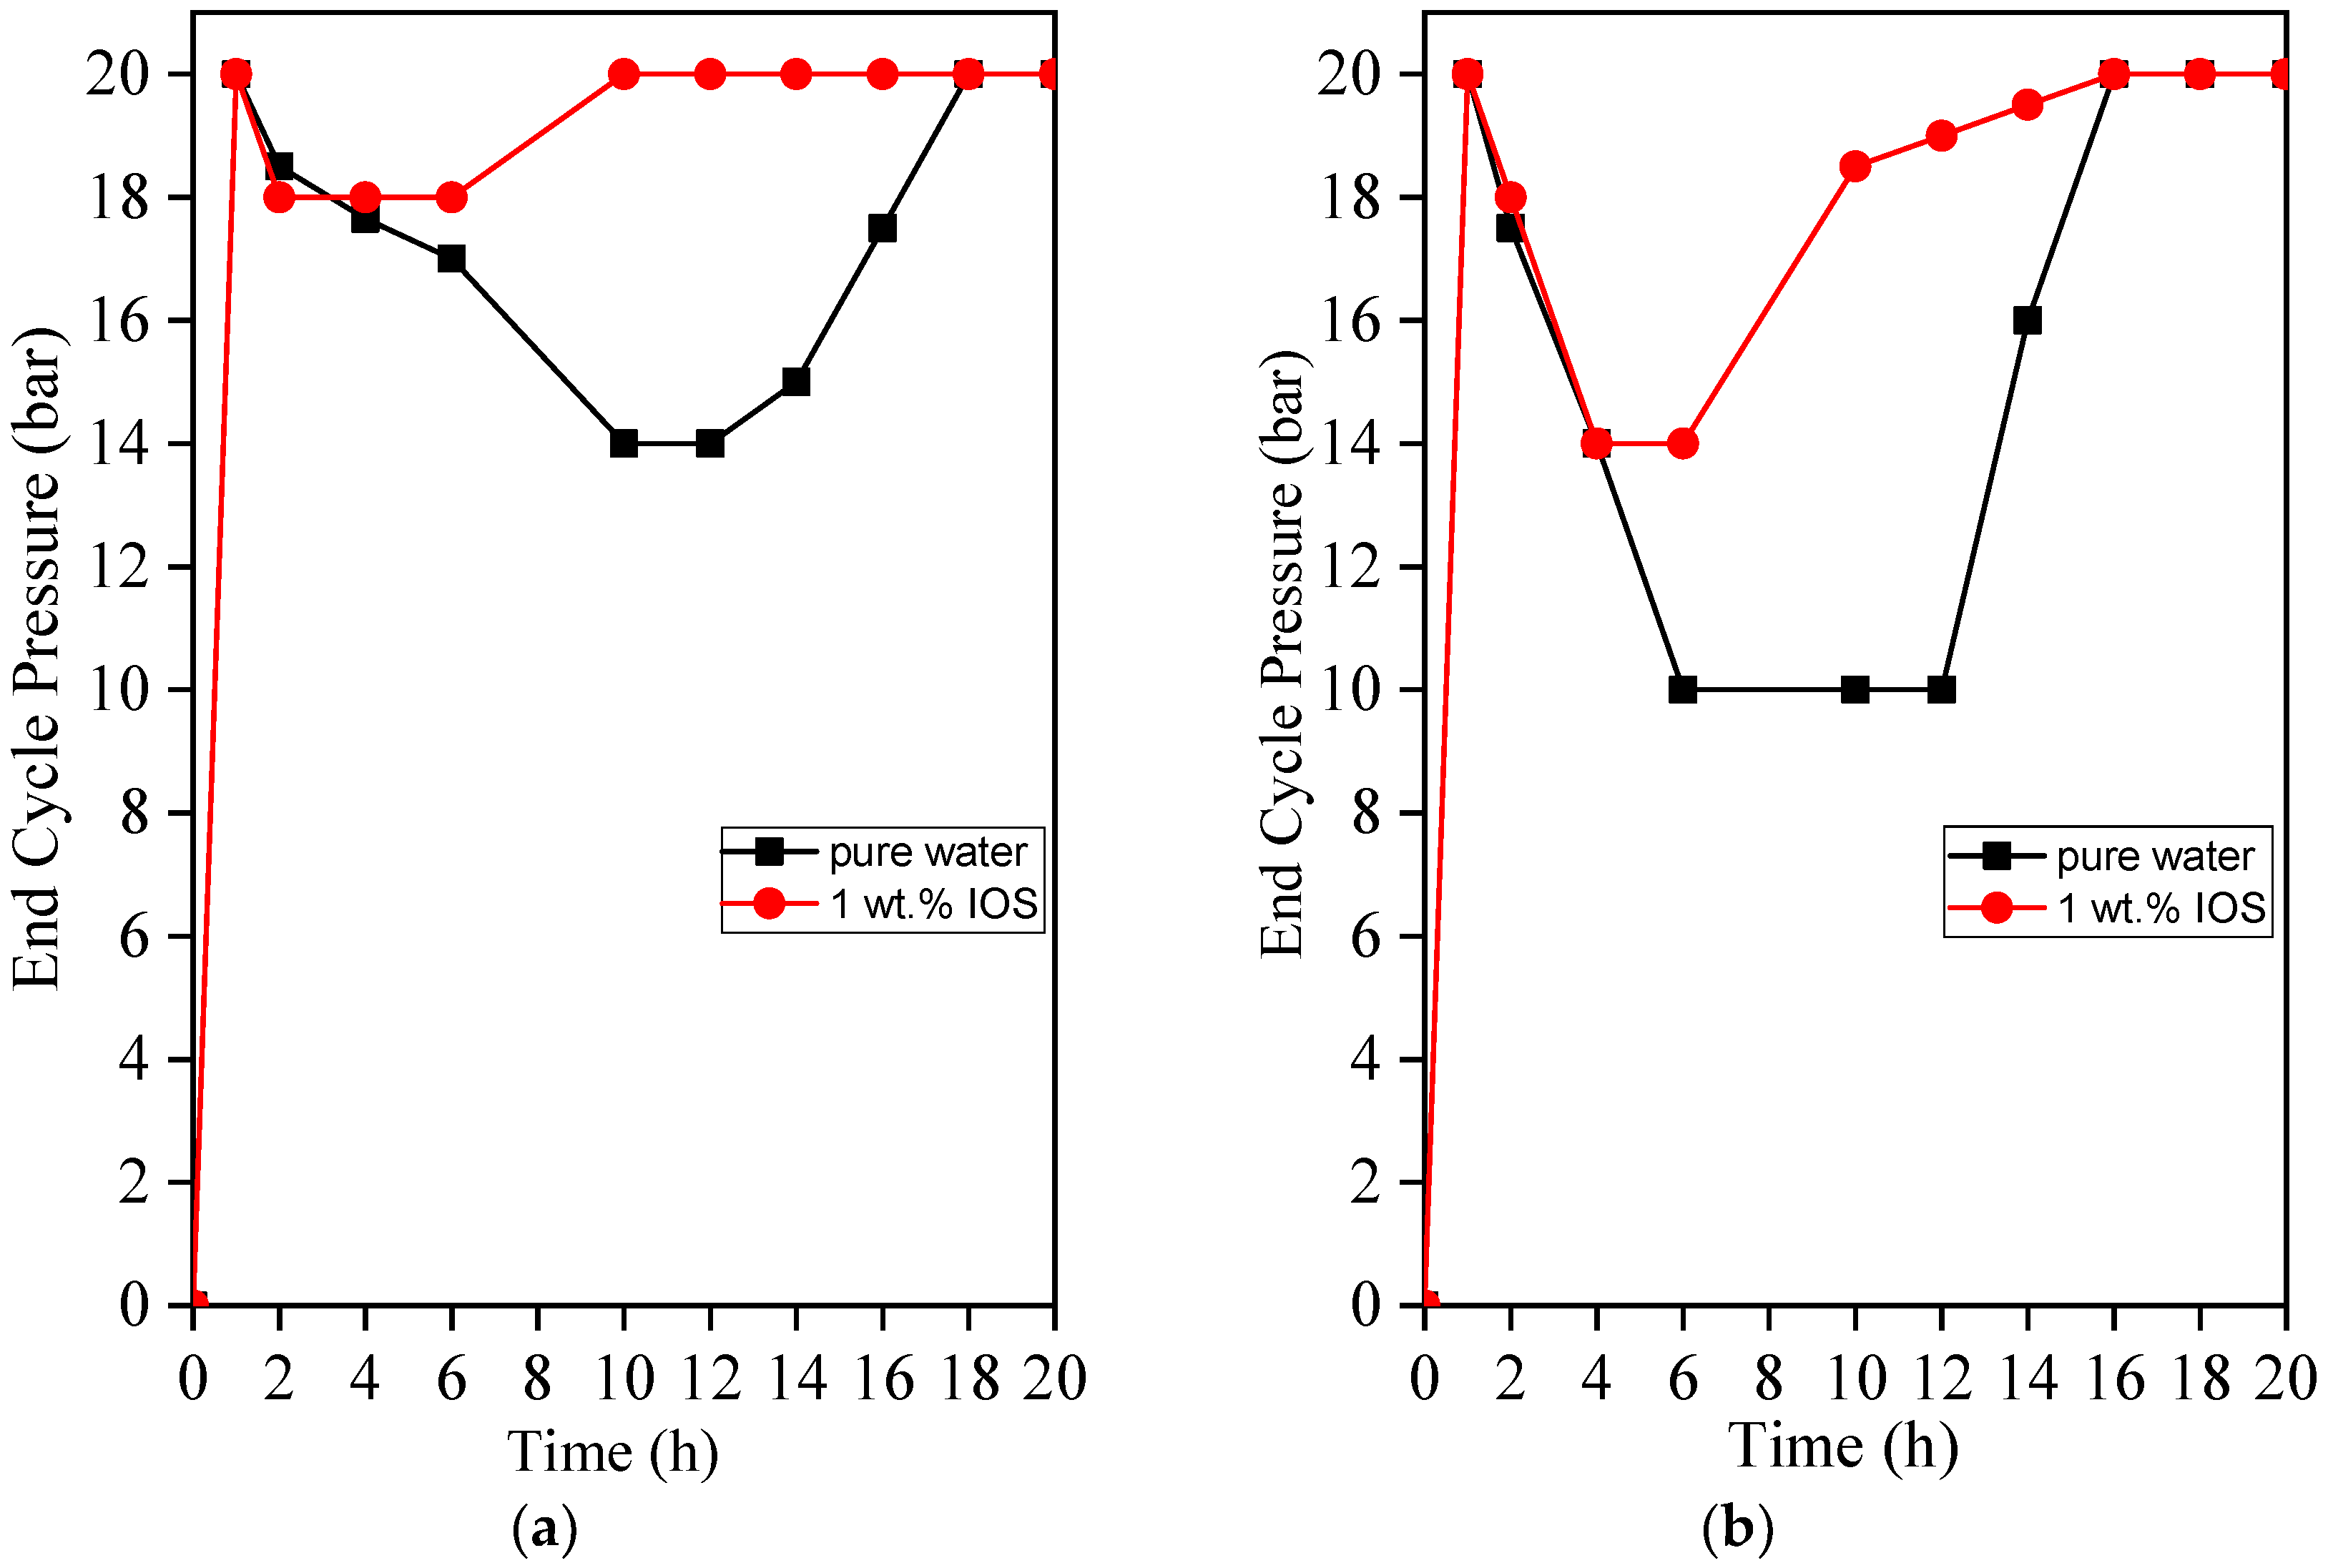
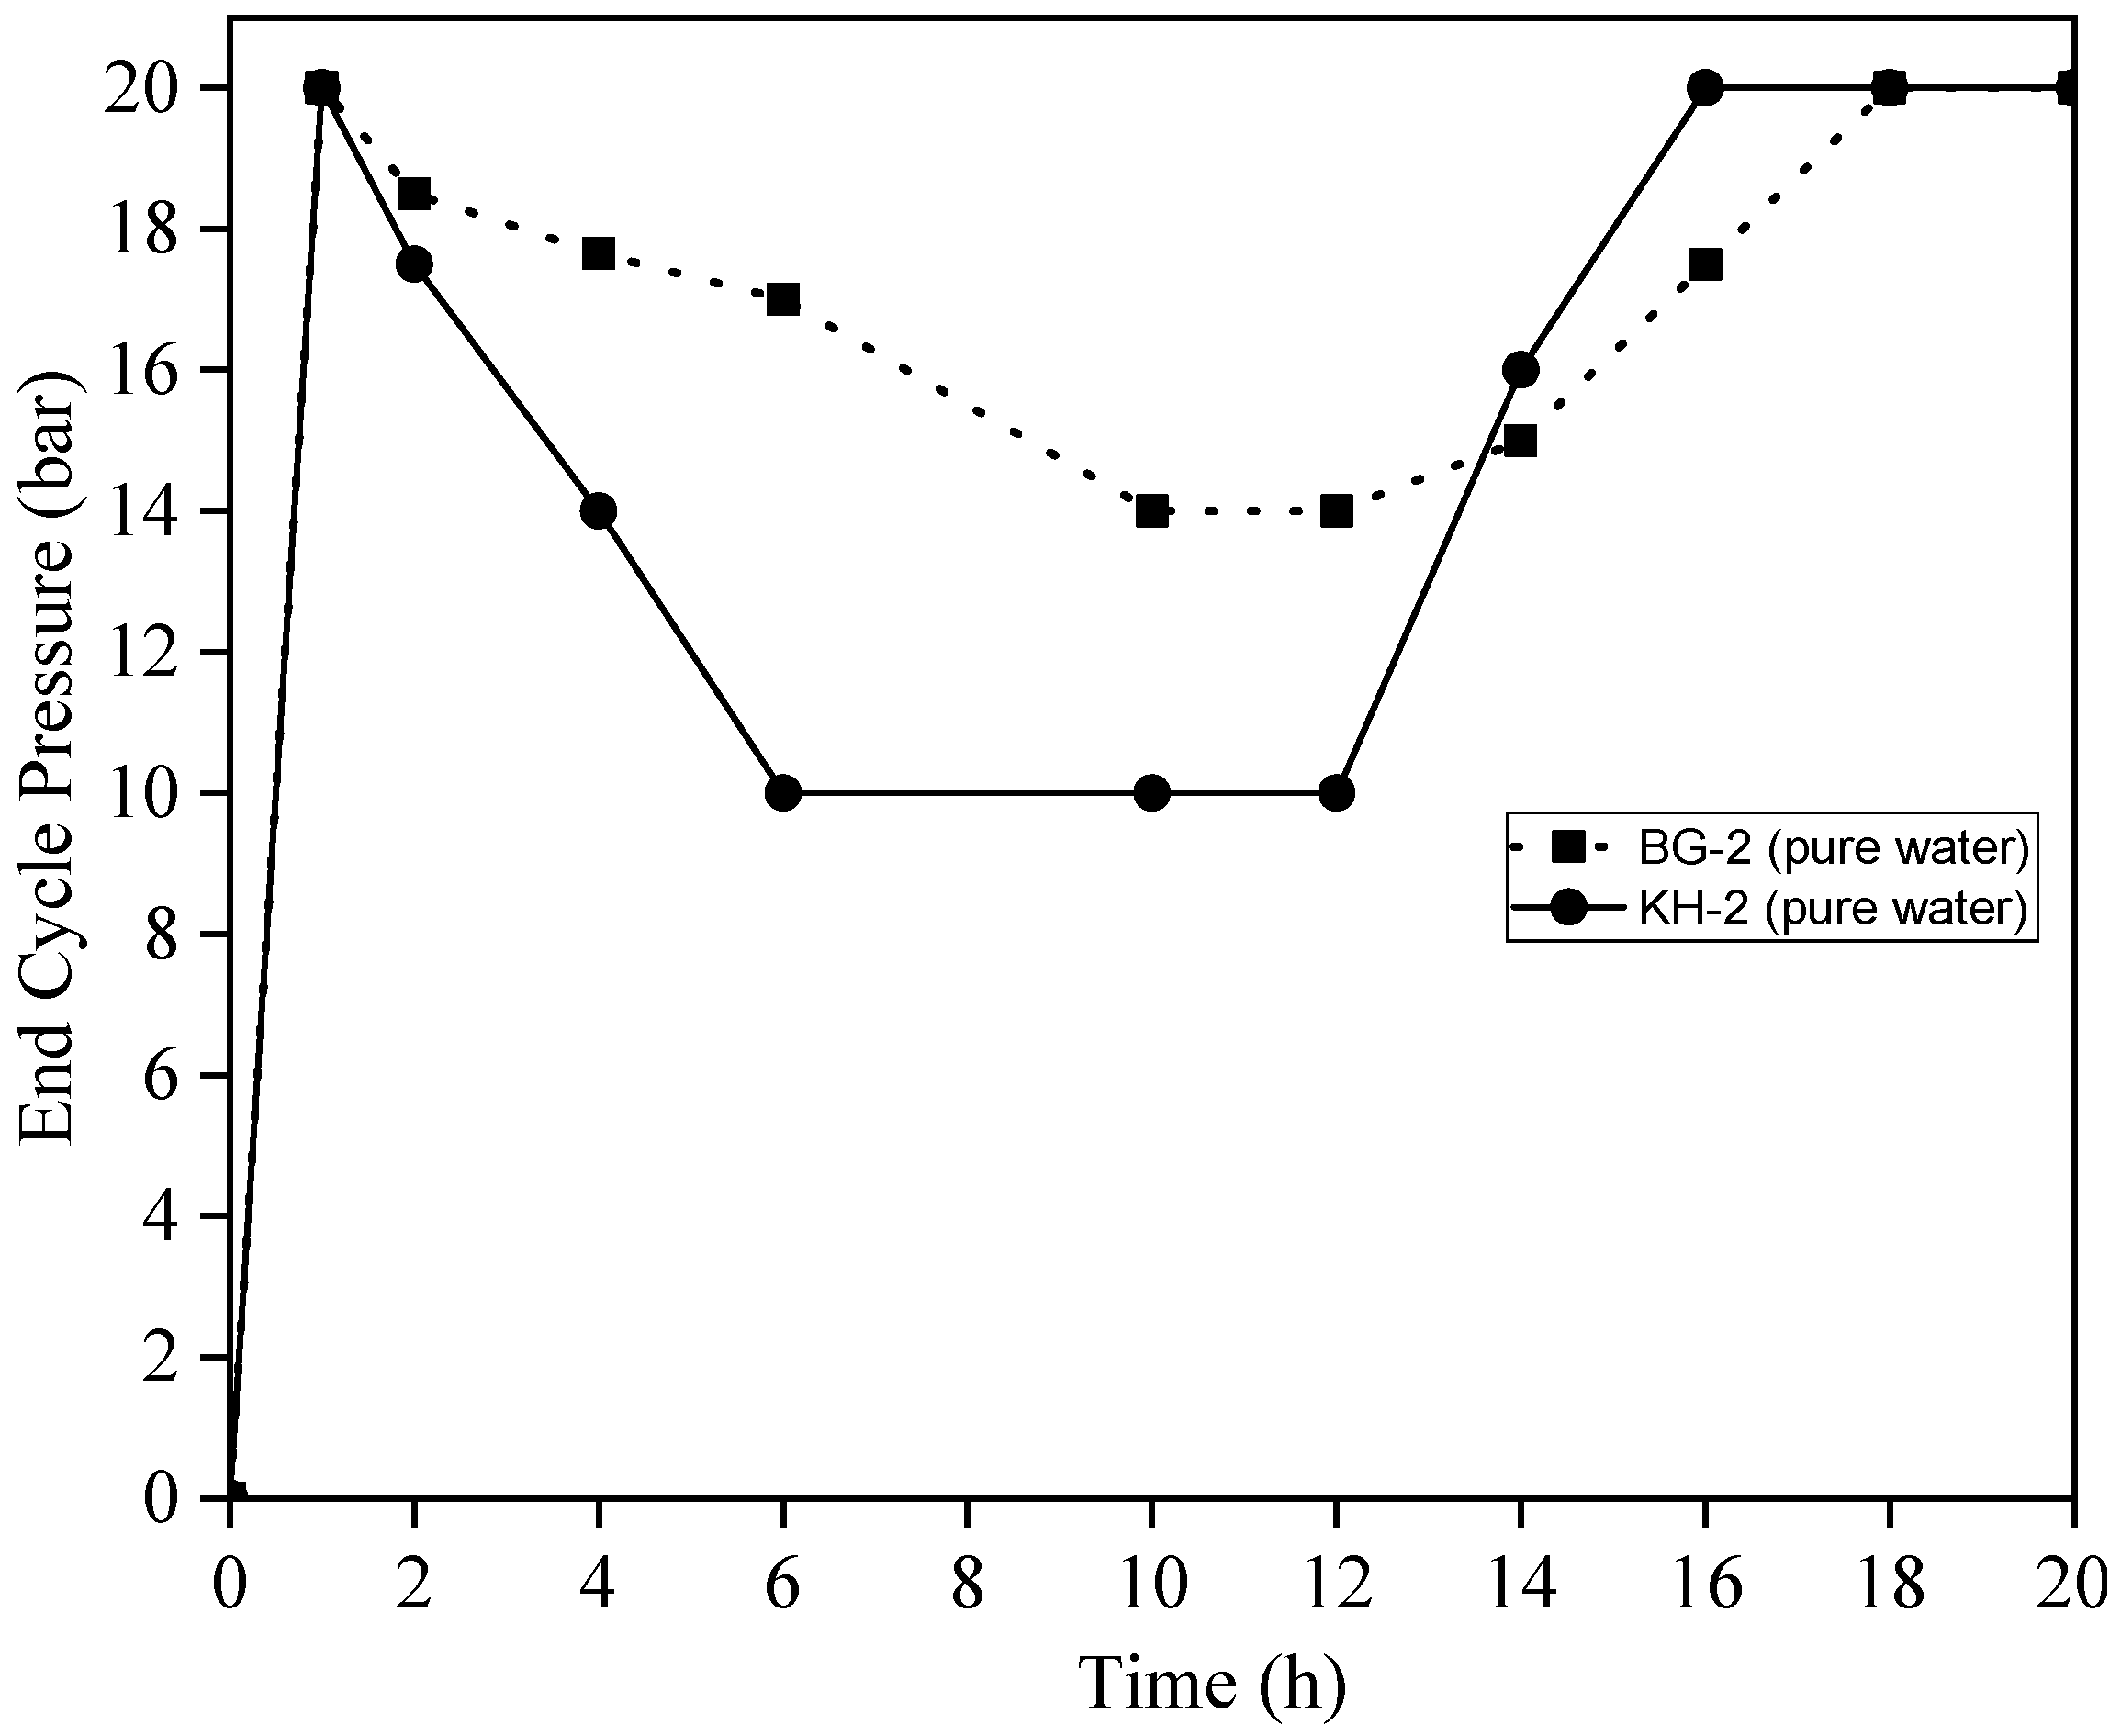
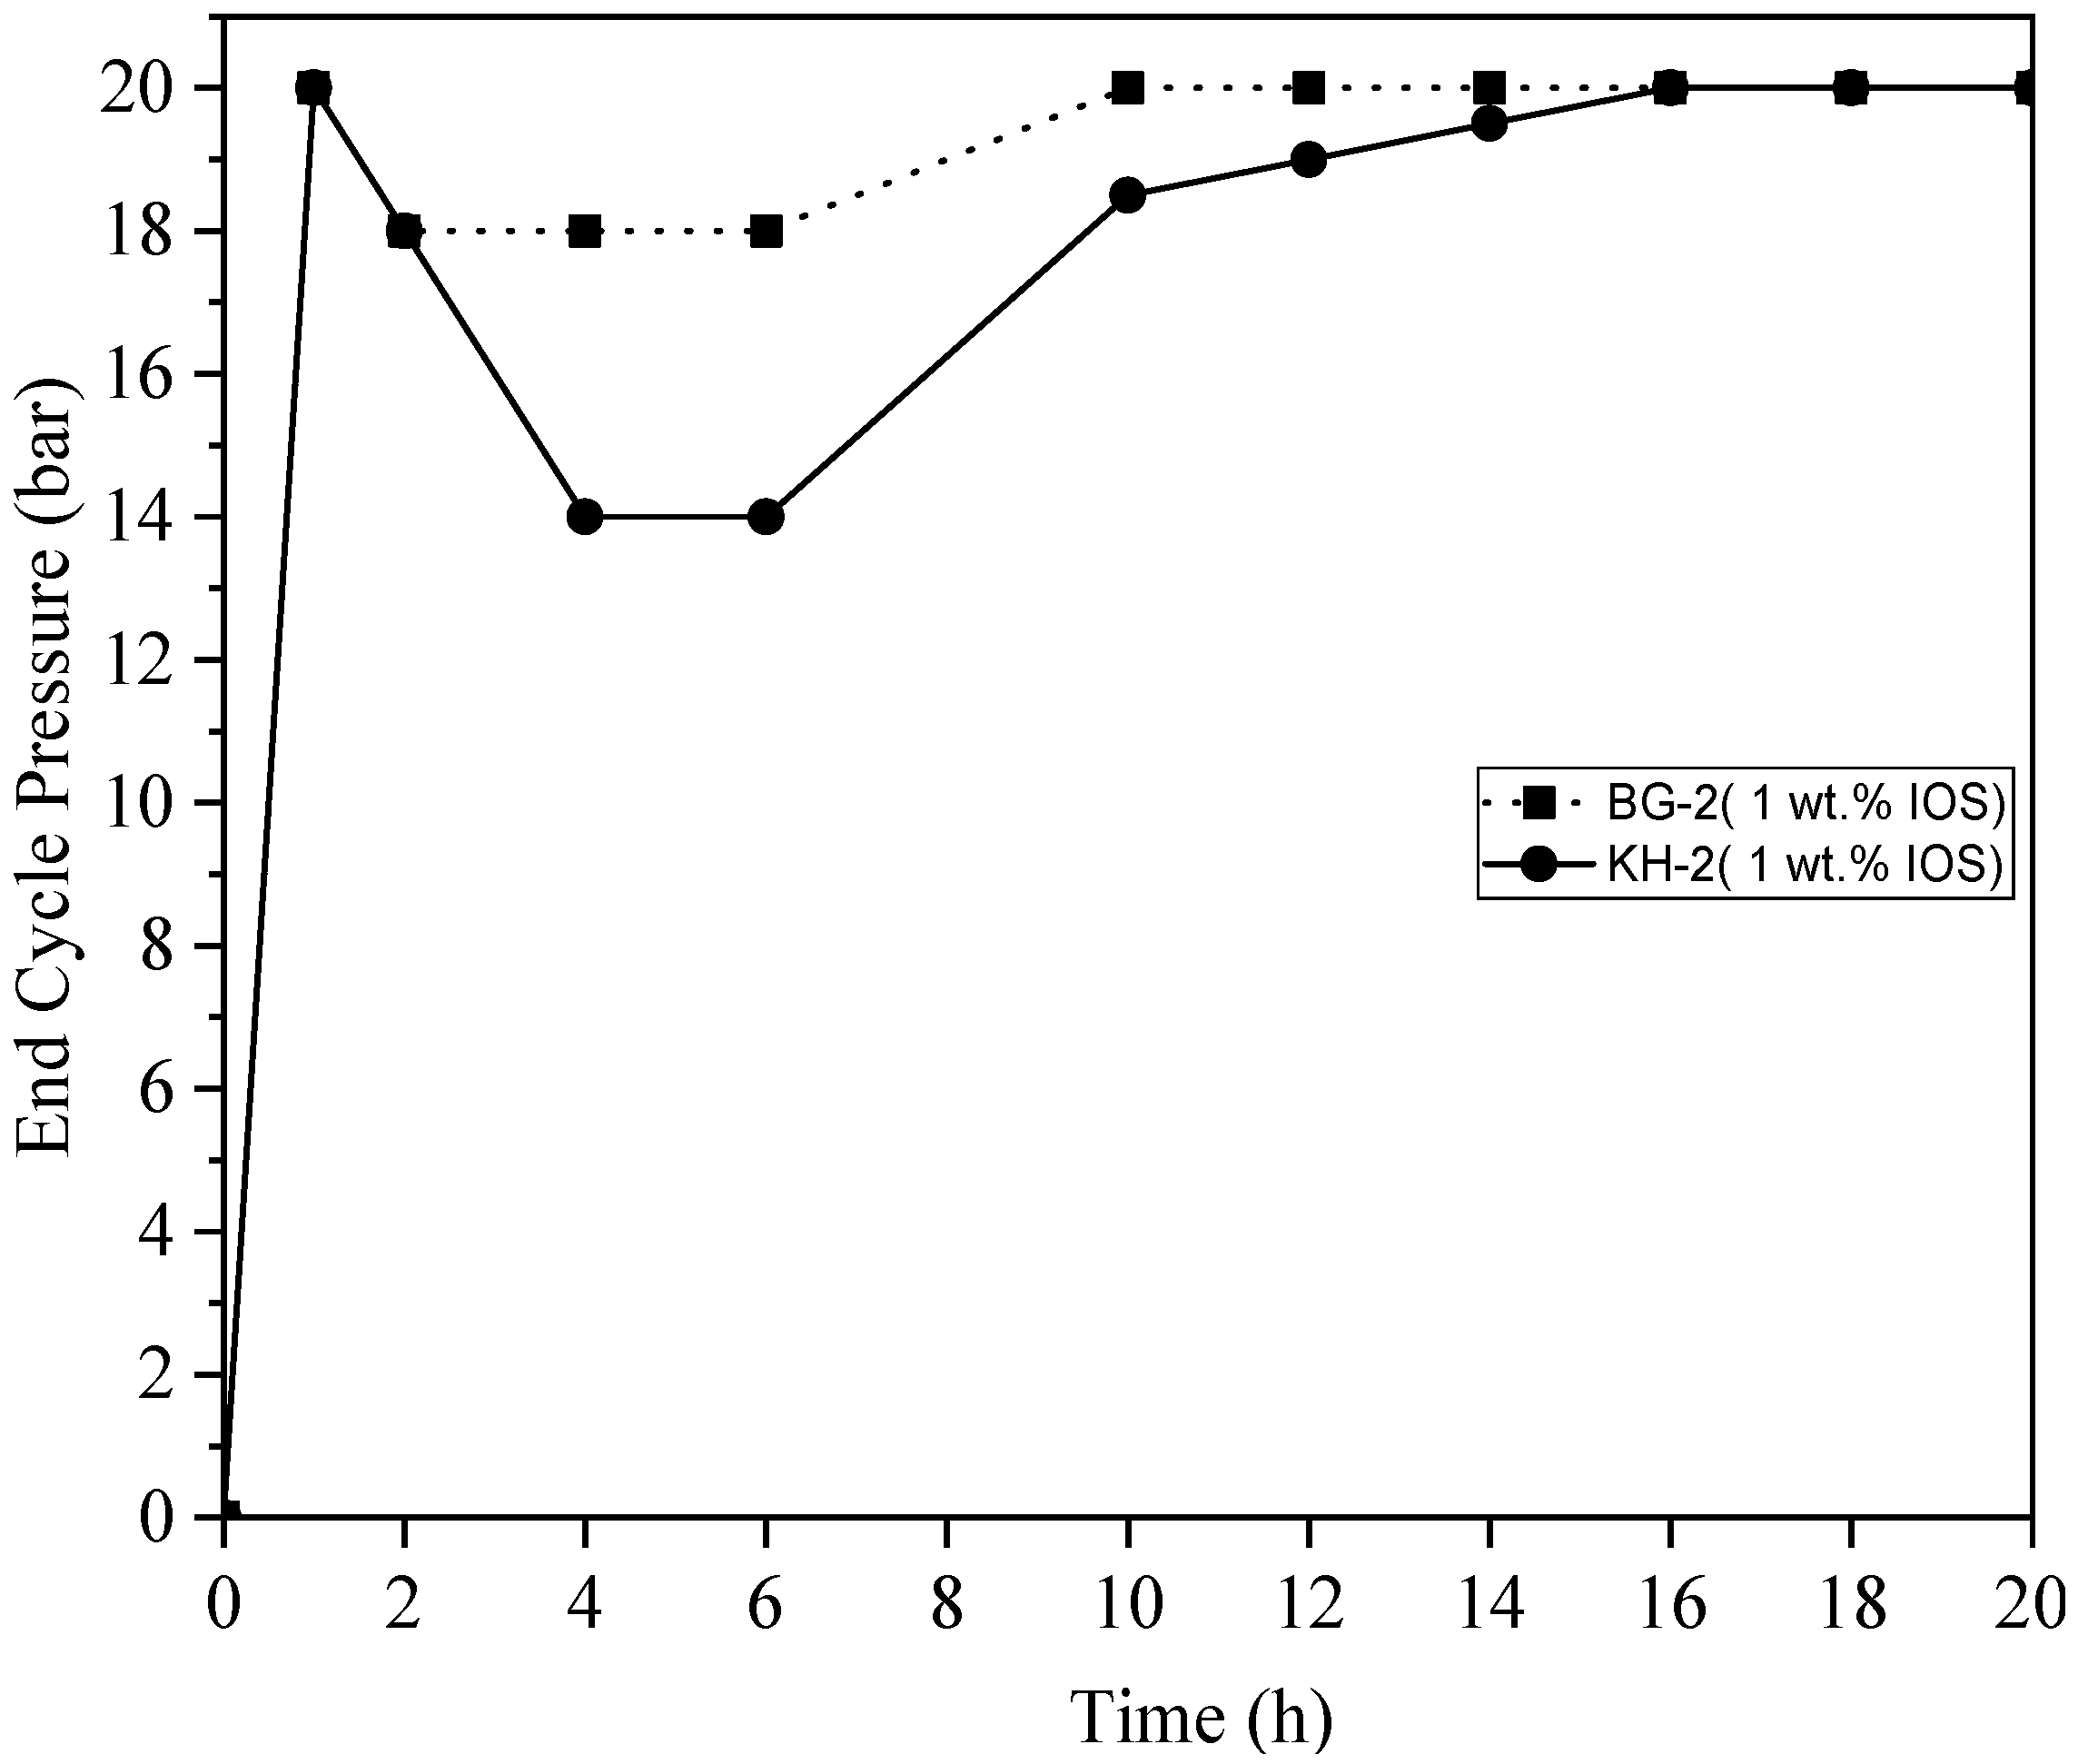
3.6. End Cycle Pressure vs. Time
4. Conclusions
Author Contributions
Funding
Acknowledgments
Conflicts of Interest
References
- Mokhatab, S.; Poe, W.A. Handbook of Natural Gas Transmission and Processing; Gulf Professional Publishing: Boston, MA, USA, 2012. [Google Scholar]
- Speight, J.G. The Chemistry and Technology of Petroleum; CRC Press: Boca Raton, FL, USA, 2014. [Google Scholar]
- Novlesky, A.; Kumar, A.; Merkle, S. Shale Gas Modeling Workflow: From Microseismic to Simulation–A Horn River Case Study. In Proceedings of the 2011 Canadian Unconventional Resources Conference, Calgary, AB, Canada, 15–17 November 2011; p. 24. [Google Scholar]
- Yang, L.; Ge, H.; Shi, X.; Cheng, Y.; Zhang, K.; Chen, H.; Shen, Y.; Zhang, J.; Qu, X. The effect of microstructure and rock mineralogy on water imbibition characteristics in tight reservoirs. J. Nat. Gas Sci. Eng. 2016, 34, 1461–1471. [Google Scholar] [CrossRef]
- Rivard, C.; Lavoie, D.; Lefebvre, R.; Séjourné, S.; Lamontagne, C.; Duchesne, M. An overview of Canadian shale gas production and environmental concerns. Int. J. Coal Geol. 2014, 126, 64–76. [Google Scholar] [CrossRef]
- Sydansk, R.D. Hydraulic Fracturing Process. U.S. Patent 5,711,376, 27 January 1998. [Google Scholar]
- Atherton, F.; Bradfield, M.; Christmas, K.; Dalton, S.; Dusseault, M.; Gagnon, G.; Hayes, B.; MacIntosh, C.; Mauro, I.; Ritcey, R.; et al. Report of the Nova Scotia Independent Panel on Hydraulic Fracturing. Available online: https://energy.novascotia.ca/sites/default/files/Report%20of%20the%20Nova%20Scotia%20Independent%20Panel%20on%20Hydraulic%20Fracturing.pdf (accessed on 30 November 2018).
- Cherry, J.; Ben-Eli, M.; Bharadwaj, L.; Chalaturnyk, R.; Dusseault, M.B.; Goldstein, B.; Lacoursière, J.-P.; Matthews, R.; Mayer, B.; Molson, J. Environmental Impacts of Shale Gas Extraction in Canada; Council of Canadian Academies: Ottawa, ON, Canada, 2014. [Google Scholar]
- King, G.E. Hydraulic fracturing 101: What every representative, environmentalist, regulator, reporter, investor, university researcher, neighbor, and engineer should know about hydraulic fracturing risk. J. Petrol. Technol. 2012, 64, 34–42. [Google Scholar] [CrossRef]
- Shen, Y.; Ge, H.; Meng, M.; Jiang, Z.; Yang, X. Effect of water imbibition on shale permeability and its influence on gas production. Energy Fuels 2017, 31, 4973–4980. [Google Scholar] [CrossRef]
- Engelder, T.; Cathles, L.M.; Bryndzia, L.T. The fate of residual treatment water in gas shale. J. Unconv. Oil Gas Resour. 2014, 7, 33–48. [Google Scholar] [CrossRef]
- Penny, G.S.; Dobkins, T.A.; Pursley, J.T. Field Study of Completion Fluids To Enhance Gas Production in the Barnett Shale. In Proceedings of the 2006 SPE Gas Technology Symposium, Calgary, AB, Canada, 15–18 May 2006; p. 10. [Google Scholar]
- Nicot, J.-P.; Scanlon, B.R. Water use for shale-gas production in Texas, US. Environ. Sci. Technol. 2012, 46, 3580–3586. [Google Scholar] [CrossRef] [PubMed]
- Makhanov, K.; Habibi, A.; Dehghanpour, H.; Kuru, E. Liquid uptake of gas shales: A workflow to estimate water loss during shut-in periods after fracturing operations. J. Unconv. Oil Gas Resour. 2014, 7, 22–32. [Google Scholar] [CrossRef]
- Reagan, M.T.; Moridis, G.J.; Keen, N.D.; Johnson, J.N. Numerical simulation of the environmental impact of hydraulic fracturing of tight/shale gas reservoirs on near-surface groundwater: Background, base cases, shallow reservoirs, short-term gas, and water transport. Water Resour. Res. 2015, 51, 2543–2573. [Google Scholar] [CrossRef] [PubMed]
- Sun, Y.; Bai, B.; Wei, M. Microfracture and surfactant impact on linear cocurrent brine imbibition in gas-saturated shale. Energy Fuels 2015, 29, 1438–1446. [Google Scholar] [CrossRef]
- Vengosh, A.; Jackson, R.B.; Warner, N.; Darrah, T.H.; Kondash, A. A critical review of the risks to water resources from unconventional shale gas development and hydraulic fracturing in the United States. Environ. Sci. Technol. 2014, 48, 8334–8348. [Google Scholar] [CrossRef] [PubMed]
- DiGiulio, D.C.; Wilkin, R.T.; Miller, C.; Oberley, G. Investigation of Ground Water Contamination Near Pavillion. Presented at the Wyoming Workgroup Meeting, Pavillion, WY, USA, 30 November 2011. [Google Scholar]
- Ge, H.-K.; Yang, L.; Shen, Y.-H.; Ren, K.; Meng, F.-B.; Ji, W.-M.; Wu, S. Experimental investigation of shale imbibition capacity and the factors influencing loss of hydraulic fracturing fluids. Pet. Sci. 2015, 12, 636–650. [Google Scholar] [CrossRef]
- Vidic, R.D.; Brantley, S.L.; Vandenbossche, J.M.; Yoxtheimer, D.; Abad, J.D. Impact of shale gas development on regional water quality. Science 2013, 340, 1235009. [Google Scholar] [CrossRef] [PubMed]
- Cheng, Y. Impact of water dynamics in fractures on the performance of hydraulically fractured wells in gas-shale reservoirs. J. Can. Pet. Technol. 2012, 51, 143–151. [Google Scholar] [CrossRef]
- Yan, Q.; Lemanski, C.; Karpyn, Z.T.; Ayala, L. Experimental investigation of shale gas production impairment due to fracturing fluid migration during shut-in time. J. Nat. Gas Sci. Eng. 2015, 24, 99–105. [Google Scholar] [CrossRef]
- Wright, P.R.; McMahon, P.B.; Mueller, D.K.; Clark, M.L. Groundwater-Quality and Quality-Control Data for Two Monitoring wells Near Pavillion, Wyoming, April and May 2012; 2327-638X; US Geological Survey: Reston, VA, USA, 2012.
- Thyne, G. Review of Phase II Hydrogeologic Study. Available online: https://www.garfield-county.com/oil-gas/documents/Thyne%20FINAL%20Report%2012[1].20.08.pdf (accessed on 30 November 2018).
- Birdsell, D.T.; Rajaram, H.; Dempsey, D.; Viswanathan, H.S. Hydraulic fracturing fluid migration in the subsurface: A review and expanded modeling results. Water Resour. Res. 2015, 51, 7159–7188. [Google Scholar] [CrossRef]
- Myers, T. Potential contaminant pathways from hydraulically fractured shale to aquifers. Groundwater 2012, 50, 872–882. [Google Scholar] [CrossRef] [PubMed]
- Taherdangkoo, R.; Tatomir, A.; Taylor, R.; Sauter, M. Numerical investigations of upward migration of fracking fluid along a fault zone during and after stimulation. Energy Procedia 2017, 125, 126–135. [Google Scholar] [CrossRef]
- Tatomir, A.; McDermott, C.; Bensabat, J.; Class, H.; Edlmann, K.; Taherdangkoo, R.; Sauter, M. Conceptual model development using a generic Features, Events, and Processes (FEP) database for assessing the potential impact of hydraulic fracturing on groundwater aquifers. Adv. Geosci. 2018, 45, 185–192. [Google Scholar] [CrossRef]
- Gallegos, T.J.; Varela, B.A.; Haines, S.S.; Engle, M.A. Hydraulic fracturing water use variability in the United States and potential environmental implications. Water Resour. Res. 2015, 51, 5839–5845. [Google Scholar] [CrossRef] [PubMed]
- Sharma, M.; Agrawal, S. Impact of Liquid Loading in Hydraulic Fractures on Well Productivity. In Proceedings of the 2013 SPE Hydraulic Fracturing Technology Conference, The Woodlands, TX, USA, 4–6 February 2013; p. 16. [Google Scholar]
- Shanley, K.W.; Cluff, R.M.; Robinson, J.W. Factors controlling prolific gas production from low-permeability sandstone reservoirs: Implications for resource assessment, prospect development, and risk analysis. AAPG Bull. 2004, 88, 1083–1121. [Google Scholar] [CrossRef]
- Hematpour, H.; Mahmood, S.M.; Nasr, N.H.; Elraies, K.A. Foam flow in porous media: Concepts, models and challenges. J. Nat. Gas Sci. Eng. 2018. [Google Scholar] [CrossRef]
- Dehghanpour, H.; Lan, Q.; Saeed, Y.; Fei, H.; Qi, Z. Spontaneous imbibition of brine and oil in gas shales: Effect of water adsorption and resulting microfractures. Energy Fuels 2013, 27, 3039–3049. [Google Scholar] [CrossRef]
- Abdulelah, H.; Mahmood, S.M.; Al-Mutarreb, A. The Effect of Anionic Surfactant on the Wettability of Shale and its Implication on Gas Adsorption/Desorption Behavior. Energy Fuels 2018. [Google Scholar] [CrossRef]
- Settari, A.; Sullivan, R.B.; Bachman, R.C. The Modeling of the Effect of Water Blockage and Geomechanics in Waterfracs. In Proceedings of the 2002 SPE Annual Technical Conference and Exhibition, San Antonio, TX, USA, 29 September–2 October 2002; p. 7. [Google Scholar]
- Fisher, M.K.; Warpinski, N.R. Hydraulic-fracture-height growth: Real data. SPE. Prod. Oper. 2012, 27, 8–19. [Google Scholar] [CrossRef]
- Huynh, U.T. Surfactant Characterization to Improve Water Recovery in Shale Gas Reservoirs; The University of Texas at Austin: Austin, TX, USA, 2013. [Google Scholar]
- Patel, P.S.; Robart, C.J.; Ruegamer, M.; Yang, A. Analysis of US Hydraulic Fracturing Fluid System and Proppant Trends. In Proceedings of the 2014 SPE Hydraulic Fracturing Technology Conference, The Woodlands, TX, USA, 4–6 February 2014; p. 20. [Google Scholar]
- Zhou, L.; Das, S.; Ellis, B.R. Effect of surfactant adsorption on the wettability alteration of gas-bearing shales. Environ. Eng. Sci. 2016, 33, 766–777. [Google Scholar] [CrossRef]
- Al-Mutarreb, A.; Jufar, S.R.; Abdulelah, H.; Padmanabhan, E. Influence of Water Immersion on Pore System and Methane Desorption of Shales: A Case Study of Batu Gajah and Kroh Shale Formations in Malaysia. Energies 2018, 11, 1511. [Google Scholar] [CrossRef]
- Baioumy, H.; Ulfa, Y.; Nawawi, M.; Padmanabhan, E.; Anuar, M.N.A. Mineralogy and geochemistry of Palaeozoic black shales from Peninsular Malaysia: Implications for their origin and maturation. Int. J. Coal Geol. 2016, 165, 90–105. [Google Scholar] [CrossRef]
- Wang, D.; Butler, R.; Zhang, J.; Seright, R. Wettability survey in Bakken shale with surfactant-formulation imbibition. SPE Reservoir Eval. Eng. 2012, 15, 695–705. [Google Scholar] [CrossRef]
- Semple, T.C.; Reznik, C.; Barnes, J.R.; Buechele, J.L.; Dubey, S.T.; King, T.E. Use of Long Chain Internal Olefin Sulfonates. U.S. Patent 2014/0353250 A1, 4 December 2014. [Google Scholar]
- Nasr, N.H.; Mahmood, S.M.; Hematpur, H. A rigorous approach to analyze bulk and coreflood foam screening tests. J. Pet. Explor. Prod. Technol. 2018, 1–14. [Google Scholar]
- Mutalib, M.A.; Rahman, M.; Othman, M.; Ismail, A.; Jaafar, J. Scanning Electron Microscopy (SEM) and Energy-Dispersive X-Ray (EDX) Spectroscopy. In Membrane Characterization; Elsevier: Amsterdam, The Netherlands, 2017; pp. 161–179. [Google Scholar]
- Chen, Y.; Zou, C.; Mastalerz, M.; Hu, S.; Gasaway, C.; Tao, X. Applications of micro-fourier transform infrared spectroscopy (FTIR) in the geological sciences—A review. Int. J. Mol. Sci. 2015, 16, 30223–30250. [Google Scholar] [CrossRef] [PubMed]
- Cronauer, D.; Snyder, R.; Painter, P. Characterization of Oil Shale by FTIR Spectroscopy. Available online: https://web.anl.gov/PCS/acsfuel/preprint%20archive/Files/27_2_LAS%20VEGAS_03-82_0122.pdf (accessed on 28 November 2018).
- Akbari, S.; Mahmood, S.M.; Tan, I.M.; Ghaedi, H.; Ling, O.L. Assessment of Polyacrylamide Based Co-Polymers Enhanced by Functional Group Modifications with Regards to Salinity and Hardness. Polymers 2017, 9, 647. [Google Scholar] [CrossRef]
- En, U. Natural Stone Test Methods-Determination of Water Absorption at Atmospheric Pressure; British Standards Institution: London, UK, 2008. [Google Scholar]
- Ford, W.G.; Penny, G.S.; Briscoe, J.E. Enhanced water recovery improves stimulation results. SPE Prod. Eng. 1988, 3, 515–521. [Google Scholar] [CrossRef]
- Khraisheh, M.A.; Al-degs, Y.S.; Mcminn, W.A. Remediation of wastewater containing heavy metals using raw and modified diatomite. Chem. Eng. J. 2004, 99, 177–184. [Google Scholar] [CrossRef]
- Van der Marel, H.W.; Beutelspacher, H. Atlas of Infrared Spectroscopy of Clay Minerals and Their Admixtures; Elsevier Publishing Company: Amsterdam, The Netherlands, 1976. [Google Scholar]
- Haberhauer, G.; Rafferty, B.; Strebl, F.; Gerzabek, M. Comparison of the composition of forest soil litter derived from three different sites at various decompositional stages using FTIR spectroscopy. Geoderma 1998, 83, 331–342. [Google Scholar] [CrossRef]


| Sample ID | Color | Geological Age | Thermal Maturity | Formation | Country |
|---|---|---|---|---|---|
| BG-2 | Grey | Carboniferous * | Over-matured * | Batu Gajah | Malaysia |
| KH-2 | Black | Ordovician-Devonian * | Over-matured * | Kroh | Malaysia |
| Commercial Name | Type | Key Properties | Supplier |
|---|---|---|---|
| ENORDET O332 | Anionic surfactant | Appearance: Colorless. Liquid at room temperature; pH: 9–12 Density: 0.7 g/cm3 density at 23 °C Active matter (%): 28.03 Carbon atoms numbers: 15–18 Critical micelle concentration: 0.05% * | SHELL |
| Sample ID | Non-Clay Minerals (wt.%) | Clay Minerals (wt.%) | ||||||||||
|---|---|---|---|---|---|---|---|---|---|---|---|---|
| Quartz | Kpsar | Clacite | Total (%) | Kaolinite | Smectite | Illite | Chlorite | Muscovite | Biotite | Dickite | Total (%) | |
| BG-2 | 29.3 | 12.8 | 1.3 | 43.4 | 6.3 | 12.7 | 23.1 | 5 | 9.3 | 0.1 | NA | 56.6 |
| KH-2 | 66 | 7.2 | 0.8 | 74.5 | 2.8 | 9.7 | 9.7 | 1.9 | NA | 0.9 | 0.5 | 25.5 |
© 2018 by the authors. Licensee MDPI, Basel, Switzerland. This article is an open access article distributed under the terms and conditions of the Creative Commons Attribution (CC BY) license (http://creativecommons.org/licenses/by/4.0/).
Share and Cite
Abdulelah, H.; Mahmood, S.M.; Al-Hajri, S.; Hakimi, M.H.; Padmanabhan, E. Retention of Hydraulic Fracturing Water in Shale: The Influence of Anionic Surfactant. Energies 2018, 11, 3342. https://doi.org/10.3390/en11123342
Abdulelah H, Mahmood SM, Al-Hajri S, Hakimi MH, Padmanabhan E. Retention of Hydraulic Fracturing Water in Shale: The Influence of Anionic Surfactant. Energies. 2018; 11(12):3342. https://doi.org/10.3390/en11123342
Chicago/Turabian StyleAbdulelah, Hesham, Syed M. Mahmood, Sameer Al-Hajri, Mohammad Hail Hakimi, and Eswaran Padmanabhan. 2018. "Retention of Hydraulic Fracturing Water in Shale: The Influence of Anionic Surfactant" Energies 11, no. 12: 3342. https://doi.org/10.3390/en11123342
APA StyleAbdulelah, H., Mahmood, S. M., Al-Hajri, S., Hakimi, M. H., & Padmanabhan, E. (2018). Retention of Hydraulic Fracturing Water in Shale: The Influence of Anionic Surfactant. Energies, 11(12), 3342. https://doi.org/10.3390/en11123342