1. Introduction
Global installed hydropower capacity has been growing in recent years by an average of 24.2 GW per year. The International Energy Agency has predicted the long-term deployment of hydropower. Installed hydropower capacity will increase to nearly twice the current level of 1947 GW by 2050 [
1]. Hydropower plants can be classified based on the installed power generation capacity [
2]. When the installed capacity of a hydropower plant is below 10 MW, it is called a small hydropower plant; when the capacity is up to 100 kW, it is called a micro hydropower plant; and when the capacity is below 10 kW, it is called a mini or pico hydropower plant. Micro and pico hydropower plants are usually in the form of run-of-river schemes [
3]. Run-of-river hydropower plants are useful in remote areas where there is a need for energy for human development. At the same time, these plants can create sustainable energy with minimal impact to the surrounding area and communities. Electrical production of run-of-river hydropower plants depends on the locally available water resources. In general, the purpose of a hydropower system is to convert the potential energy of the river into mechanical energy in a turbine shaft, which is connected with an electric generator. The output of a hydropower plant is given in terms of power (kW) and electricity production (kWh). The power input is a function of water flow and net head. These variables are needed for evaluating the installed capacity and determining the appropriate turbine type and size.
Some researchers have presented the advantages of installing several small turbines instead of large ones. Using two or three smaller turbines allows easier control of water usage, although this requires more equipment and carries a higher operational cost [
3,
4]. Voros et al. [
5] presented a short-cut design of small run-of-river hydroelectric plants. The minimum and maximum value of water flow was used in this approach for maximizing economic benefits of investment. Montanri [
6] studied the economic compatibility of hydropower plants by regularizing the duration curve and the turbine efficiency. Hosseini et al. [
7] determined the optimal installation capacity of existing run-of-river small hydropower plants (SHPs) depending on the amount of annual energy, economy, and reliability. The water flow from the flow duration curve (FDC) was used to calculate the annual energy generated. Anagnostopoulos and Papantonis [
8] studied the optimal installation capacity of a run-of-river type SHP to assess the economic benefits of the investment. They optimized two parallel turbines of different types and sizes and found the net present value based on annual energy production. The water flow used in different operating ranges of the turbine is the key to more efficient operation. Santolin [
9] presented a techno-economical method for predicting the installed capacity of SHPs. A model was developed on the basis of the flow availability of the site, represented by the FDC. The influence of the design operating conditions based on the FDC was used to determine the turbine size and investment cost. Monterio et al. [
10] presented a novel short-term forecasting model of electric power production of existing SHPs. The available water flow was used to determine the power production, economy, and maintenance scheduling of the plants. Bortoni et al. [
11] presented a novel methodology for the optimal online operation of hydropower plants provided with a single penstock. This method used the flow rate and head value under several conditions for the optimal distribution of the dispatched power amount. Additionally, Paish [
12] presented plans for the future development of run-of-river hydropower plants. Future developments are toward the more accurate and rational sizing of systems to maximize their financial return.
Most researchers have focused their attention on the optimal installed capacity and the optimal turbine operation of existing hydropower plants based on the turbine operation flow rate range or the potential energy evaluation from the available water resource, as shown in
Table 1. They chose the design flow value from the proportion of time a certain streamflow is exceeded which is approximately between 90 to 95% of streamflow occurrence throughout the year from the FDC. Subsequently, the type and size of commercial hydro turbines were considered to optimize the energy production. The results can yield more than one type of turbine for the same operational condition. In general, designs of commercial hydro turbines are standardized, and are not customized for local water resources that are available for all seasons. These commercial turbines are not always operated consistently at the highest efficiency because the design of the turbines is usually determined by the manufacturers. This seems to guarantee that the turbine will operate nearly continuously. However, in reality the operation time is much less than 70%. This could be due to inaccurate FDCs or wrong type and size selection.
According to the Energy Policy and Planning Office, Thailand Ministry of Energy, Thailand has set a target to increase its number of SHPs in 2021 by 20% from the current level. Water resources in many areas of Thailand have been surveyed for the installation of SHPs [
13,
14]. Additionally, the Provincial Electricity Authority (PEA) has installed run-of-river SHPs in several remote communities in Northern Thailand [
15]. There are problems with the hydro turbine currently used by the PEA, as it cannot be operated continuously. The turbine can only work well during the rainy season, which lasts approximately five to six months. In dry seasons, the water flow into the system is quite low and not sufficient to operate the turbine. Average data collected over 25 years for six run-of-river SHPs of the PEA are shown in
Table 2, and confirm the problem that the average electrical power production value of each hydropower plant is quite different from the installed capacity. This is because the available streamflow value at each site was overestimated from the FDC in order to achieve a high installation capacity in the wet season. However, there is a problem in the dry season. Additionally, the ratio of average electrical power production to installed capacity for each hydropower plant capacity factor is less than 50%, which confirms the above problems and includes the effect of the economic returns from the project.
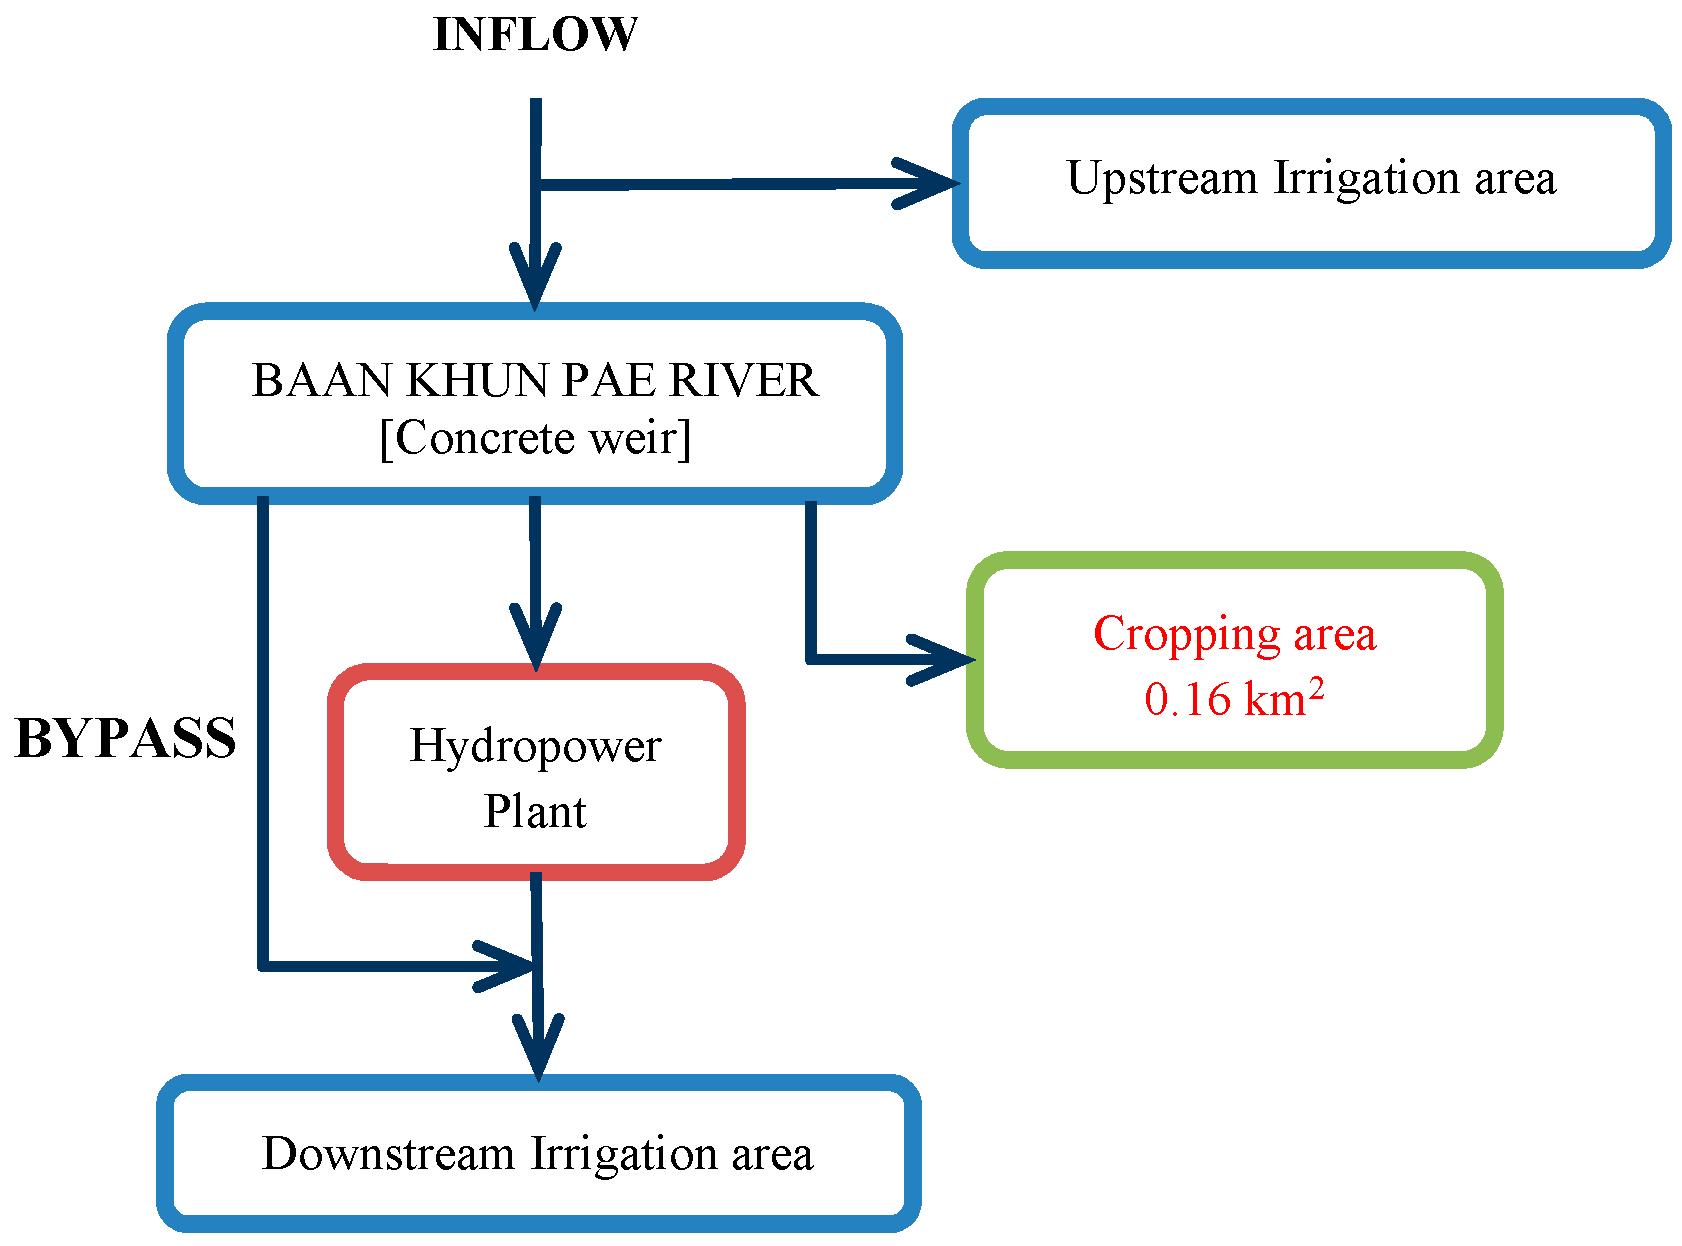
This paper presents a new way to obtain a more precise flow rate estimation without using the FDC method to determine the optimal turbine type and size, to allow consistent turbine operation throughout the year. This higher precision is obtained using the seasonal flow occurrence data, irrigation variability, and fitting a probability distribution function (PDF) using the observed flow data. This approach provides a more precise estimation than the FDC method. Additionally, for the turbine size selection, the use of the minimum and maximum flow rate of operation is used to optimize the operation time. The final results of this algorithm are optimal turbine type and size based on the maximum annual energy production. This case study uses actual streamflow data from the Baan Khun Pae River, Chom Thong District, Chiang Mai Province, Thailand, including information from the Baan Khun Pae micro hydropower plant.
3. Turbine Type Selection
The selection of the turbine depends upon the site characteristics. The main characteristics that should be considered to select the turbine type are the head and flow available, the desired running speed of the generator, and whether the turbine will be expected to operate in variable flow conditions. Hydro turbines can be classified into two main groups based on the flow pattern in the turbine and the specific speed. Based on the flow pattern, hydro turbines are categorized into three groups: high, medium, and low head. These are grouped into two categories: impulse and reaction turbines. The difference between impulse and reaction turbines can be explained by water pressure. When the water pressure applies a force on the face of the runner blades, which decreases as it proceeds through the turbines, these are called reaction turbines. A reaction turbine needs a higher volume flow rate to operate than an impulse turbine. There are three main types of reaction turbine used: the propeller, Kaplan, and Francis turbines. For impulse turbines, all the water pressure is converted into kinetic energy before entering the runner. Kinetic energy is in the form of a high-speed jet that strikes the buckets, mounted on the periphery of the runner. There are three main types of impulse turbines used: the Pelton, Turgo, and cross-flow turbines. All variables are related to the turbine specific speed. The specific speed of turbine types is the most suitable parameter on which to base the selection of a turbine. In general, low turbine specific speed of an impulse turbine corresponds to low flow rates and high heads, whereas high turbine specific speed of a reaction turbine corresponds to high flow rates and low heads. The turbine specific speed is given by the dimensionless parameter [
25]:
where
NS is the turbine specific speed,
NR is the angular velocity (rad/s),
QD is a design flow (m
3/s), and
HN is an effective head (m). Commonly, the micro hydro turbine should be operated at the normal speed of a standard generator. Therefore, the specific speed equation is used in this algorithm for selecting turbine type by fixing the turbine shaft speed. The normal operating ranges for the turbine specific speed and the effective head for each turbine type are shown in
Table 5.
4. Annual Energy Production Estimation
The energy potential of a run-of-river power plant is proportional to the flow and the head. Here, the operation range is used to estimate the annual energy production. The operation range of each turbine type is different. The turbine can operate when the water flow rate is between a minimum (
Qmin) and a maximum (
Qmax) value. Penche [
3] presented the minimum technical flow for different types of turbines. The minimum flow for each turbine type is given as a percentage of design flow as shown in
Table 6.
The design flow (
QD) or water flow rate through the turbine is determined by the following relationship as a function of the available streamflow (
Qav):
If the available streamflow is less than the minimum flow rate of the turbine, the turbine will shut down. On the other hand, if the available flow rate is more than the maximum flow rate of the turbine, the maximum flow rate or design flow will be used to operate the turbine because the intake gate and the difference of water level at the small weir of run-of-river will not affect the turbine performance. Therefore, the decision to select the design flow of each turbine type and size will be limited by Equation (2). In order to increase the reliability of micro hydro turbine operation and increase the accuracy of the potential energy estimation, the probability of streamflow occurrence is used to evaluate the maximum annual energy production, given by
where
E is the maximum annual energy production (kWh/year),
QD is the design flow (m
3/s),
HN is the effective head or net head (m),
Pri is the probability of streamflow occurrence within the range,
h is the number of operation hours within a year (h/year),
i is the sequence of streamflow range, and
n is the total number of streamflow ranges.
5. Optimal Turbine Type and Size Selection Algorithm
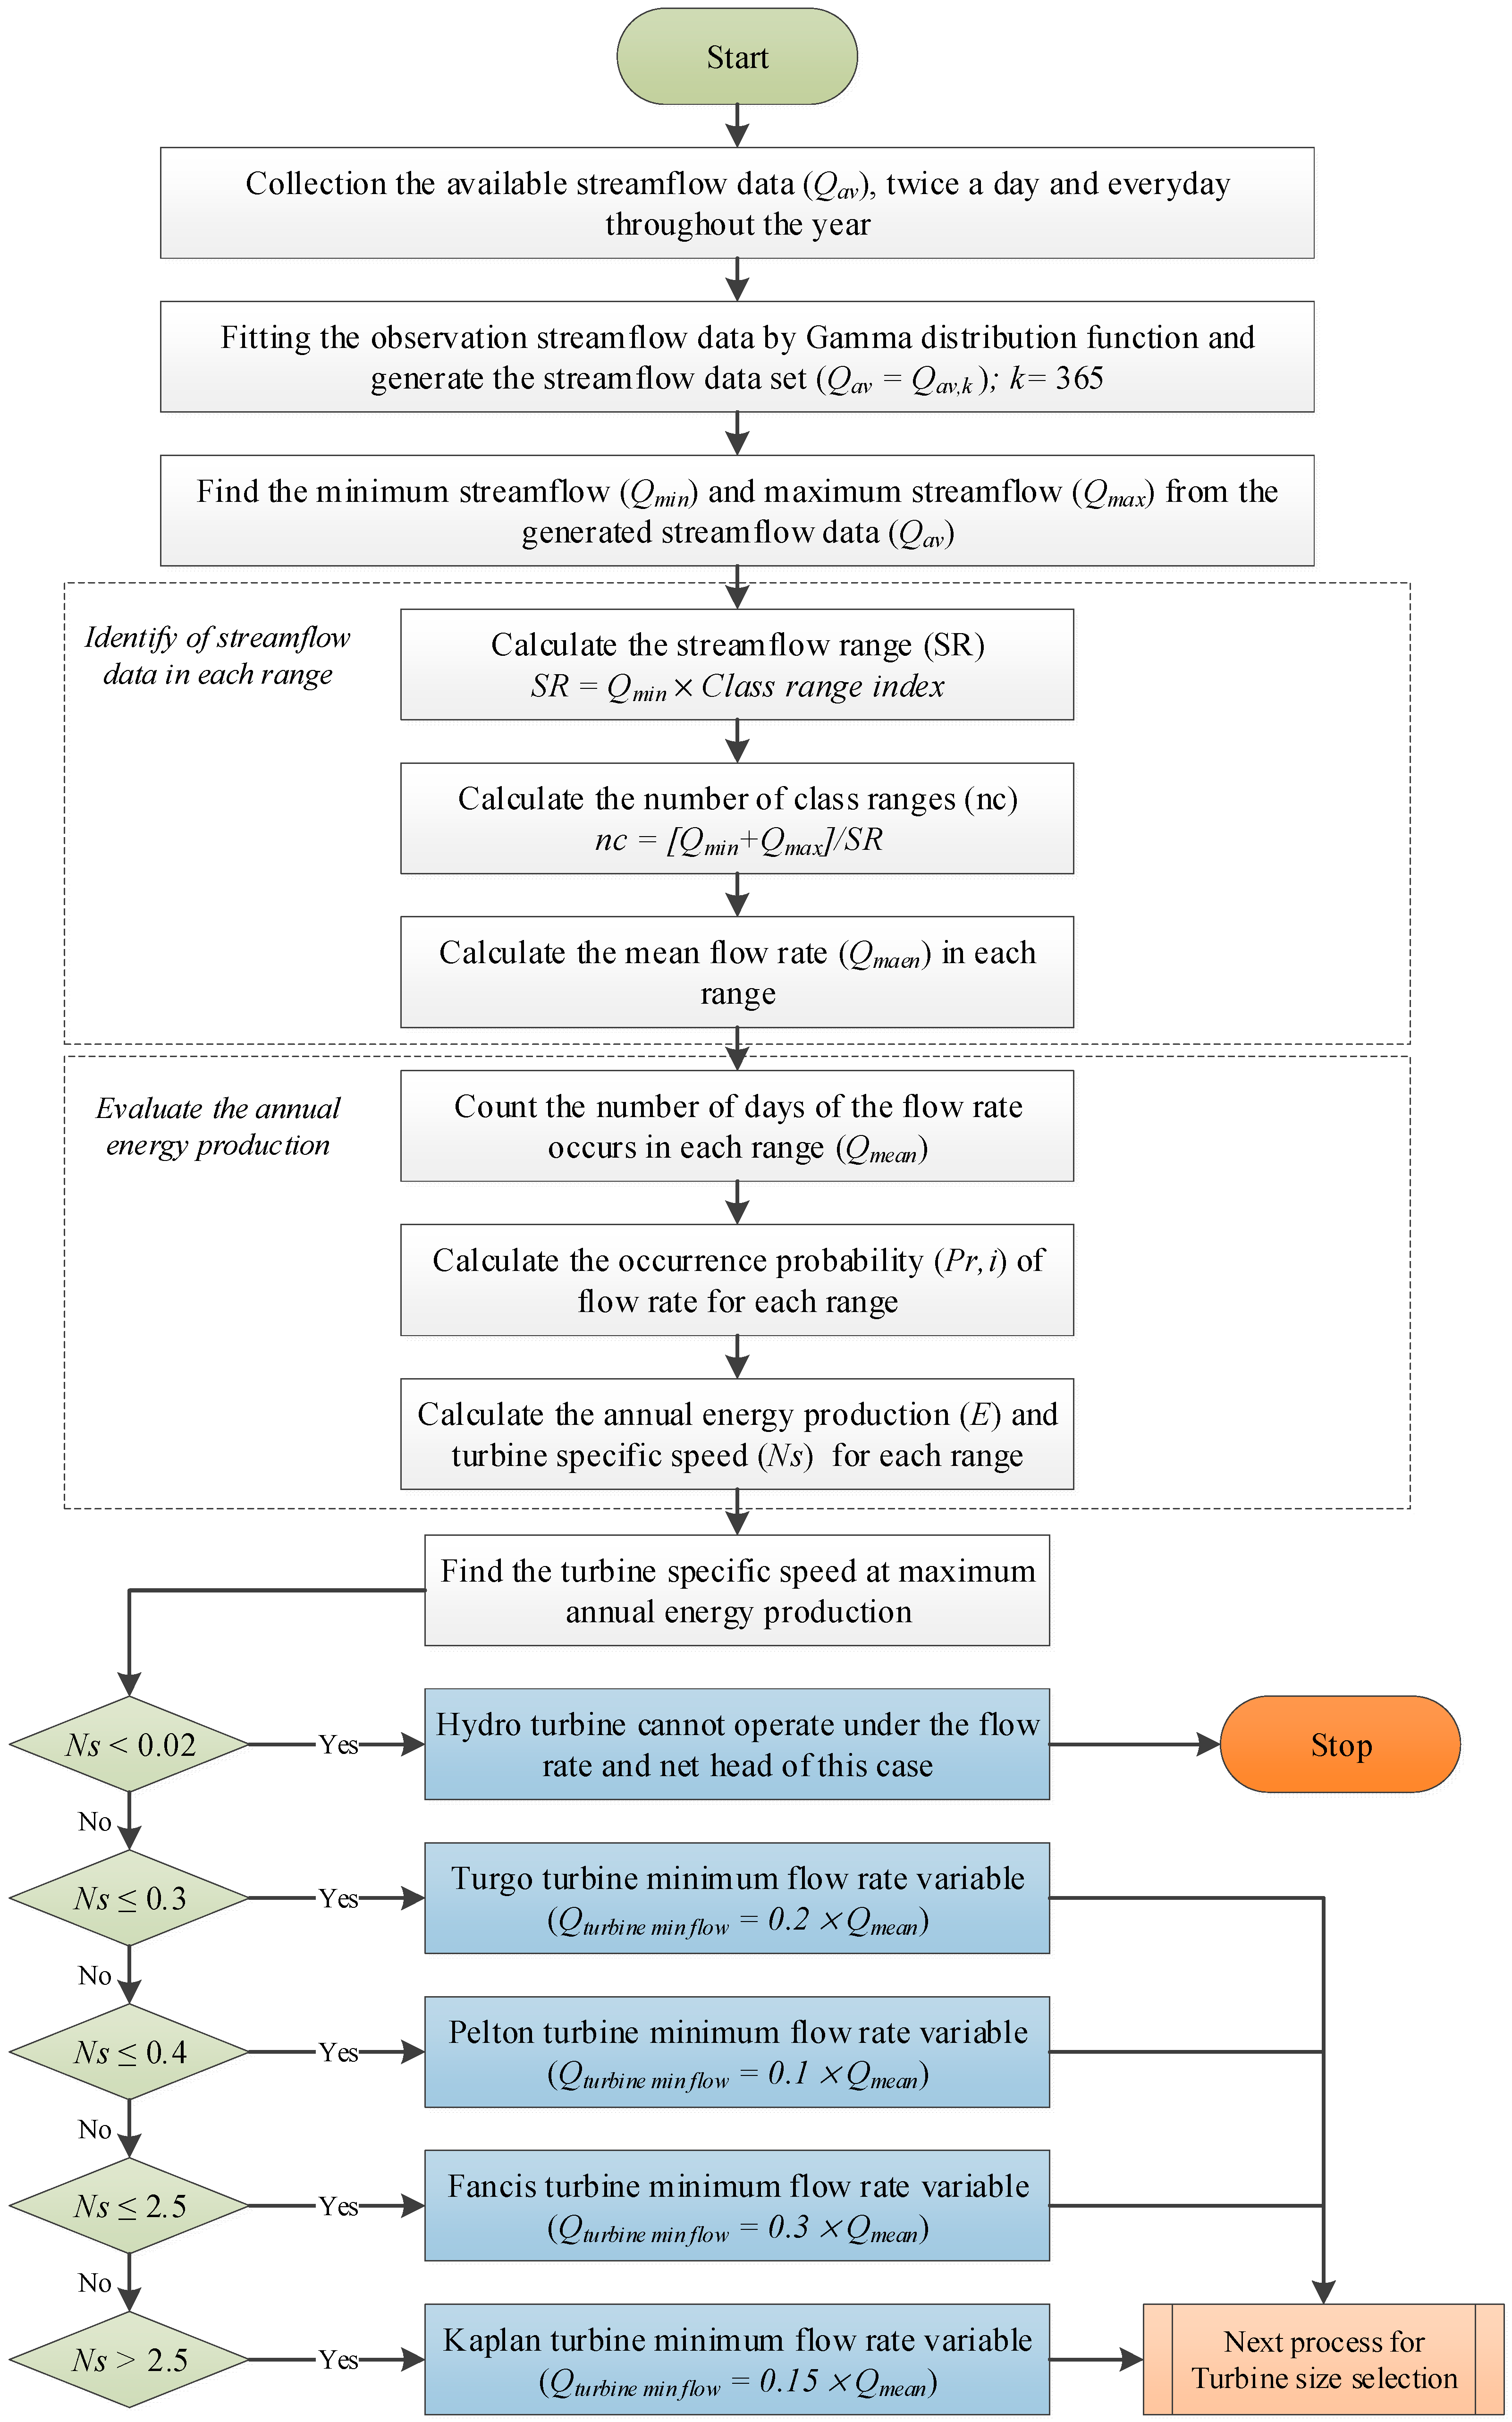
The selection algorithm is separated into two main processes. The first process is selecting the turbine type and minimum flow variable for the operation of each hydro turbine type, as shown in
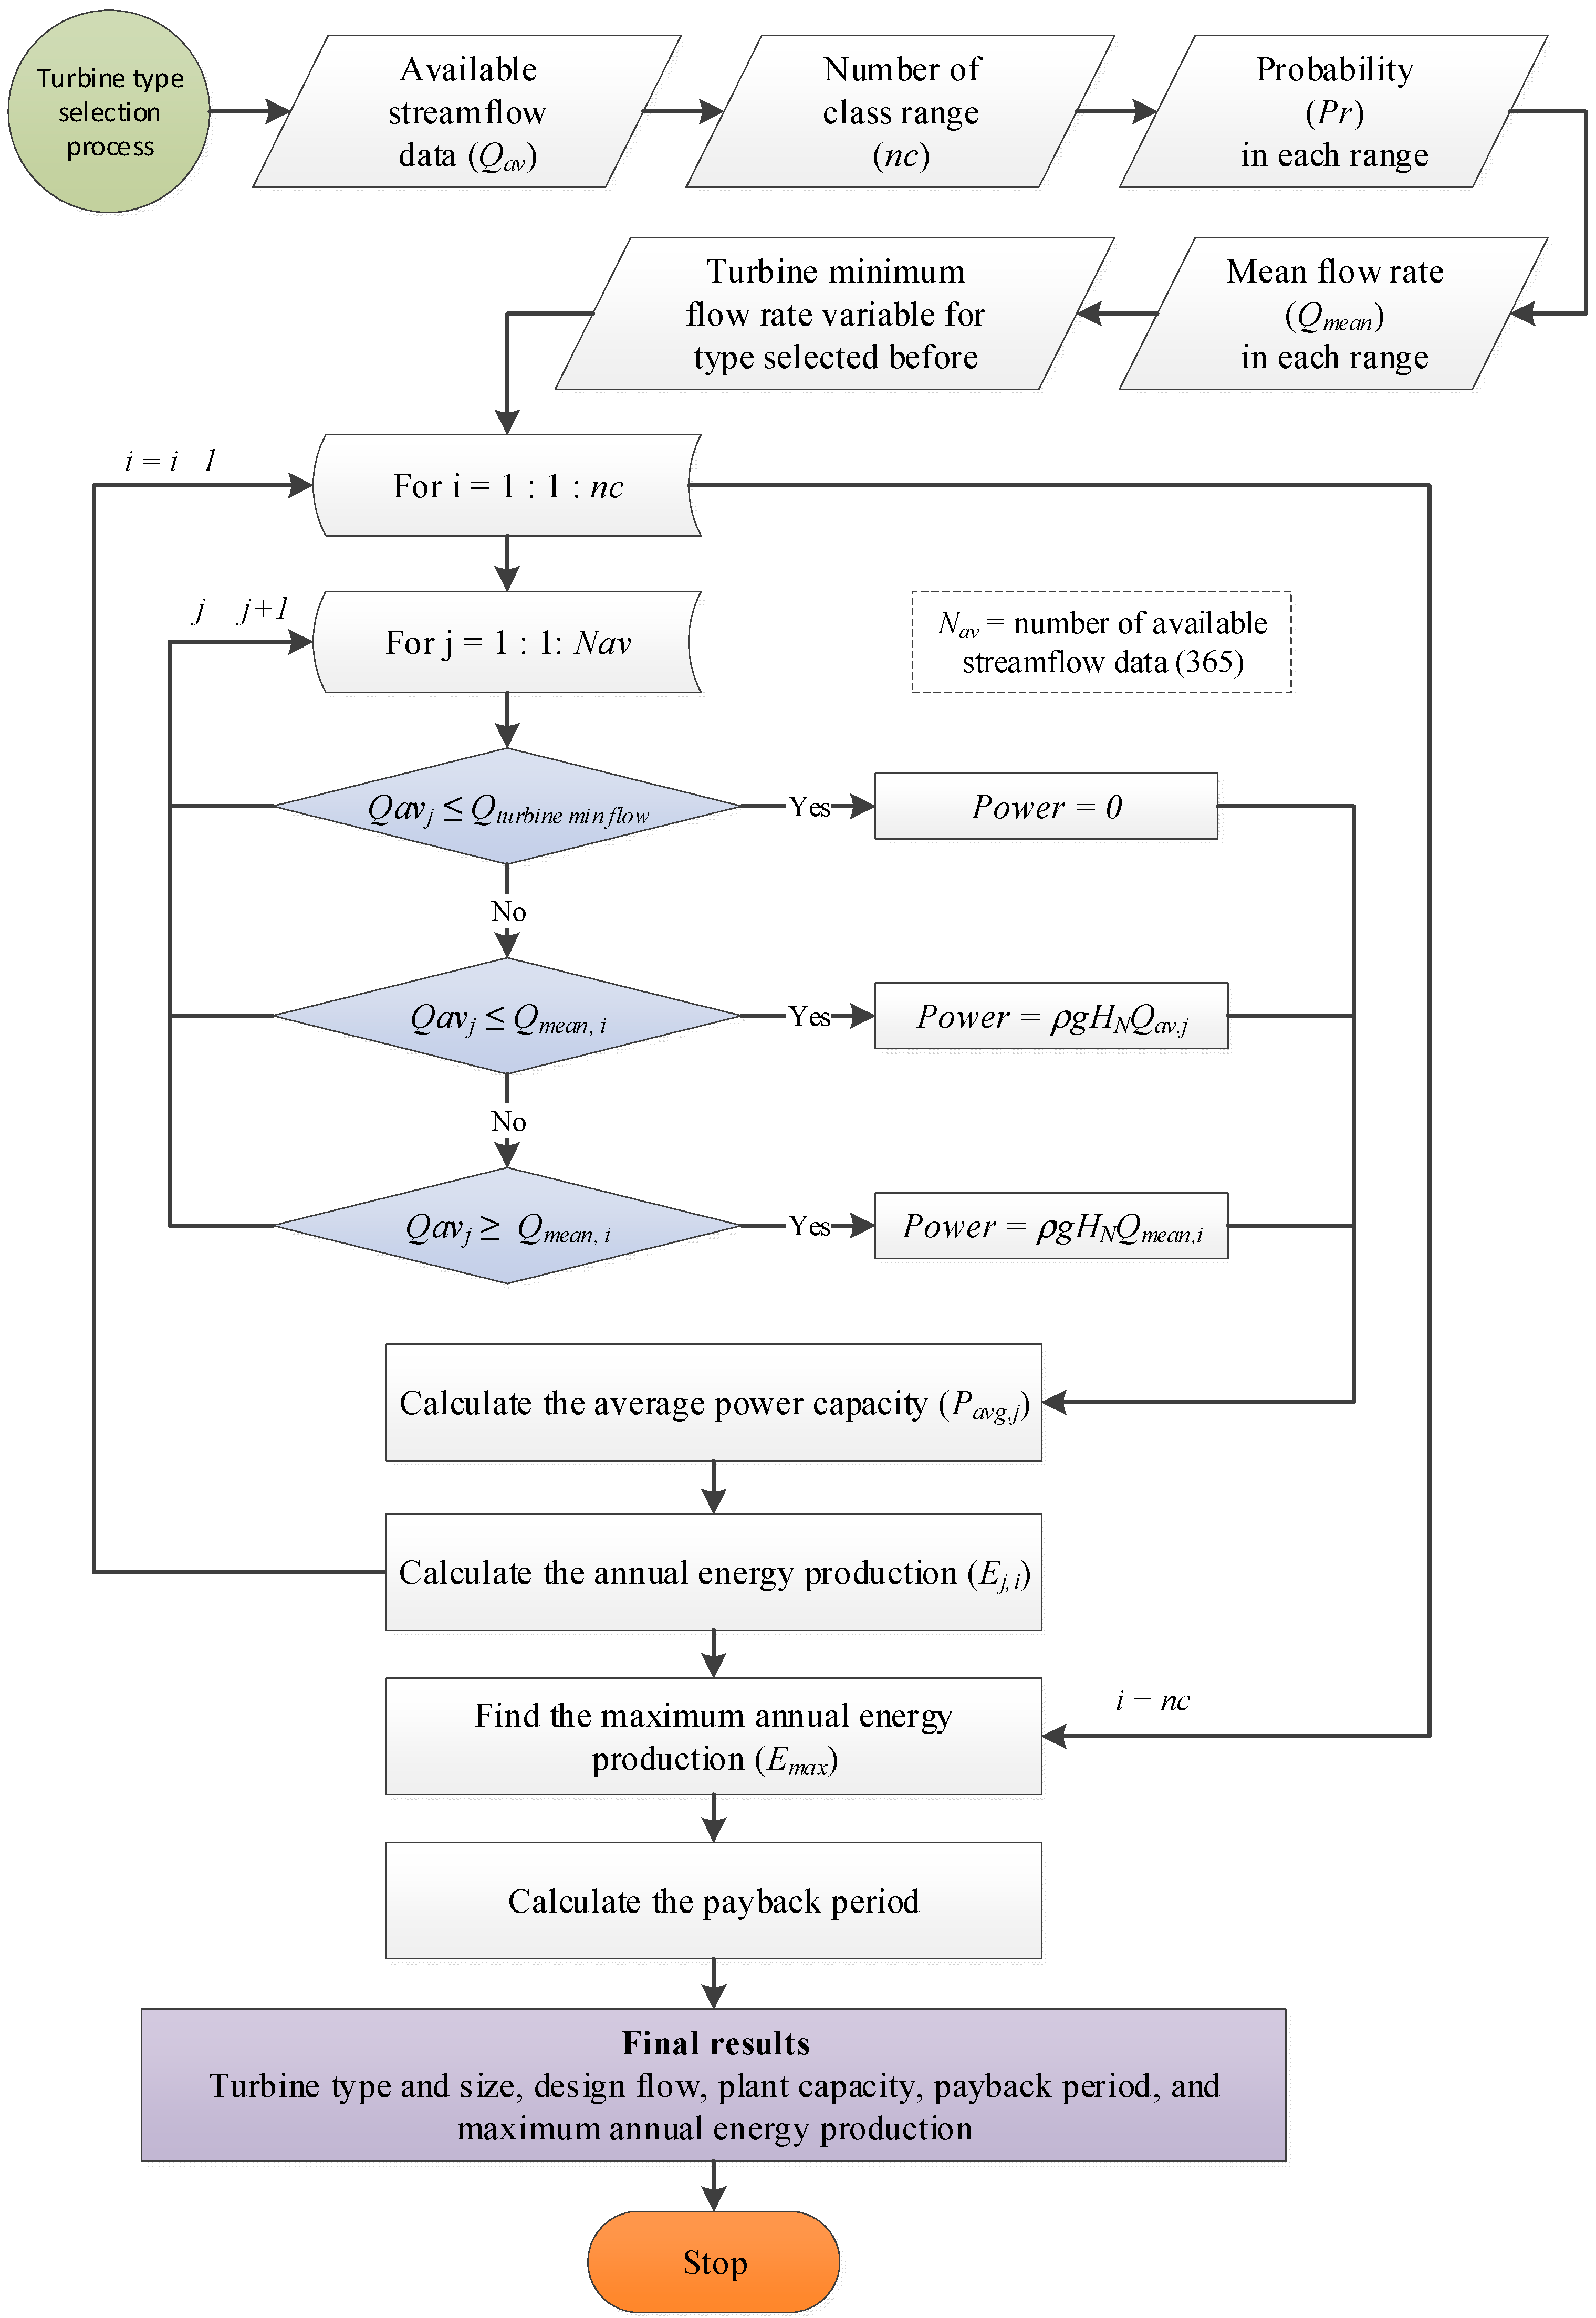
Figure 8. The results of the first process will be used for the second process, which is to find the optimal turbine size after type selection, as shown in
Figure 9. The first two steps of the first process are the collection and analysis of observation flow data, including the irrigation demand. The Gamma distribution function is used to generate the streamflow data set for one year (365 samples). Thence, the streamflow data set are arranged from larger values to smaller values. The next steps in the flowchart are finding the maximum streamflow (
Qmax) and minimum streamflow (
Qmin) from the generated streamflow data (
Qav) (365 samples). The class range index is used to select the streamflow range (
SR) to calculate the number of class ranges (
nc). In each class range (
i) the mean streamflow (
Qmean) is used to count the streamflow occurrence number of days to evaluate the probability of occurrence (
Pr,i). Then, each streamflow range is associated with this probability to evaluate the annual energy production and turbine specific speed. The first iteration starts from the minimum flow rate value (
Qmin), and it has a high probability of occurrence. This iteration process continues until the last class range (
nc). After that, the turbine specific speed at maximum annual energy production (Equation (3)) is used to select the turbine type and minimum flow rate to operate. If the turbine specific speed value is lower than 0.02 the algorithm is stopped because the lowest streamflow and net head are not suitable; otherwise, it will recommend the best type. The type results in the first process are then used in the second process to select the size (
Figure 9).
The second process finds the turbine size based on a more accurate way of calculating maximum potential energy production. The streamflow data (Qav), mean flow rate (Qmean), probability of streamflow occurrence (Pr,i), and number of class ranges (nc) are used. Especially, the minimum flow rate variable of the turbine type is used to check the operation condition of the turbine. The first iteration begins from the mean streamflow (Qmean) in the first-class range. The streamflow data between mean streamflow (Qmean) and turbine minimum streamflow (Qturbine min flow) are used to check the operation condition before computing the annual energy production. If the available streamflow is lower than the minimum streamflow, the turbine will be shut down and the energy is equal to zero.
On the other hand, if the available streamflow (Qav) is less than or equal to the mean streamflow (Qmean) of the turbine condition, the available streamflow is used to evaluate the power capacity. If the available streamflow (Qav) is more than the mean streamflow (Qmean) of the turbine condition, the mean streamflow is used to calculate the power capacity. This loop stops with the last sequence of streamflow data (j = 365). After that, the average power capacity (Pavg) in this range is used to compute the annual energy production (E). The mean streamflow is changed to the next class range until the last class range (i = nc) is reached. The maximum annual energy production is used to determine turbine size. The last process is to check the cost–benefit ratio of the proposed turbine type and size and calculate the design flow. Information about the maintenance costs of the hydro turbines under supervision of PEA, the average annual income from electricity sales of PEA, and the investment costs of turbines are used for this step. The final outputs of this algorithm are a turbine type and size, maximum annual energy production, design flow, plant capacity, and payback period. The design flow value is then used to design the detailed turbine geometry.
6. Results and Discussion
Based on the histogram of probability of streamflow occurrence from
Figure 7, the streamflow range is 0.0175 m
3/s for a total of 20 class ranges. Therefore, the first-class range of flow rate is 0.0001–0.0175 m
3/s, which encompasses the flow rate values for 289 days. The mean flow rate of this range, 0.0088 m
3/s, has a high probability of occurrence of approximately 80%. The power capacity, annual energy production, and turbine specific speed in this range are 6.73 kW, 39,015 kWh, and 0.0567, respectively. For the next class range, the flow rate range is greater than that of the first class, and will be used to calculate the next annual energy production until the last class range with the lowest probability of occurrence.
The class range index (see
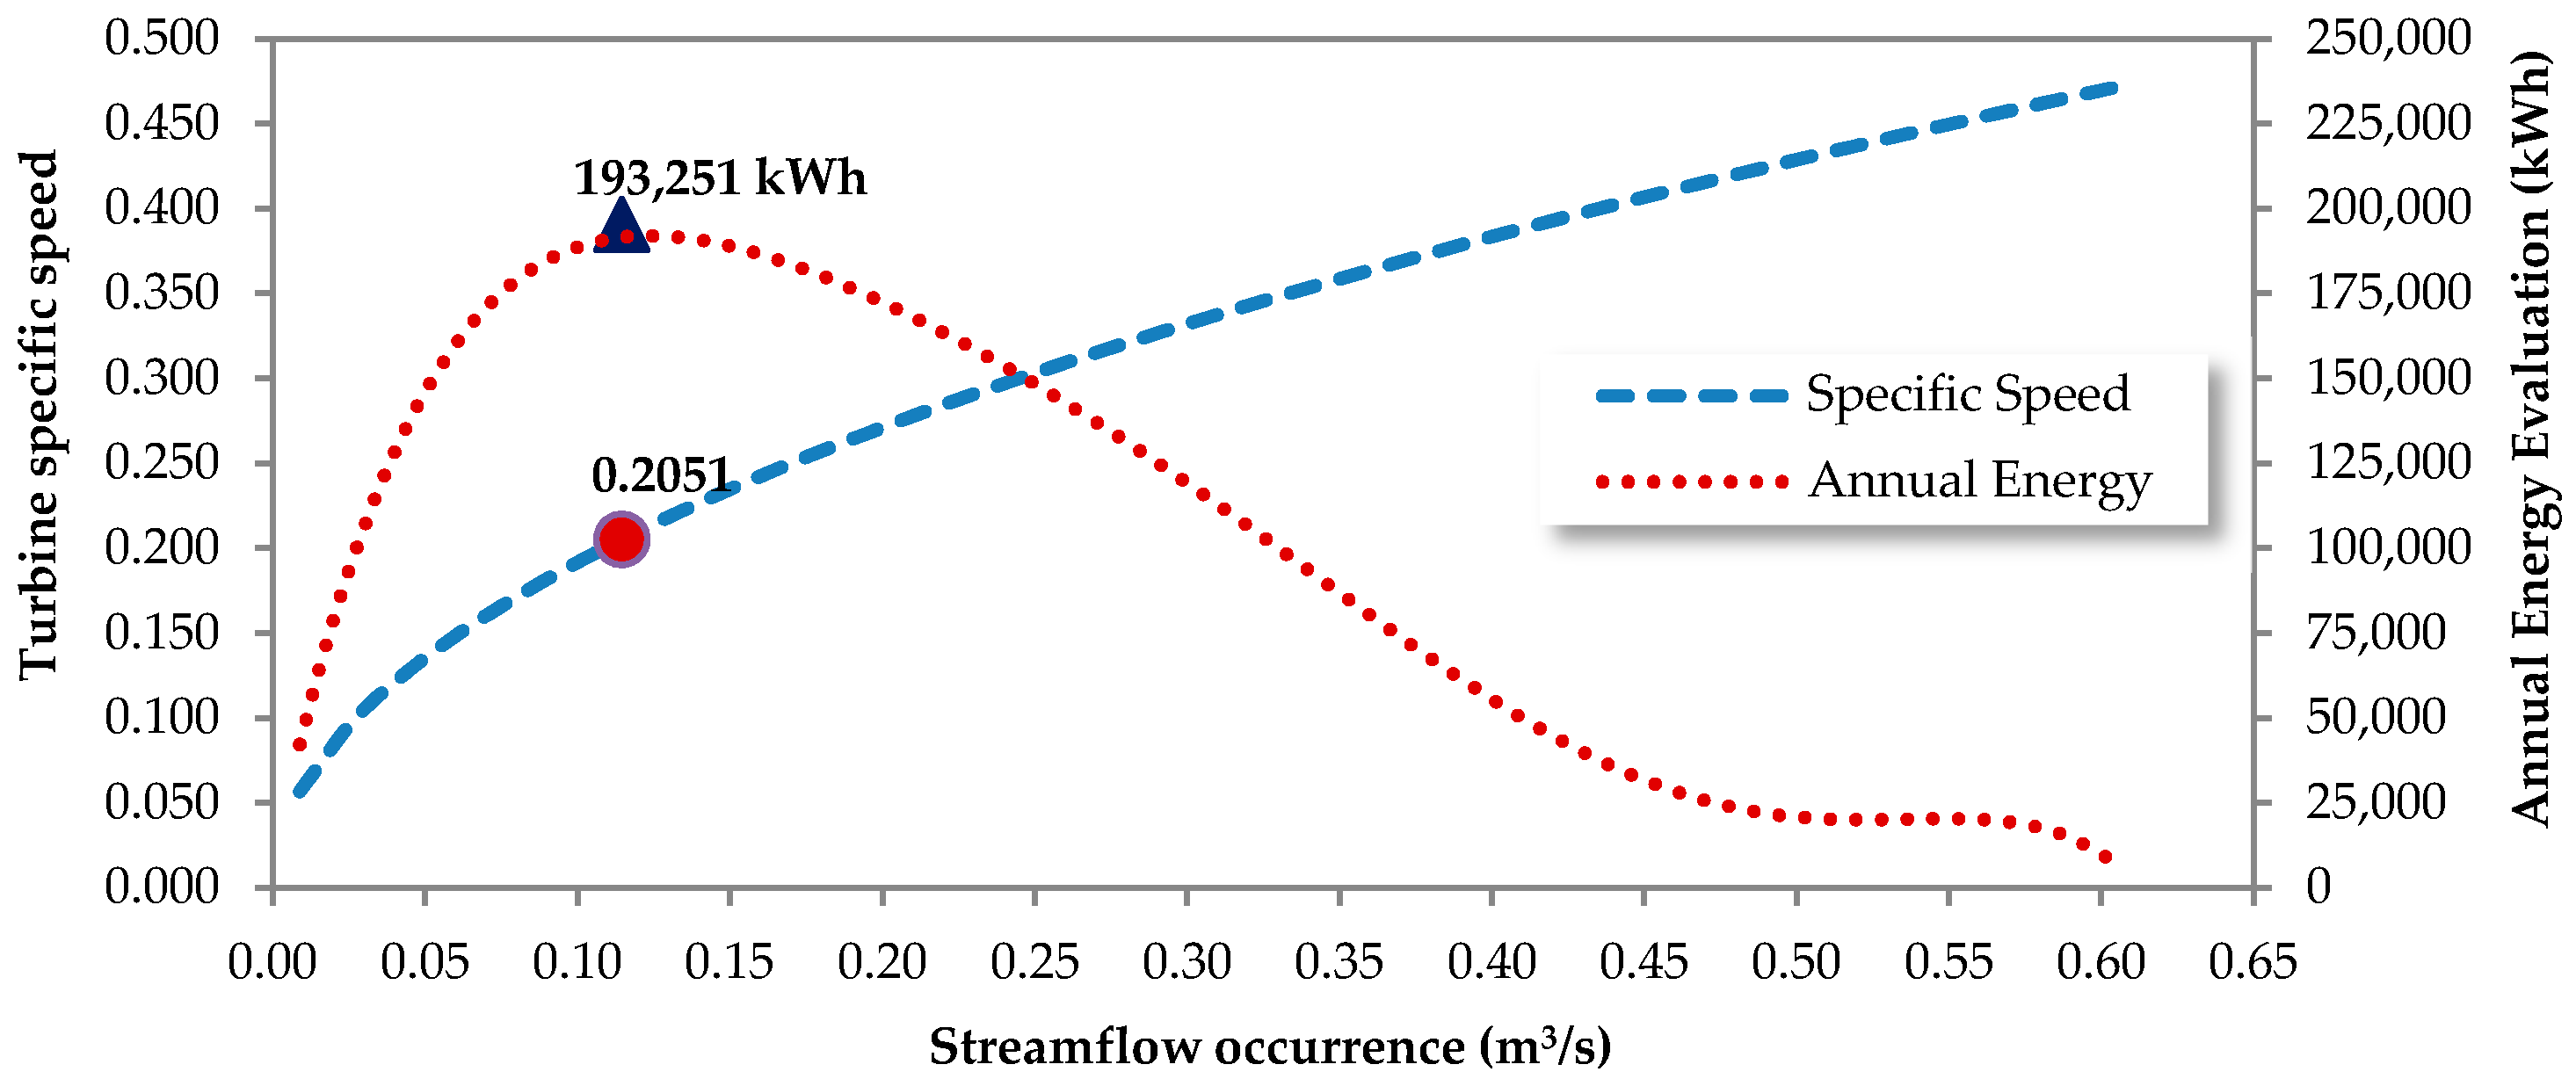
Figure 8) does change the flow range in each class. A higher value of class range index will result in a lower number of classes. The class range index was selected to be as small as possible so that further increases did not change the resulting maximum energy production in the turbine type selection algorithm. This was obtained with 200 classes for a class range index of 36 through trial and error. The comparison of annual energy production results and turbine specific speeds for 200 classes are shown in
Figure 10. High flow rates have a lower probability of occurrence and produce low annual energy. On the other hand, low flow rates have a high probability of occurrence, and allow the turbines to produce larger amounts of annual energy. The impulse turbine is more popular in micro hydropower plant selection than the reaction turbine because it is cheaper and easier to maintain. Moreover, impulse turbines have lower frictional losses than reaction turbines, which affects the flow rate range to operate the turbine. From the results, the turbine specific speed is 0.2051 at maximum annual energy production, which is in the range of the Turgo and Pelton turbines. Both turbines are suitable in this case because of the low flow rate and high effective head. The Turgo turbine will have a smaller diameter than the Pelton turbine. Therefore, it can be concluded that the Turgo turbine is a better choice for this case study than the Pelton turbine.
As shown in
Figure 8, the optimal turbine type selection algorithm uses the mean flow rate in each range to compute the estimation of power capacity and annual energy production. As shown in
Figure 10, the optimal turbine size selection algorithm will use the
Qmin cut of values to calculate the power of the turbine operation. Considering the maximum annual energy production (
Figure 11), the probability of streamflow occurrence is approximately 30%, which can produce a power capacity of 87.95 kW.
In order to increase the accuracy, the operation range of the Turgo turbine, as calculated using Equation (2), was used to estimate the annual energy production. The minimum flow rate for operating the hydro turbine (
Table 6) and information regarding the maintenance costs of the Turgo turbines under supervision of the PEA are used in the optimal turbine size selection algorithm, as shown in
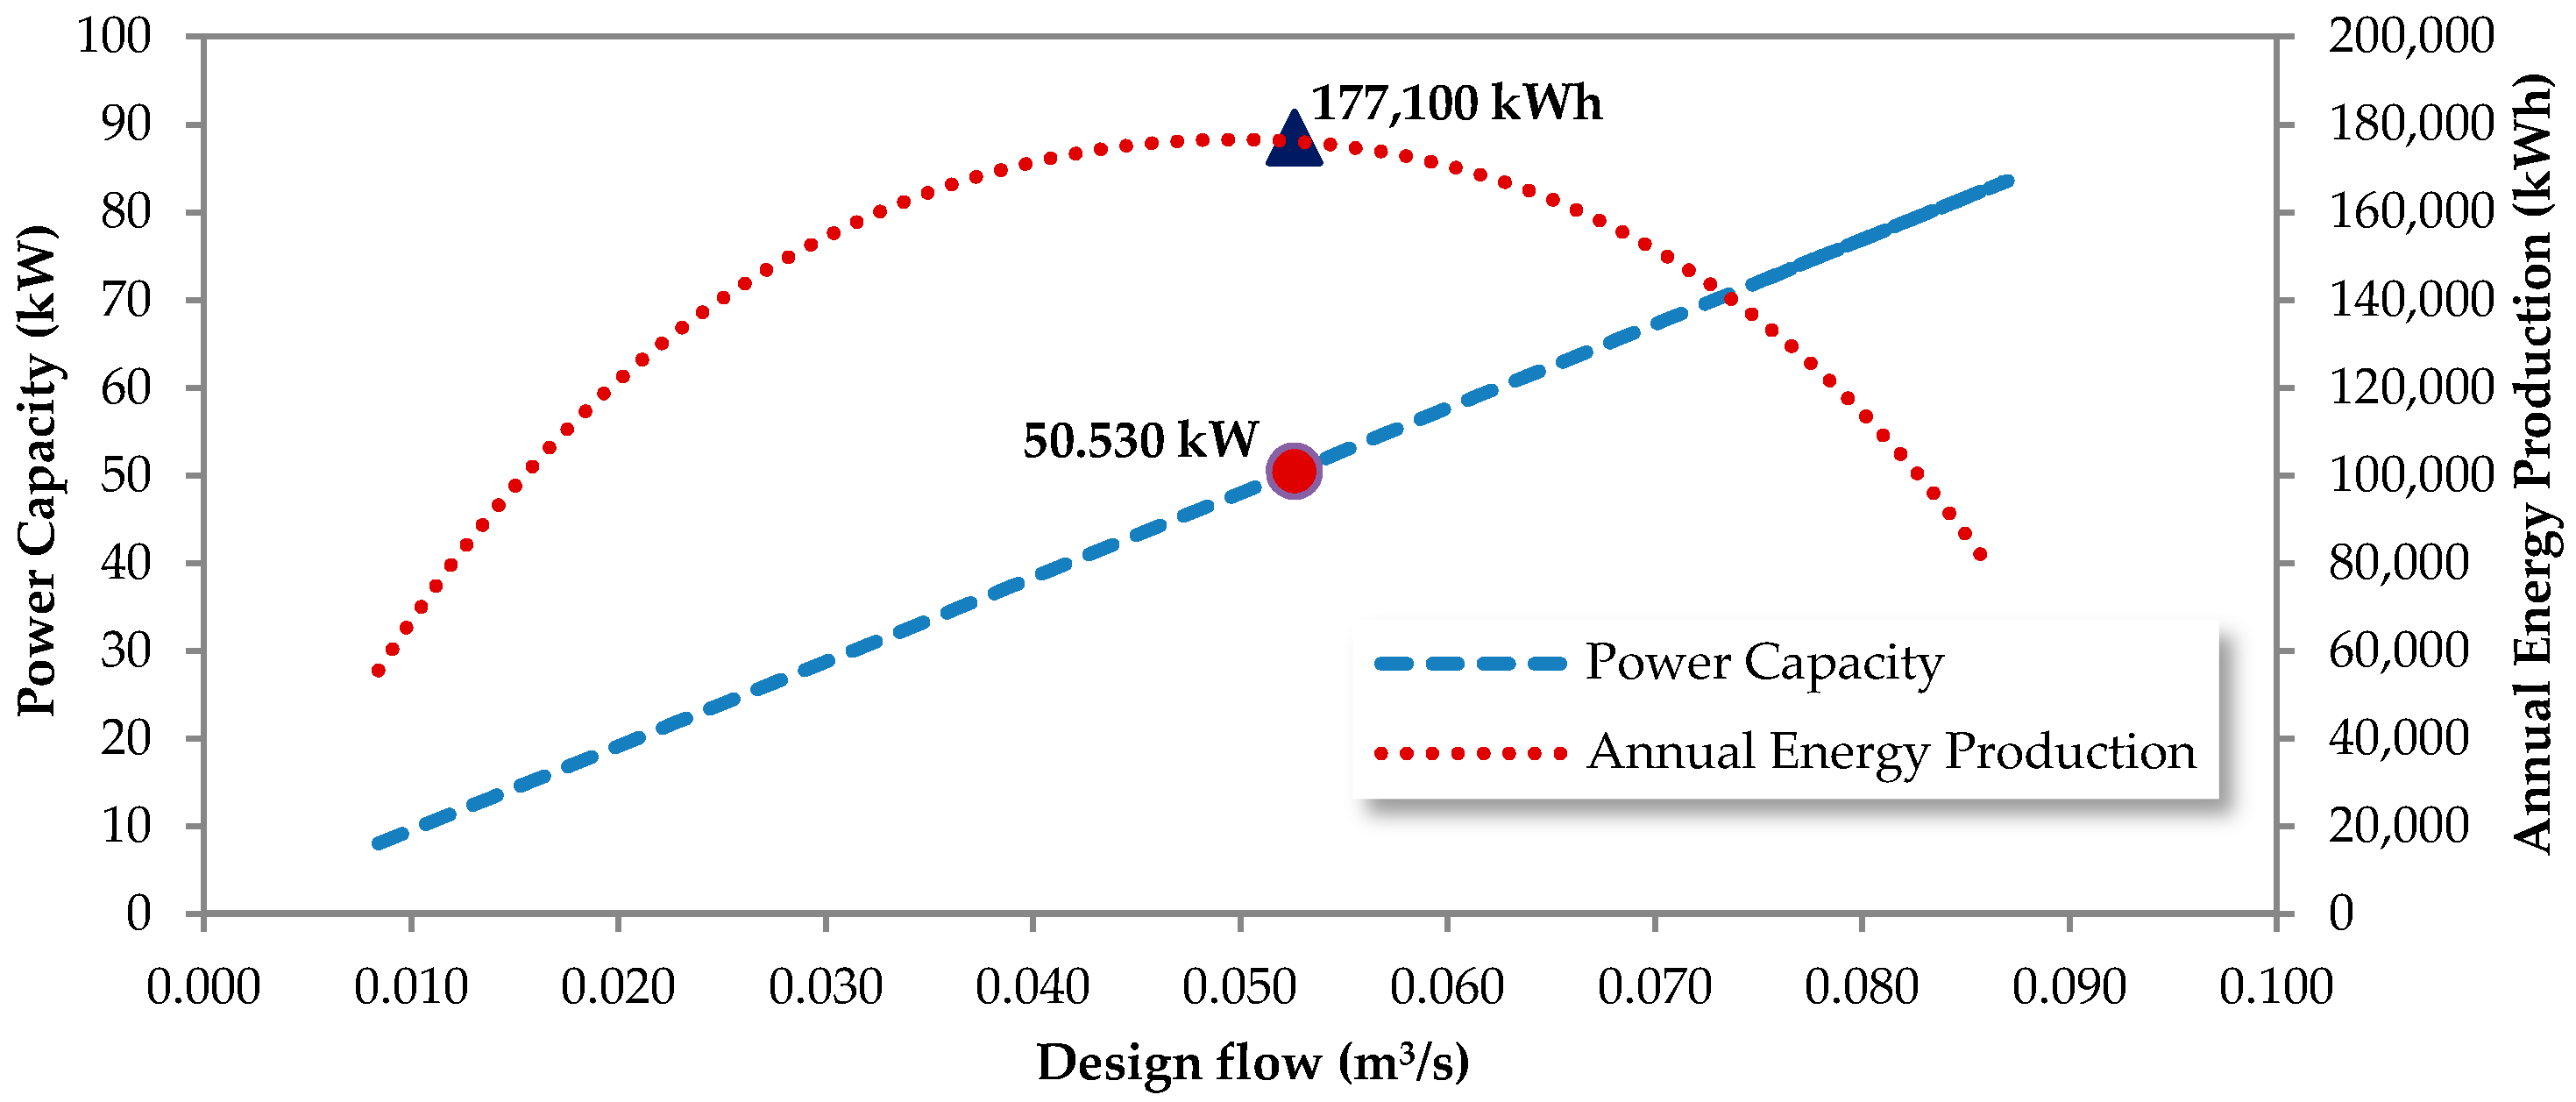
Figure 9. The average annual income from electricity sales of the PEA is around 0.105 USD per kW. The investment cost determined in this study does not include civil work, only mechanical and electrical works of the Turgo turbine type, the cost of which is approximately 1250 USD per kW. The condition of turbine operation based on turbine minimum flow rate is very important to accurately estimate the precise turbine size, since if the available flow rate is lower than the minimum flow rate value the turbine will be shut down. In contrast, if the available flow rate is higher than the design flow value, the turbine will use the design flow rate value to produce electricity. The accuracy of this algorithm will depend on the amount of available streamflow data. If there is a large amount of data, the accuracy of the result will be higher. Furthermore, energy production depends on the operational turbine performance. The final results show that the Turgo turbine can produce a maximum annual energy of 0.1771 GWh with a payback period of 1197 days. The minimum flow rate required to operate is 0.0105 m
3/s, with a design flow of 0.0526 m
3/s at a net head of 98 m and a turbine shaft speed of 1000 rpm. The plant capacity is 50 kW. It is possible to compare the more accurate maximum energy estimate by comparing
Figure 10 and
Figure 11 with the results from the second phase of the algorithm (
Figure 12).
7. Conclusions
A novel methodology for estimating the energy production of a hydro plant based on observation, irrigation demand, and historical flow data was developed and implemented. The results were used to determine optimal turbine type and size. Streamflow was measured and fitted with the best PDF. The flow data were grouped into classes based on flow rate range. Flow occurrence curves were used to compute the total annual energy production for various turbine parameters. An algorithm was developed to find the optimal turbine type and size based on the maximum annual energy production. In the first part of the algorithm the average flow of each range was used. The average flow of the class that gives the highest annual energy was used to select the turbine type. The number of classes used is important: the higher the number of classes, the more accurate the results. The class number was selected to be as small as possible so that a further increase did not change the resulting maximum energy production. This was obtained for 200 classes with a class index of 36. The second part of the algorithm starts with the resulting turbine type as an outcome of the first part of the algorithm. Instead of using the class average flow range, the minimum and maximum flow rate of the selected nominal size was used to compute a more accurate estimate of the annual energy production. Additionally, the information of the maintenance cost, investment cost, and average income for electricity sales from the PEA was used to estimate the payback period. This algorithm was validated by a real case study of the Baan Khun Pae micro hydropower plant in Chiang Mai Province, Thailand. The result of the algorithm showed that the Turgo turbine is a better choice for this case study than other turbines; it can produce a maximum annual energy of 0.1771 GWh with a payback period of 3.28 years. The minimum flow rate needed to operate the turbine is 0.0105 m3/s, with a design flow of 0.0526 m3/s, at a maximum power capacity of 50 kW.
The final turbine design was manufactured and installed to replace the existing turbine, the size of which was selected based on the standard FDC method. The average annual energy production of the new Turgo turbine for four years (2014–2018) was 0.146 GWh at a plant capacity of 82%. Comparing this result to the historical data of the Baan Khun Pae micro hydropower plant, as shown in
Table 2, it can be seen that the new Turgo turbine produced electricity similar to the prediction of our algorithm and the plant capacity is better than for the previous turbine. Although the maximum power of the new Turgo turbine is lower than that of the existing turbine, it can produce more annual energy. Therefore, this algorithm is more accurate than others at determining the type and size of hydro turbine to install in the run-of-river micro hydropower plants with highly variable flow conditions. In case the flow rate is deterministic there will be no need to use the PDF but the two-phase type and size selection can still be used to maximize the annual energy production.


