1. Introduction
Over the years from 2009 to 2014, an unexpected, enormous deployment of PV stations (around 2.3 GW) took place in Greece. During that period, the Greek economy has been framed by great recession and instability [
1] yet the PV market (production, trading and installation) has demonstrated an explosive growth which lead to a market overheat [
2]. An essential component of this situation has been the implementation of a legislative and regulatory framework, which provided higher tariffs for in-feed PV generated energy compared to the ones offered in other European countries [
3]. When taking also into account the longer periods of sunshine in Greece, which translated into higher capacity factors, the investments in PV stations turned out to be even more attractive. Another determinant factor, at least during the first two years of that time, was the subsidies offered by the Greek government for the installation of PV stations on top of the fixed feed in tariff (FiT) support. In essence, the extremely positive political consensus towards supporting RES deployment, both at a European and national level, promoted the latter in numerous actions and policies through the related Directives on the promotion of use of energy from renewable sources (RED 2009/28/EC) [
4] as well as the most recent one on energy efficiency (EED 2012/27/EU) [
5]. Surprisingly, the economic crisis is also considered to have contributed to the rapid increasing interest in this market [
6]. Many people were attracted by the very short pay-back periods as shaped by the high tariffs and the subsidies offered, considering PV investments as a way to offset their loss of income, due to recession [
7].
The Greek legislative and regulatory framework, which is in force and consists of many relevant laws and ministerial decisions described in the following section, foresees two main categories for PV stations. The first one refers to the so-called independent producers while the second one to smaller PV roof installations (Special Regime for Small PV Stations on Roofs or on Buildings). The first category involves the huge majority of PV stations in terms of installed power. It is characterized by a free choice of the nominal power and permits the interconnection of the PV stations to the low, medium and high voltage network. Concerning the tax levying calculation, the revenues resulting from this type of investments are treated the same fiscally, as any other income in the economy. The Special Regime for small rooftop installations refers to PV stations with a nominal installed power less than 10 kW, provided they are installed on buildings where there is an active electric energy supply. This category involves the majority of PV stations in terms of number of installations. The revenue from this type of investment was initially not subject to any tax, however in 2011 it was eventually included in the imposition of the solidarity surcharge. More recently (May 2016) Law 4387/2016 [
8] established permanent tax rates ranging from 0 to 10% depending on the amount of income from other sources including all types of PV investments.
In both categories, there are provisions for a steady tariff for 20 and 25 years respectively as it is defined in the purchase agreement (PA). For the first category, the PA is made between the owner of the PV station and the market operator (LAGIE), while for the second one the PA has been replaced by another similar one named Netting Agreement (NA) which is made between the owner of the active energy supply and the equivalent Supplier. The main difference between the NA and the PA regards the element that the owner of the PV station receives remuneration for the generated energy reduced by the electricity consumption cost. In turn, the Supplier recovers the cost resulting from the remuneration of the generated energy, from the Market Operator. An important stage that precedes the PA and the NA is the Interconnection Agreement, which is made between the investor and the Network Operator. This Agreement describes the necessary economic and technical terms (e.g., interconnection works, cost) that have to be met by the owner of the PV station, to allow for the interconnection of the PV station to the network.
The Market Operator (LAGIE) is authorized to operate the support and funding mechanism for the remuneration of the generated energy from RES power stations, through a dedicated account (Special Account for RES) [
9]. Although the revenues of this account come from different sources, there are namely two primary sources. The first one is a charge calculated upon the consumed energy that all consumers pay through their electricity bills (hereinafter referred to as ETMEAR). The second refers to the amount resulting from the day-ahead electricity market dispatch (hereinafter referred to as HEP), using the hourly system marginal price (SMP), which reflects the electricity wholesale cost and is being paid by the suppliers. The combination of the rapid deployment of PV stations (i.e., 2.3 GW within four years), with the inability to find additional revenues for the Special Account resulted in a small deficit in 2011 which continued to increase until 2013 when the installation of PV stations practically stopped. To address this growing deficit the Greek government took emergent regulatory measures such as the solidarity surcharge and the consecutive sharp reduction of the FiTs without yet imposing a retroactive effect. The tipping point of the efforts to rationalize the RES support framework was reached when the government voted for the retroactive reduction of the tariffs for the already existing PV stations (also known as “haircut”), as well as the imposition of issuance of a credit invoice by the owners of PV stations, pursuant to Law 4254/2014 [
10].
All the abovementioned series of policy adaptations have led to a dramatic change of the PV investments profitability in comparison to what was initially perceived from investors. Naturally the investors considered the imposed changes as unfair and illegal. The economic viability of PV investments was even worse if the loans that had to be repaid are taken into account. The latter means that the annual profit margin resulted in relatively lower levels, than the one initially estimated by investors. This deterioration of the investments’ viability was not the same for every PV station. On the contrary, it strongly depended on a series of factors that affect the profitability of an investment such as the tariff foreseen on the PA, the tariff after the reduction pursuant to the Law 4254/2014, the total installation cost, the height of the loan and its interest as well as the granting of any subsidy. On the other hand, and form a social perspective, the alleviated unitary costs of supporting the different PV stations deployment as well as the avoided burden on electricity consumers due to the cost-containment measures has to be considered when assessing the government actions to impose such measures.
There is a growing number of studies assessing the impacts of regulatory amendments on the costs caused by RES remuneration schemes in Europe (see e.g., [
11,
12,
13,
14,
15,
16]). Specifically, for the case of Greece only a few studies have been carried out discussing the effects of legislation upon the resulting PV and other RES penetration and investments (see e.g., [
7,
17,
18]) nevertheless the impact of the recently imposed FiT retroactive reduction upon the profitability of specific PV system owners has not yet received equivalent attention. Papadelis et al. [
18] assess the efficiency of the support RES scheme in Greece by calculating the weighted average cost of capital for benchmark wind and PV projects to explore the sensitivity of investment demand to the FiT price. Giannini et al. [
19] use the return on investment index to represent the driving factor and explain PV penetration in general while also analyzing the resulting surcharge on the electricity price due to photovoltaic penetration in Greece. The purpose of our paper instead is to assess the financial impact imposed by the modulated legislative and regulatory framework in Greece and especially by the recent Fit reduction upon the profitability of different PV investments in contrast to its impact on the consumers’ electricity bills. The analysis carried out may help to assess the ex-post effects of the cutback so as to derive an updated and more uniform unit cost of production for different PV investments, supporting the formulation of a new and just RES support model.
A parametric techno-economic analysis for PV investments is carried out according to the finally modulated legislative and regulatory framework. A qualitative and quantitative assessment of the PV profitability reduction is also made as an immediate outcome of the above-mentioned regulatory framework. In
Section 2, the Greek legislative and regulatory framework for PV power systems is analyzed. In
Section 3 the impact of retroactive legislative and regulatory adjustments on the development of PV stations is described theoretically, while in
Section 4, empirical observations on the deployment of PV stations in Greece are presented. Based upon these findings, in
Section 5 a quantitative analysis of the impact of regulatory amendments on the deployment of PV stations in Greece is provided. In
Section 6 the basic assumptions, inputs and procedure for the parametric cost–benefit analysis is outlined. The results are discussed in detail in
Section 7 while conclusions and policy implications are summarized in
Section 8.
2. Review of the Legislative and Regulatory Framework on the Pricing of Electricity Produced by photovoltaic Stations in Greece
The legislative and regulatory framework that has been in effect, foresees two main categories for PV stations. The first one refers to the so-called independent producers while the second one to the small PV roof installations (Special Regime for Small PV Stations on Roofs or on Buildings). The first category includes two sub-categories having as main criterion the installed nominal power (lower and higher than 100 kW). From a techno-economic perspective, there is a third sub-category, which includes the PV stations installed by farmers. The second category refers to small rooftop PV stations for which the nominal installed power is less than 10 kW. Since the legislative and regulatory framework is common for the 3 sub-categories of the independent producers, this will be analyzed integrally. On the contrary, the evaluation of the PV investment viability will be presented discretely. The following Table (
Table 1) summarizes the cases under analysis and their characteristics.
Notably, the retail price of electricity that the consumers pay in Greece has been fluctuating. Over the years from 2010 to 2014 the market share of the dominant electricity provider, which had been the Public Power Corporation, remained stable at higher than 90% in terms of sold energy quantities. On the other hand, the electricity price per consumer type has been varying in an effort to reflect as much as possible the actual cost of generation and to decrease any cross subsidies among the different consumer types. Nevertheless, the average of electricity price can be estimated around 10 €cent/kWh approximately. This price does not include any other relevant regulated charges calculated upon energy consumption (e.g., Network Operators’ charges, charges for supporting the mechanism for vulnerable groups of consumers, Market Operators’ charges, etc.), which are being paid by every consumer independently of the primary source of the generated energy. Today, due to the intense competition as well as the low cost of natural gas the electricity cost is even lower.
The following subsections decode what the main national regulatory amendments meant for each category under assessment in terms of pricing as well as other provisions shaping the respective investments’ techno-economic characteristics.
2.1. The Case of Low and Medium Voltage Photovoltaic Stations
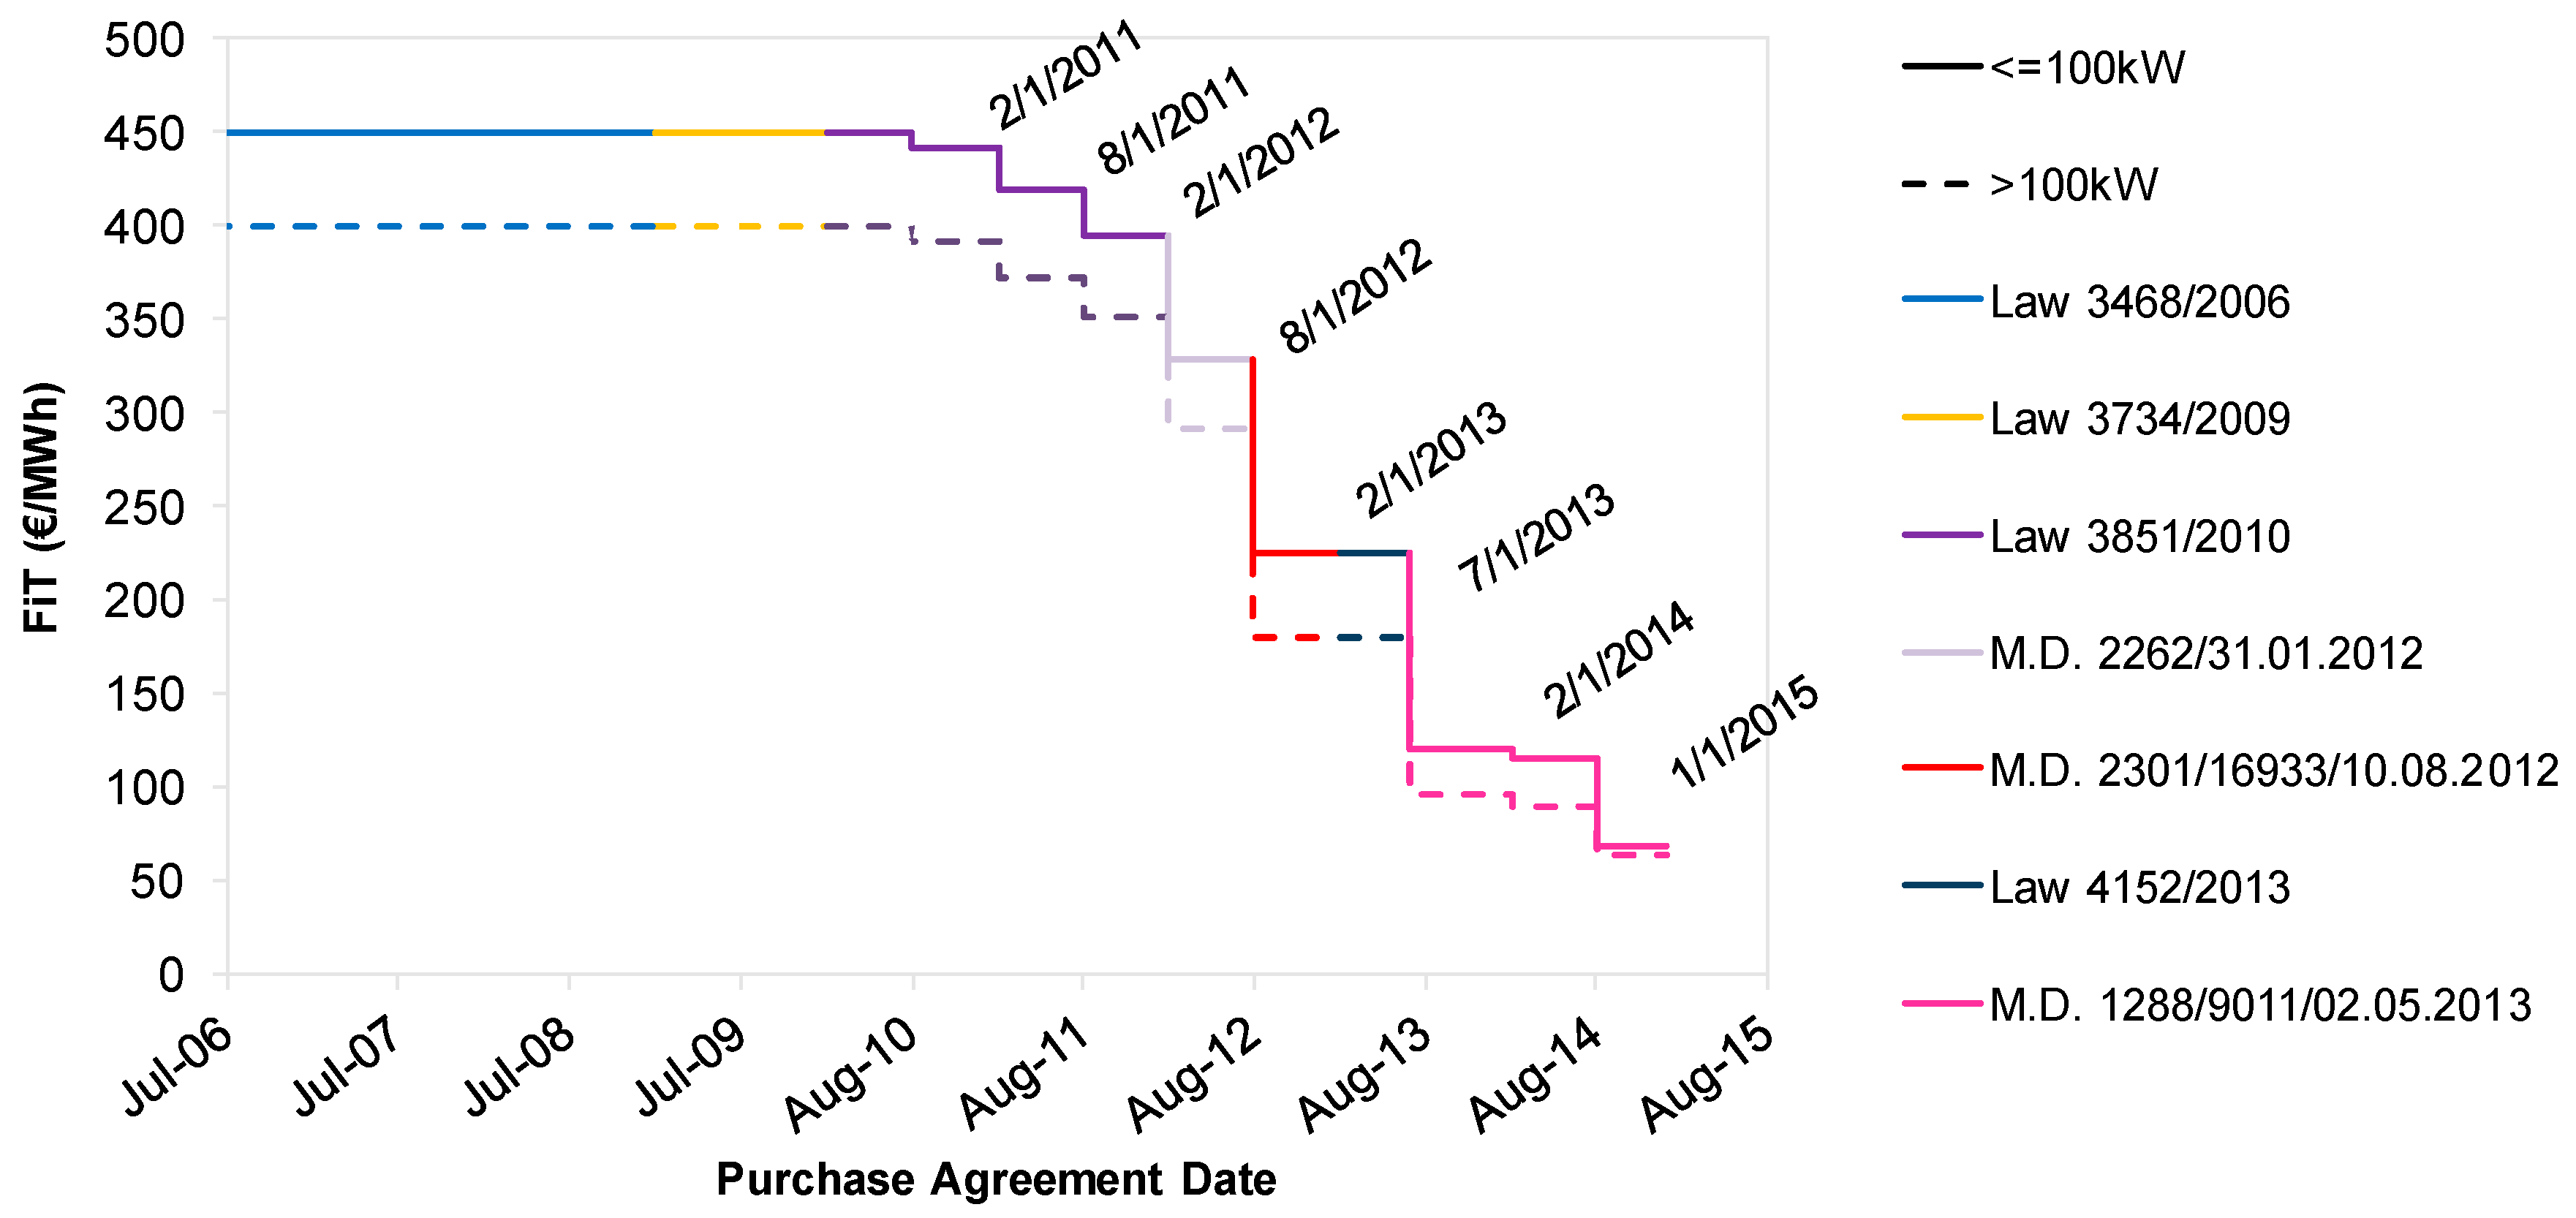
The Law 3468/2006 [
20] established the duration of the PA to 10 years and introduced for the first-time fixed remuneration tariffs (€/MWh) for PV power stations according to
Table 2. It promoted small PV investments based on the perspective that these are to be installed near loads reducing in this way the energy losses. Stations up to 100 kW are to be connected to the low voltage (LV) network while the other stations to the medium voltage (MV) network. In Greece, most of the islands are not interconnected to the mainland transmission or distribution network. The energy demand is covered by local small to medium conventional power stations that use diesel as fuel. Subsequently the energy production cost is extremely high urging the government to establish even higher FiTs rates for the Non-Interconnected Islands.
After three years’ time the Law 3734/2009 [
21] foresaw a progressive decrease of the tariff for each semester and extended the duration of the PA from 10 to 20 years. It also stipulated the contracted tariff to be maintained for a period of eighteen months since the signature date of the Agreement. Should the activation occur past the 18-month interval, the guaranteed tariff was no longer maintained and was set according to the provisions of the equivalent semester of its activation.
Next, the Law 3851/2010 [
22] maintained the tariff as well as the progressive reduction to the same levels and abolished the differentiation of the tariffs between PV stations in the Non-Interconnected Islands with a nominal installed power either lower or higher of 100 kW. Special provisions were also taken for higher access priority to the distribution network for the farmers, biomass and biogas power stations as well as PV installations on buildings. It simplified the procedure from the submission of the application to the final activation of the stations. Especially for the PV, biomass and biogas power stations, it rescinded the obligation of applying for a Production License provided that the nominal installed power is below 1 MW. It also foresaw that an environmental license is not required for the case that the PV installed power is lower than 500 kW. Overall the Law 3851/2010 played a detrimental role for the promotion of RES in Greece since it established a steady and simple environment for their deployment by rationalizing their licensing and approval procedures. On the other hand, it provoked an overwhelming investment interest that had an impact on the Market and Network Operators’ workload, which had to bear this huge burden.
In an effort to address the serious concerns raised about the long-term financial feasibility of the Greek PV market, the Ministerial Decision (MD) 2262/2012 (January of 2012) [
23] imposed an approximate 15% reduction of the tariffs. The reduction rates were normalized to the initial high tariffs introduced by the Law 3468/2006, which were maintained for some semesters as stipulated by the Law 3734/2009 and 3851/2010. In accordance to this Decision, provisions were also taken for a smooth and reasonable transitional period. In fact the applications that had already been submitted to the Market Operator for PAs since the publication date of this Decision but were not finalized until then, preserved the tariffs that were foreseen in Law 3851/2010. Likewise, the MD 2301/16933/2012 (August 2012) [
24] envisaged a further 28% reduction of the tariffs. A similar to the previously described transitional period came into force regarding the tariffs of the 2262/2012 Decision. Essentially, the Law 4093/2012 (enacted in November 2012) [
25] was the first one to establish emergent measures for rationalizing the funding mechanism for the remuneration of the energy generated from PV stations. More specifically, it foresaw a “solidarity surcharge” (25–30%) for the energy generated during the period from 1 July 2012 to 30 June 2014. Most importantly, it stipulated the guaranteed tariff to be the one in effect during the semester when the PV station was activated. The cases that were excluded from this requirement were those that either had already submitted application for a PA or had signed the Agreement before the publication of the Law 4093/2012. Finally, it required PV station to be activated within four months after the implementation of the law, practically, providing a short transitional period until March 2013.
The Law 4123/2013 [
26] extended the transitional period of 4 months pursuant to Law 4093/2012, by three months. This provision was in force only for the PV stations that were to be installed by the farmers. Later on that year (May 2013), the MD 1288/9011/2013 [
27] readjusted the tariffs decreasing them by a further 25% in comparison to the prevailing tariff at that time. During the same period, the Law 4152/2013 [
28] increased the solidarity surcharge to a range from 34% to 42%. This applies only to the PV stations that were activated after the publication of the Law 4093/2012. Pursuant to this Law, the transitional period, as defined in accordance to Law 4123/2013, was extended for some more days until the end of June 2013. These sequential extensions referred exclusively to the PV stations installed by the farmers. The Law 4152/2013 also offered the same deadline date (end of June 2013) to other PV stations under the process of activation. The main difference between the farmers’ and the others’ PV investors, lies in the guaranteed tariff. While the farmers maintained the tariff that is defined in the PA, the others fortified a tariff, which was somehow lower than the one defined in the PA but clearly much higher than the one that had to be granted to them pursuant to the Law 4093/2012.
Eventually, the Law 4254/2014 [
10], the so-called “new deal”, foresaw the retroactive reduction of the tariffs for the already existing PV stations as well as other radical measures. More specifically, all tariffs were readjusted from April 2014 based on their activation date, their nominal installed power and the use of subsidies. Exemptions were made for PV stations installed by farmers for which tariffs were reduced by 12% regardless of the aforementioned factors. The PAs are extended by a period of seven years during which the tariff is defined equal to 90 €/ΜWh or as determined by the Market Operator. In any case, during that extended period, the maximum annual energy, which was to be compensated, could not have exceeded 1500 kWh/kW. Another provision, further deteriorating the profitability of PV investments, was the mandatory retroactive discount over the total aggregated gross income that corresponded to the energy generated during 2013 for each PV station. Accordingly, the owners of the PV stations had to issue a credit invoice, equal to 20% and approximately 35% of the annual gross income from PV stations with installed capacity lower and higher than 100 kW respectively. The solidarity surcharge was then imposed upon the value of the income, as calculated after the deduction of the value defined by the credit invoice. Finally, this Law abolished the annual tariff adjustment according to the 25% of the Consumer Price Index of the previous year. Based on the previously described legislative and regulatory framework,
Figure 1 shows the chronological variation of tariffs without account for the reduction imposed by the Law 4254/2014. It becomes obvious that the tariff for PV stations connected to the LV network (≤100 kW) is higher than the ones connected to the MV network (>100 kW) due to the higher installation cost they face. Notably for PV stations connected to the MV network, the measuring device is installed on the MV side of the local LV/MV substation, which means that it records less than the generated energy due to the copper and iron energy losses of the LV/MV transformer.
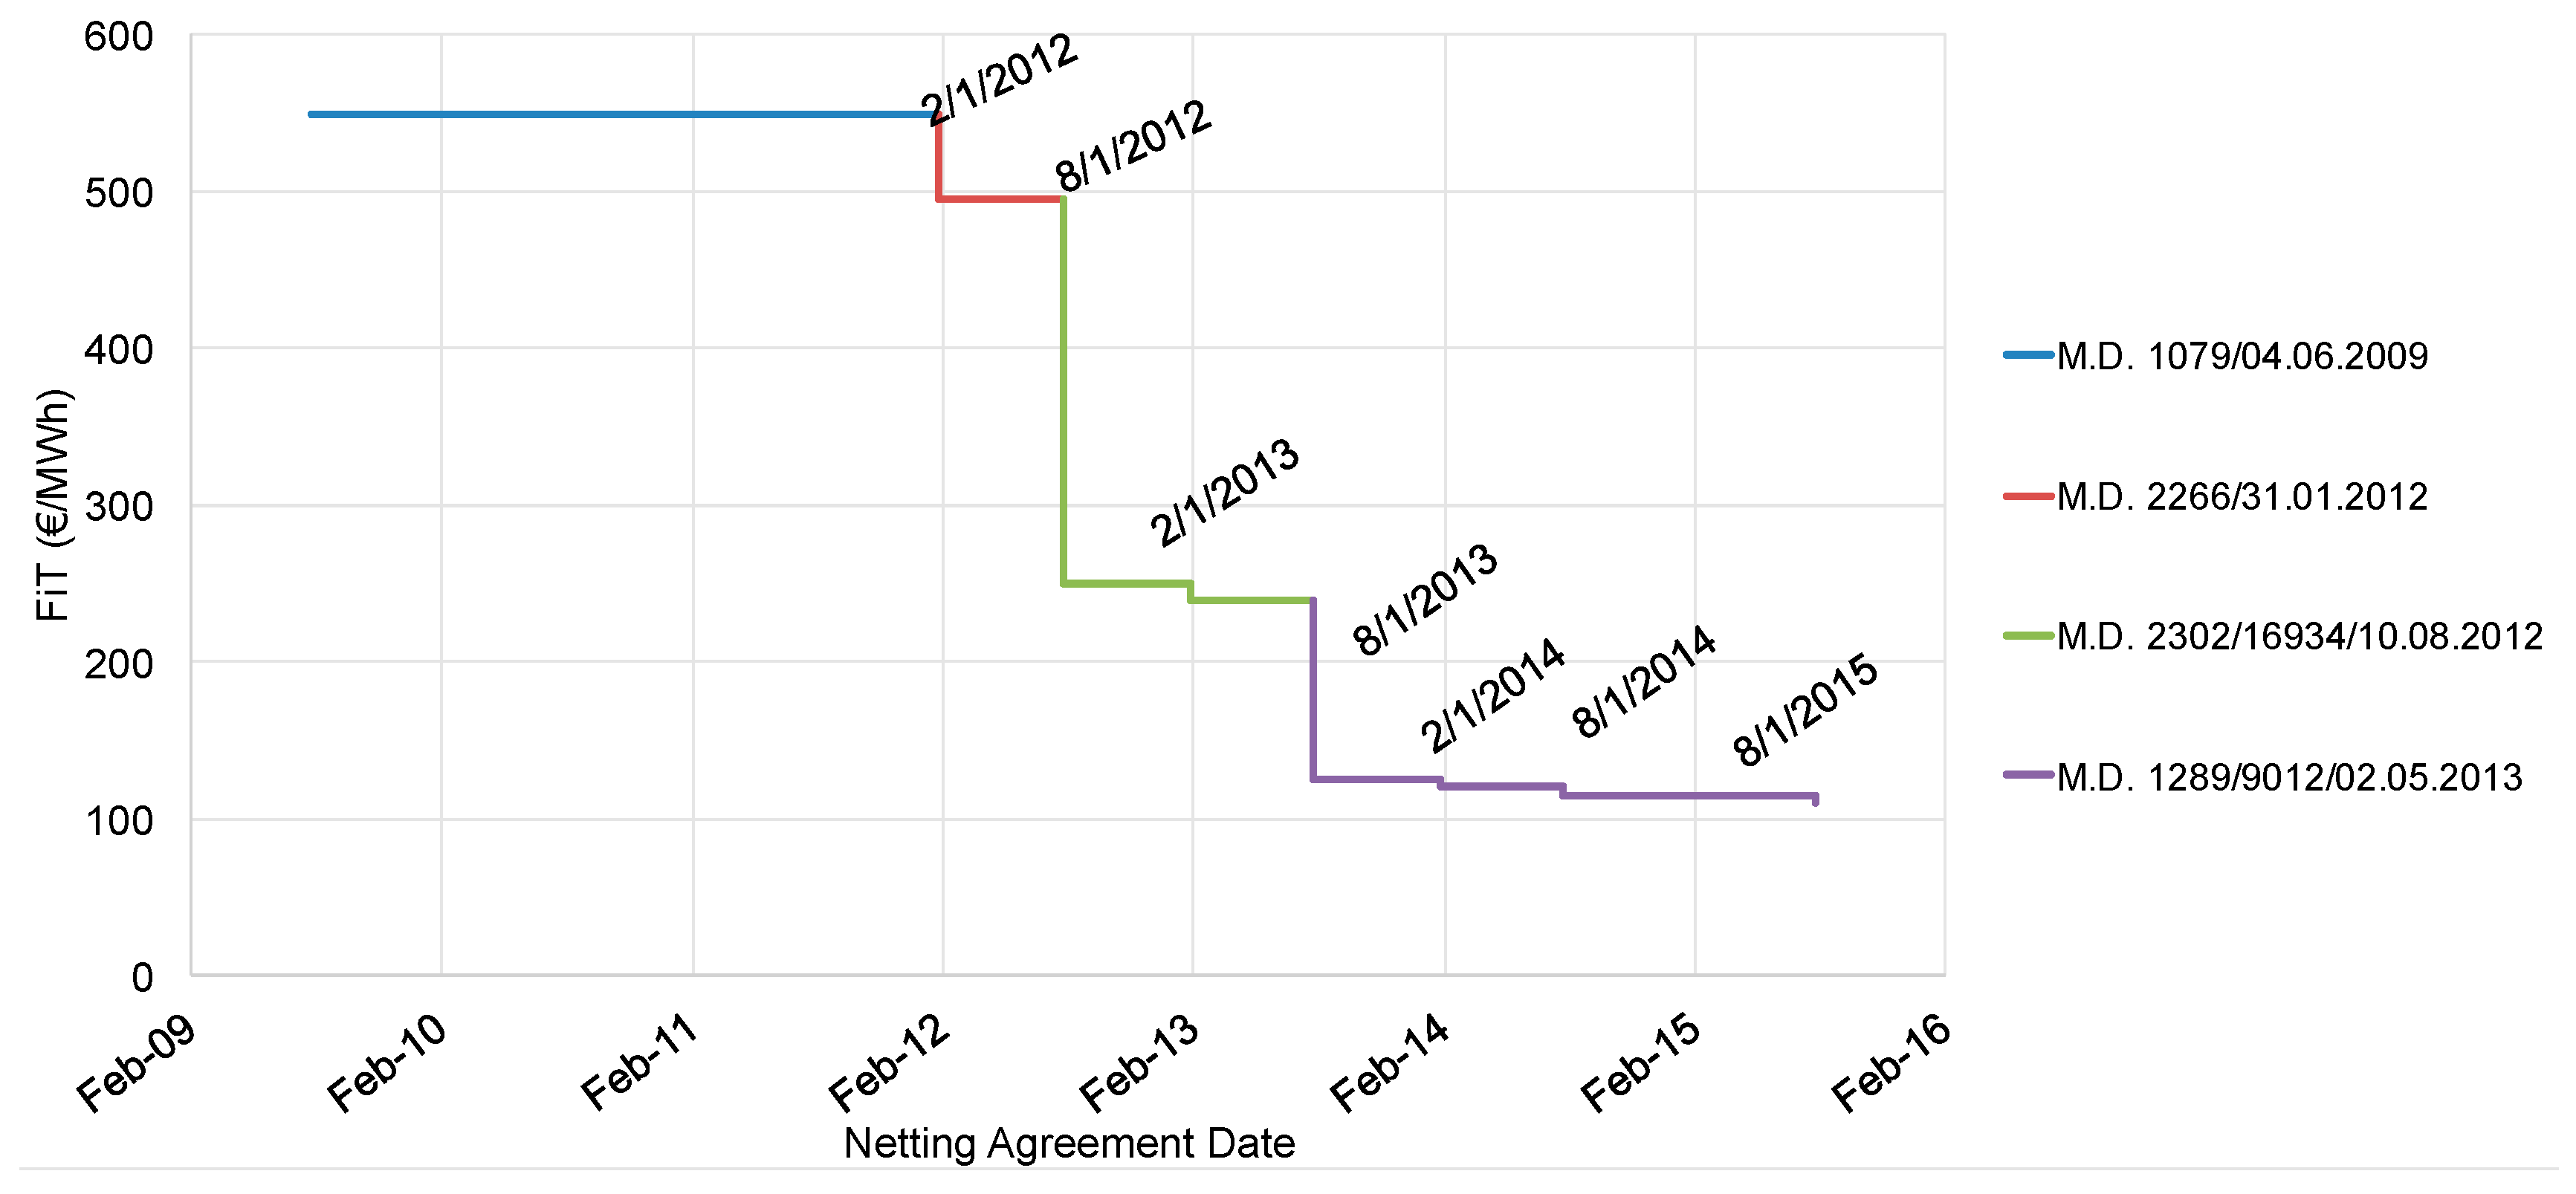
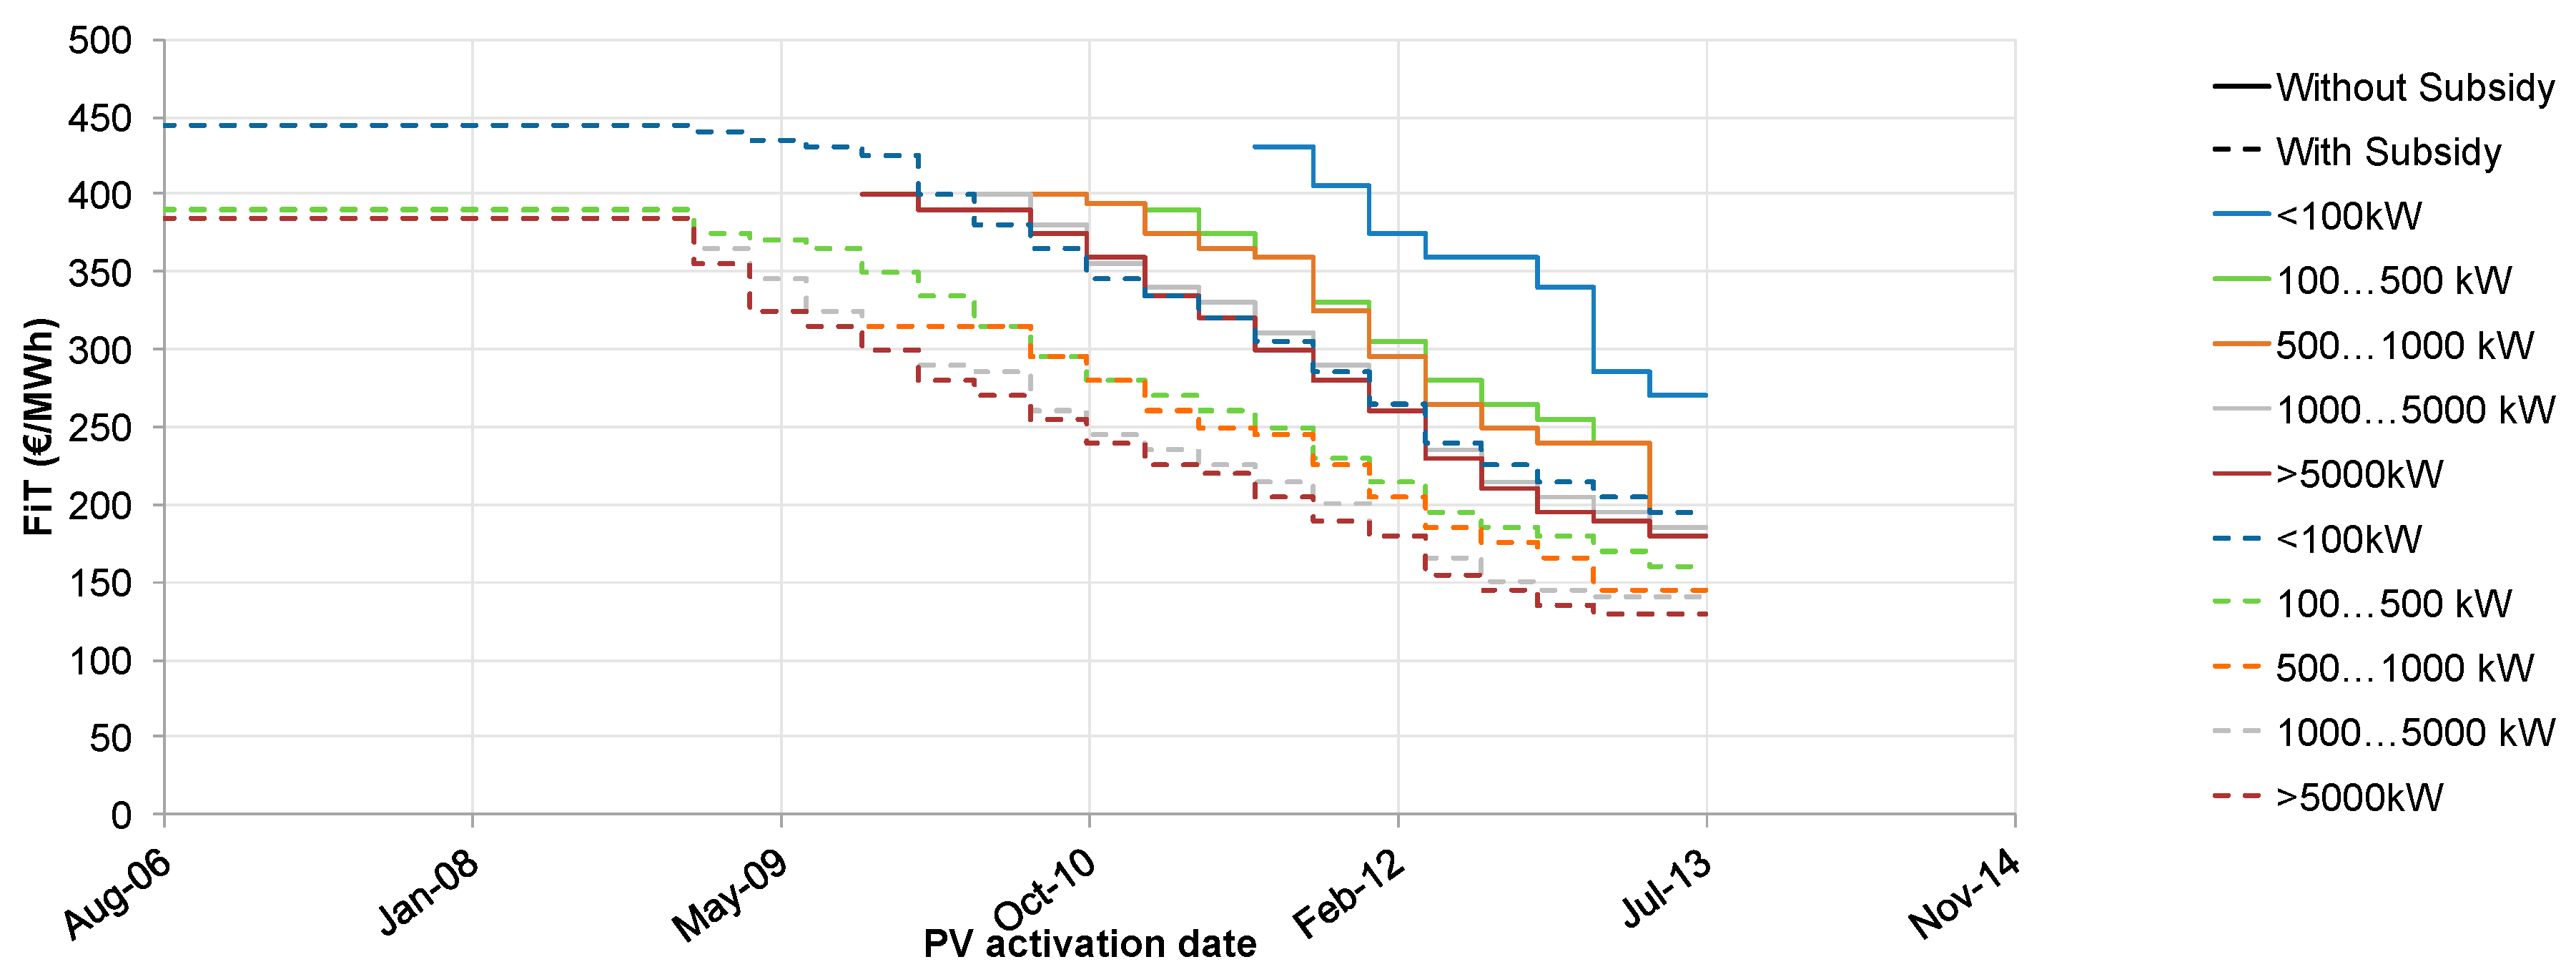
2.2. The Case of Small Photovoltaic Rooftop Systems
The MD 1079/2009 [
29] established the duration of the NA to 25 years and set particularly high tariffs (550 €/MWh). The tariff was also annually adjusted according to the 25% of the Consumer Price Index of the previous year. Like in the case of LV and MV PV stations, the MD 2266/2012 (January of 2012) [
30] imposed an approximate 10% reduction of the tariffs in comparison to the ones having prevailed at that time by the previous regulatory framework. The same provisions were also taken regarding the transitional period and the already submitted applications for the NA. Likewise, the MD 2302/16934/2012 (August of 2012) [
31] envisaged a further 45% reduction of the tariffs in comparison to the ones referred to the above-mentioned MD 2266/2012. Approximately a year later (May of 2013), the MD 1289/9012/2013 [
32] set another additional 20% reduction of the tariffs. Finally as described above, the Law 4254/2014 foresaw the retroactive reduction of the tariffs also for the existing PV rooftop systems, the seven years extension of the NAs as well as abolition of the annual tariff adjustment according to the 25% of the Consumer Price Index of the previous year.
Figure 2 presents the chronological variation of the tariffs excluding the reduction imposed by the Law 4254/2014.
3. The Impact of Retroactive Legislative and Regulatory Adjustments on the Development of Solar Power Stations (Law 4254/2014): A Qualitative Perspective
As aforementioned Law 4254/2014 re-adjusted the existing FiT rates. The reduction was held in line with the plant activation date, installed PV power and the use or not of some form of subsidy for construction [
33] (see
Figure 3). These three parameters were crucial for assessing the economic viability of PV stations, especially since there was a rapid reduction in deployment costs, which was even greater for PV stations with larger installed capacity due to the economies of scale taking place.
Figure 3 depicts how the FiT rates evolved in accordance to the adjustments stipulated by Law 4254/2014. It is worth noting that the FiTs were set based on their quarter of activation instead of their granted price in accordance to the PA. This practically means that if for instance two PV stations had been registered with the same tariff but were constructed and thus activated in different quarters, they would receive another tariff (as stipulated by Law 4254/2014) and hence the reduction would have been different. This approach was adopted to account for the chronological reduction of the deployment costs. The solid lines relate to the cases of PV stations, which have been installed without the use of a grant. Instead, the dotted lines relate to the cases of those stations that have made use of subsidies for their construction. It is evident that for the latter case the charged FiT rates were smaller in relation to the former casein an attempt to converge the return on these two (2) categories of photovoltaic investments. Finally, PV stations were categorized into five (5) categories according to their installed capacity. Α new differentiated tariff rate was attributed in each of the five categories to account for the reduced installation costs based on the economies of scale.
When contrasting the FiT prices, as originally defined by the regulatory framework during the PA, with those ultimately shaped under the Law 4254/2014, it is observed that for the case of LV PV stations (i.e., nominal capacity <100 kW), the rates were cut back by 0 to 30% approximately. The upper limit of this support cost reduction went up to 50% for the case of an installation subsidy use. Likewise, for MV PV stations, their FiT rates were curtailed by 0 to 50%, greatly affected by the size of the installed power of the PV station. Respectively the maximum clipping level in this category reaches 65% in the case of subsidy-taking. For the case of LV PV stations installed by farmers, the cutback of the Fit rates, amounted to 12% regardless of their activation date. In the case when the initially contracted FiT was lower that the FiT rate imposed by Law 4254/2014, no further change was imposed on the initial rate.
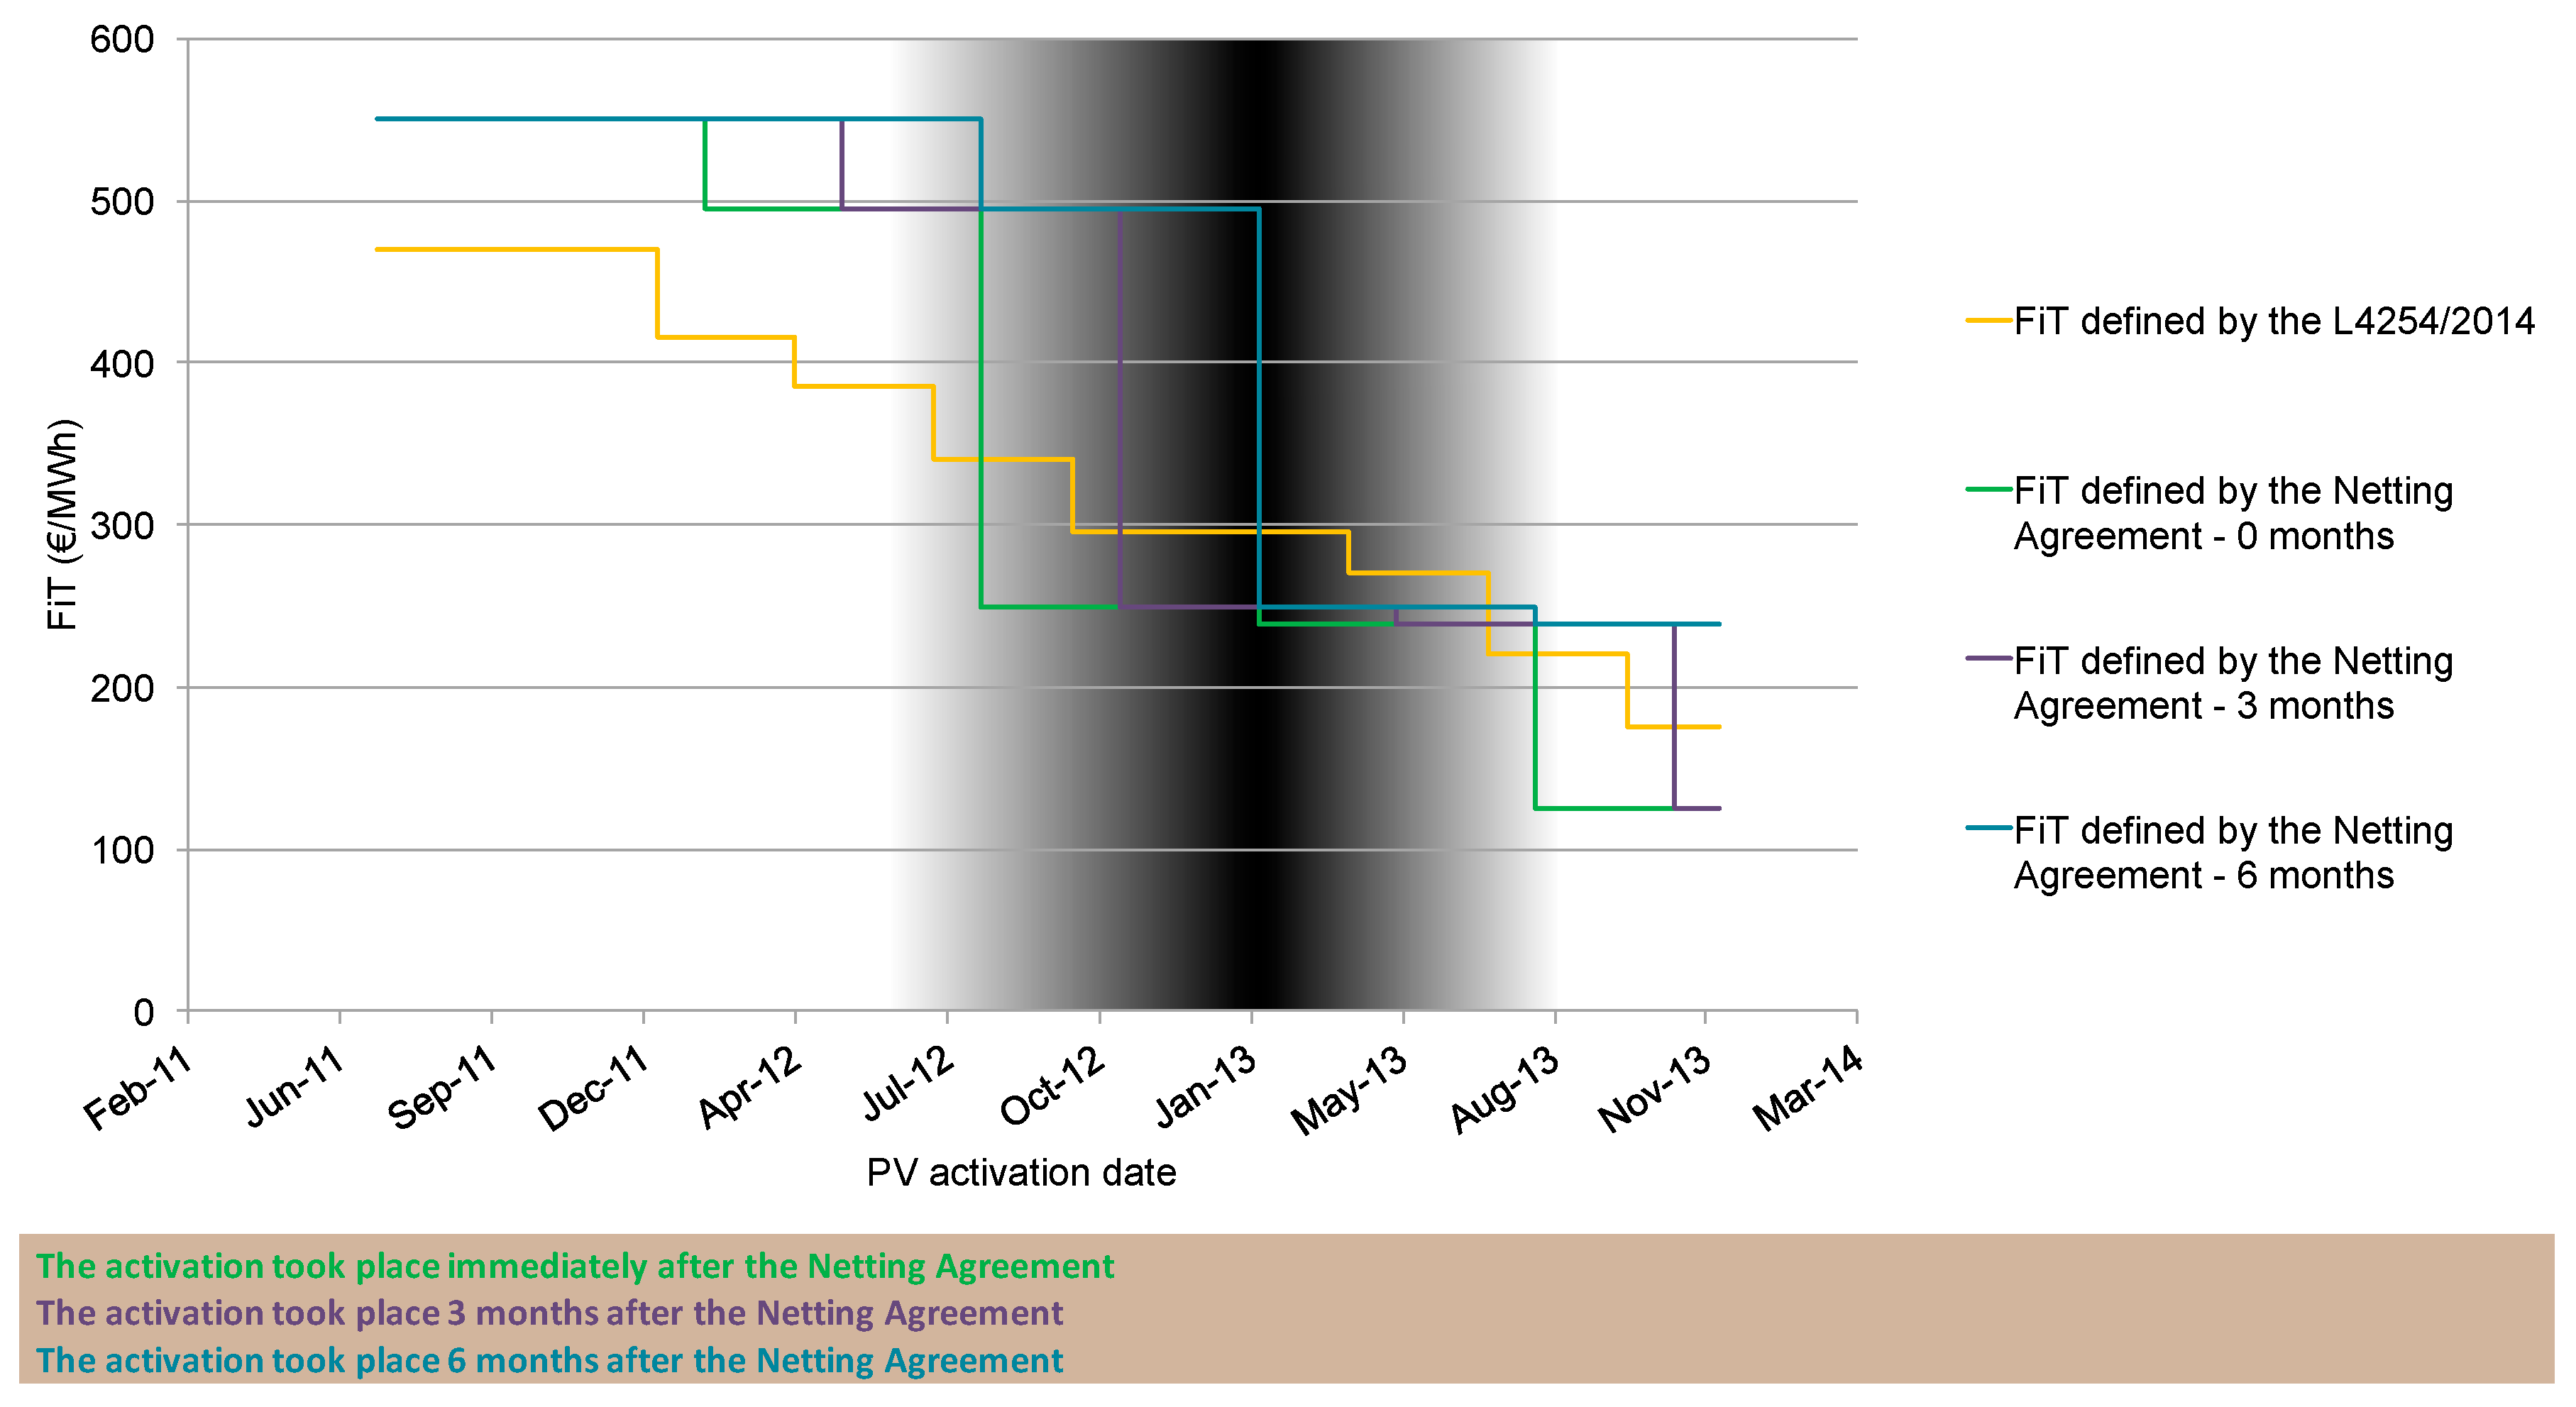
Finally,
Figure 4 shows the new FiT rates as re-adjusted by Law 4254/2014 for the Special Program of PV rooftop systems. According to the terms of the program, the ultimate length of time permitted between the signing of the NA and the PV station activation is six months. Thus to allow for a comparison between the initial rates and the adjusted ones imposed by the Law, we hypothesized that a PV station could be activated immediately after the signing of the agreement, after 3 months, or after 6 months the latest. As depicted in the graph, the yellow line, reflecting the re-adjusted rates, follows a decreasing trend. This implies that the longer the delay in constructing and therefore activating the PV power station, the more likely it was for the station to be granted with a lower rate according to Law 4254/2014 and thus the larger the cutback in the price. Also for this case, the same provision applies, which stipulated that should the adjusted FiT rates be higher than the already contracted ones, no further change in the initially contracted prices would occur. These cases are the ones marked with a black font in the graph. Overall, we approximate that PV rooftop systems underwent a price reduction in the range of 0 to 40%.
4. Empirical Insights from the Deployment of Photovoltaic Stations in Greece
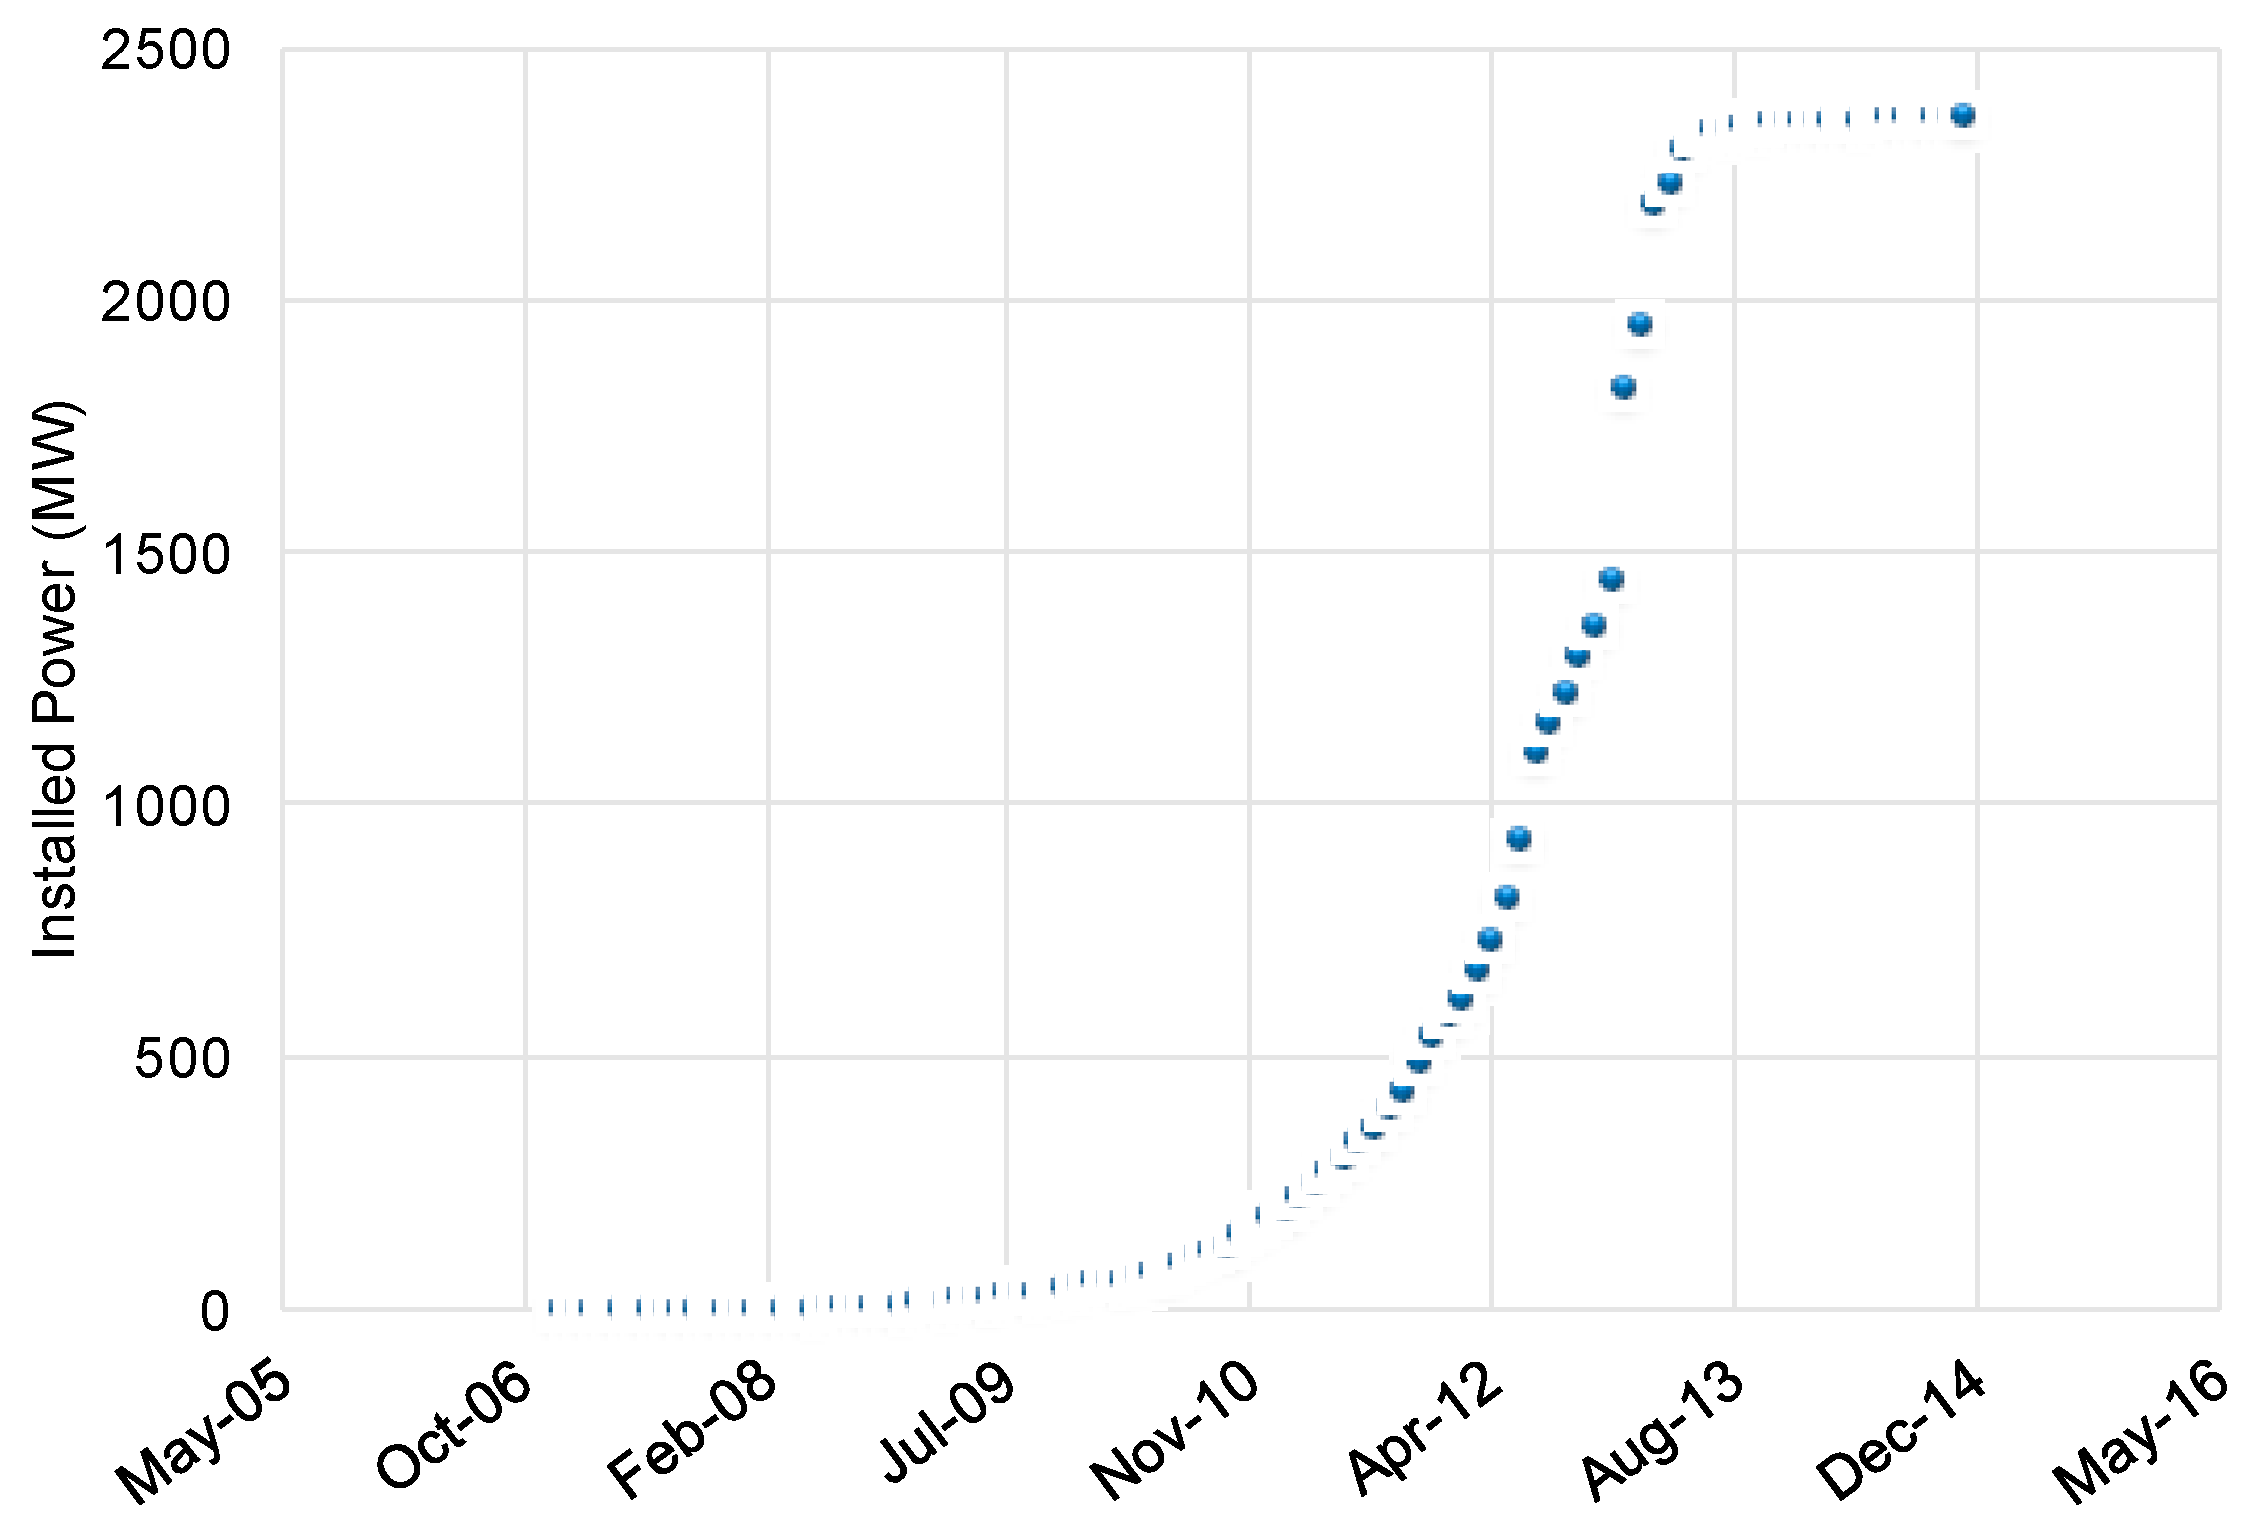
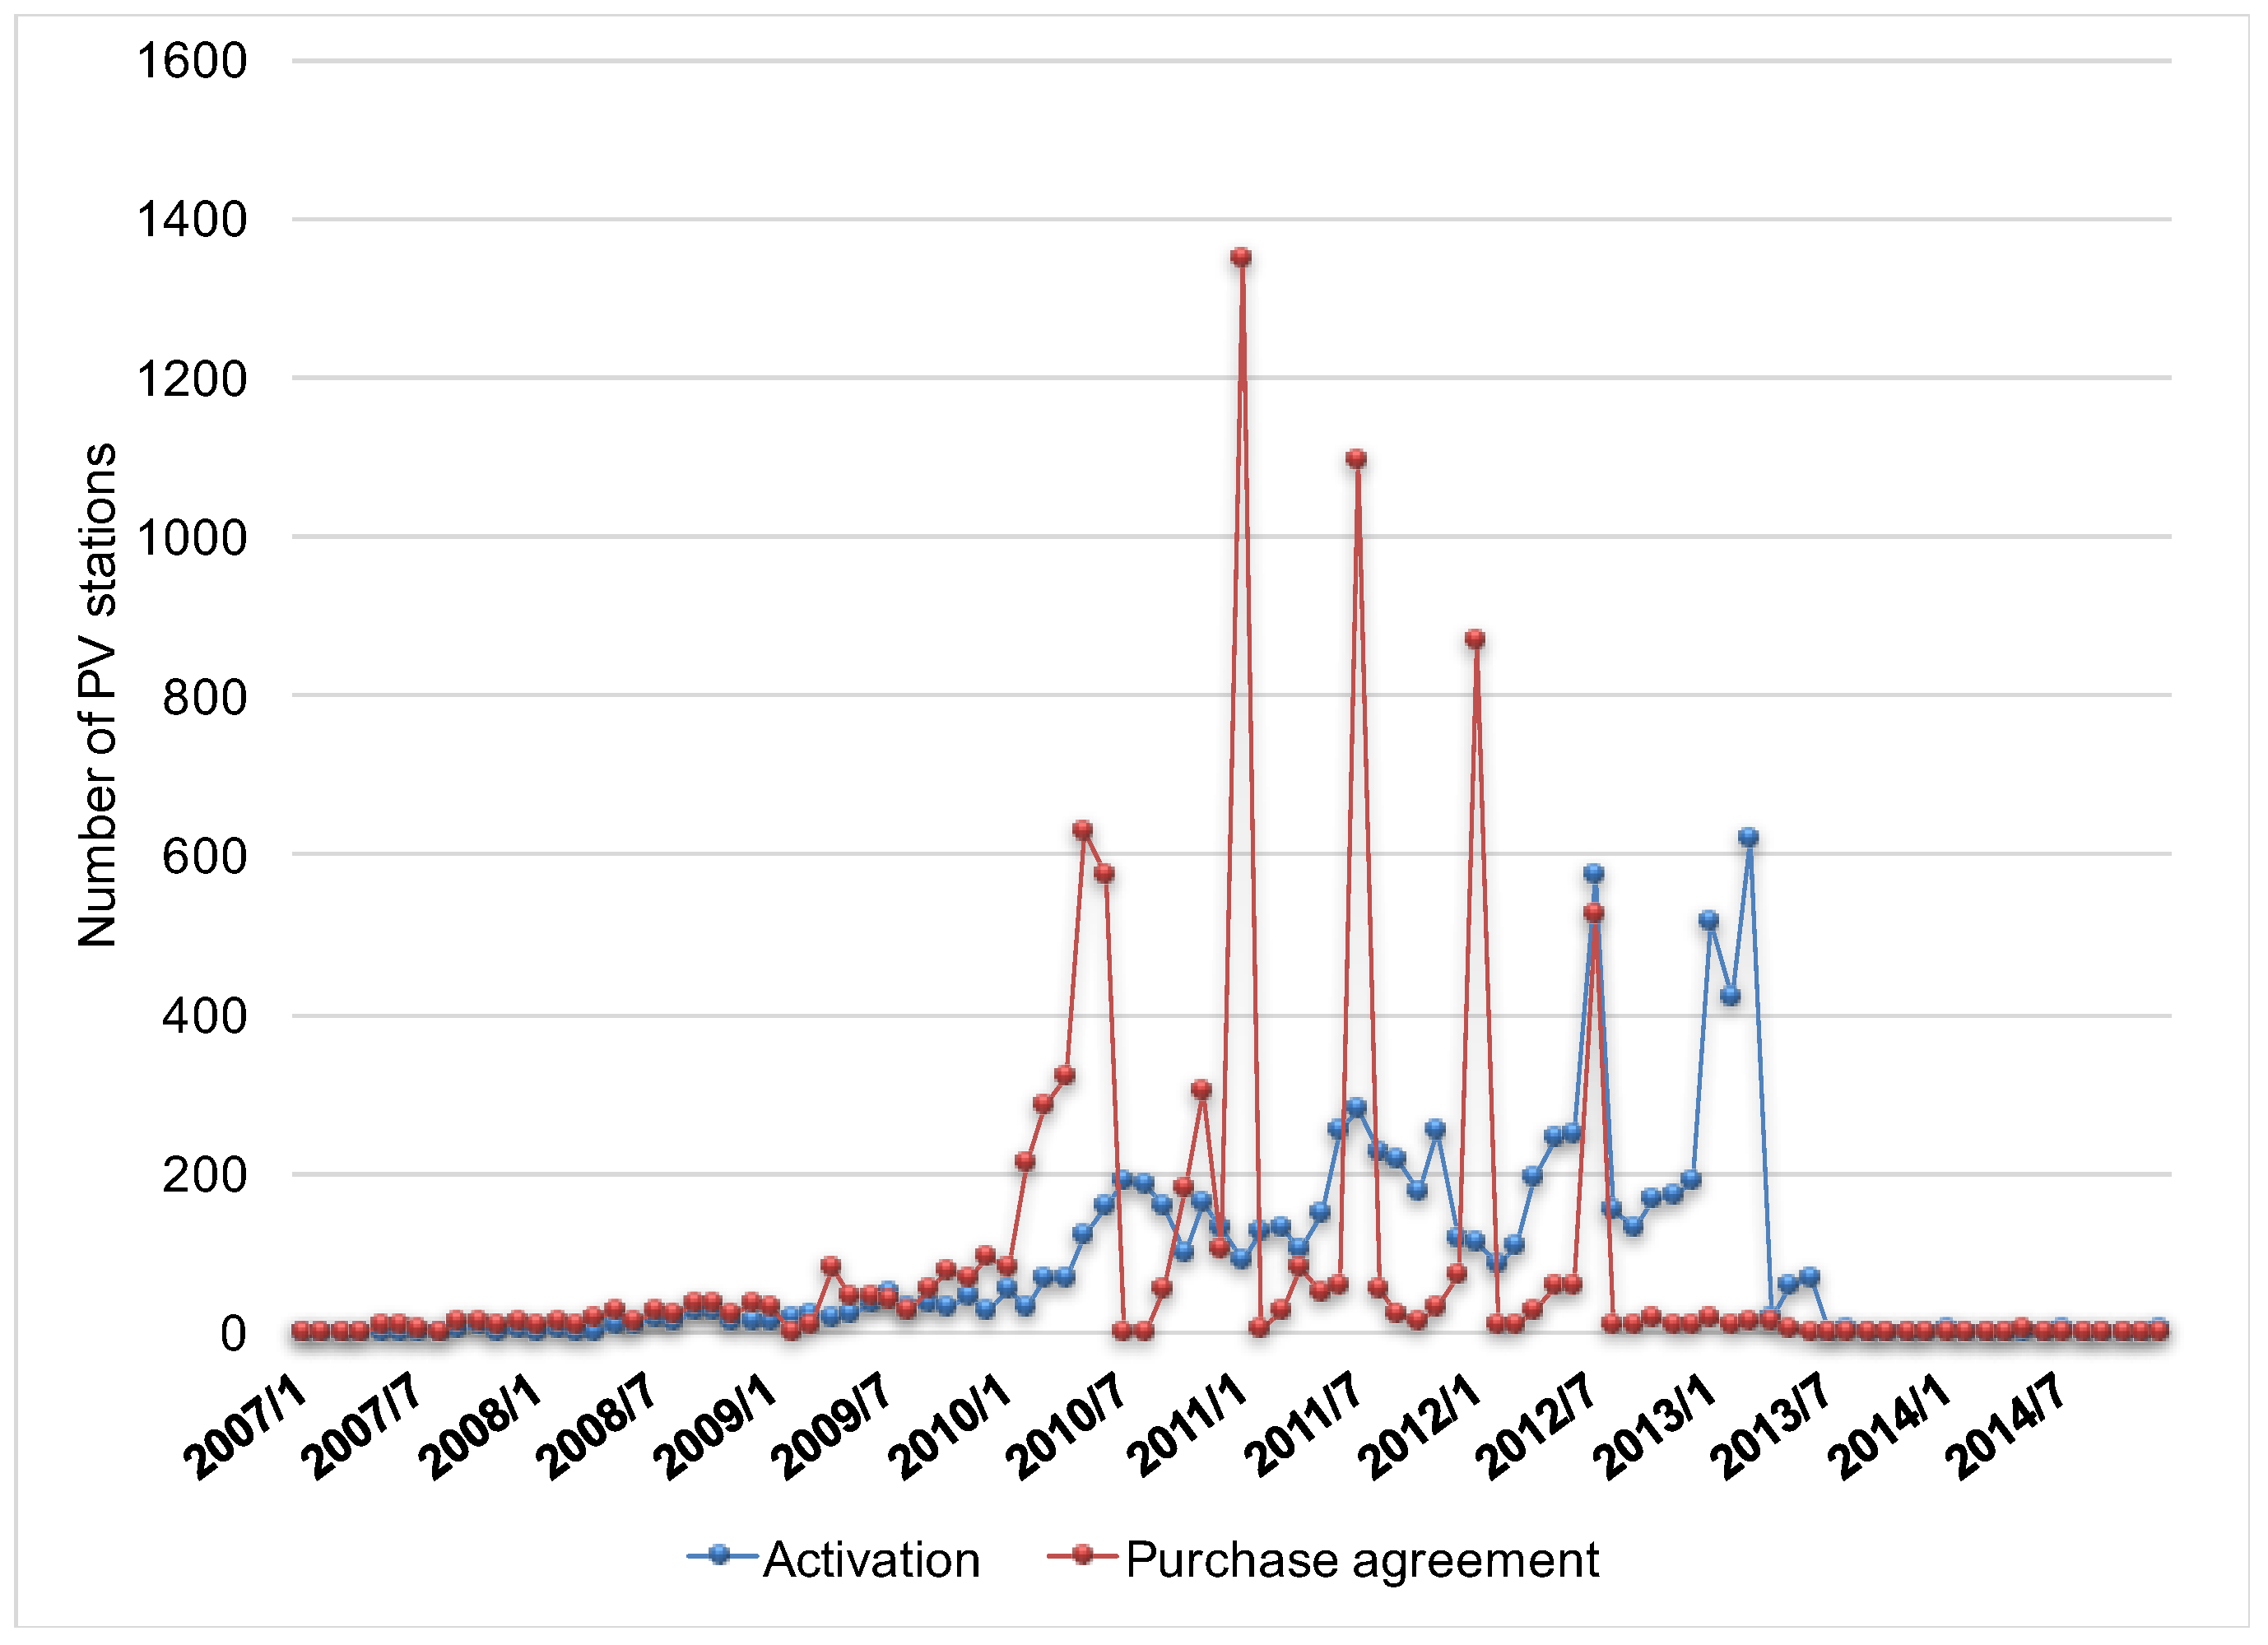
In this section the development of the PV stations is presented from the outset of the regulatory framework up to 2014, the year in which investors’ interest was sharply interrupted.
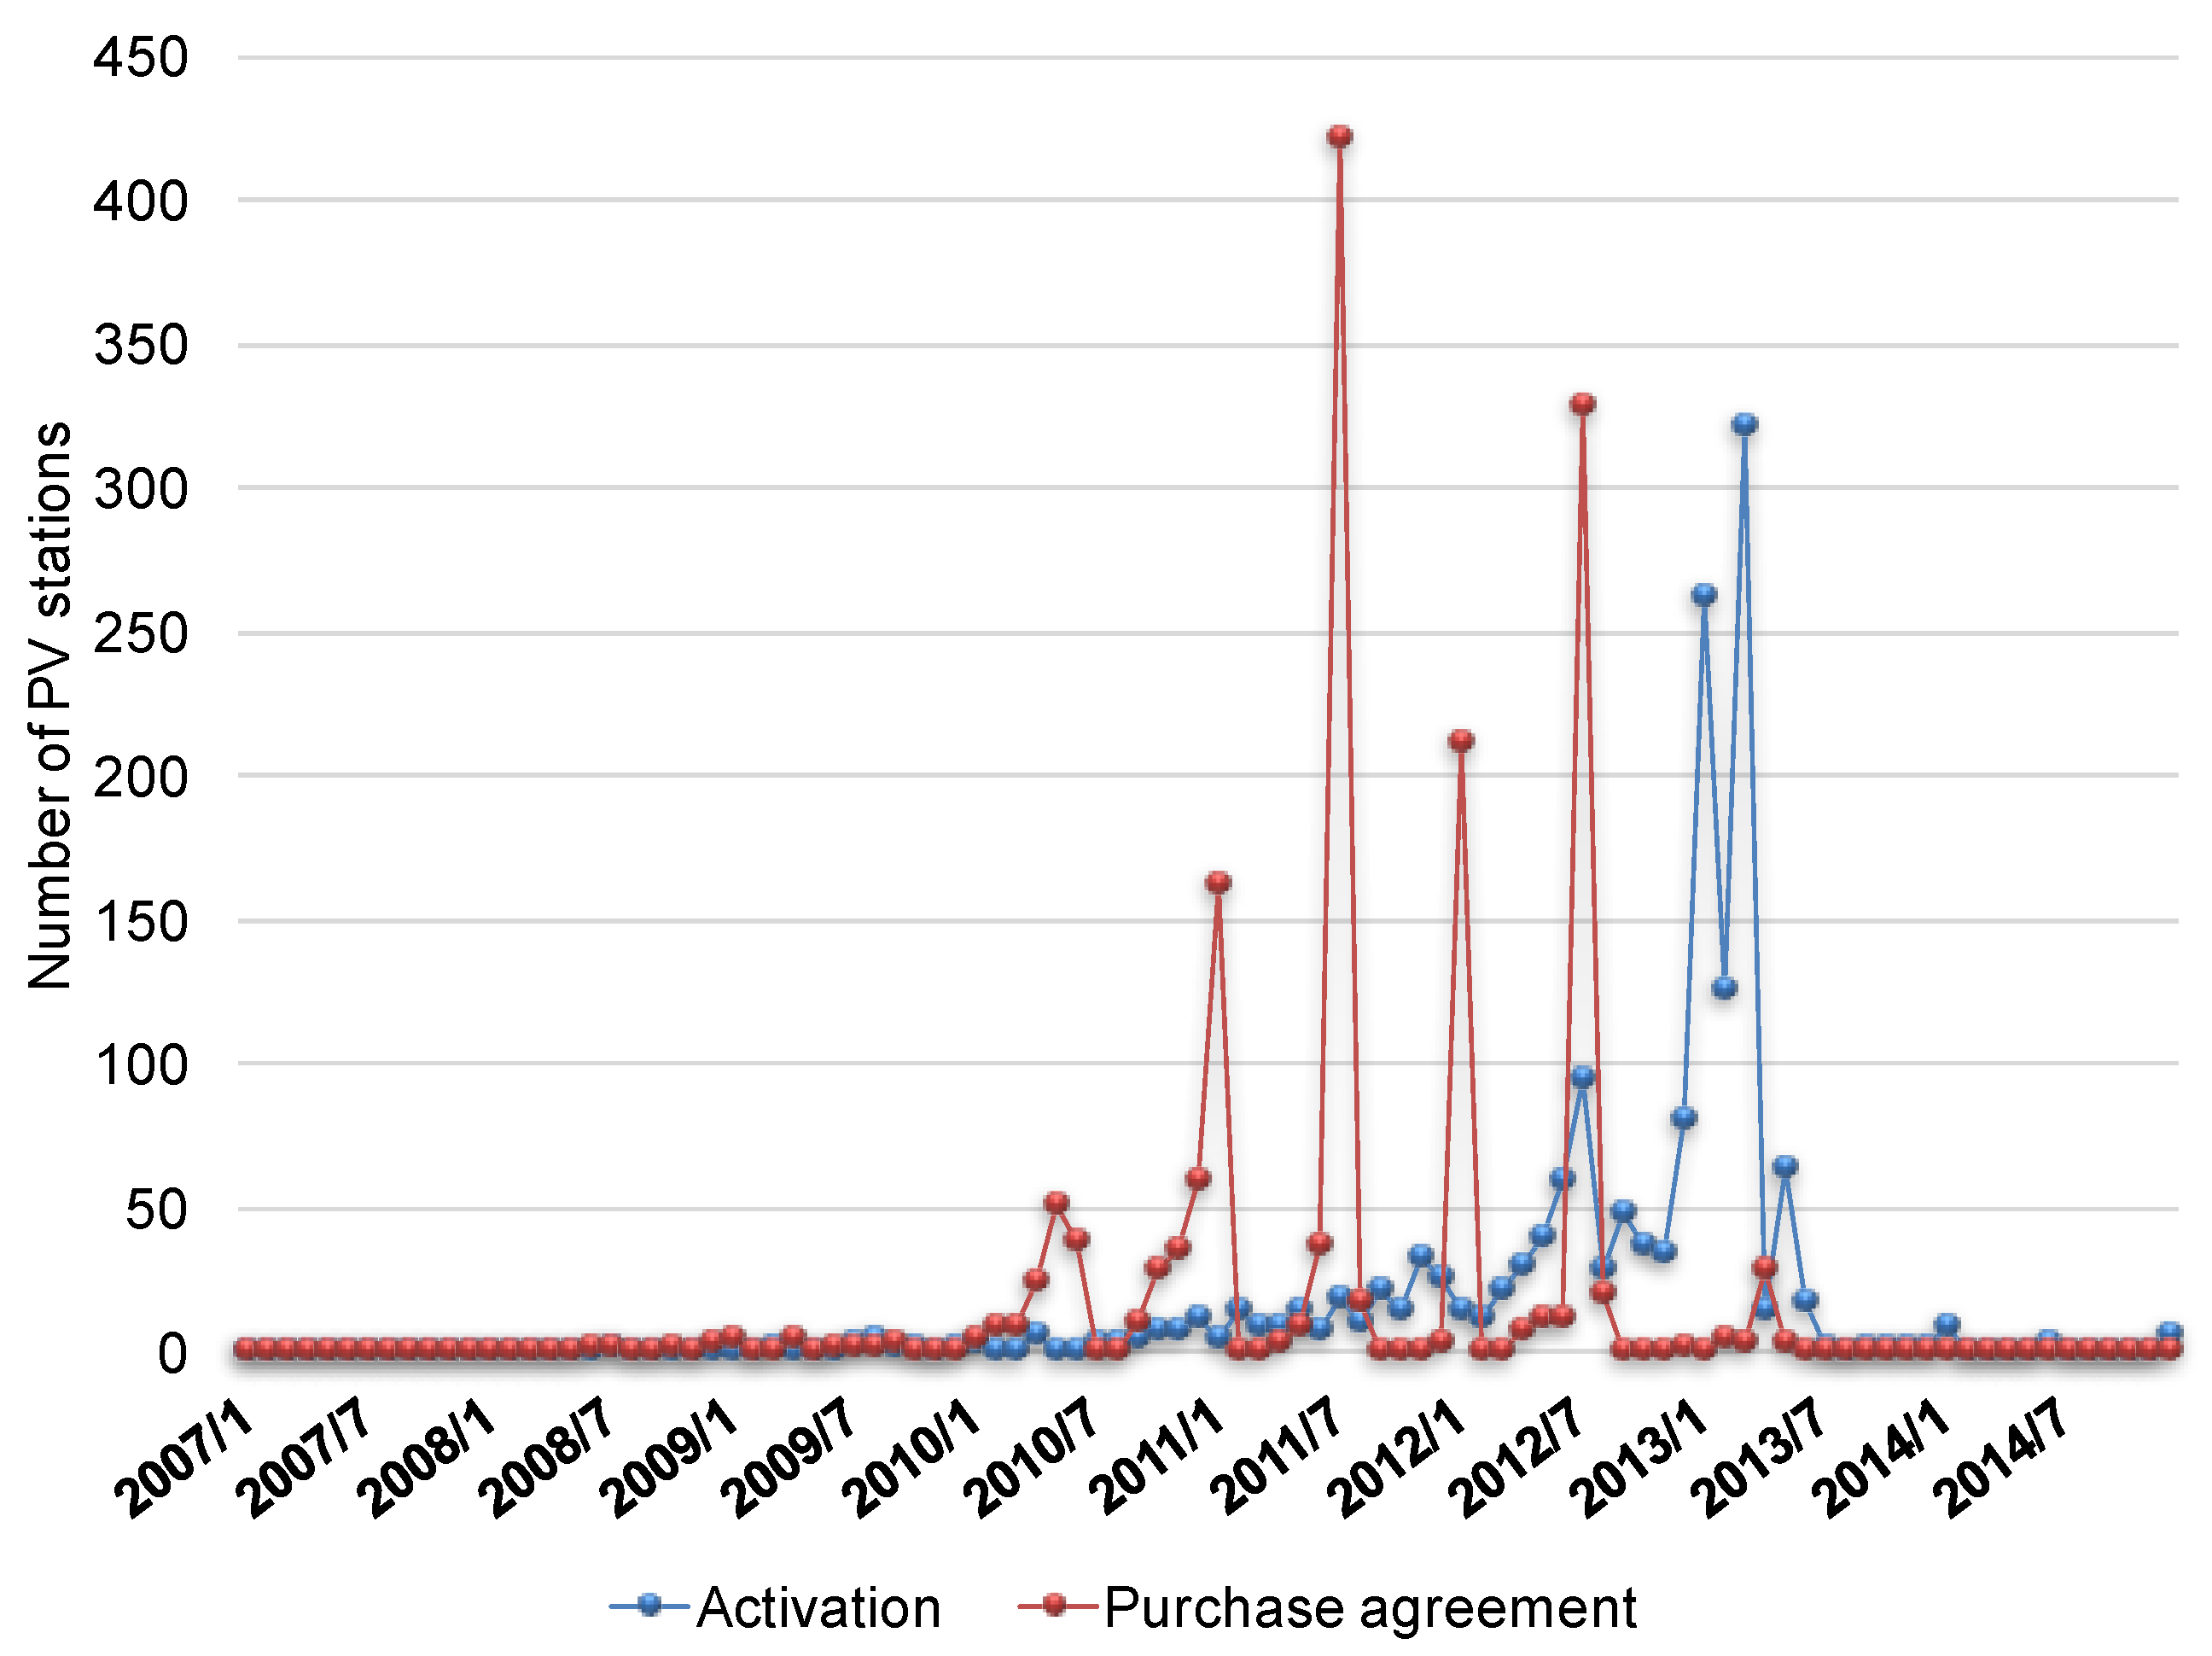
Figure 5 depicts the chronological development of PV stations in Greece. It is obvious that within 2.5 years (from the beginning of 2011 until the mid of 2013) 2.3 GW of PV stations had been installed. Since then the development of PV stations in Greece almost stopped.
Data on requests for signing PAs were plotted in relation to data on the development of the PV stations activation, available from the Hellenic Electricity Distribution Network Operator (HEDNO). The empirical analysis displays the chronological progression of the requests for signing PAs against the timing and amount of activations of the PV stations, in relation to the changes of the regulatory framework as previously described.
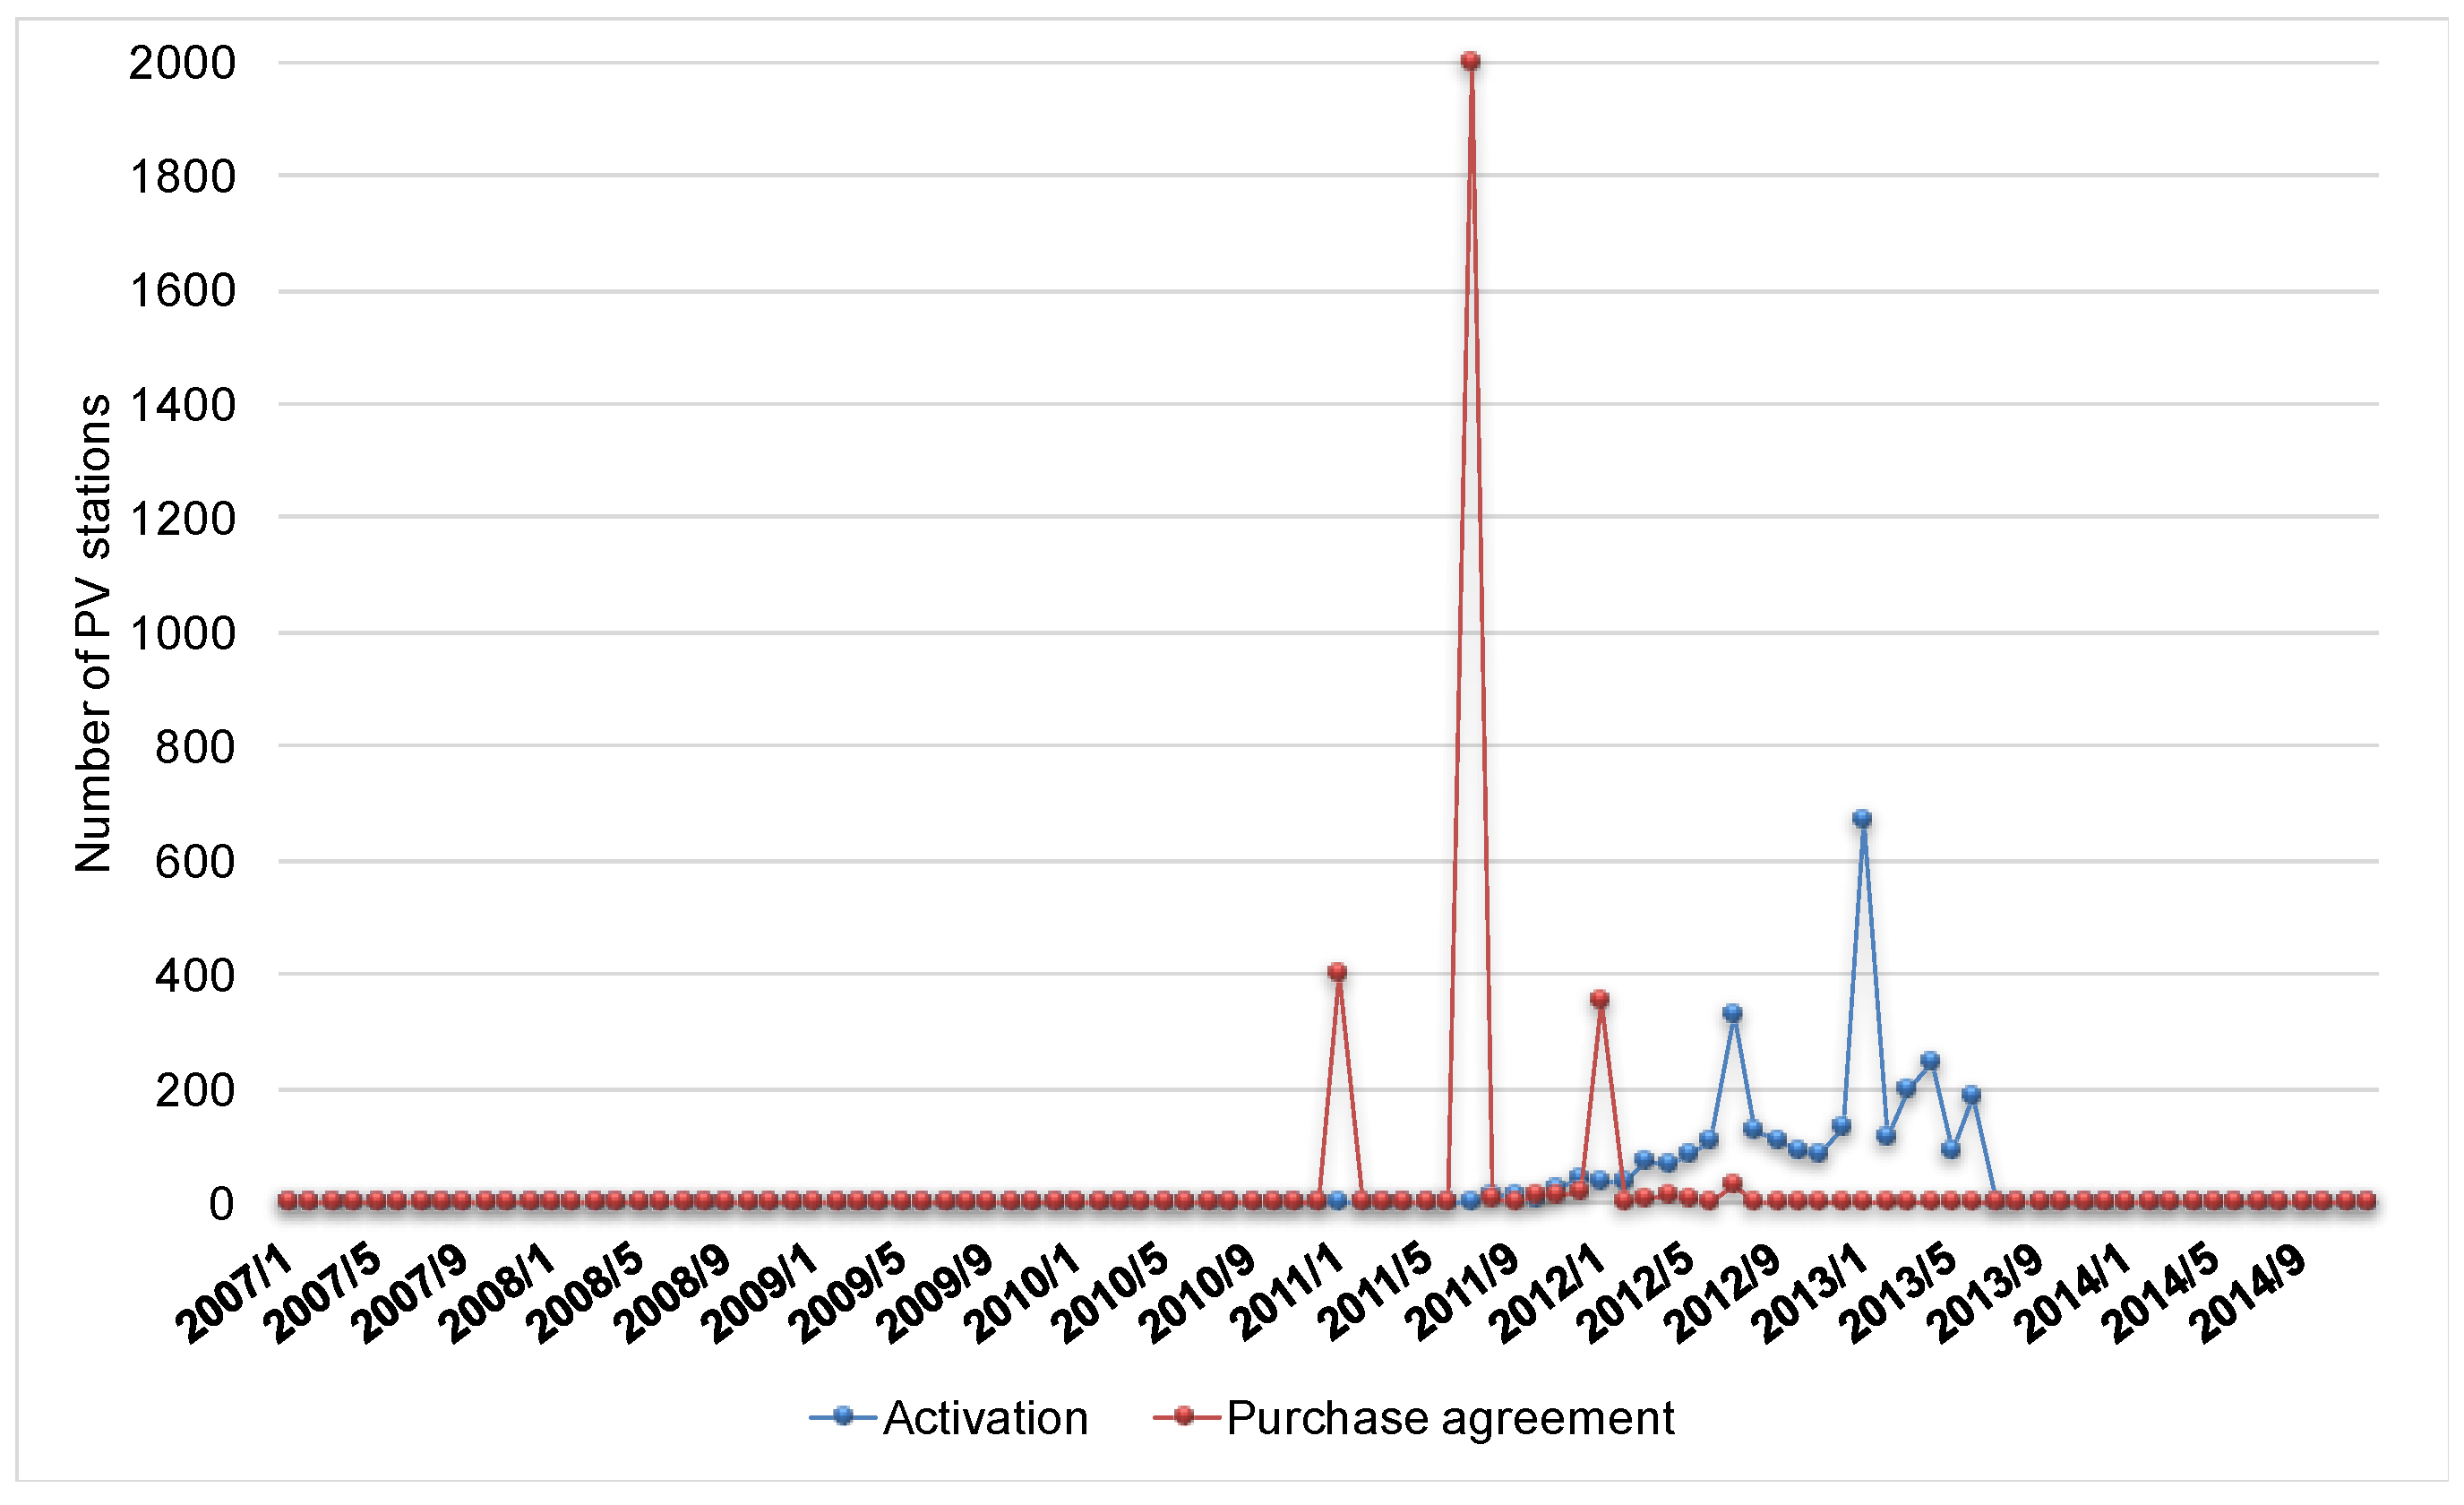
4.1. The Case of Low Voltage Photovoltaic Stations
For LV PV stations (see
Figure 6), it becomes obvious that the demand for applications for signing a PA and performing the final activation for PV stations peaks in certain non-consecutive months.
A common feature of the four months that accumulate the largest number of applications for PA is that the FiT price in the subsequent month is reduced (see
Figure 6). Regarding the chronological evolvement of their actual activation, it can be observed that there is a large number of contracts having been activated during January and July 2012 as well as in February and March 2013. This is due to the fact that, by that time, the 18 month-interval was ending and also due to the provisions of Law 4093/2012, which set March 2013 as the ending date for the maintenance of the contracted FiT rates. The current installed capacity of LV PV stations except for farmers’ amounts to 524 MW corresponding to a total of 8178 stations.
4.2. The Case of Low Voltage Photovoltaic Stations—Farmers
Regarding demand for investments in LV PV stations by farmers, as reflected in the applications for signing a PA, the vast majority of PAs were signed in July 2011, with a small exception for the months of January 2011 and 2012 (see
Figure 7). The reason, as in the previous case of LVPV systems, is the reduction in the FiT price in the following month, from 419.43 €/MWh to 394.88 €/MWh. Regarding the timing of their activation, it can be observed that most activations largely took place in July 2012 and January 2013 and from March to June 2013. For the former period, this trend is also attributed to the ending of the 18 month-interval, while the latter period of March to June 2013 was characterized by the incentives provided by Laws 4123/2013 and 4152/2013. These laws provided an extension of the PV activation deadline preserving the contracted FiT prices and thus implicitly removing the 18-month-interval.
When comparing the total number of activations between the previous case of simple LV PV systems, and the ones conducted by farmers, for the same period of March to June 2013, it becomes evident that the privilege of extending the 18-month interval, provided only in rural PV received high acceptance, which can be determined approximately to 15% of the installed capacity of LV PV systems by farmers. The current installed capacity of PV LV farmers is equal to 283 MW and corresponds to a total number of 2895 stations.
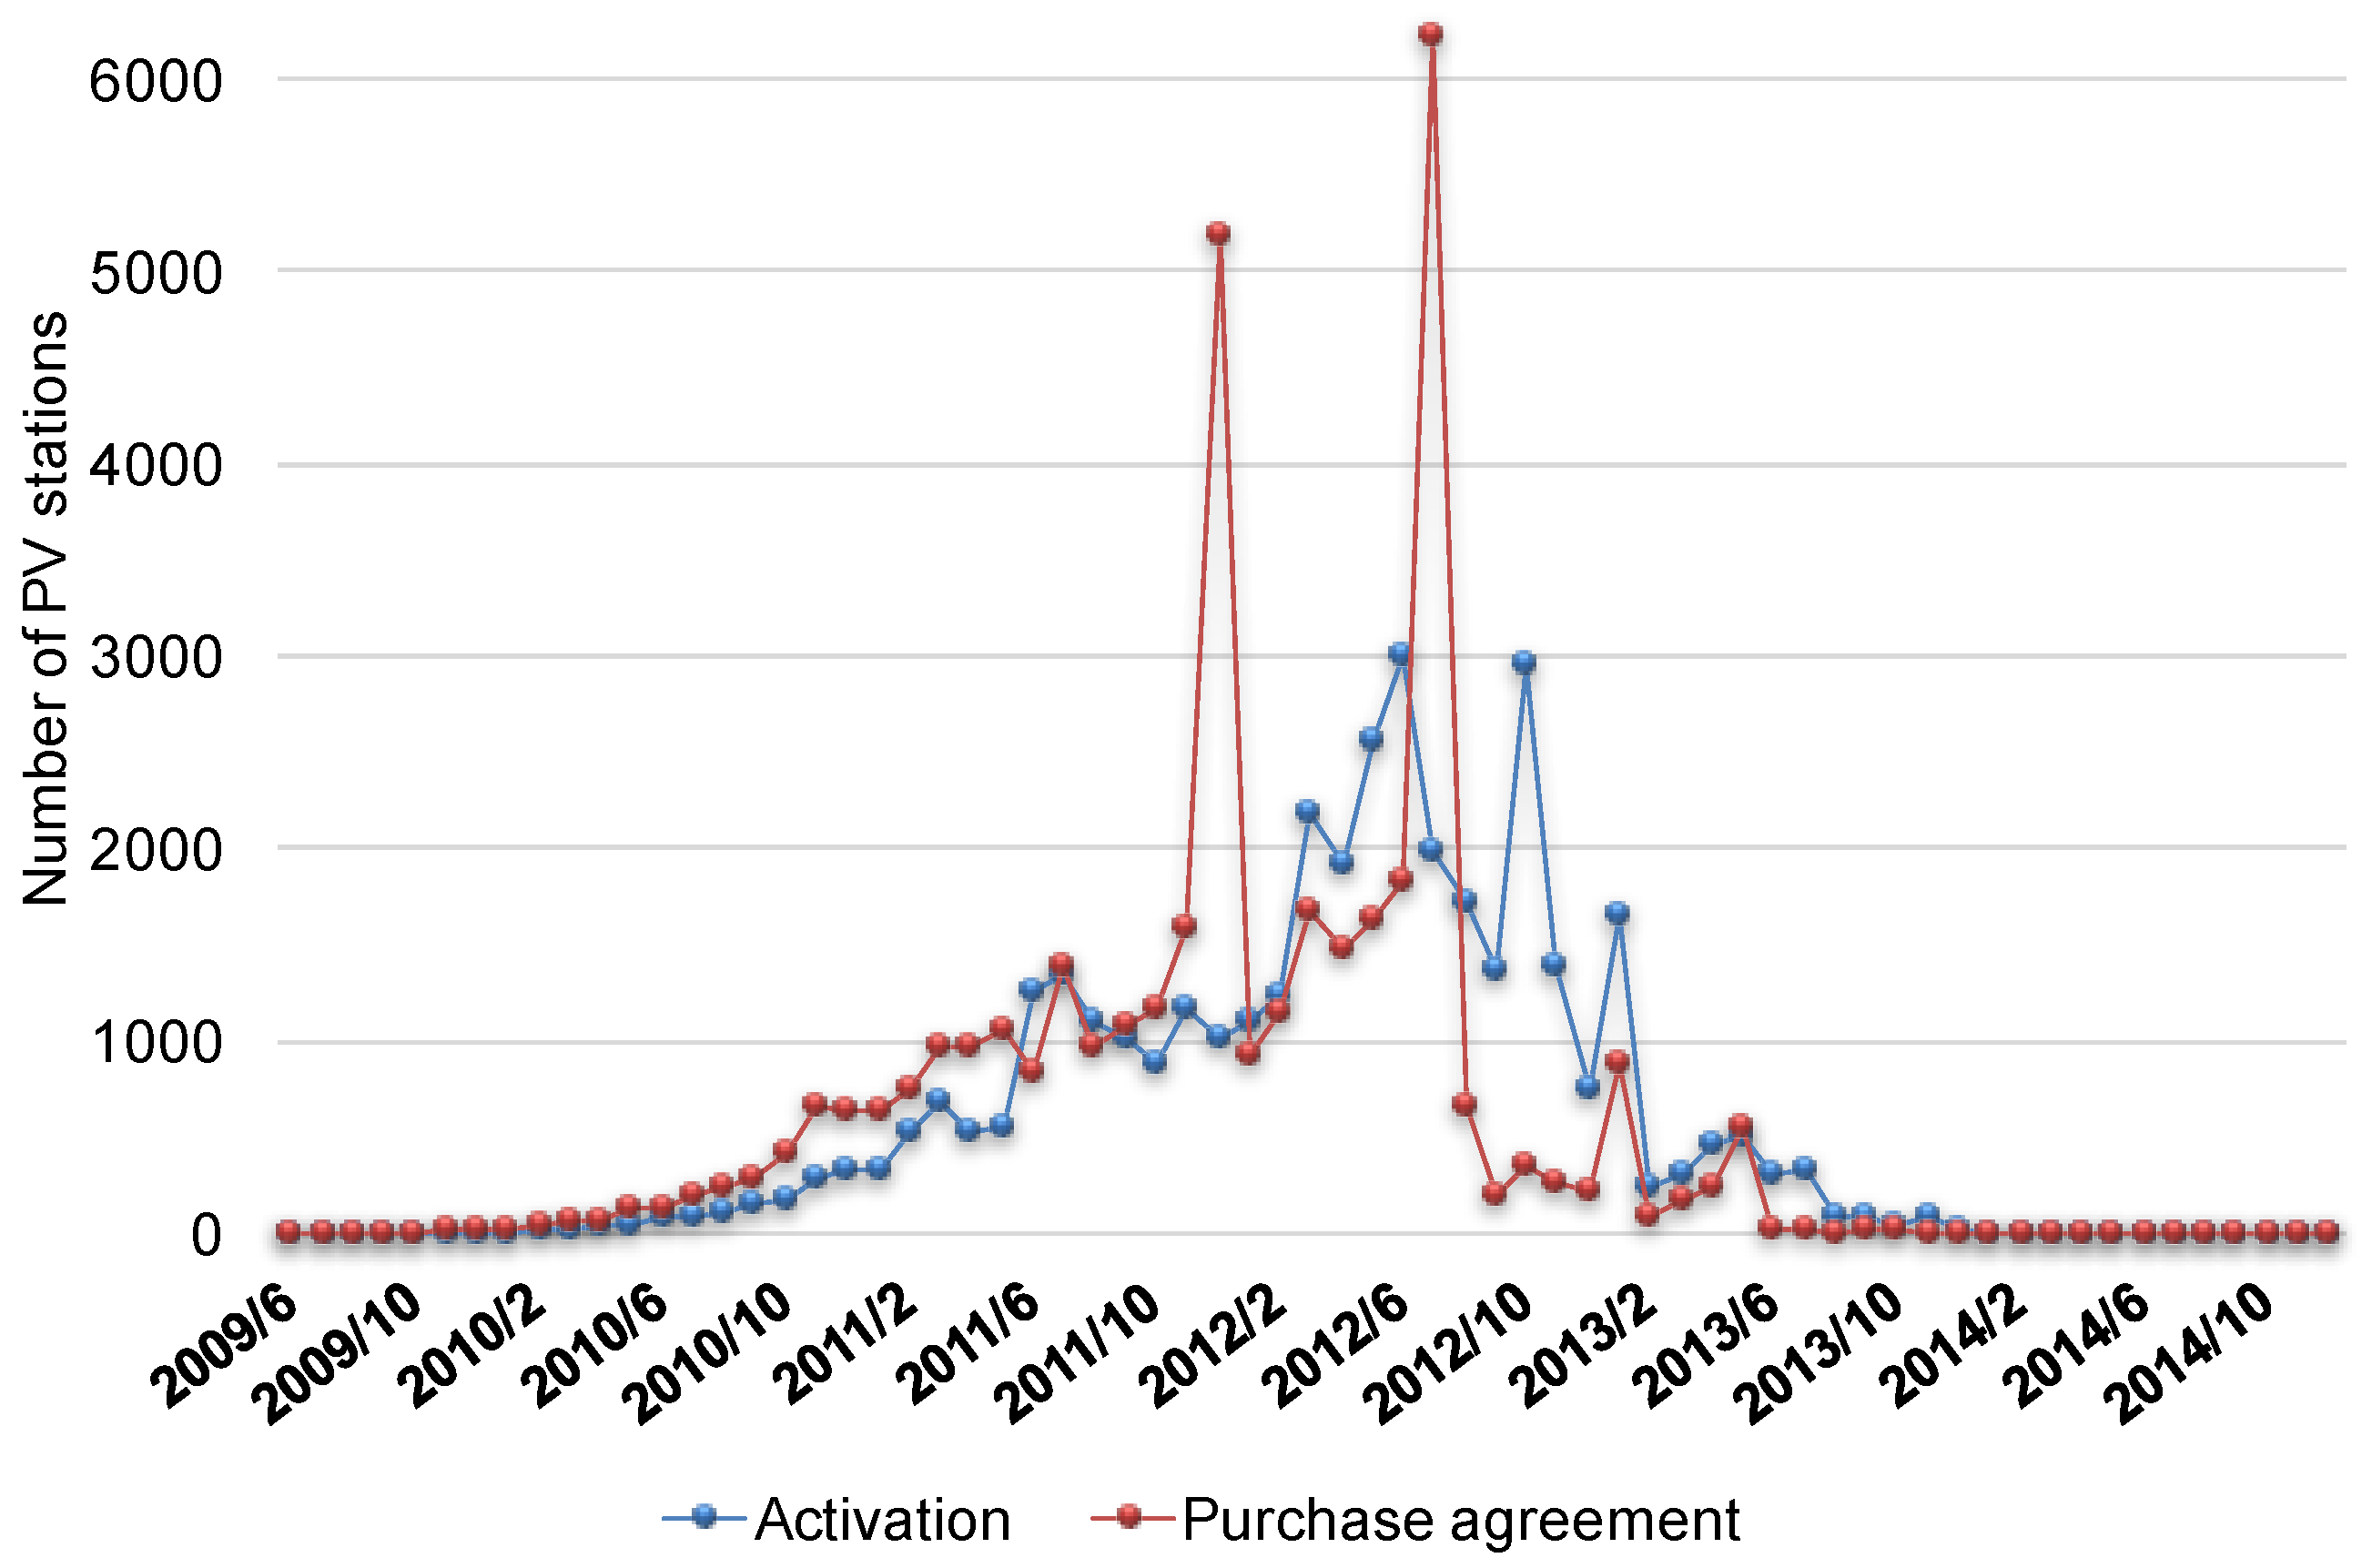
4.3. The Case of Medium Voltage Photovoltaic Stations
The same analysis was undertaken with respect to MV PV stations. The majority of PAs for this type of PV stations were signed during the months of July 2011 and especially in January 2011 and in January and July 2012 (see
Figure 8). In fact the contracts signed during those intervals represent a very large part of the total installed capacity of MV PV stations, for the same reason as analyzed in the above-mentioned categories. Regarding their activations, a large number of activation contracts was carried out in July 2012 and during January, February and March 2013, which can also be attributed to the end of the 18-month period as well as the provisions of Law 4093/2012, which preserved the contracted FiT rates until March 2013. The currently installed capacity for this category of PV stations amounts to 1205 MW and corresponds to a total of 1588 stations.
4.4. The Case of Small Photovoltaic Rooftop Systems
Finally, for the case of the Special Program for PV rooftop systems, a significant share of the total installed capacity of PV rooftop systems was signed during December 2011 and July 2012 (see
Figure 9). A common feature of both intervals is the eminent reduction of the FiT rate. With regard to the development of their activation agreements, it is worthy of note that unlike the case of PV systems from independent producers, there is a normal regularity, which relatively culminates in the months ending the six month-internal of the validity of the FiT price.
This trend can be explained by the fact that the installation costs compared with the other types of PV investments are much smaller due to the much lower installed capacity. Subsequently there are also no economic reasons for delaying the construction of the PV system. In addition, the required interval for completion of the station (6 month-interval) is sufficiently small such that the owner of the PV system does not have an additional incentive to stall its construction. The current installed capacity of PV stations under the Special Roofs Program amounts to 349 MW and corresponds to a total of 38,076 individual stations.
5. The Impact of Retroactive Legislative and Regulatory Adjustments on the Development of Solar Power Stations: A Quantitative Perspective
The impact of the Fit cutback, as foreseen by the Law 4254/2014, on the profitability of PV investments, can be reflected primarily by the reduction of the weighted average FiT. To estimate the FiT reduction, the weighted average tariff was calculated for each type of PV investment, before and after the implementation of the regulatory amendments, based on the following equation:
where
Pi: the nominal installed power of
i PV station,
FiTi: the tariff of the
i PV station; and
Ν: the number of the PV stations
As
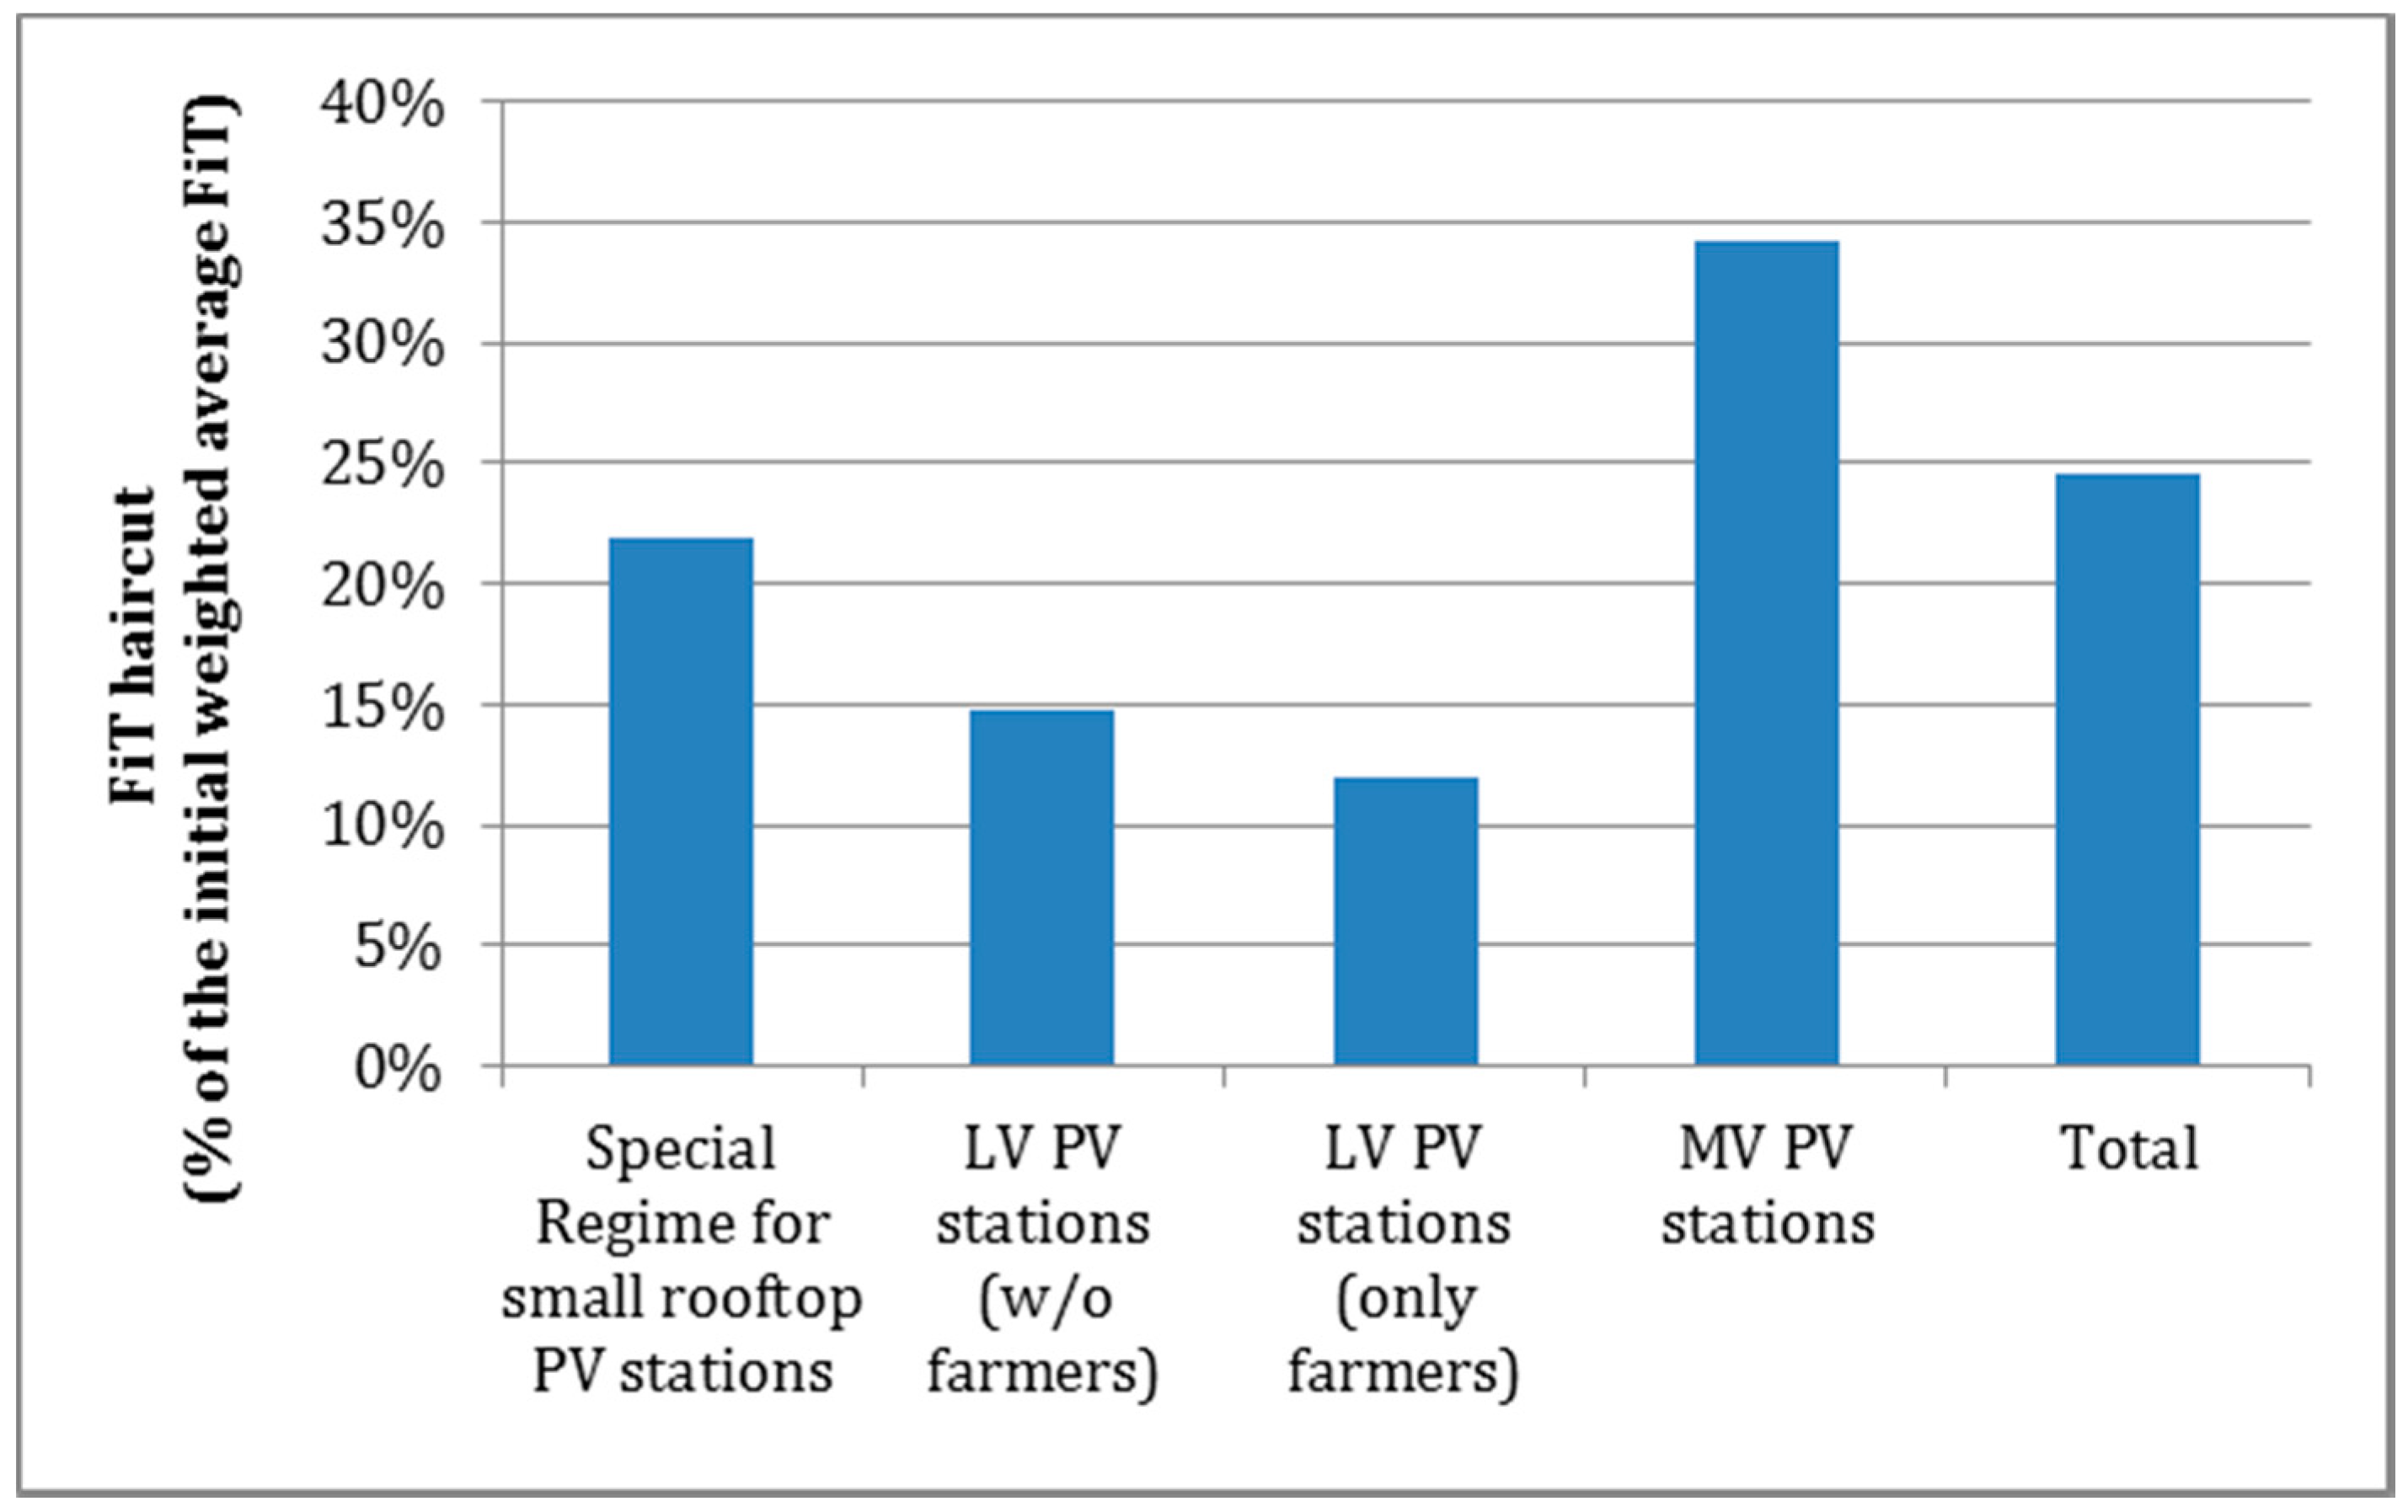
Figure 10 shows, the lowest FiT reduction was imposed on the LV PV stations installed by farmers (12%) while the highest one to the MV PV stations (35%). The average reduction across all investment types reached almost 25%.
The mean of the weighted average FiT rate for all PV investment categories results to be 300 €/MWh or 288 €/MWh if the Special Regime for small rooftop PV stations is excluded. The lowest weighted average FiT is 238 €/MWh (MV PV stations) while the highest is calculated equal to 390 €/MWh (Special Regime for small rooftop PV stations). Finally, the FiTs remained by far higher than the retail price of electricity necessitating an external support and funding mechanism by the Market Operator.
5.1. The Case of Low Voltage Photovoltaic Stations
The weighted average FiTs for the PV stations which had been activated before the mid of 2013 is shown on
Table 3. As stipulated by Law 4254/2014, the FiT reduction was greater in PV stations that have used an installation subsidy, reaching 21.1%. On the contrary, the PV stations subjected to a cutback without having used any subsidy had an average of 17.6% FiT reduction (see
Table 3). The weighted average FiT before the cutback was higher for the PV stations that finally used an installation subsidy. This is true since the Subsidy Law was in effect during the time when the FiT rates were at particularly high levels. Finally, it is worth mentioning that the mean of weighted average FiT before and after the cutback for every LV PV station amounted to 414 €/MWh and 353 €/MWh respectively.
5.2. The Case of Low Voltage Photovoltaic Stations—Farmers
The special incentive measures for PV stations installed by farmers were envisaged in the Law 3851/2010, which was voted in mid of 2010. At that time, the Subsidy Law was not in effect, which explains why the sum of PV investments made by farmers haven’t used any installation subsidy. As a result, the weighted average FiT before and after the tariff reduction was 416 €/MWh and 366 €/ΜWh respectively which corresponds to a 12% FiT reduction. This cutback is precisely the value foresaw for farmers by the Law 4254/2014.
5.3. Τhe Case of Medium Voltage Photovoltaic Station
Pursuant to the Law 4254/2014, the new tariffs for MV PV stations depend strongly on their installed nominal power.
Table 4 shows the weighted average FiT for the sum of PV stations connected to the MV network regardless of whether they were subjected to the tariff reduction or not. It becomes obvious that the greater the installed power, the higher the FiT reduction. The mean of the weighted average FiT before and after the cutback was calculated equal to 362 €/ΜWh and 238 €/ΜWh respectively which corresponds to a 34.3% FiT cutback.
5.4. The Case of Small Photovoltaic Rooftop Systems
For the PV stations that were subjected to the tariff reduction, the weighted average FiT before the cutback, was calculated equal to 492 €/ΜWh. After the implementation of the Law 4254/2014 the weighted average FiT reduced to 366 €/ΜWh leading to cutback of 25.5%. The mean values for the total of small PV rooftop systems, regardless of whether these were subject to the cutback or not, were calculated to be equal to 499 €/ΜWh, 390 €/ΜW hand 21.8% respectively. The relatively smaller cutback (by approximately 4%) can be attributed to the fact that many PV systems faced no reduction in the fortified tariffs.
6. A Multi-Parametric Techno-Economic Analysis
Based on the above findings and analysis of the legislative and regulatory framework, a parametric techno-economic assessment for different PV investments is carried out, to determine the influence of these regulatory amendments on their profitability and viability. Emphasis is placed on the financial impact imposed by the Law 4254/2014 through the main measures proposed (tariff cutback, solidarity surcharge and the credit invoice). The impact is assessed from a producer (i.e., investors) as well as a consumer perspective.
6.1. Approach, Input Data & Assumptions
In order to identify the financial impact imposed by the Law 4254/2014 upon the profitability of different PV investments is carried out, by varying the following parameters: (a) total installation costs for different PV stations based on their activation date, (b) interest rate for a bank loan for each type of investment, (c) use of a construction subsidy or not from 0 to 40% available for the different types of PV stations considered, (d) different tax imposition levels for the annual revenue for different PV investment categories, (e) the solidarity surcharge differentiated based on both the activation and the PA date of the PV system, and (f) the issuance of credit invoice.
Given the wide range of the total installation cost as well as the pros and cons of the various investment evaluation indices, the simple payback period (PBP), the internal rate of return (IRR) and the profitability index (PI) were adopted for the assessment of PV investments. The profitability index attempts to identify the relationship between the costs and benefits of a proposed investment and is equal to the ratio of the Present Value of future cash flows to the equity investment. It is considered that these three indices can sufficiently reflect the short-term and long-term profitability of such investments and can also be compared without any additional calculations while serving the purposes of this assessment. In fact, it is assumed that the vast majority of investors, such as individuals, farmers and families which correspond to LV PV stations and small rooftop systems, applied the PBP as a decision-making criterion due to its wide use and understanding of the meaning. This kind of investors are kin on having quick cash flows especially in an economy like the one of Greece which at that time was characterized by high risk due to the recession and the known economic crisis. PI, which is defined as the present value of future cash flows to equity investment ratio, and IRR were also adopted to reflect fundamental principles of project finance like time value of money, risk and return and are widely applied for investment evaluation. To demonstrate the relative financial effect of the legislative and regulatory adjustments in percentage terms, the variation of these three indices preceding and following the implementation of these adjustments have been calculated. The discount interest was selected to be equal to 5% assuming that such a rate is satisfying for the majority of investors if the economic situation in Greece is taken into account when practically the best alternative investment is the bank accounts where the interest rate is much lower. The inflation rate was not taken into account because of the inability of approximating it due to the severe economic crisis in Greece and also for simplicity reasons; at the beginning of 2017 the inflation rate was almost zero while the previous three years it was around −1.5%. The input data and assumptions used for the parametric analysis are tabulated in
Table 3.
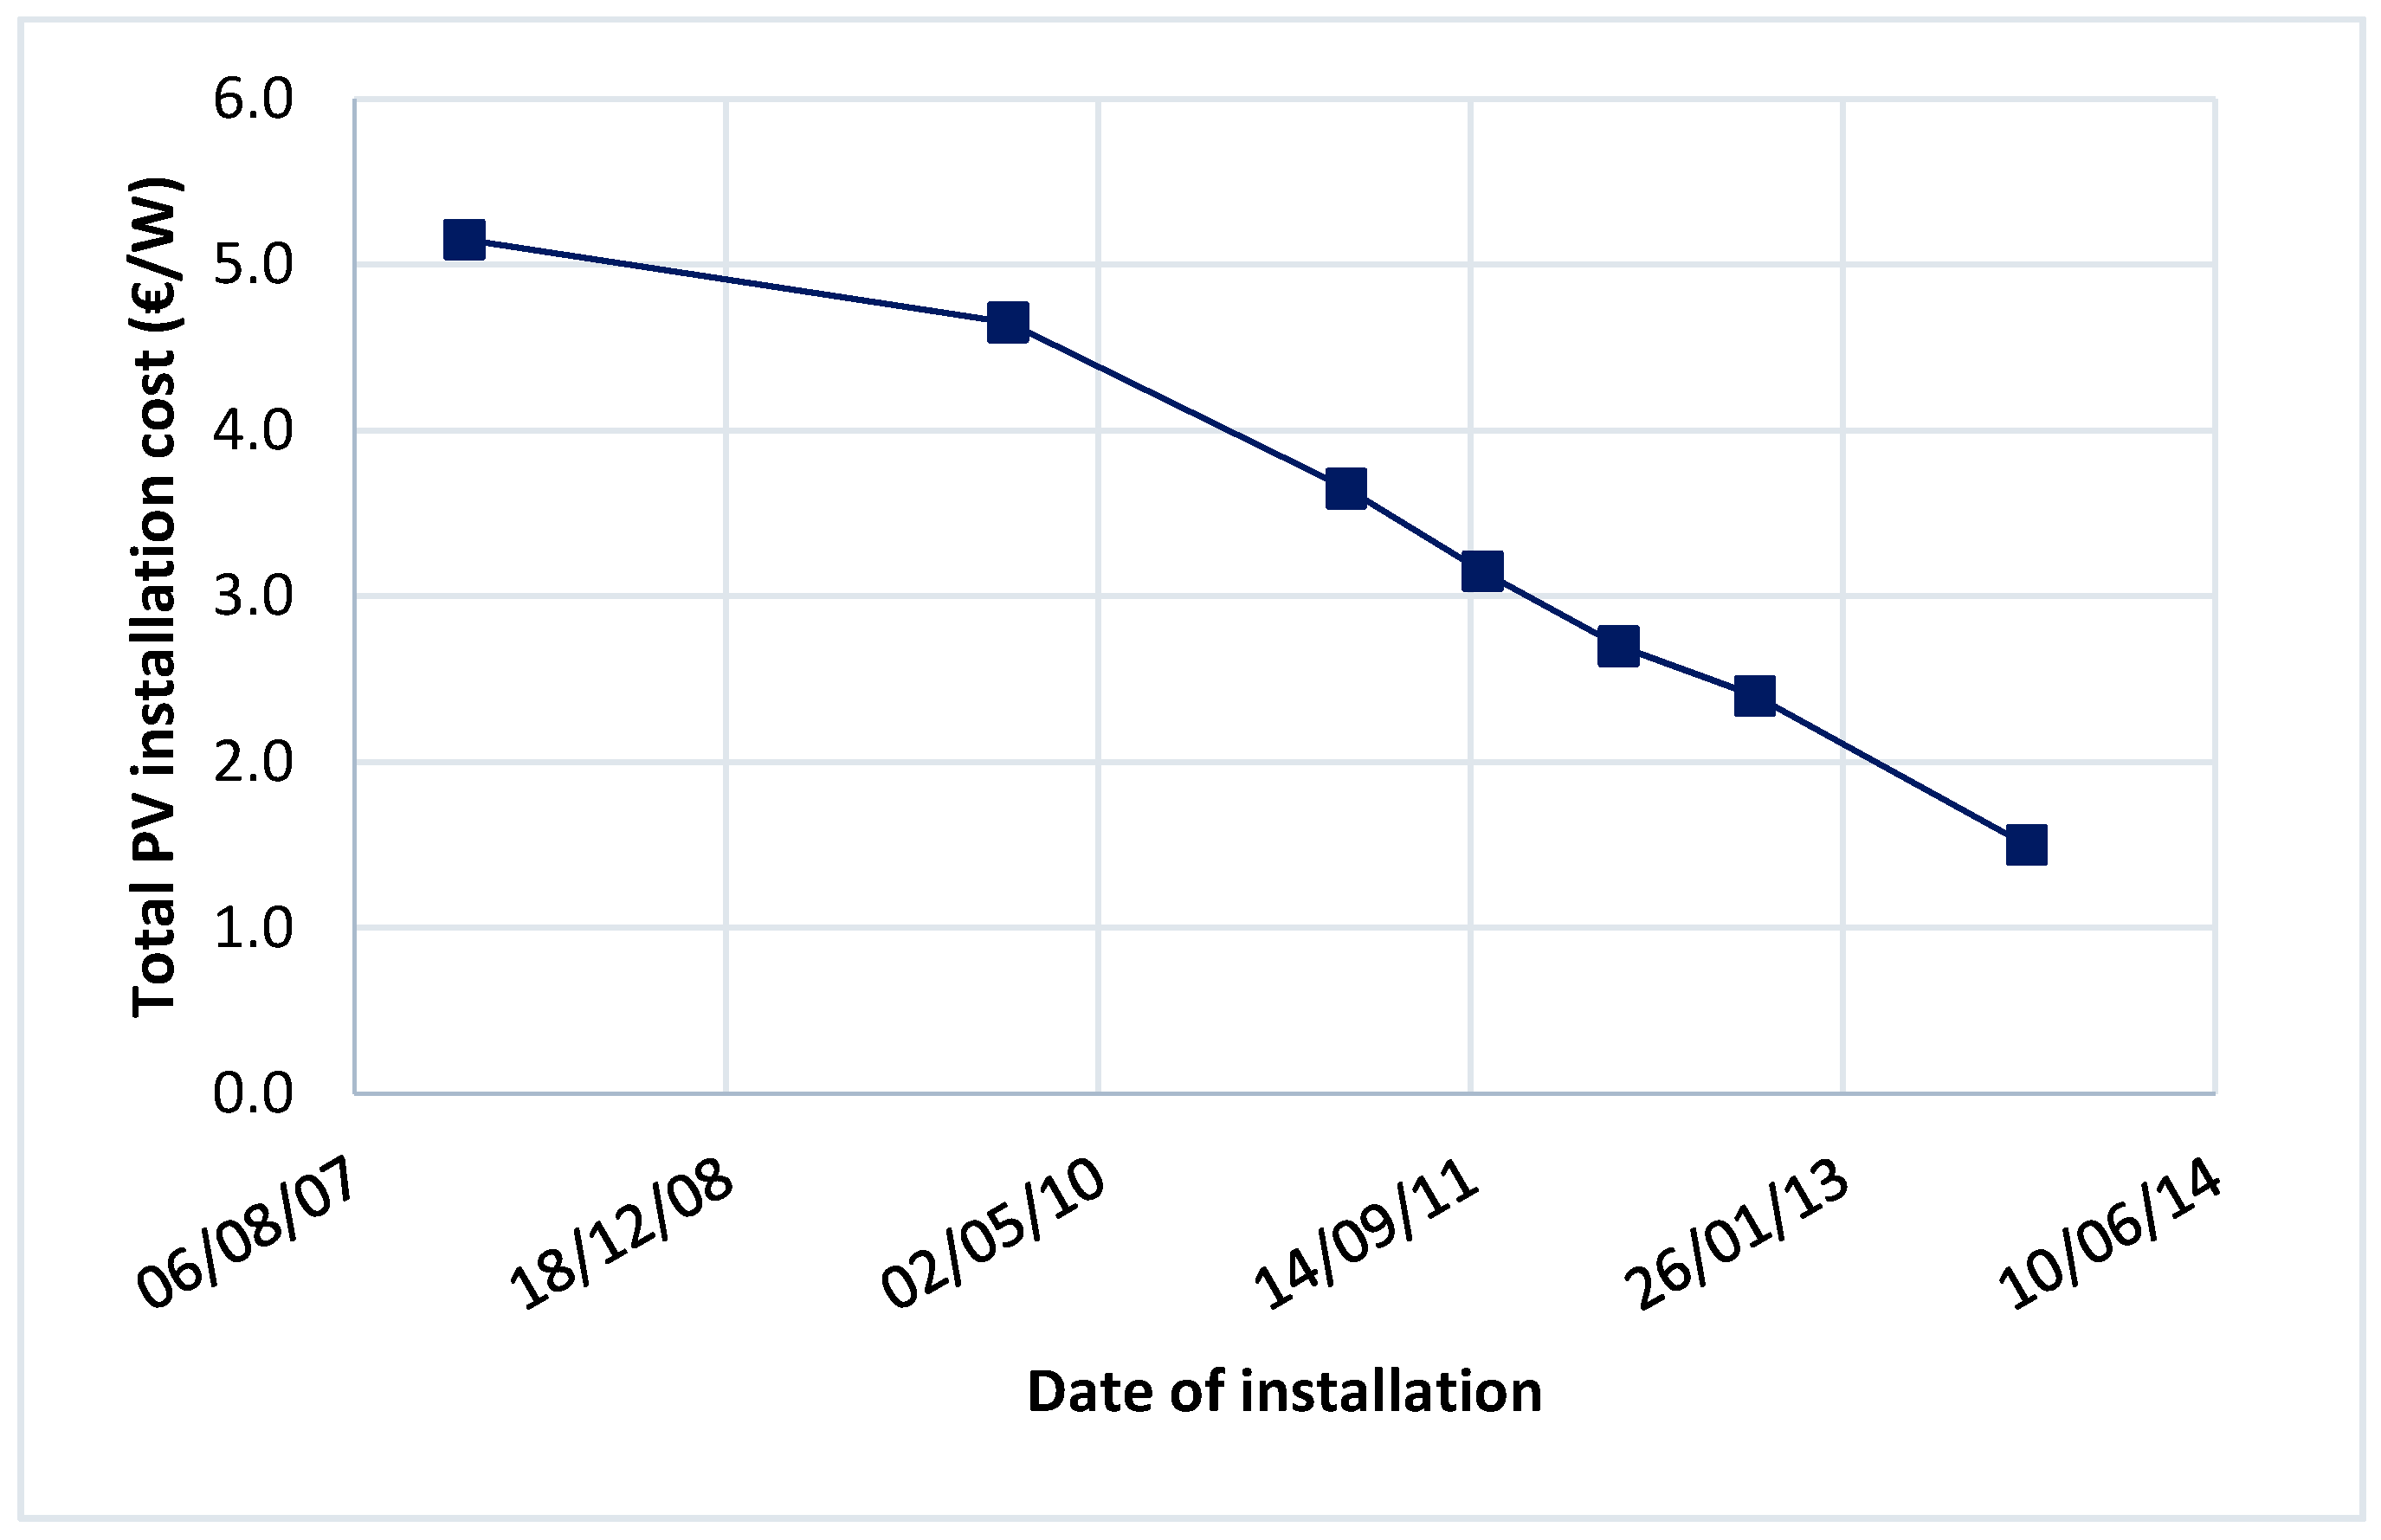
6.1.1. Total Installation Cost
The nominal power, the origin of the PV panels, the profit margin that the installers are seeking for and the cost of the interconnection works are only some of the factors that affect the total installation cost of a PV station. There is also great uncertainty when determining these factors in a unique manner especially when accounting for their chronological variation. The costs used for the construction of a 100 kW PV station are presented in
Figure 11, which depicts the chronological variation of the total PV installation cost until the mid of 2013 when the PV installations practically stopped, based on the following equation:
where
Capext: otal installation cost,
Cpv: cost of PV panels,
Cinv: cost of inverters,
Cw: cost of other works (electric switchboards, cables, grounding, labor costs, etc.),
Ccw: cost of interconnection works.
As far as the cost for PV stations with nominal power greater that 100 kW, it is assumed that these are reduced by 10% (for a nominal capacity up to 1 MW) to more than 25% (for a nominal capacity greater than 8 MW) in comparison to the equivalent costs calculated for the case of a 100 kW PV station. In any case the operation costs are assumed to be equal to 0.5% of the Capex.
Investment loan given the economic downturn in Greece during the years from 2008 to 2014, the terms and loan-taking conditions were deteriorating to a great extent both in terms of the interest rate as well as the equity-requirements for participation of the prospective investor in the construction of the station. According to banking sector experts, the chronological variation of these two factors was not linear. On the contrary, it was sharp and occurred in the middle of 2012. An approximate estimation of the interest rate for PV investments before and after that time was 6% and 12% respectively. The equivalent values for equity requirements were 25% and 50%.
6.1.2. Construction Subsidy
The Subsidy Law 3299/2004 for new investments foresaw the approval of a subsidy ranging from 20% to 40% for the installation of PV stations, depending on the company size and the installation region. Moreover the equity requirement was set to be at least 25%. The huge majority of these investments were eventually included in the category of 40%, until February 2010, which is when the subsidy Law was halted. For the purpose of this parametric study the assumption that subsidies were approved for half of the PV stations that had received an interconnection offer before February 2010, was adopted.
6.1.3. Taxation
In general, there are three categories regarding the tax imposition for the annual revenue. The first one refers to all companies and corresponds to a 25% tax rate. The second category that involves only the PV stations that belong to farmers imposes a 13% tax rate. The last category refers to the Special regime for small roof PV installations. Although the annual revenue for the latter is untaxed, it is included in the calculation of the Solidarity surcharge for individuals and can be approximately considered equal to 4% (see
Table 3).
6.1.4. Solidarity Surcharge
The aim of the imposition of the solidarity surcharge was to increase the income of the Special account for the remuneration of the generated energy by the PV stations. The solidarity surcharge rate depends on both the activation and the PA date. The rationale behind these two factors was to take into account the installation cost and the fortified tariff. The range of this rate lies between 25% and 42% (see
Table 5).
6.1.5. Issuance of Credit Invoice
As described above, the owners of the PV stations shall issue a credit invoice towards the Special account, the amount of which is defined to be 20% and approximately 35% of the total aggregated gross income that corresponded to the energy generated during 2013; that is for PV stations with nominal installed power lower and higher than 100 kW respectively. This measure caused a higher burden to PV stations connected to the MV network.
6.2. Simulation Procedure
A fully parametric techno-economic analysis has been carried out based on every possible combination of the month and year of the PA and the month and year of activation. Since the investment evaluation indices selected may vary to a great extent based on additional factors, the simulated scenarios were also differentiated by the usage of a construction subsidy or not, and the installation of two-axis trackers or not for the four distinct cases of the PV stations. Given the large number of scenarios simulated (around 30,000) and the objective of the present study, which concentrates on extracting useful conclusions on how different types of investments have been impacted by the regulatory amendments, it was deemed appropriate to present those cases which were most likely to occur in reality during the development of PV stations in Greece. The latter cases were analyzed and determined in
Section 4 by exploring the chronological variation of the empirical data gathered on PV investments until 2014.
The parametric study was also expanded to shed light on the costs for funding the FiT mechanism and how it was affected by the PV stations deployment. Taking for granted that the Special RES Account had to be balanced, an assessment of the induced effect of PV deployment on the consumers’ electricity bills was conducted. The hourly system marginal price (HEP), PV generation annual profiles as well as other data presented in the previous chapters were used to calculate the costs paid by consumers for the support of PV stations deployment.
7. Results & Discussion
7.1. The Impact on Producers
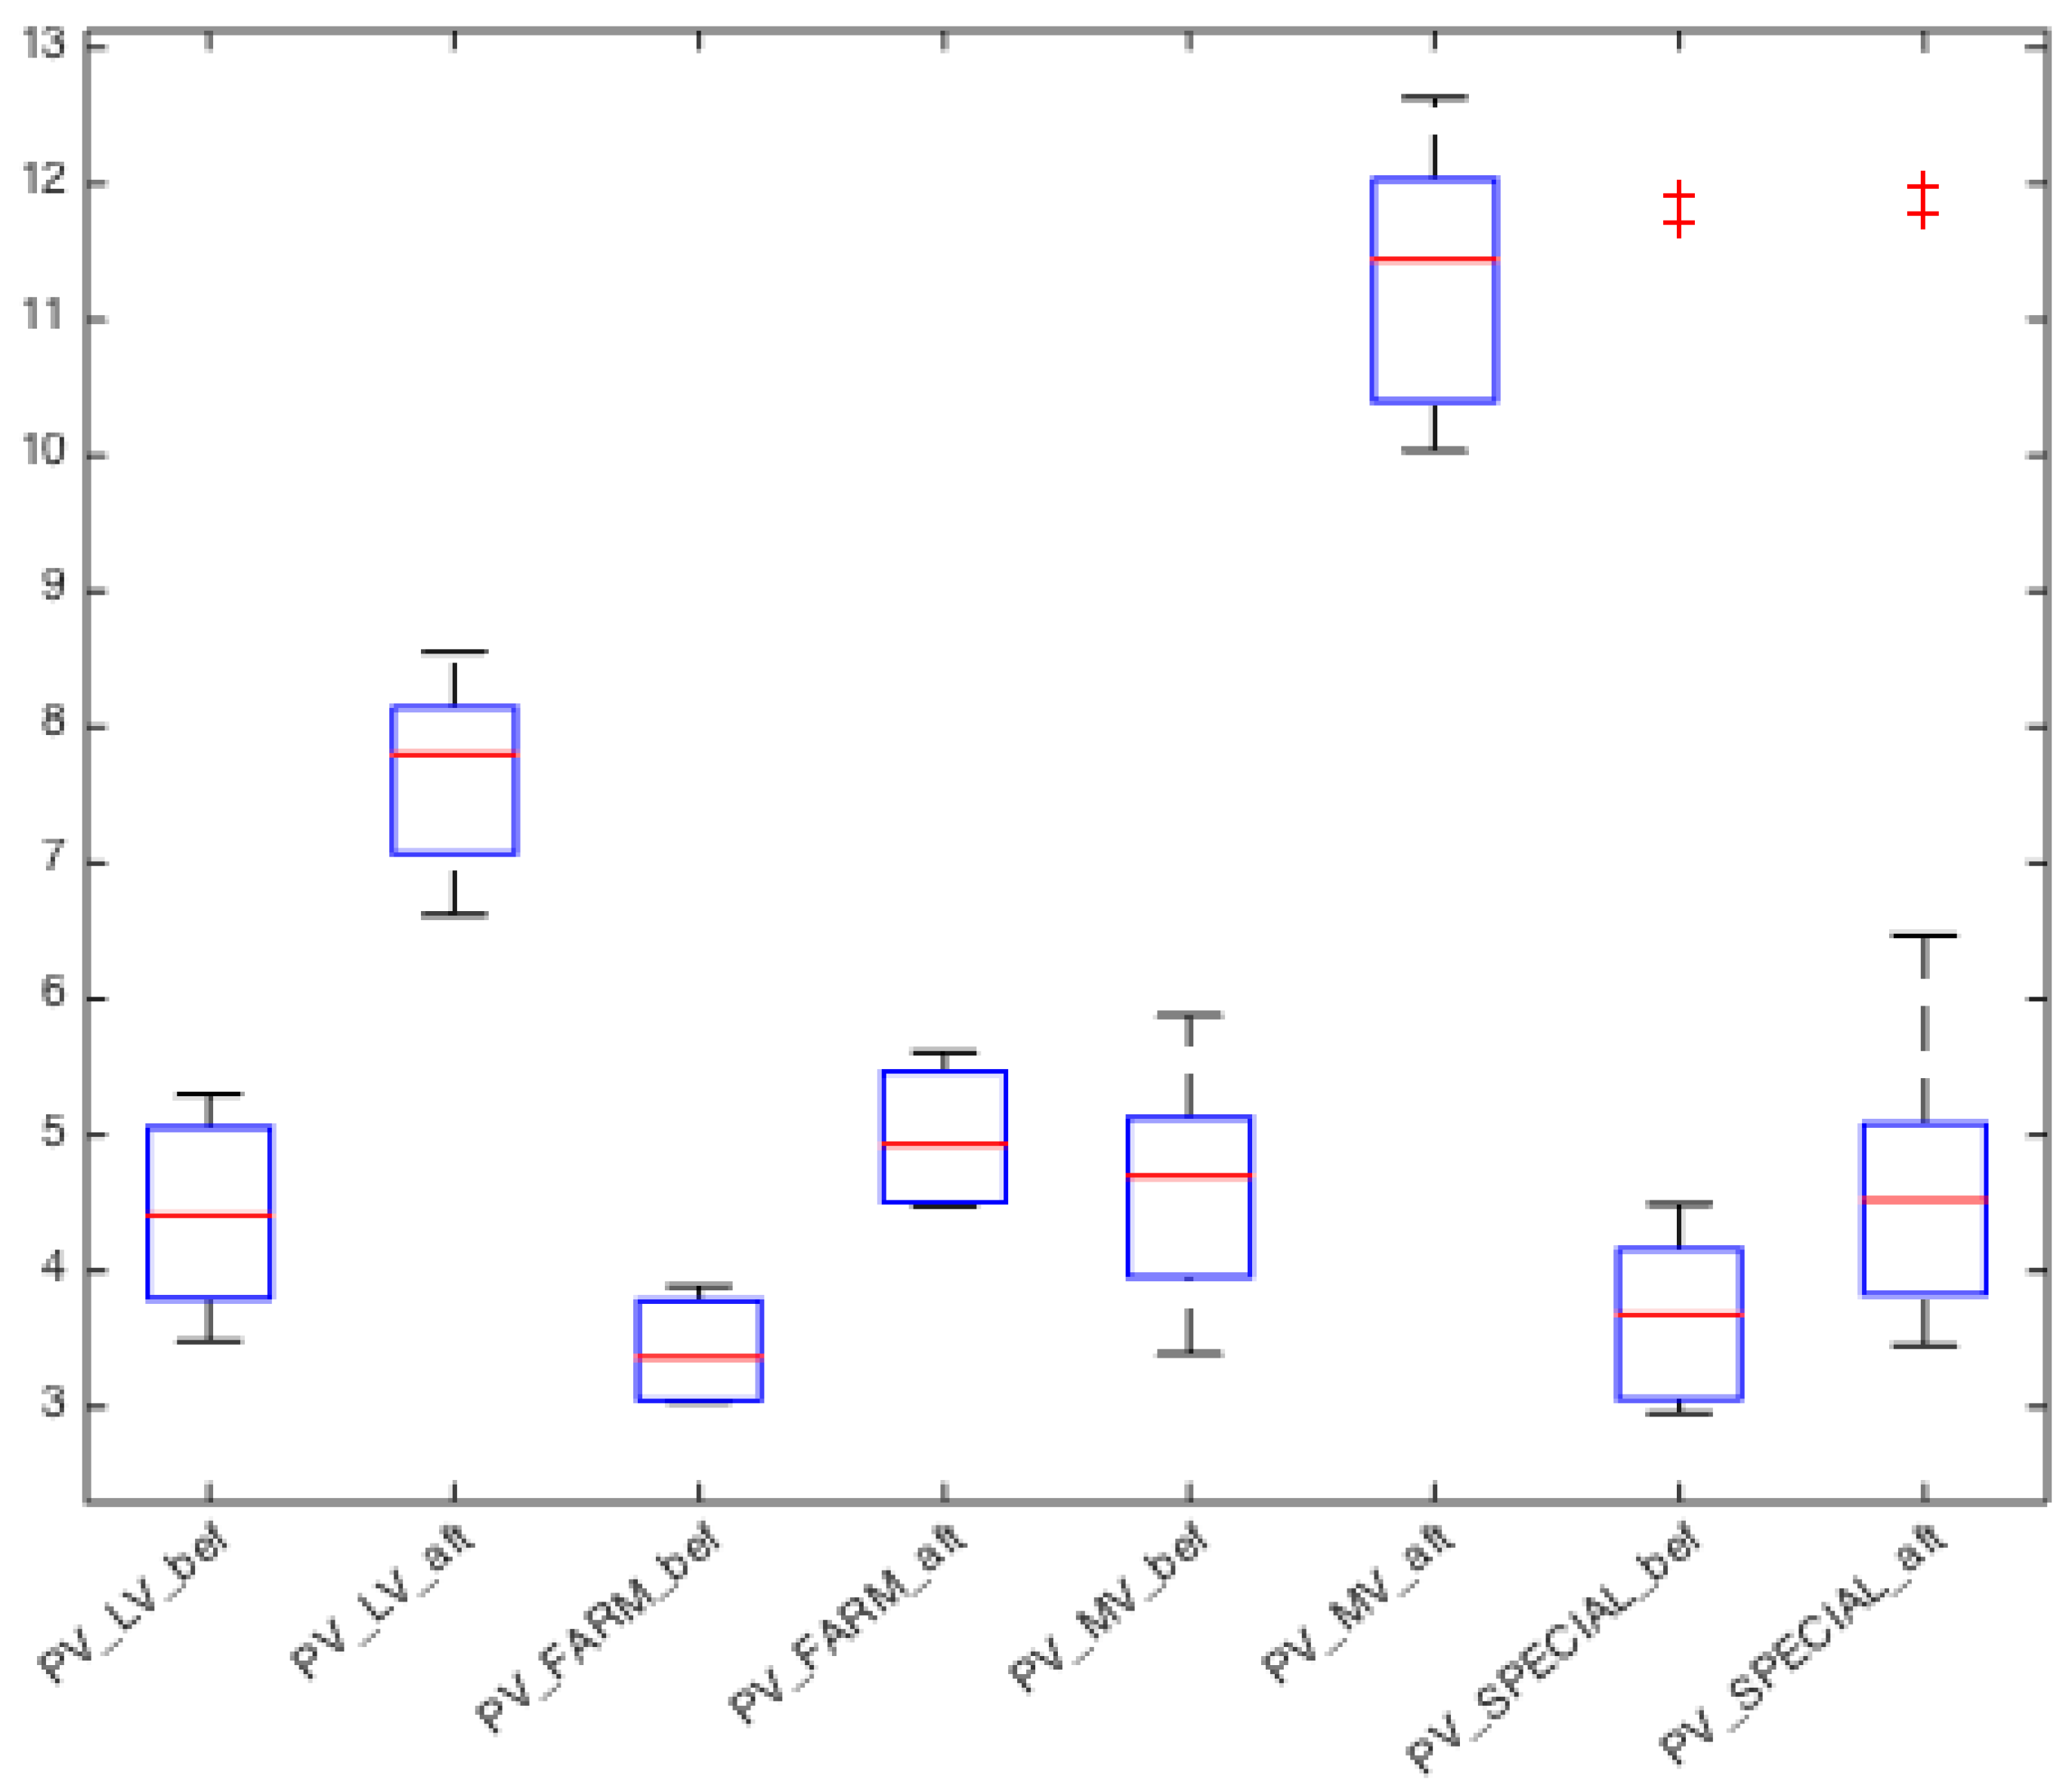
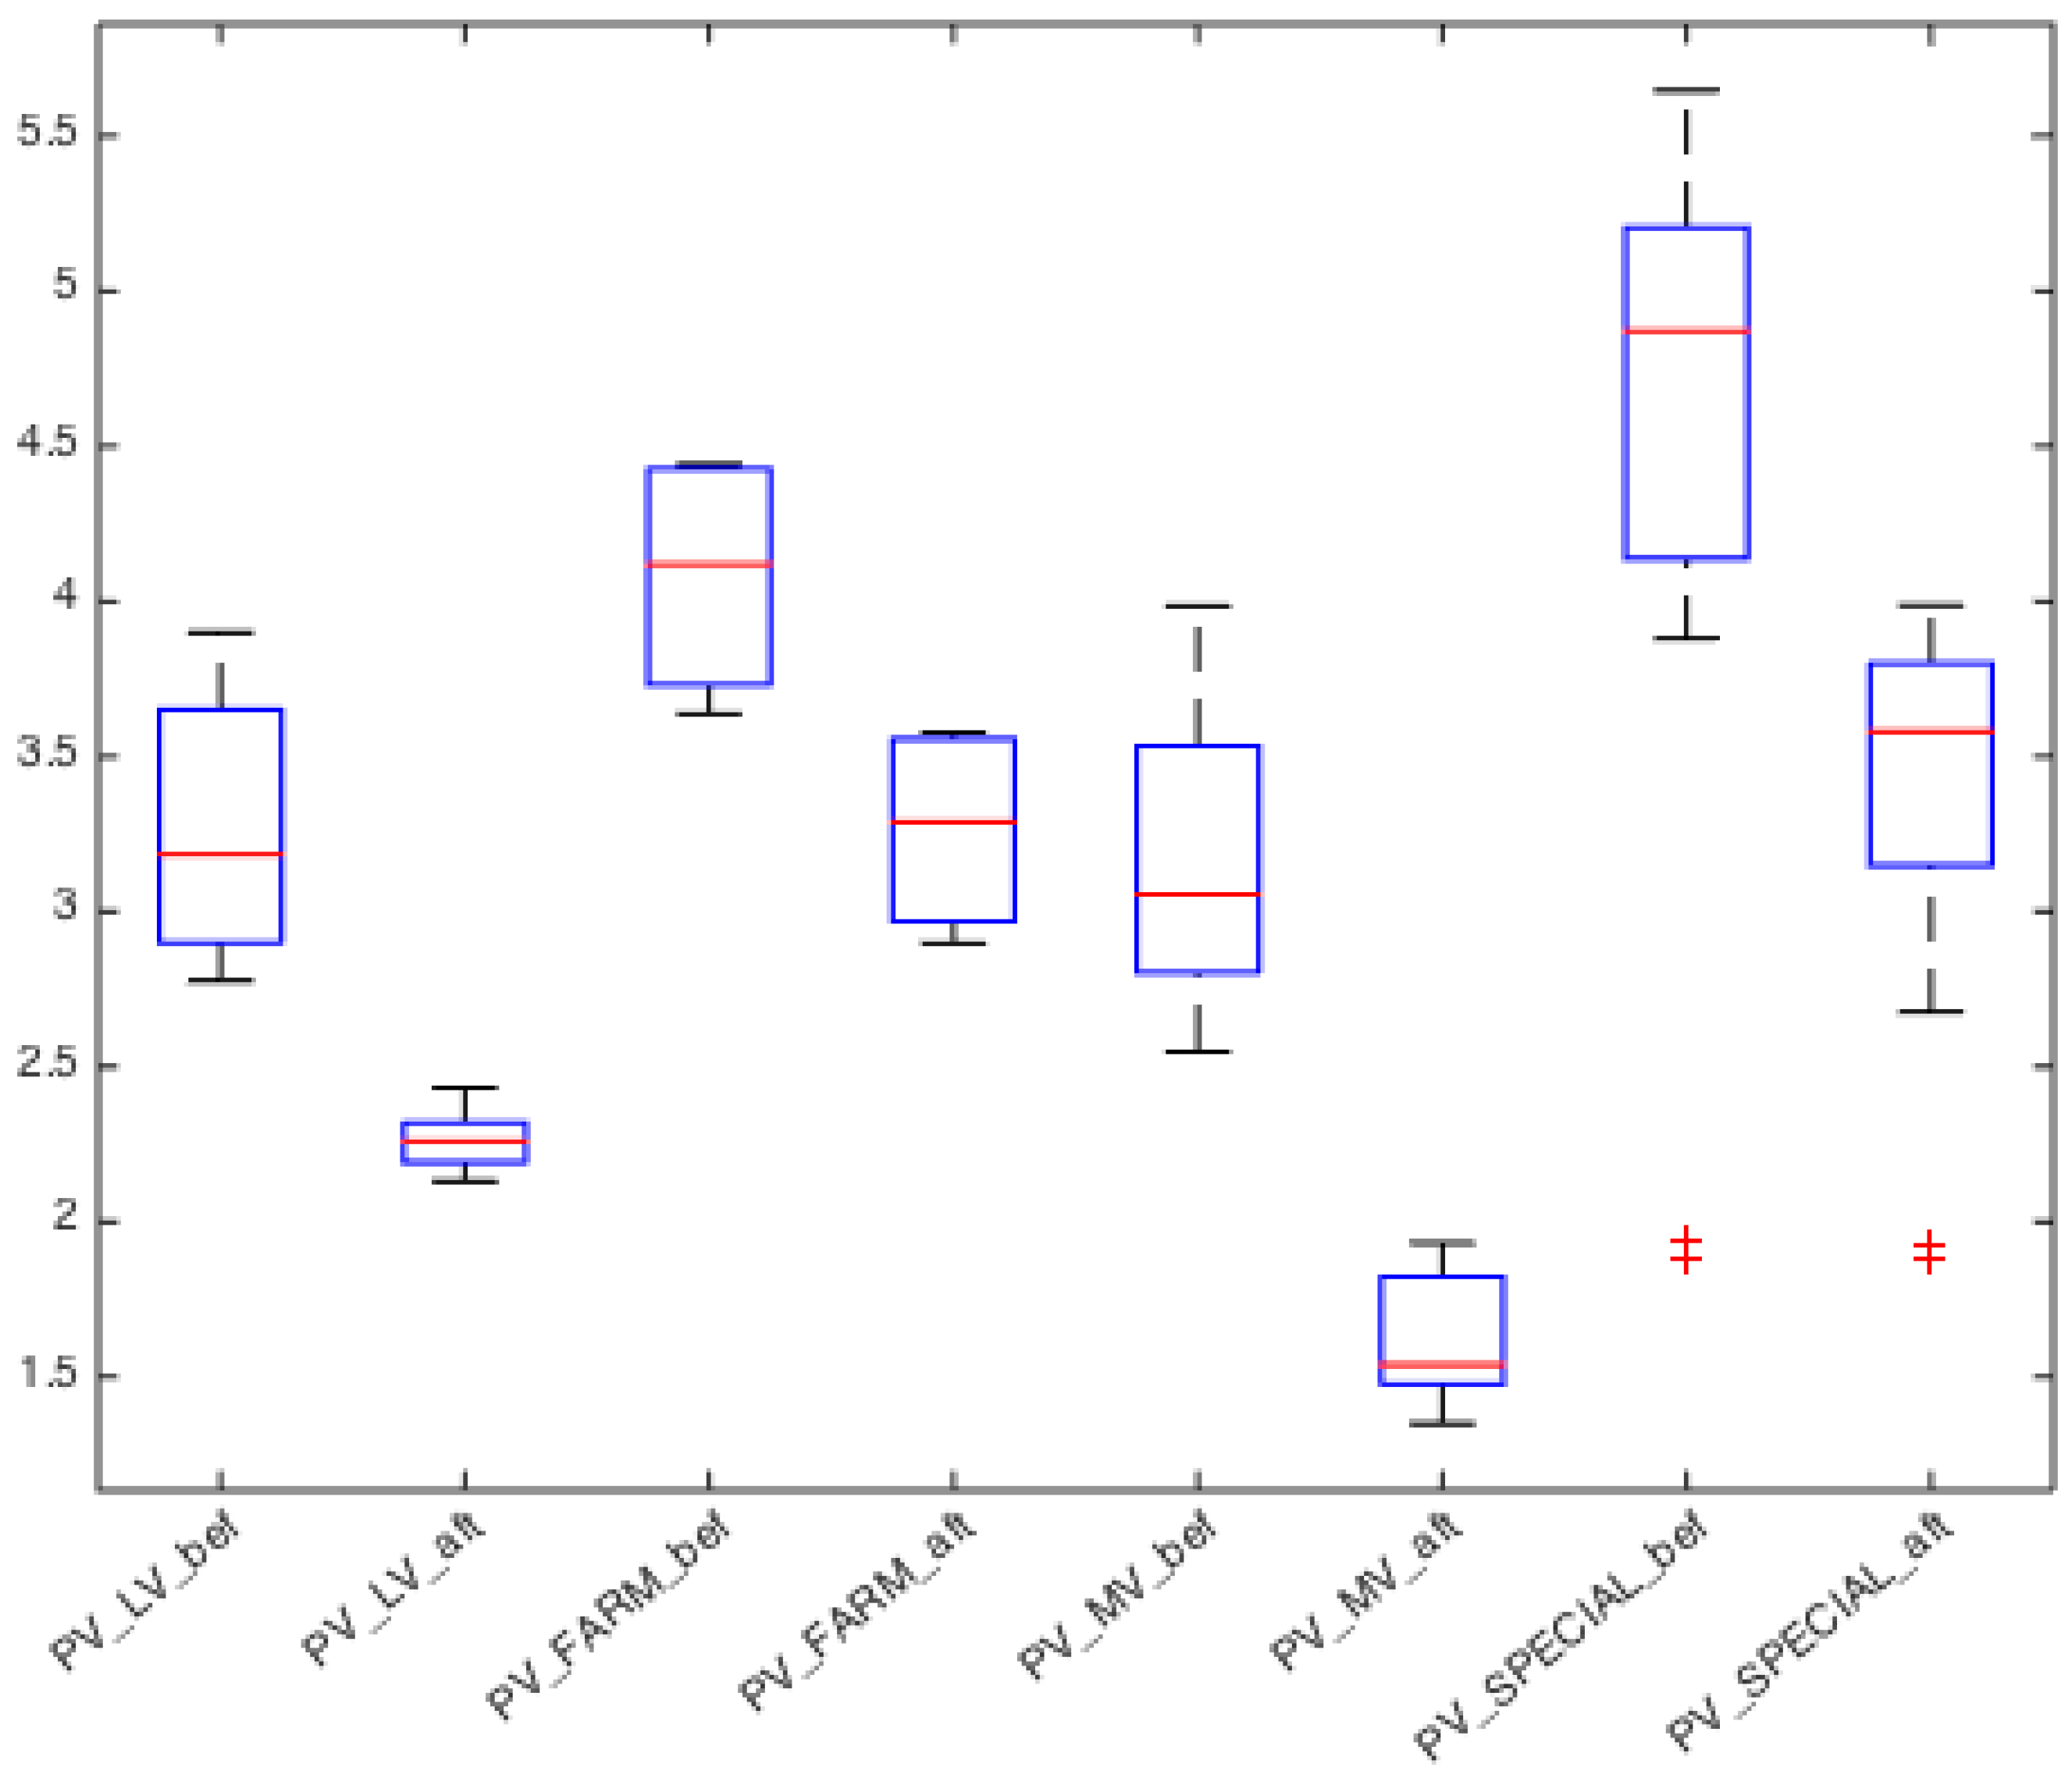
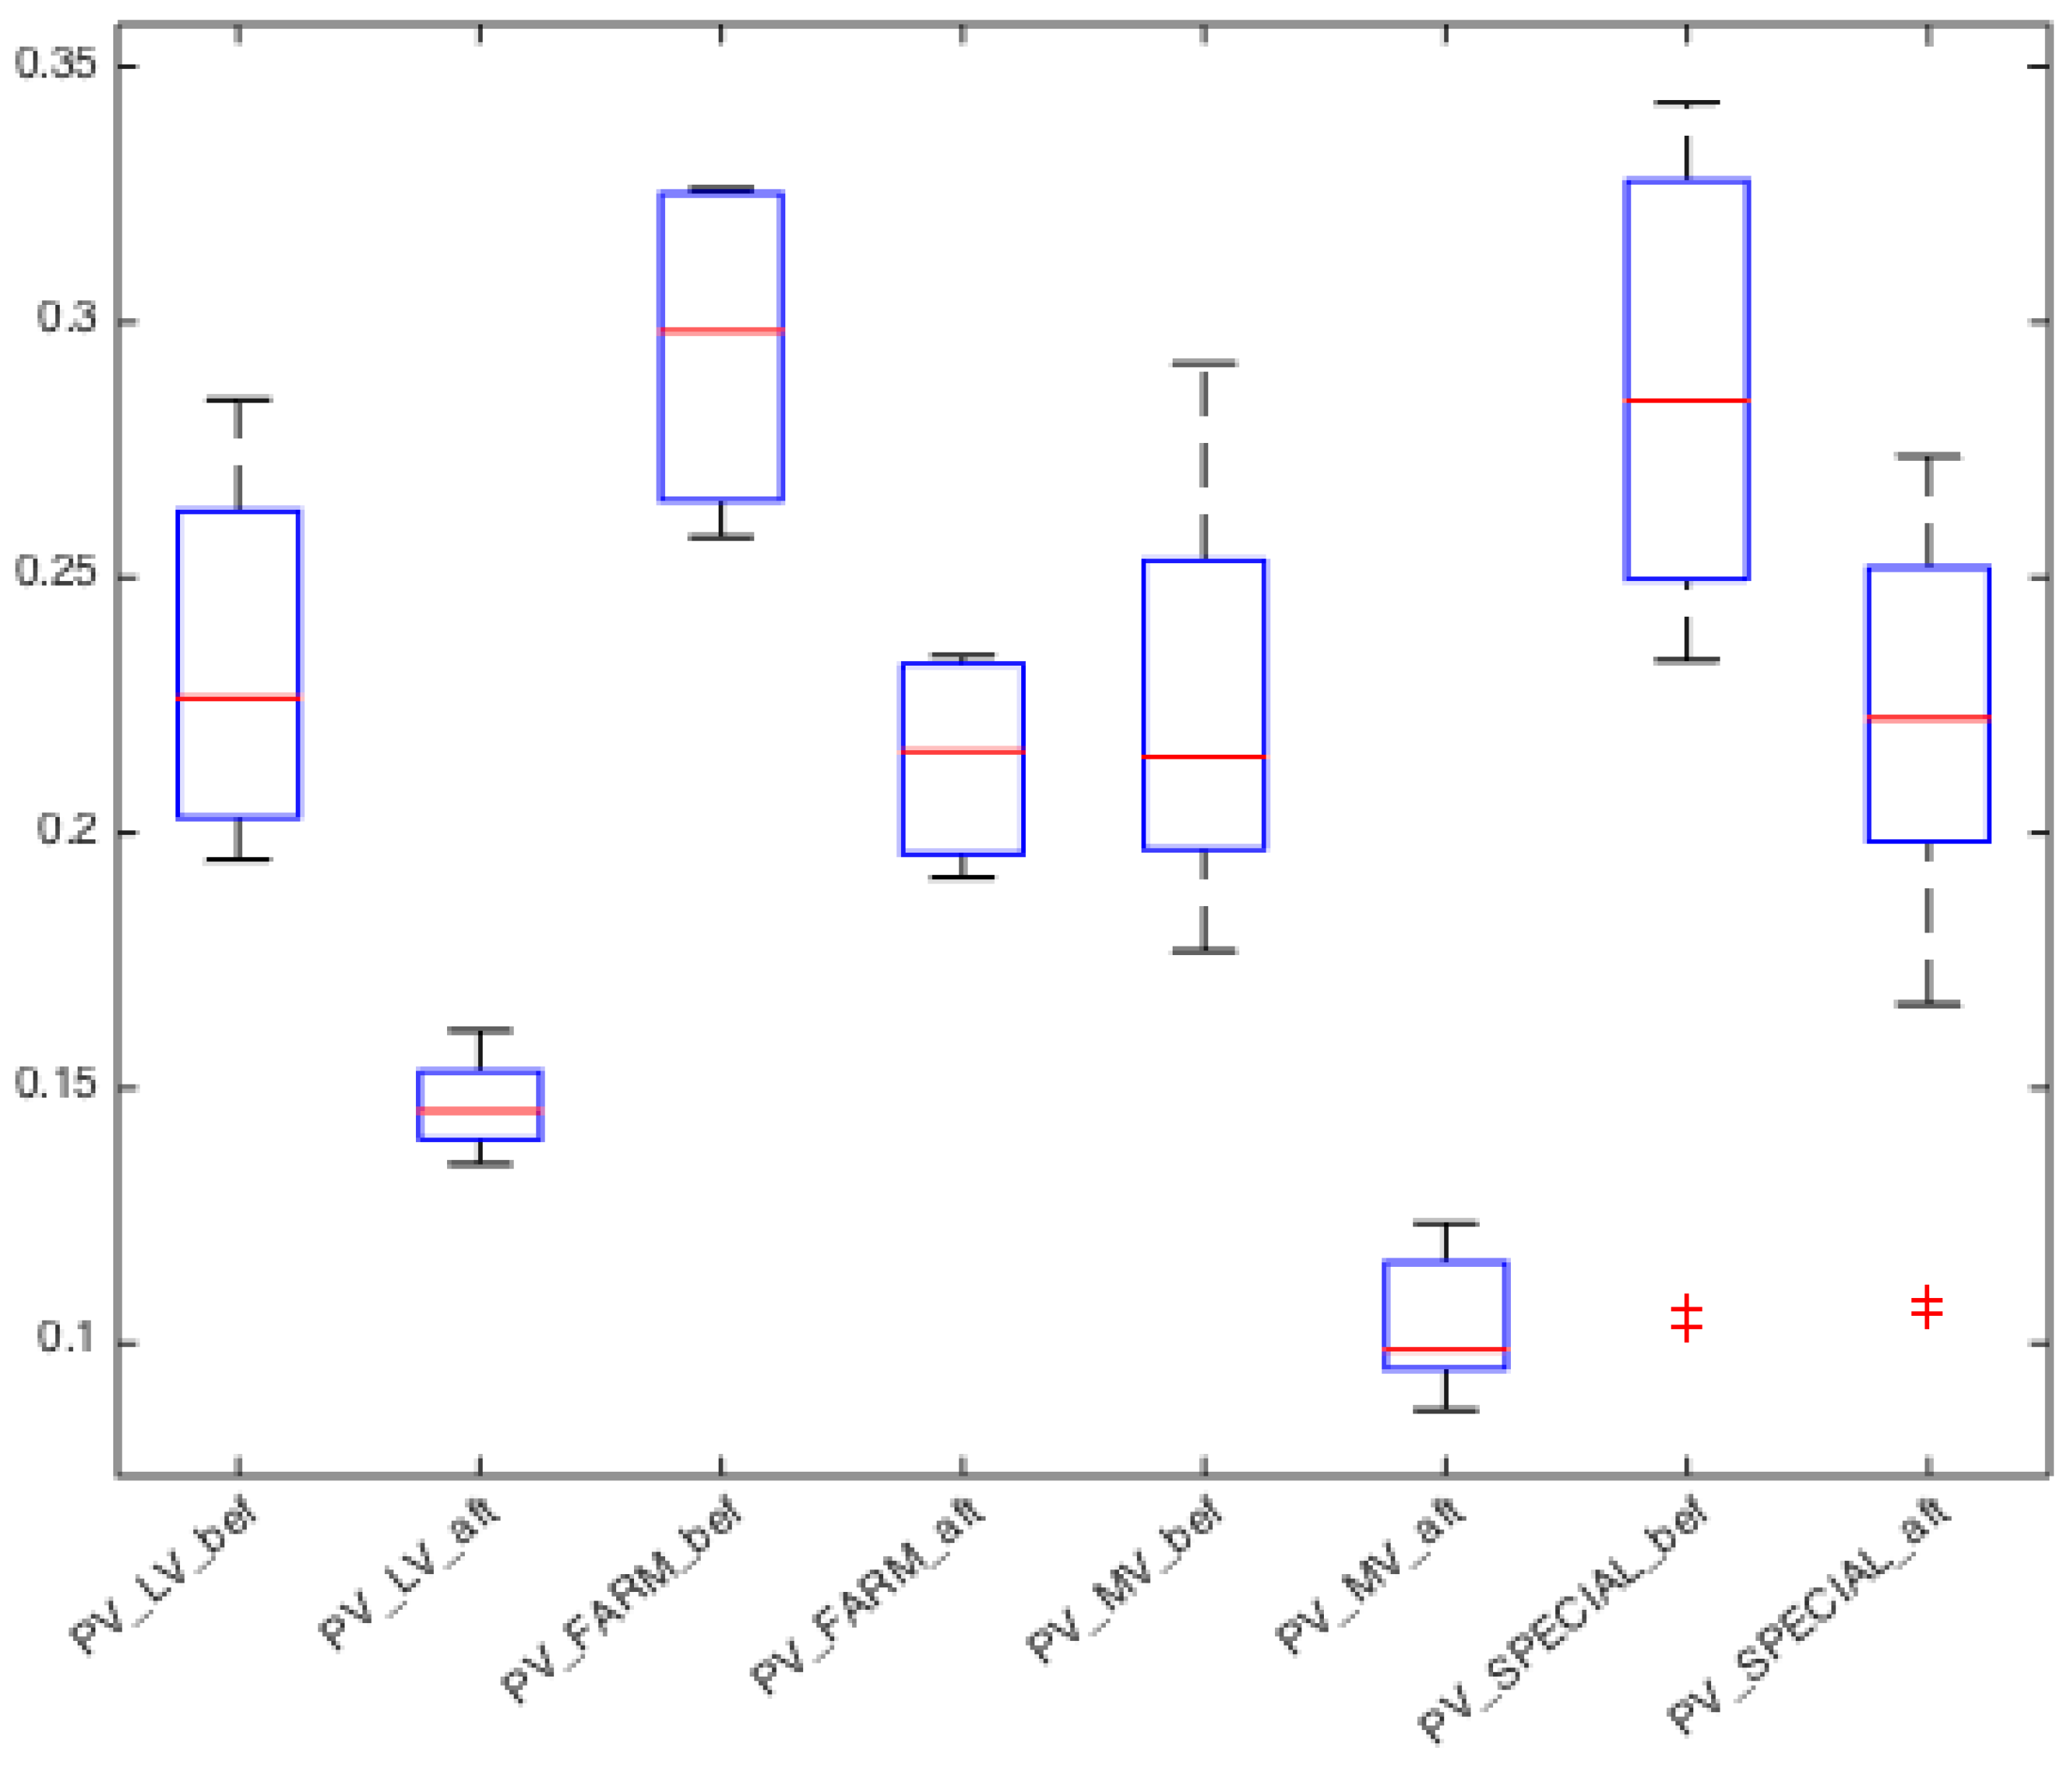
To quantify and compare the financial impact imposed by the regulatory amendments on the profitability and viability of different PV investment categories, the effect of the former upon the selected investment evaluation indicators was calculated in terms of their variation before and after the aforementioned interventions. These indicators were calculated and are presented comparatively under the main four investment categories below.
Figure 12,
Figure 13 and
Figure 14 present the boxplots of the median values of the payback period (PBP), the PI and IRR for each of four categories of PV investments along with the distribution of these simulated values for the different investment cases around their median value. Variability in these values is demonstrated through the boxplots, which is equal to the interquartile range (IQR). The IQR is equal to the difference between the 75th percentile (Q3) and the 25th percentile (Q1) and amounts to 50% of the values simulated across all investment scenarios for each type of PV investment. The bigger the boxplot, the higher the distribution of these values is, which further indicates differences in profit margins and variety in the profitability of different PV investments within each grouping. The horizontal red line, which runs down the center of each boxplot, indicates the median. The boxplots also provide information on the shape of the dataset indicating whether the profitability values for different investment cases are symmetric (i.e., profitability values across simulated investment cases are evenly split around the median) or skewed.
It is observed that the cutback has impacted all four PV investment categories in a similar fashion, except for the last category (i.e., PV rooftop systems), by decreasing the variability in the profitability of investment cases. This is reflected in the reduced size (i.e., the IQR) of their PBP values’ boxplot after the cutback. The PBP values have also increased with the imposition of the cutback for the majority of investment cases across all four investment categories, although to a varying extent.
A similar impact on the viability of different PV investments can be observed when looking at their PI and IRR (
Figure 13 and
Figure 14, respectively). The same relative effects of the regulatory changes upon the profitability among the four PV investment categories, can be demonstrated regarding the variation of their PI and IRR yet to a smaller extent (i.e., smaller percentage variation before and after the cutback), as the impact upon the time value of PV investments is not captured by the simple PBP index. The relative variation in the PI was comparatively smaller for LV PV stations installed by farmers, whilst Special PV and LV stations presented an analogous decrease of 25.90% and 25.77% after the cutback respectively. The greatest impact on the viability of PV investments, in PI terms, was again observed for MV PV stations showing a percentage decrease of 48% with a median value of 3.2 reduced to 1.7.
Notably the impact of the cutback, with regard to the spread and the shape of the box-plots becomes more apparent for the cases of the PI and IRR index values. After the regulatory amendments took place, extreme values were more rationalized hence decreasing the profitability range (i.e., IQR range) while improving the symmetry of the simulated investment cases around the mean. This is more evident in the boxplots of LV and MV PV stations (
Figure 13 and
Figure 14) except for the Special program were the profitability of simulated cases remained negatively skewed. In fact for the Special program extreme values were curtailed only for the most profitable cases. For the least profitable ones (i.e., outliers) from the Special program, these remained relatively unaffected. These cases signed a connection agreement right after the cutback (i.e., July or August 2012) and according to the New-deal, a marginal increase in their remuneration prices should have taken effect, which was eventually not employed.
Overall it seems that the abovementioned modified regulatory framework had a rather reasonable impact upon LV PV investments (excluding farmers) by reducing the efficiency range for different investments rationalizing their profitability. In comparison, the profitability of LV PV stations installed by farmers seems to have been less affected across all evaluation indexes. Likewise, the profitability of PV rooftop systems, when compared to all the other categories, seems to have been affected the least across all evaluation indexes. The profitability of these two latter investments types (i.e., farmers PV systems and PV rooftop systems) can be considered to remain rather sufficient despite the amendments of the relevant framework. On the contrary, MV PV stations were affected the most by the implementation of the modified regulatory framework. Finally, the parametric analysis has shown that after the cost-containment measures took place, some of those PV investments connected to the MV network were no longer considered to be attractive.
As regards current investments, for large-scale PV projects (<500 kWp), the new support scheme, as enacted by virtue of Law 4414/2016, came into effect on 9 August 2016 and is intended to reform the existing support scheme [
34]. The FiT scheme, is effectively replaced by a technology-specific sliding scale Feed in Premium (FiP). The FiP is added as a premium to the revenues received by producers through their participation in the market, topping up revenues in order for the relevant operating aid to reach an acceptable level of support measured against a technology-specific reference tariff (RT). The RTs will be initially regulated for all technologies but from this year (2017) will be set through a competitive bidding processes (auctions) for most technologies. The first pilot auction for the addition of 40 MWp took place in December 2016 and resultant bids were significantly lower than the previously reduced Fit rates. In fact, for PV stations with nominal power less than 1 MW bids ranged between 94.97 €/MWh and 104 €/MWh, while for stations higher than 1 MW bids ranged between 79.97 €/MWh and 88 €/MWh. Investments in smaller-scale PV systems with a capacity of 10–500 kWp are now in principle eligible for a feed-in-tariff (i.e., can enter a FiT or a FiP based contract). However, FiTs as reported for 2016 are quite low (57 €/MWh) and do not guarantee sustainable investments [
35].
7.2. The Effect on Electricity Consumers
To estimate the financial burden on the Special RES account due to PV deployment, the annual revenues to the Special Account by the HEP have been calculated using the system marginal price of the electricity wholesale market as well as the daily PV generation profiles. Αs aforementioned, the inflows to the Special RES Account consist of different components such as the HEP, the greenhouse gas emission rights, the solidarity surcharge (in effect until 2014), the credit invoice operational during 2013, other relevant taxes levied upon the conventional energy generation and last but not least the ETMEAR. The annual outflows (i.e., costs) to the special account were estimated by using data on the annually installed PV capacity from 2009 to 2016, the evolution of the FiT rates and the relevant legislation throughout the respective period as well as real PV production curves. By deducting the outflows from the inflows results in the required revenues covered by other sources (than the HEP), out of which the dominant component is the ETMEAR.
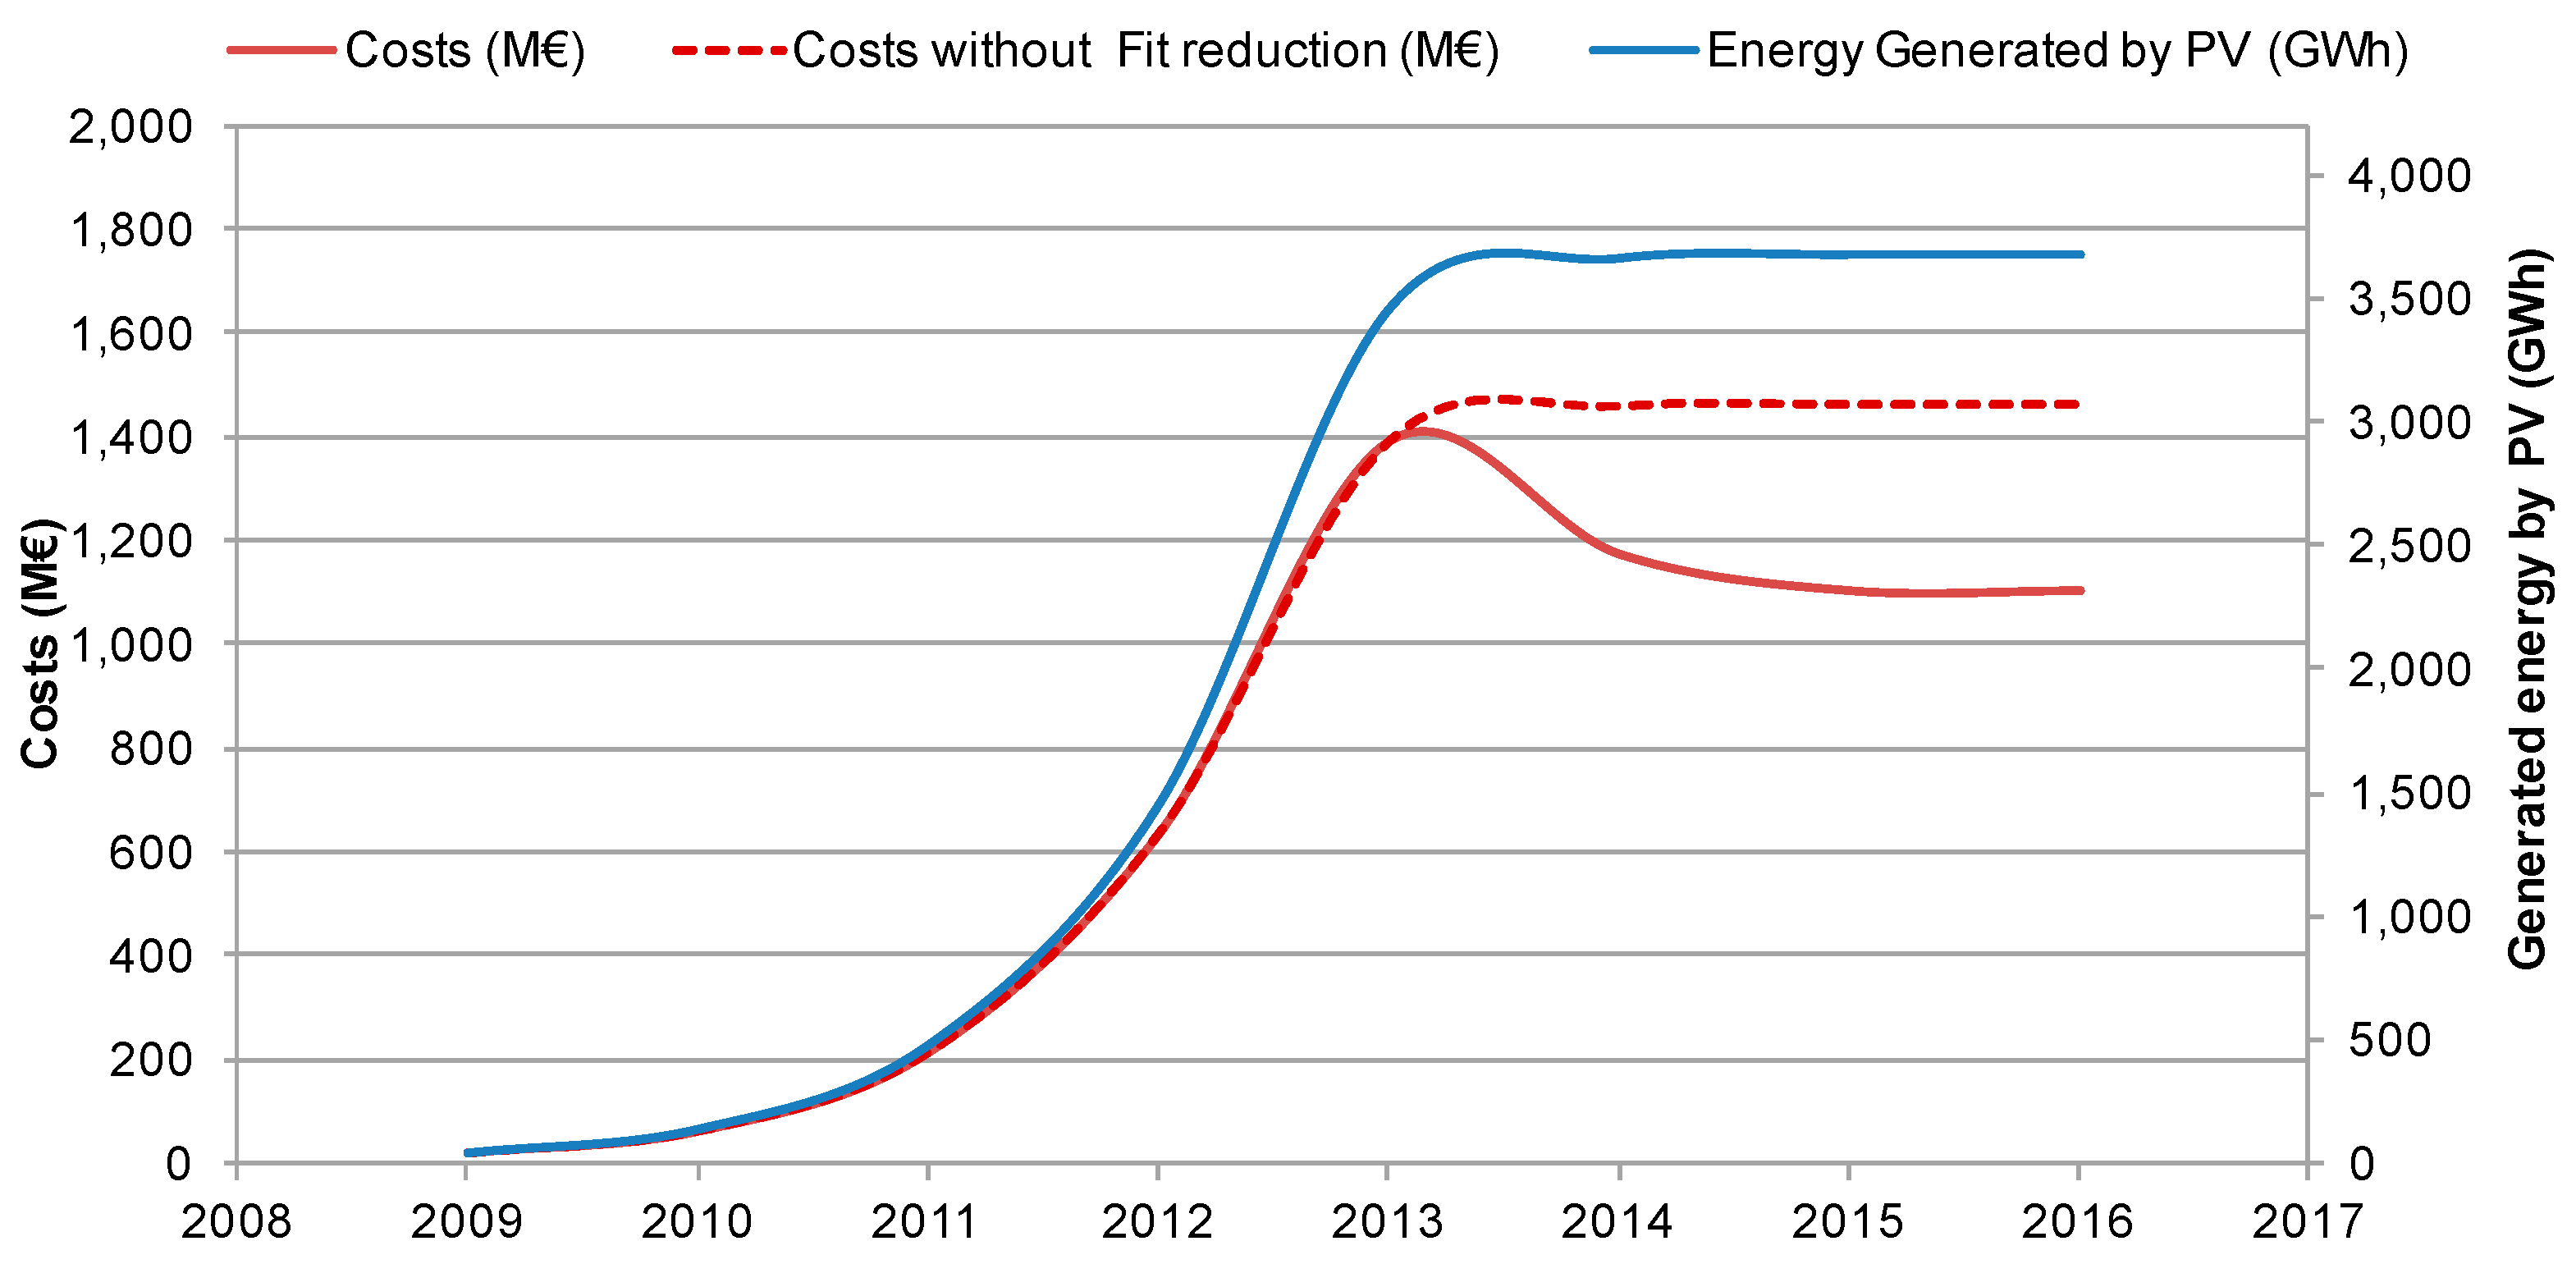
The costs that Special RES Account had to bear due to the remuneration of the generated energy exclusively for PV stations was estimated to peak in 2013 reaching 1392 million €. In 2014, this cost decreased to 1175 M€ and in 2015 to 1104 M€ (see
Figure 15). Had the tariff reduction not been implemented, the annual cost would have been equal to 1460 M€. The resulted decrease of the annual cost amounted to almost 25%. At the same time, the annually generated energy by the PV stations was calculated to be 3670 GWh, which equals to 9.5% of the total energy demand in MV and LV network in Greece.
As far as the sources of the outflows to the Account are concerned, 40% of those were due to remuneration costs for MV PV stations, 43% to LV PV stations including the ones installed by farmers while the rest 17% were attributed the Special Regime for small rooftop PV installations.
To better display the effect that the cost-containment measures had on the remuneration costs for the Special Account for RES, two additional scenarios have been created to represent the case when no regulatory amendments have been implemented.
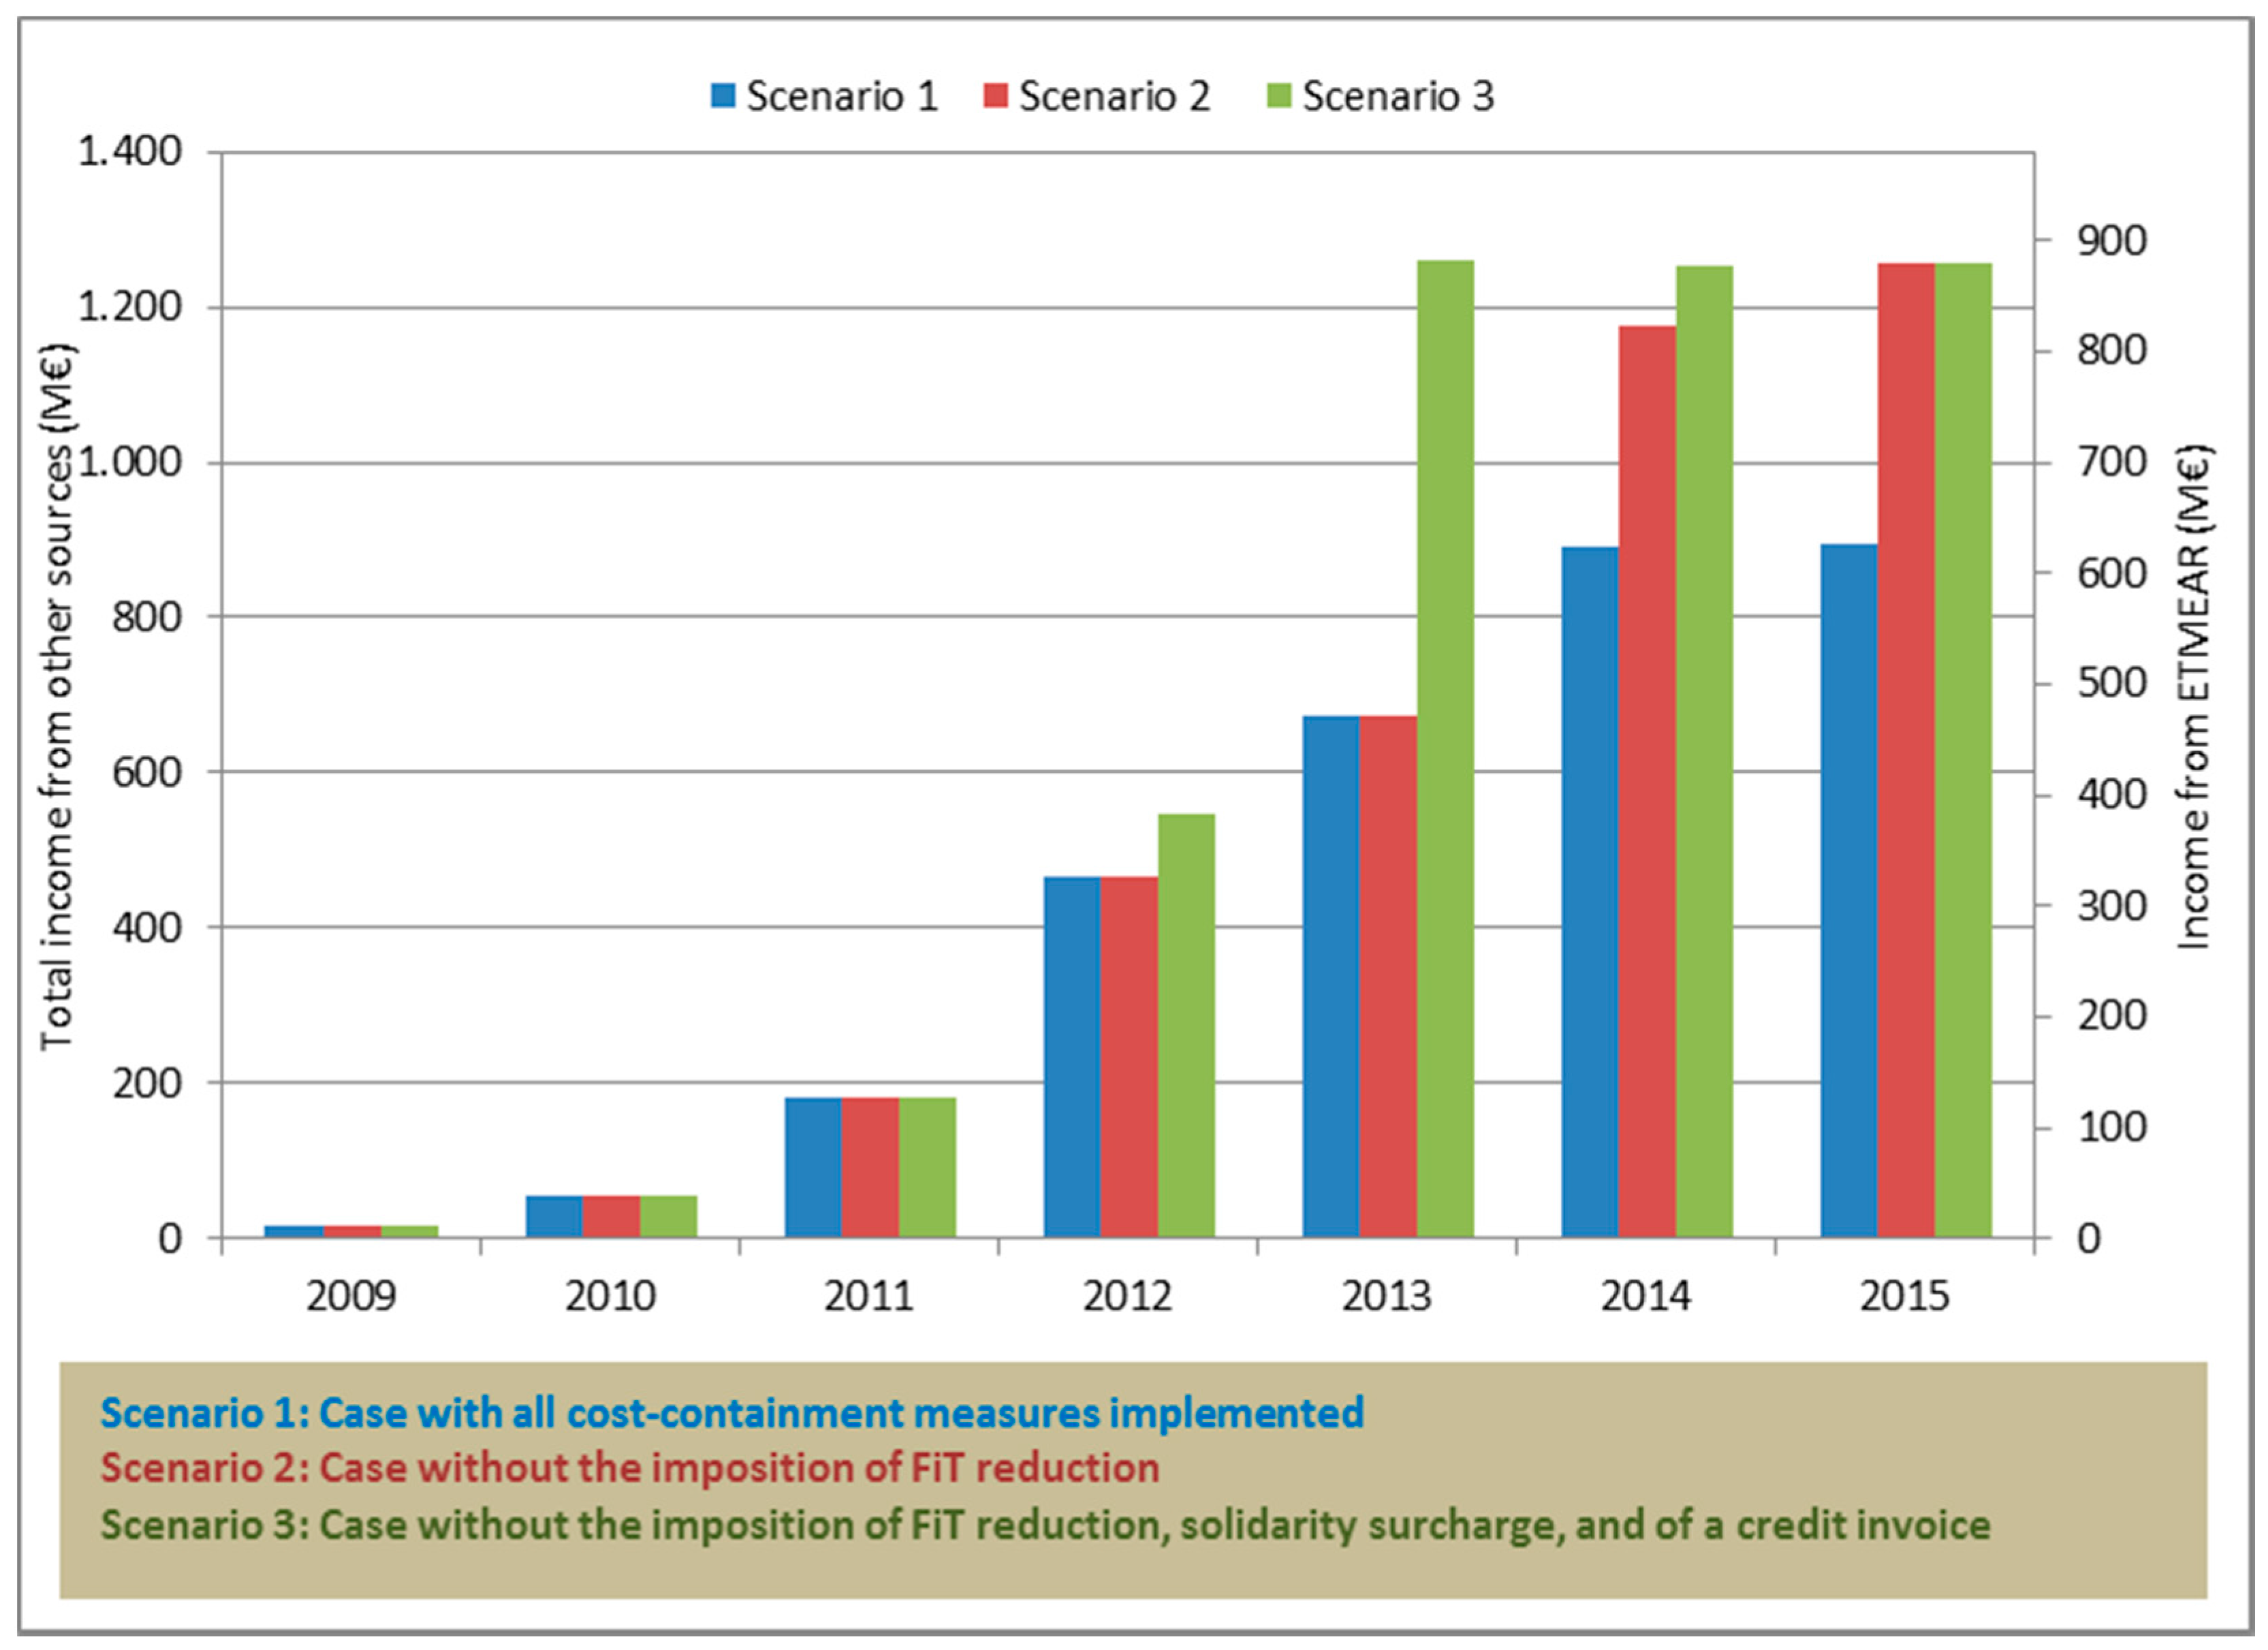
Figure 16 shows the chronological variation of the income of the Special Account for RES by the so called “other sources” including the ETMEAR (2nd
y-axis), assuming that the latter corresponds to approximately 70% of the total amount of the “other sources”. This is reflected in the blue columns labeled as Scenario 1. By comparing the required revenues resulting from the ETMEAR in 2015 with the second scenario (Scenario 2), where it is assumed that no FiT reduction has been imposed, we can estimate that the FiT reduction reduced the financial burden to electricity consumers from ETMEAR by approximately 300 M€. The share of the total income coming from ETMEAR is approximately equal to 50–60% of the total amount that has to be gathered for the remuneration of the energy generated by PV stations each year. The equivalent share for HEP is close to 20% while the rest comes from other minor sources. In essence the other regulatory measures apart from the FiT cutback postponed the necessity of implementing the reduction in the tariffs for almost two years.
The financial burden imposed on the consumer exclusively due payments for PV stations is demonstrated in the next table (see
Table 6). The calculations were performed assuming an equal distribution of the total income from the ETMEAR over each energy-consuming unit and considering that the ETMEAR covers 70% of the total inflows, taking into consideration the total consumption of the interconnected distribution network (MV and LV). According to scenario 1, the ETMEAR increased over 5400%. Had the cost-containment measures not been implemented, the increase would exceed the 7600%, that is the burden for the final consumer would have been higher by 40%. This means that the FiT cutback prevented an additional 40% increase in the electricity charge paid by electricity consumers which is important when considering the legitimacy and effects of the cost-containment measures applied.
8. Conclusions
In light of the new national RES support model, Greek policy makers are confronted with the challenge of ensuring fair compensation for the different PV investment projects, so as to reboot the investment interest and restart the market (currently there is no activity). At the same time risks of creating new deficits in the Special RES Account have to be mitigated, let alone avoiding increases in the charges upon consumers’ electricity bills. The main objective of this work was to ascertain the profitability reduction in various PV investments in view of the modified legislative and regulatory framework over the years from 2009 to 2014 and how the latter have also affected the consumers.
To quantify the impact of the regulatory amendments upon PV investments’ profitability, a fully parametric analysis was conducted by varying the following parameters: (a) total installation costs for different PV stations based on their activation date, (b) interest rate for a bank loan for each type of investment, (c) use of a construction subsidy or not from 0 to 40% available for the different types of PV stations considered, (d) tax imposition levels for the annual revenue for different PV investment categories, (e) the solidarity surcharge differentiated based on both the activation and the PA date of the PV system and (f) the issuance or not of a credit invoice. During the simulation procedure the simple payback period, internal rate of return and the profitability index were calculated before and after the imposition of the main regulatory interventions.
Evidently there is a considerable variety of real investment scenarios characterized also by different techno-economic parameters. As regards the overall impact of regulatory intervention, it is worth noting that this obviously was not the same for all stations. Instead, there was a wide divergence between the various categories and particularities of each investment case, which numbered more than 30,000 different scenarios. An attempt was made to identify these cases, which constitute the majority of investments in PV stations. On these grounds, and subject to the assumptions made about the parameters affecting investments, the results summarized below represent estimates of the typical cases as simulated across all PV investment categories (
Table 7).
The analysis shows that the impact on the profitability of PV stations is largely mediated by parameters such as the size of the station and the PV activation date (affecting installation costs and respective profit margins) as well as the option of subsidy taking. As such, the viability of PV stations connected to the MV network were by far affected the most by the regulatory amendments suffering from a FiT reduction of 34.3%, followed by LV PV stations with a FiT reduction equal to 14.7%. After the regulatory amendments took place, some of those PV investments connected to the MV network were no longer considered to be attractive. The profitability of farmers’ PV stations and PV rooftop systems were comparatively less affected, which is also reflected in their FIT cutback (i.e., FiT cutback 12% and 21.8%, respectively). The results may also indicate policy makers’ effort to protect small (Special Program) and somewhat unrelated to the electricity market (farmers) investors. Notably, although the FiT cutback for PV rooftop systems was considerably higher than the case of LV PV stations, their profitability was less affected due to milder cost containment mechanisms not applied in this case such as a lower tax-rate, the non-imposition of a solidarity surcharge and of the credit invoice for PV rooftop systems. Our results on how the profitability has shaped after the cost-containment measures in terms of IRR for PV rooftop systems are comparable to some of the limited studies in the filed [
3] for the case of Greece. Finally, with regard to our estimates on the impact of the cost containment measures on PV investment profitability, in terms of percentage variation in IRR, these are also akin to studies in different countries such as Spain [
12].
Since our analysis aimed to assess the impact of the FiT reduction and other cost-containment mechanisms on a variety of PV investments, the analysis was kept rather straightforward not accounting for the inflation rate and without a sensitivity analysis for the multitude of parameters considered. Therefore, the results have to be taken with caution, although the assumptions on the parameters were taken with great care to reflect the real features of different PV investment cases in Greece. Further research should extend the analysis by varying key parameters affecting the viability of PV stations such as OPEX and CAPEX costs, underlying inflation rates and interest rates.
The financial burden that the Special RES Account had to bear for the remuneration of the generated energy exclusively by PV stations, was also estimated in contrast to the costs saved due to the different cost containment measures. As far as the costs of the Account are concerned, 40% of those were due to remuneration costs for MV PV stations, 43% to LV PV stations including the ones installed by farmers while the rest 17% were attributed to small rooftop PV installations, which is proportionate to the relative profitability reduction across the different investment categories. From a social perspective, the FiT cutback prevented an additional 40% increase in the electricity charge paid by electricity consumers.
Overall the New Deal is considered a fair yet belated effort to rationalize the RES support system. It is advisable for the policy review process to be carried out timelier and in a less disruptive way for the market. Accordingly, once the depreciation for all farms is complete (i.e., expected by early 2020), it would be advisable to study the ex-post effects of the new deal so as to derive an updated and more uniform unit cost of production for different PV investments, allowing also for a decrease in the burden for consumers. In addition, studies regarding the levelized cost of energy generated by PVs in Greece should be conducted on a regular basis since the combination of the rapidly decreased PV panels cost with the high irradiance may lead to surprising results concerning their profitability. Conclusively RES support policy-making in Greece should gradually move towards support mechanisms with no allowance complexion. Their recent efforts as reflected in the new RES Law (L.4414/2016) that abandons the FiT policy in favor of a FiP and newly introduced net-metering legislation, are considered encouraging and should be complemented with the option of virtual net metering with all its variants (e.g., community, shared, neighborhood etc.), auto-production (i.e., self-generation) and storage (e.g., residential battery energy storage).


