Introduction
Saccade latency refers to the reaction time of a visually guided saccade; it is the time
between the appearance of a visual target and the onset of a directional eye
movement. In general, the latency of visually guided saccades in healthy adults
is typically around 200 ms with a
standard deviation of about 10% (Holmqvist et al., 2011). Fixation
stability can refer to a period of oculomotor
stillness, or it can imply perceptual input and processing. Fixation stability
is often thought a of as a reflection of attention ability (Rommelse, Van der Stigchel, & Sergeant, 2008).
Saccade latency is a prevalent
measurement in patient populations that might have
compromised vision and poor
accommodation, yet not many studies have investigated the relationship between
saccade latency and vision. Studies normally report visual acuity but not necessarily
at the relevant experimental testing distance (Bednarek, Tarnowski, &
Grabowska, 2006; Biscaldi, Gezeck, & Stuhr, 1998; Yang, Bucci, &
Kapoula, 2002). Saccade latency has been found to be a reliable measure with
good internal consistency, and is considered traitlike in adults (Ettinger et
al., 2003; Vikesdal & Langaas, 2016). However, one study has shown that
induced blur does not affect saccade latency but that subjects with amblyopia
show increased saccade latency compared to control subjects (Niechwiej-Szwedo
et al., 2012). To our knowledge, no previous studies have induced accommodative
response in saccade latency tasks.
The relationship between fixation and
vision has been previously investigated but with conflicting results. Several studies have looked at the effect
of blur on fixation accuracy. One such study found that fixation stability
decreased slightly with optical blur ≥ 2.0 D (Ukwade & Bedell, 1993). In contrast, another
study found that insertion of +5.0 D contact lenses reduced gaze errors (R. M.
Steinman, Pizlo, Forofonova, &
Epelboim, 2003). Another study found that eyes with poor
visual acuity due to amblyopia exhibit less stable fixation than their fellow
eyes and that when the good eye was covered and the amblyopic eye had the
visual input, the good eye also exhibited poor fixation stability (Gonzalez,
Wong, Niechwiej-Szwedo, Tarita-Nistor, & Steinbach, 2012). The finding of
reduced fixation stability with degraded visual input supports the idea that
visual feedback is important for the stabilization of gaze; often referred to as
a “closed-loop” neural control system (Otero-Millan, Macknik, &
Martinez-Conde, 2014). Steinman et al
presented a note in 1968 claiming that the relaxation of accommodation (induced
by the use of a cycloplegic agent) improved fixation stability by decreasing
the number of microsaccades (Robert M.
Steinman, Skavenski, & Sansbury, 1969). Following that analogy, increasing
accommodation should decrease fixation stability. To our knowledge, there have
been no studies looking at the effect of increased accommodation on fixation
stability.
It has been suggested that the increased
number of microsaccades observed in strabismic amblyopes while maintaining
fixation, result in increased saccade latency (McKee, Levi, Schor, &
Movshon, 2016). If this hypothesis is correct,
increased fixation instability should lead to saccadic delay. We have previously
shown that both saccade latency and fixation stability (indexed by logBCEA)
have good internal consistency, reliability and repeatability, which are not
influenced by sighting dominance or contact lens wear (Vikesdal & Langaas,
2016). By investigating the effect of induced optical blur and accommodative
response in visually-normal adults we wanted to explore the relationship
between visual acuity, accommodation and eye movement control.
Our intention was to clarify the importance to detect uncorrected refractive errors in studies of eye movement control. In line
with previous findings, we hypothesized that both decreased visual acuity and
increased accommodative response would lead to a more unstable fixation and saccadic
delay.
Materials and methods
Subjects
Sixteen healthy adult subjects (two males),
aged between 21 and 39 years (mean age 29.5 ± 7.3 years) were recruited from
the student and employee populations at the University College of Southeast
Norway. Subjects underwent a thorough optometric examination prior to
participation which included ocular refraction, near point of accommodation (by
RAF rule), positive relative accommodation, negative relative accommodation,
accommodative facility, heterophoria distance and near,
fixation disparity, near point of convergence, vergence facility,
positive fusional reserves distance and near, negative fusional reserves
distance and near. Inclusion criteria were normal
visual acuity with best refraction within -6.00 D to +4.00 D sphere and cylinder <
0.75 D as well as phorias, vergence
and accommodation measures within one standard deviation of expected values for
age (Scheiman & Wick, 2002).
Subjects were healthy and did not have a history of any
psychiatric or developmental disorder. All subjects gave informed consent prior
to inclusion in the study. The experiment was conducted in accordance with the
Declaration of Helsinki (WMA, 2013).
Apparatus and stimuli
During the experiment the subject sat in a
firmly mounted chair 100 cm from a computer screen, with the subject’s eyes in
line with the center of the screen. A chinand
forehead rest was used in order to minimize head movements. A video-based eye-tracking system, the IScan ETL-300, recorded the
vertical and horizontal position of the dominant eye with a sampling frequency of 120 Hz and an accuracy of 0.3° (ISCAN,
2003). The eyetracker uses corneal reflection and the center of the pupil to
obtain eye position, and precision for this setup was 0.161° (RMS). Further
details of the instrumental setup are described elsewere (Vikesdal &
Langaas, 2016). A calibration
procedure was carried out prior to each experimental session, with five
calibration points, one central point and four points placed in the corners of
the screen. Eye position data, with accompanying time stamps, were exported to
Excel for post-experimental analysis. Eye movements were recorded with both
eyes open to allow both accommodation and vergence to occur, as in natural
viewing. Subjects were instructed to focus on the stimulus as much
as possible; as the stimulus was small, it would be expected
to incite accommodative effort. The
stimulus consisted of a bright yellow dot 0.2° in diameter presented on a dark grey background on a fast phosphor monitor; the contrast level
was 92%. The room was dimly illuminated and the stimulus was easily visible in all experiment conditions.
Procedure
The experiment comprised one saccade task
and one fixation task. Subjects performed the experiment whilst wearing various
sets of daily disposable soft contact lenses (material: hilafilcon B;
curvature: 8.6 mm; diameter: 14.2 mm). Optical power was added to each subjects’ ocular refraction individually, plus to induce blur
and minus to induce accommodation. Subjects were tested wearing 6 different
sets of contact lenses: control lenses, which
were their best sphere (spherical correction -½cylinder
correction), and lenses
with an addition of +3.00
D, +1.50 D, -1.50 D, -3.00 D and -5.00 D, respectively.
The order in which these different powered lenses were worn was randomized. After insertion of the contact lenses, visual acuity was
measured at the testing distance with a logMAR Near Card and the near point of
accommodation was measured with a RAF ruler. The fit of the contact lens was
acceptable for all subjects, and the necessary contact lens adaptation time was
allowed before the experimental
sessions began. None of the subjects reported eye discomfort during the
experiment. Subjects performed two practice runs prior to the experiment. They were allowed to take breaks between
the tasks, in which case calibration of the eye tracker was repeated before
starting the next task. Subjects were instructed to maintain attention, and
they were continuously reminded of the importance of keeping the target clear
during the experiment. Depending on the need for breaks and the ease of contact
lens insertion and eye movement recording, the experiment lasted between 60 and
90 minutes.
Saccade Task. Each trial
started with the appearance of a fixation cross at the center of the screen,
which was visible for one second. When the fixation cross was extinguished, the
stimulus simultaneously appeared at one of eight possible positions, chosen at
random, which was placed at the vertices of a regular octogon, 5° from the
fixation cross. The stimulus was visible for one second. When the stimulus was
extinguished, the fixation cross re-appeared
immediately, signaling the start of a new trial. Subjects
were instructed to look at the stimulus
as quickly and accurately as possible. The saccade task consisted of 24 trials.
Fixation Task. The fixation
task was identical to the saccade task except the stimulus was visible for
three seconds. Subjects were additionally instructed to maintain fixation
for as long as the
stimulus was visible and to keep
focus on the stimulus at all times. The fixation task consisted of 16 trials.
The number of saccade and fixation trials
has been shown to be sufficient to obtain good internal consistency for healthy young adults
(Vikesdal & Langaas, 2016).
Data Analysis
The first trial of each task and trials
that had blinks were not included in the analysis.
Saccade latency. Saccade
latency was defined as the time at which eye velocity exceeded 20°/s for more
than 32 ms after stimulus appearance (i.e., 4 consecutive eye tracker sampling
points). This velocity
threshold has been used in previous, similar research
(Biscaldi, Fischer, & Hartnegg, 2000; Klein & Fischer, 2005). Each
trial elicited one saccade (the return saccade for next trial was not included
in the analysis). 2448 trials were analyzed, 185 (8.2%) were excluded (due to
first trials or blinks).
Fixation stability. Saccadic suppression typically
persist for approximately 80 ms after the end of a saccade (Holmqvist et
al., 2011). The fixation period was therefore defined to start 80 ms after
saccade offset and to end 80 ms prior to saccade onset. Each trial elicited one
fixation period, fixations of the cross in the center of the screen was not
included in the analysis. Fixation stability at the different locations were
collapsed for each participant in each condition. To obtain likeness of
fixation durations across subjects and trials, fixations lasting less than 50
sampling points, or 0.4 s, were also excluded
from analysis. 1632 trials were analyzed, 158 (10.7%) were excluded (due
to first trials, blinks or fixations lasting less than 0.4 s).
The sampling frequency of the eye movement
recorder (120 Hz) was too low to detect microsaccades. Therefore, ‘fixation
stability’ refers to ‘eye position dispersion during the fixation task’. We used the denomination bivariate contour ellipse area (BCEA) to
define the stability of fixation, which refer to the area in which the eye is positioned a certain percentage of the
time. This method of reporting fixation stability was first introduced by
Steinman (Robert M. Steinman, 1965) and is considered more complete than the
use of standard deviation, as it takes into account
the correlation between x and y coordinates
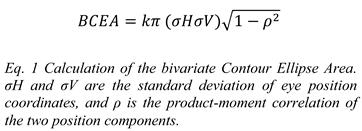
(Castet & Crossland, 2012). The BCEA is calculated by equation 1 (Equation (1)).
In equation 1, σH and σV refer to the
standard deviation of horizontal and vertical eye position coordinates,
respectively, measured in degrees and ρ is the productmoment correlation of the
two position components. k is a
chi-square variable with two degrees of freedom, commonly set to 2.291 so that the BCEA encompasses 68.2% of the highest density
points, known as a P-value of 68.2% (Castet & Crossland, 2012). The BCEA
presupposes that the distribution of fixation points is Gaussian, which has
been shown to be a reasonable assumption, at least for people with good visual
acuity (Robert M. Steinman, 1965). For statistical analysis we used logBCEA
(arcmin²) to approximate normal distribution (Amore et al., 2013; Cesareo et
al., 2014). We have previously shown that logBCEA (arcmin²) including 68.2% of
highest density points is a reliable measure of fixation stability with good
internal consistency (Vikesdal & Langaas, 2016).
Statistics
Statistical analysis was performed using
the IBM© SPSS Statistics version 22 (Copyright IBM Corp. and other(s), 1989,
2013). The α level was set at 0.05. To check for normality in our data, the
one-sample Kolmogorov-Smirnov test was performed.
Saccade latency was normally distributed
for the ‘Control’ condition and the ‘Accommodative’ condition, but not for the
‘Blurred’ condition (p=.200, p=.200, p=.010, respectively). The non-parametric
test relatedsamples Wilcoxon signed rank test was used to analyze differences
in saccade latency between conditions.
LogBCEA was normally distributed for all
conditions (p=.200, p=.200, p=.200, respectively). Repeated measure one-way
analysis of variance (ANOVA) was used to analyze differences in fixation
stability between test conditions, and paired t-tests were used for pairwise
comparison.
Results
All participants had visual acuity equal to
or better than logMAR 0.0 at the testing distance, and near point of
accommodation equal to or better than expected value according to Hofstetter’s
formula (Scheiman & Wick, 2002). Visual acuity were measured at the
experimental testing distance (1.0 m) and near point of accommodation were measured with a RAF ruler,
whilst subjects wore the
different experimental lenses.
Data were grouped
according to the effect the lenses had on visual acuity and near point
of accommodation; conditions were called ‘Control’, ‘Blurred’ and
‘Accommodative’. Conditions are described in
Table 1.
Some of the subjects had similar visual acuity and near point of accommodation with more than one pair of contact lenses. This resulted in more trials in some of the conditions, which were averaged, so that each participant ended up with one mean saccade latency and one mean fixation stability per condition.
Table 2 shows an example of how the data were grouped. This way of grouping the data ensured that all trials in the ‘Blurred’ condition were recorded with an actual reduction in visual acuity and minimized the risk of intermittent blur due to transient accommodation in the other conditions. Also, the number of tested participants in each condition remained sixteen.
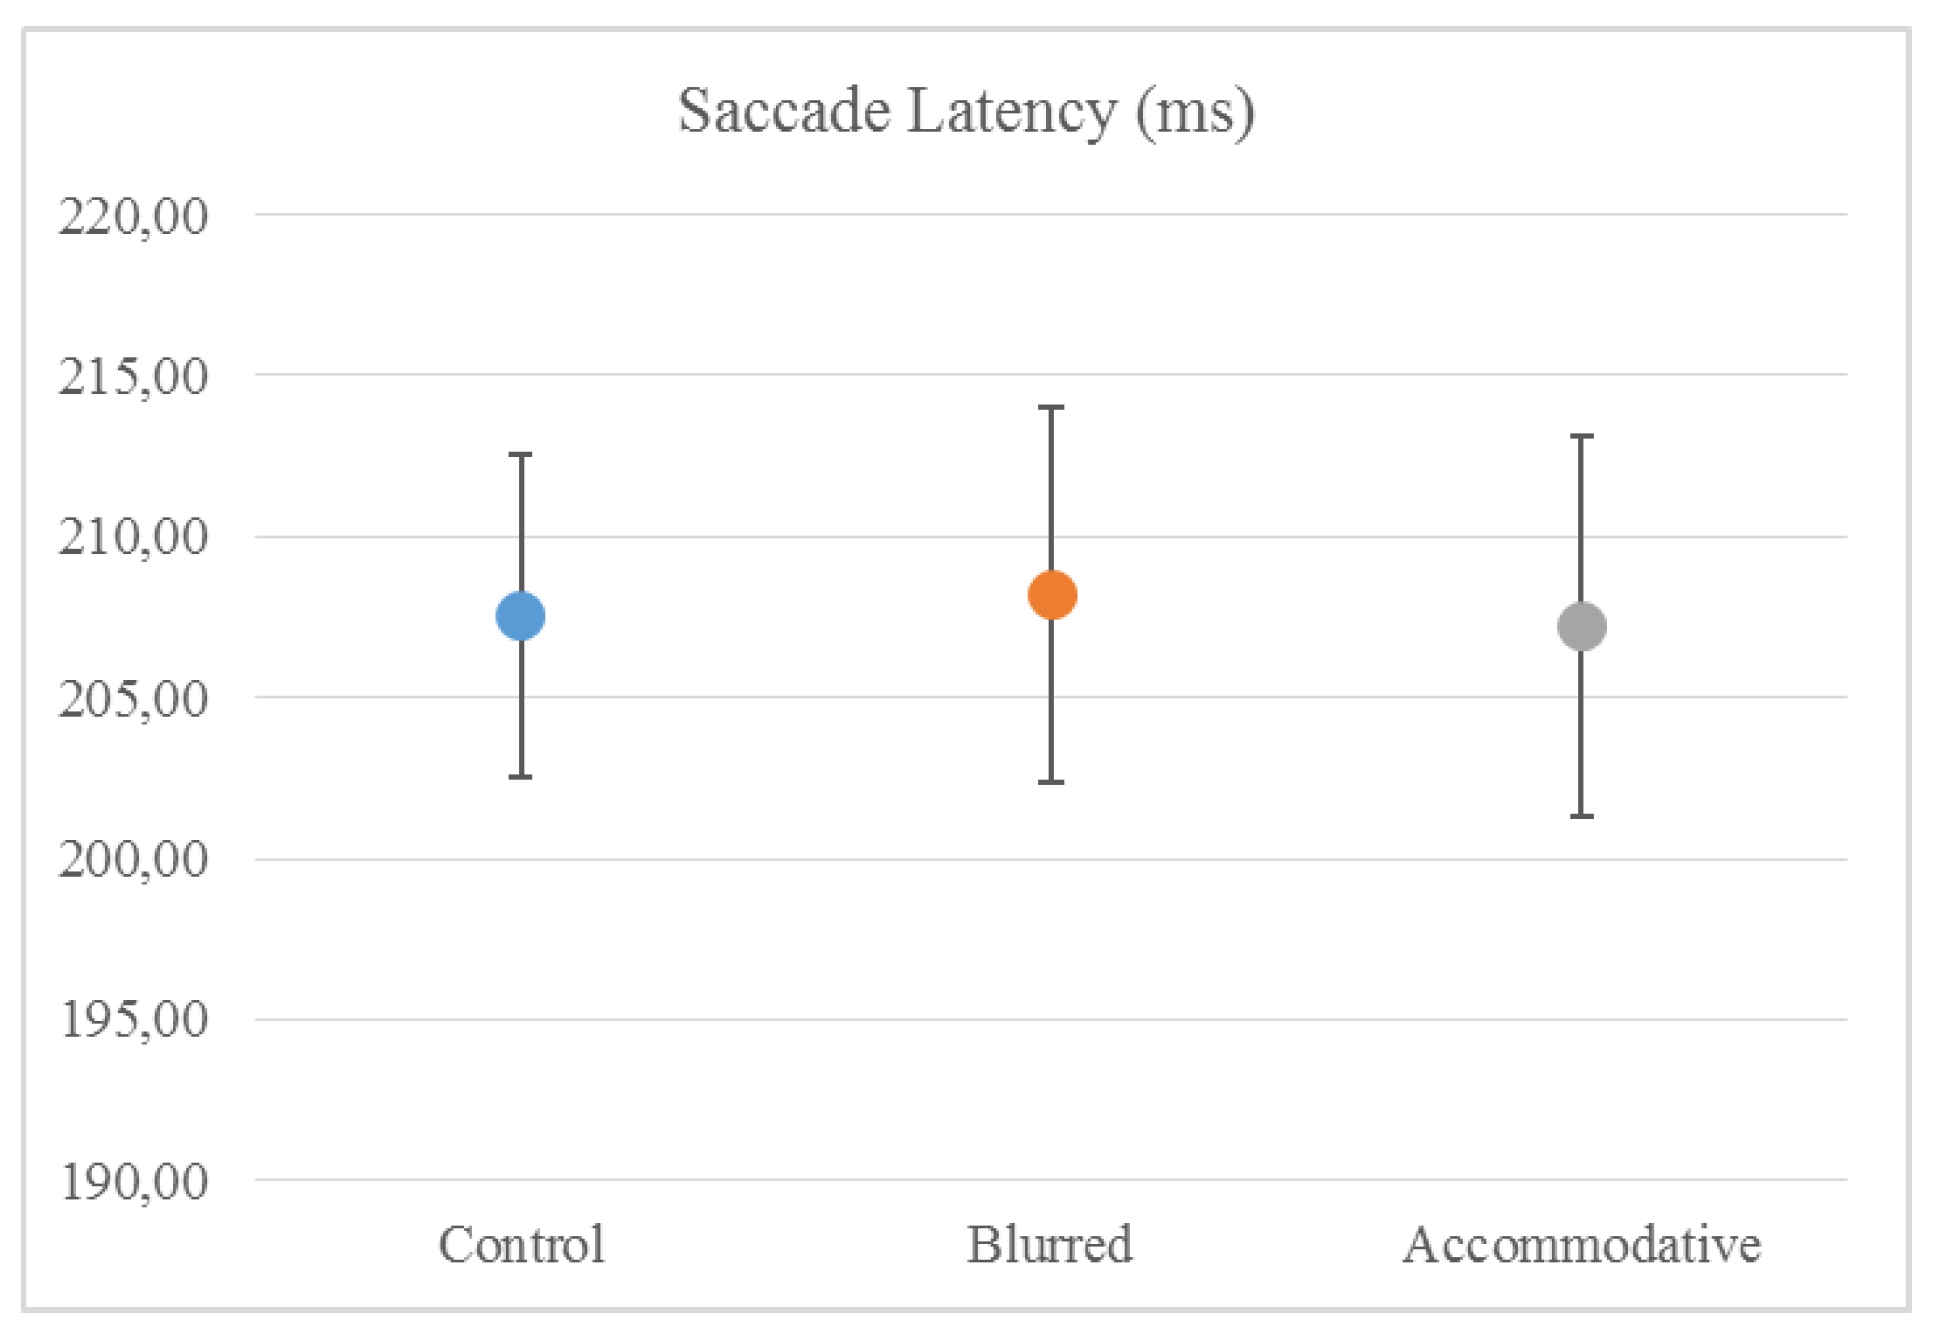
Mean (± standard error) saccade latency was 207.6 (±5.0) ms in the ‘Control’ condition, 208.2 (±5.8) ms in the ‘Blurred’ condition and 207.2 (±5.9) ms in the ‘Accommodative’ condition. There were no differences in saccade latency between the groups (related-samples Wilcoxon signed rank test) (
Figure 1).
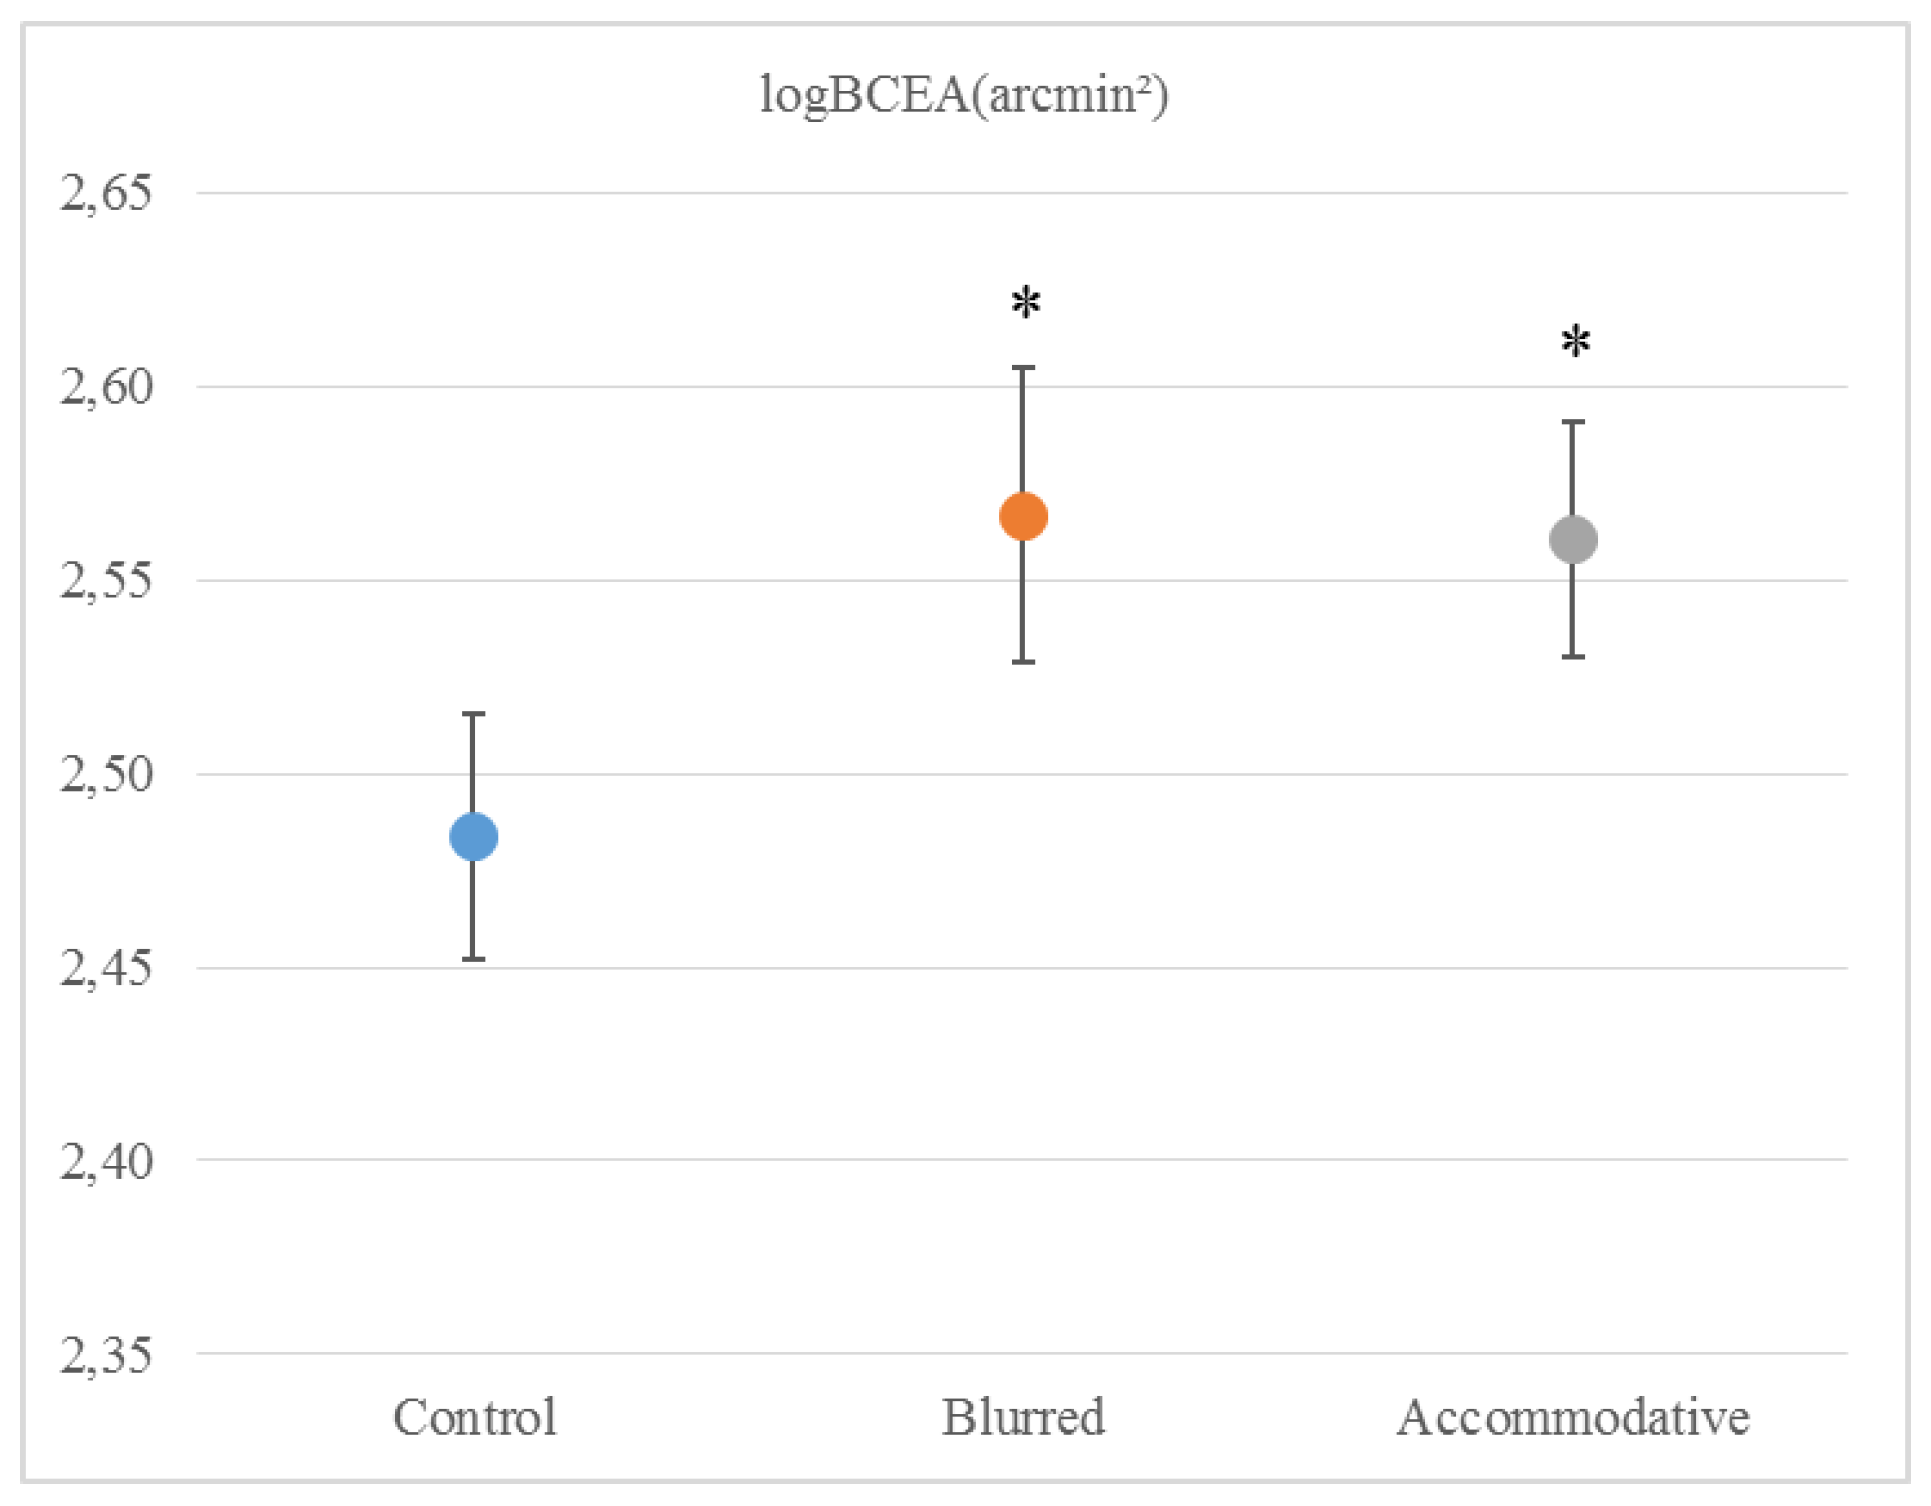
Mean (± standard error) logBCEA was 2.48 (± 0.03) arcmin² in the ‘Control’ condition, 2.57 (± 0.04) arcmin² in the ‘Blurred’ condition and 2.56 (± 0.03) arcmin² in the ‘Accommodative’ condition. The conditions were significantly different (repeated measure ANOVA, V = 0.532, F2,14 = 7.964, p =.005), both the ‘Blurred’ condition (t = -3.963, df = 15, p = .001) and the ‘Accommodative’ condition (t = -2.194, df = 15, p = .044) were different from the ‘Control’ condition (
Figure 2).
Discussion
This study did not show any effect of optically induced moderate refractive errors on saccade latency, which remained around 207 ms for all the test conditions. Saccade latency values in this study are consistent with other studies that have used comparable tasks (Bednarek et al., 2006; Klein & Fischer, 2005). The finding that saccades are not influenced by visual disturbance supports the idea that they are mainly under “open-loop” or ballistic control. On the other hand, fixation was less stable with both blur induced by plus lenses and with accommodation induced by minus lenses. Other studies that have looked at fixation stability in adults have found comparable values to our own (Crossland & Rubin, 2002). Gonzales et al used a similar setup but with a closer viewing distance of 60 cm and a 3° fixation cross, which was fixated for 15 seconds (Gonzalez et al., 2012) They found that fixation stability in healthy adults under binocular viewing conditions was logBCEA -0.88 deg², which translates to logBCEA 2.67 arcmin². In the present study, the best fixation stability (recorded in the ‘Control’ condition) was logBCEA 2.48 arcmin², considerably better than in the Gonzales study, presumably due to our shorter fixation period (3 seconds vs. 15 seconds). In a previous study, we found that fixation stability measured in healthy adults wearing a contact lens with correct refraction was logBCEA 2.52 arcmin², slightly degraded compared to measuring without wearing a contact lens. From this, we concluded that researchers should consider measuring participants without their contact lenses, if refractive errors are small (Vikesdal & Langaas, 2016). The present study finds that fixations stability decreases to logBCEA 2.57 arcmin² with blur induced by +1.50 or +3.00 lenses that led to a visual acuity poorer than logMAR 0.10. Our findings of poorer fixation with blurred visual input are consistent with the results of Gonzales et al, who found that degraded visual input from an amblyopic eye resulted in poor fixation stability in the unaffected eye (Gonzalez et al., 2012). In a different study, Ukwade and Bedell reported a reduction in fixation stability of 3.1 arcmin² (standard deviation of eye position) with optical blur that was introduced using trial lenses of 2-4 D (Ukwade & Bedell, 1993). Their participants maintained reasonably good fixation with all trial lenses, and the reduction in fixation stability was judged to be “of little functional importance” and they concluded that clinical studies could disregard refractive errors up to 4.0 D (Ukwade & Bedell, 1993). Our results show that fixation stability measured by logBCEA arcmin² decline with blur by about 0.09 log units, which translates to 7.943 arcmin². The study from Ukwade and Bedell was performed at 2 m distance and a considerably longer fixation period lasting for 20 seconds. However, they had a more rigid setup with participants using a bitebar during the experiment, which can explain their findings of more stable fixations. Nevertheless, we have previously shown that fixation stability is reliably reported as logBCEA (Vikesdal & Langaas, 2016), in support by others (Castet & Crossland, 2012). Our findings of reduced fixation stability reported by logBCEA, in associated refractive errors cannot be disregarded. Contrasting our findings, Steinman et al found that with degraded visual acuity fixation was more accurate (R. M. Steinman et al., 2003). They concluded that the human visual system operates efficiently, in that one only fixates as accurate as necessary to complete the task, hence when the task is more difficult one fixates more accurately. Our findings suggests that fixation might be more vulnerable to visual disturbance than Steinman et al assumed.
Accommodative effort also degraded fixation stability by a similar amount, about 0.08 log units. This is particularly interesting given that participants had good visual acuity at the testing distance. It could imply that when subjects were accommodating by a certain amount, fixation stability was impaired even if they could see the target clearly. However, even if visual acuity was measured just before testing, it does not rule out the possibility of intermittent blur during the experiment. Our study defined accommodative effort as being more than 2 D below expected near point of accommodation for age. From clinical observations, we know that a remote near point of accommodation may lead to intermittent blur at close testing distances. However, participants were carefully instructed to keep the target clear at all times during testing, and the test distance were 1 m, not particularly close. In addition, the variability of fixation stability were similar for all conditions. Hence, the finding of a reduced fixation stability with accommodative effort seems to be a reliable finding, suggesting that poor accommodation is a contributing factor in the findings of poor fixation stability in patients groups. Future studies should target this issue further by investigating fixation stability in patient groups with and without accommodative disorders.
Our findings support the hypothesis that both decreased visual acuity and increased accommodative response leads to a more unstable fixation, but does not support the suggested connection between unstable fixation and saccadic delay.
Conclusion
In this study, induced refractive errors influenced fixation stability but saccadic latency remained relatively stable within the range of -5.0 D to +3.0 D. Since saccadic latency and fixation stability responded differently to the induced refractive errors, the results do not support the idea of a common neural control mechanism for fixation and saccades.
It has not been ruled out whether our results can be replicated in subjects with real accommodative disorders or degraded vision. Nonetheless, our results indicate that researchers should be aware that uncorrected refractive errors may potentially influence the recording of fixation stability, and for experimental studies that have a high accuracy demand, we recommend that subjects should be corrected to normal visual acuity with a minimal accommodative load. Saccade latency may be recorded without correction of moderate refractive errors.
