Abstract
By transplanting the Developmental Eye Movement (DEM) test chart to a virtual reality head-mounted display (VR HMD) system, this study sought to evaluate the effectiveness of the DEM test for measuring dynamic visual acuity. Thirty-nine adults aged 20–39 years of both genders were the subjects of the study. After undergoing measurement of their visual function, through medical questionnaire, interpu-pillary distance (IPD), near point of convergence (NPC), near point of accommodation (NPA), and far and near phoria, the correlation between the tests was analyzed performing DEM vertical, horizontal test and VR HMD DEM (VHD) vertical, horizontal test. NPC and NPA decreased significantly after the VHD test, while phoria did not. The horizontal was quicker than the vertical in the DEM test, and vice versa in the VHD test. DEM was quicker than VHD in both the vertical and horizontal directions. There was no notable difference in error frequency between DEM and VHD. In terms of DEM and VHD test, there was no notable difference in the short-range IPD and subjective symptoms of the top 10 and bottom 10 subjects. The performance time for VHD, in which the chart must be read while moving the body, was longer than that of DEM. Therefore, based on the consistency of the results of both tests and the lack of a difference in error frequency and subjective symptoms, the VHD equipment proposed in this thesis is as effective as dynamic visual acuity measurement equipment.
Introduction
Humans receive information from the external environment through various sensory organs. Vision is more advanced than the other senses (Kuppers, 1992; Kim, 2007), and plays an important role in assisting the other senses. Of the various methods used by humans to obtain external information, vision is the most important (Atchison, Smith, & Efron, 1979; Campbell, & Green, 1965; Jason Jerald, 2015).
Visual acuity can largely be categorized into static visual acuity and dynamic visual acuity. Generally, discussions on vision have been limited to static visual acuity, defined as ‘the ability to see a non-moving object at a certain distance’. Static visual acuity is measured from a far distance (5–6m) or at a certain fixed distance, which has becomes the resolution measurement standard for vision testing (Gardner & Sherman, 1995; Coffey & Reichow, 1990; Berman, 1993).
Dynamic visual acuity defines the ability to see the subject while the object or the observer is in a moving state. This plays an important role in, among others, sports performance, which requires consistent movement in response to changes in the surrounding conditions (Yoshimitsu & Hiroshi, 2004). Dynamic visual acuity can largely be divided into two categories. First, dynamic visual acuity (DVA), recognition of an object moving in the horizontal direction. Second is kinetic visual acuity (KVA), the recognition of approaching and receding objects (Won, & Mah, 1993).
In sports, accurately recognizing and distinguishing a moving object is required more frequently than a nonmoving object. Therefore, in sports, the ability to accurately detect moving objects is critical. Of the various sports events, those involving rapid movement by maintaining a state of physical tension are known as dynamic sports, which include baseball, football, basketball, table tennis and skiing. Dynamic visual acuity is an important factor in measuring the performance of athletes (Lee, & Sin, 2005; Lee, Mah, & Won, 2000) and requires exceptional binocular vision. To improve sports performance, optometrists linked to sports organizations perform general refraction, providing optical prescriptions in addition to carrying out training program activities related to vision (Graham, 2007; Thomas, & Jeff, 2004; Joanne, & Bruce, 1997). In elderly people, even if the static visual acuity is normal, a low, or aging-mediated reduction in, dynamic visual acuity is associated with an increased frequency of traffic accidents (Mitsuru, & Daisuke, 2005).
Factors that influence dynamic visual acuity can be categorized into physical factors of the measurement system and physiological factors of the subject (Hoffman, Rouse, & Ryan, 1981). Physical factors include the brightness of the sign, speed of movement, irradiation time, size etc. Physiological factors include resolution of the eye, peripheral recognition ability, eye movement ability etc. The measurement result can differ depending on these two types of factor. Preceding studies (Lee, Oh, & Jeong, 2010; Bebguigui, & Ripoll, 1998; Sebastian, & Daniel, 2012) showed that the dynamic visual system is similar to other movement systems of the body, therefore, the function can be improved by vision training.
The ability to accurately see an object during movement is an important part of visual ability; however, measurement of such visual ability is not included in standard vision tests.
Study of dynamic visual acuity is difficult, as no general standardized measurement system has been established. Therefore, comparison with preceding studies is problematic. This study aimed to verify the effectiveness of the impulse eye movement test of dynamic visual acuity, by transplanting the developmental eye movement (DEM) test chart to a virtual reality head-mounted display (VR HMD), which is currently a focus of interest in immersive media.
DEM and VHD
DEM, a clinically performed indirect eye movement test, is widely used to determine abnormalities in learning-related visual function (Webber, Wood, Gole, & Brown, 2011; Wills, Gillett, Eastwell, Abraham, Coffey, Webber, & Wood, 2012, Janet, Kimberly, Emily, & Marcia, 2005; Janet, Fan, Pamela, Andrea, & Jack, 2006; Akinori, Yuji, & Yoshinori, 2006; Alessio, Silvio, & Tony, 2011). In addition to eye movement ability, the present study proposed that perception and reading ability also influence the evaluation result (Ayton, Abel, Fricks, & McBrien, 2009; Medland, Walter, & Woodhouse, 2010; Kulp, & Schmidt, 1997; Kulp, & Schmidt, 1998). Subjects aged 20–39 years were selected for this study, as perception and reading abilities have little effect in such subjects and they have similar dynamic visual acuity test performance.
The VR HMD DEM(VHD) suggested in this thesis facilitates measurement of dynamic visual acuity and incorporates the existing DEM chart. Whereas the existing DEM test measures reading ability in a static state, in the VHD method, the participant moves their head and body while reading the sign, thus enabling measurement of dynamic visual acuity used in actual daily life.
DEM test is composed of two vertical tests (Tests A and B) with 40 numbers arranged in a vertical direction, and one horizontal test (Test C) with 80 numbers arranged in a horizontal direction.
- The test performance time is revised and recorded in accordance with the number of inaccuracies. Accordingly, the test performance time and the number of inaccuracies are important factors in the evaluation. The DEM test procedure is described below.
- Tests A and B are read aloud in the vertical direction. The time required for reading and the number of inaccurate answers, additional numbers (including repetitions), omissions, and switches is recorded.
- Test C is read aloud in the horizontal direction. The time required for reading and the number of inaccurate answers, additional numbers (including repetitions), omissions, and switches is recorded.
- Check the total number of inaccuracies. Inaccurately read numbers should be marked s, additional numbers should be marked a, omissions should be marked o, and switches in order during reading should be marked t. Therefore, the total number of inaccurate answers is calculated as s+a+o+t.
- The adjusted time isHere, the measurement time is the time required to read the horizontally arranged numbers aloud, o is the quantity of numbers omitted during reading, and a is the quantity of repeated or additional numbers.
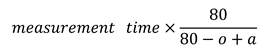
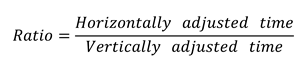
- Calculate the horizontally adjusted versus vertically adjusted time as follows:
In the DEM test, the examiner instructed the participant to hold up each of the vertical and horizontal test charts in a fixed order and to read the numbers as accurately and quickly as possible. The examiner then determines the accuracy of the participant’s reading.
In the VHD test, the participant was instructed to wear the VR HMD, and the examiner checked whether the sign in front of their eye is sufficiently clear for reading. Before the test, the participant was instructed to look at the fusion point at the left top portion of the chart to ensure that the image does not become separated, and then the test was carried out using the same method as for the DEM.
The test contents of all participants were recorded, and then the test performance time and occurrence of errors were measured during confirmation of the test result.
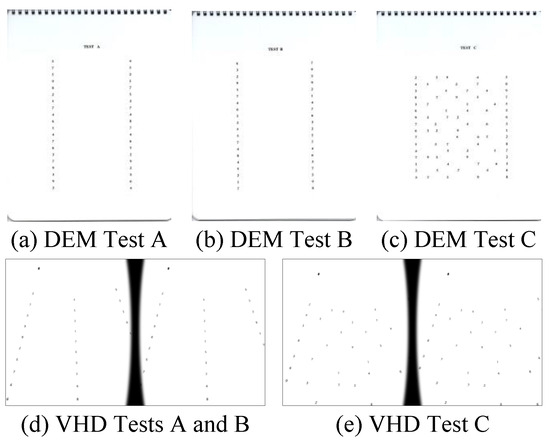
Figure 1.
DEM and VHD charts.
Figure 1.
DEM and VHD charts.
VR HMD
VR refers to an arbitrary environment and situation created by a computer, or that technology itself (Rizzo, hartholt, Grimani, Leeds, & Liewer, 2014; Schuemie, van der Straaten, Krijn, & van der Mast, 2001; Kim, Ryu, & Hur, 2004). It is extremely similar to reality, the user is not simply immersed in the virtual reality, but can interact with the materialized objects through operations and/or commands using the existing device. Virtual reality can be categorized into VR HMD, projection virtual reality, and virtual reality simulation.
The VR HMD used in this thesis is worn on head, and comprises a high-resolution display and GPS, geomagnetic field, gyroscope and other sensors (Palter, Sobko-Koziupa, Gilhuly, & Pyer, 2000; Lee, Ha, Cha, Kim, Lee, & Kim, 2015).
Optical system
Image formation on the convex lens
The VR HMD is equipped with a convex lens to visualize proximal displays (Michael, Steve, Martin, Elmar, & Marcus, 2015; Zhao, Wang, Guo, Sun, & Lu, 2004). The VR HMD positions the object inside the focal length of the lens. The image is formed as an expanded established image in the rear direction of the smartphone in the object space (Eugene, 2001).
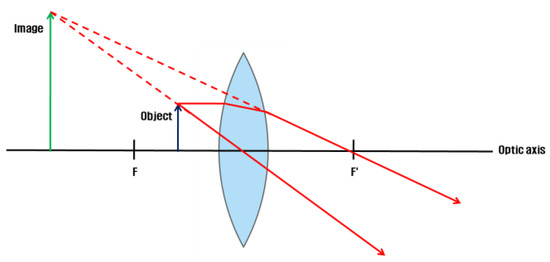
Figure 2.
Image formation on the convex lens of the VR HMD.
Figure 2.
Image formation on the convex lens of the VR HMD.
VR HMD parameters
In accordance with the focal length of the lens and the magnification formula
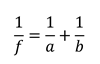 (f = focal length of the lens, a = object distance, and b = image distance) (WIKIPEDIA, Lens(optics)), the distance from the lens to the actual screen (a-value) 36 mm, the distance from the lens to the virtual screen (b-value) 159.31 mm, and the focal length of the lens (f-value) 46.51 mm are each substituted in determining the lens magnification value b/a as 4.43 (round-off value of 4.4286). The Galaxy Note 3 from Samsung Electronics was used as the mobile display.

Figure 3.
Schematic diagram of pixel size expression according to magnification (pixel size is rounded to the nearest hundredth).
Figure 3.
Schematic diagram of pixel size expression according to magnification (pixel size is rounded to the nearest hundredth).
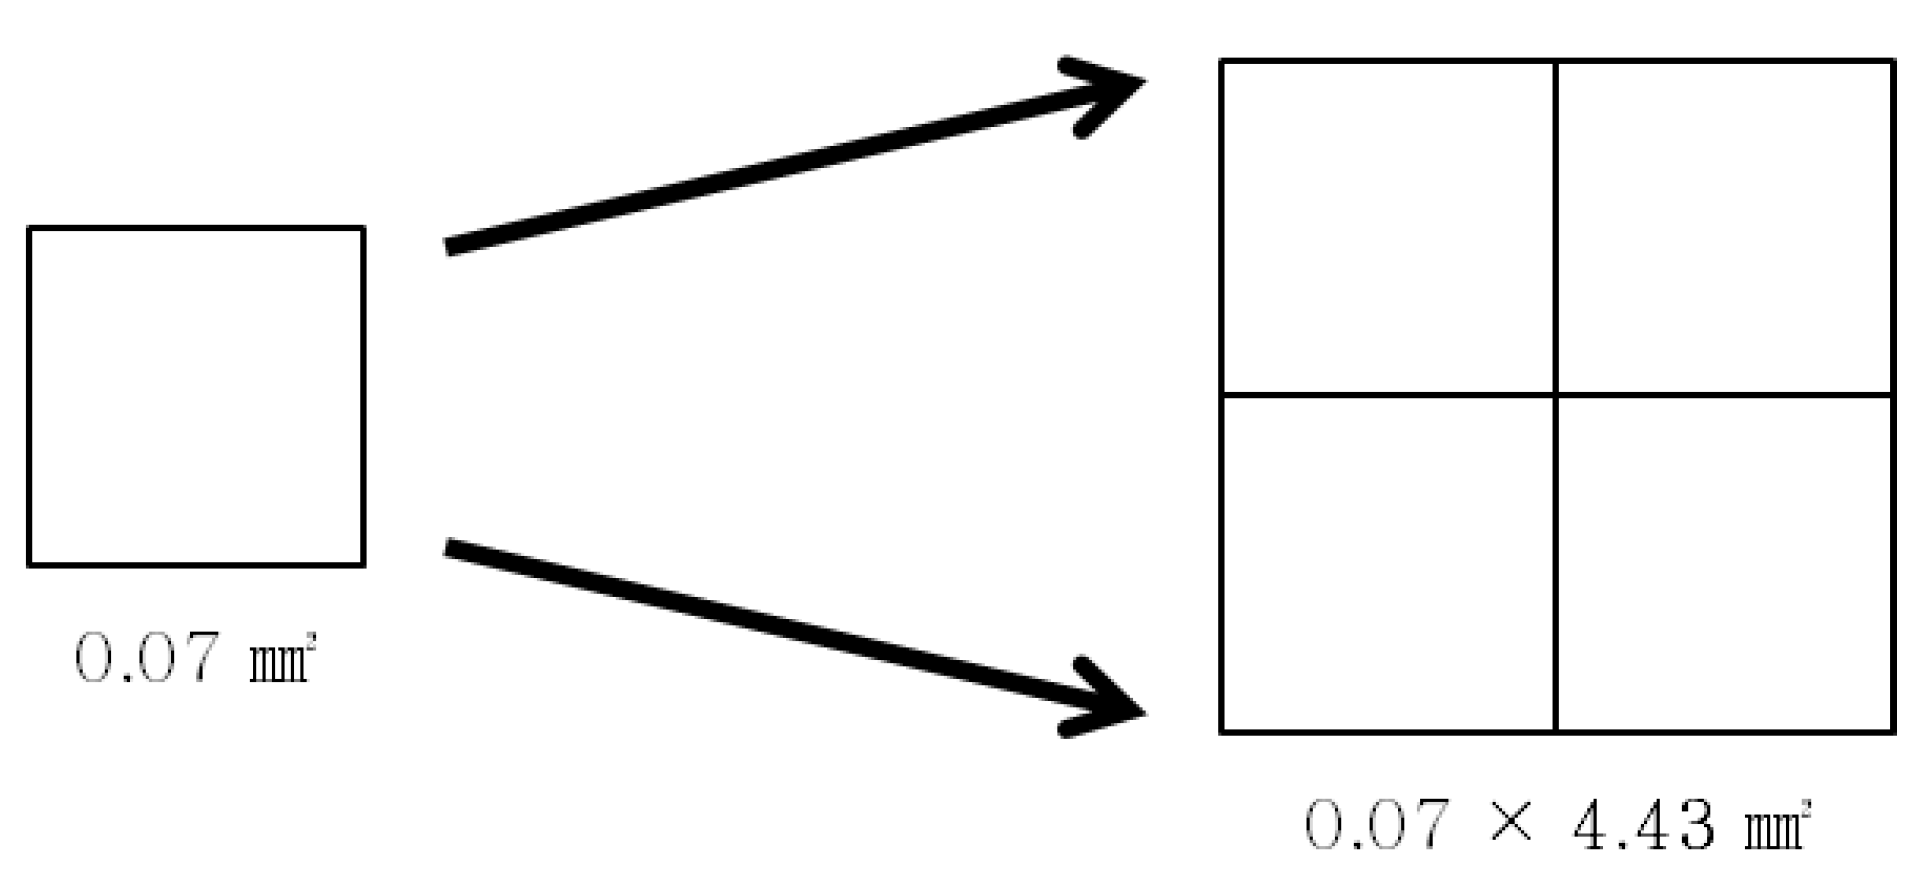
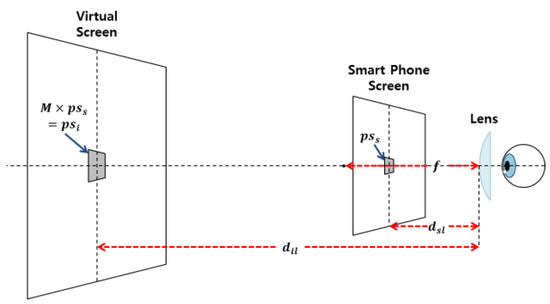
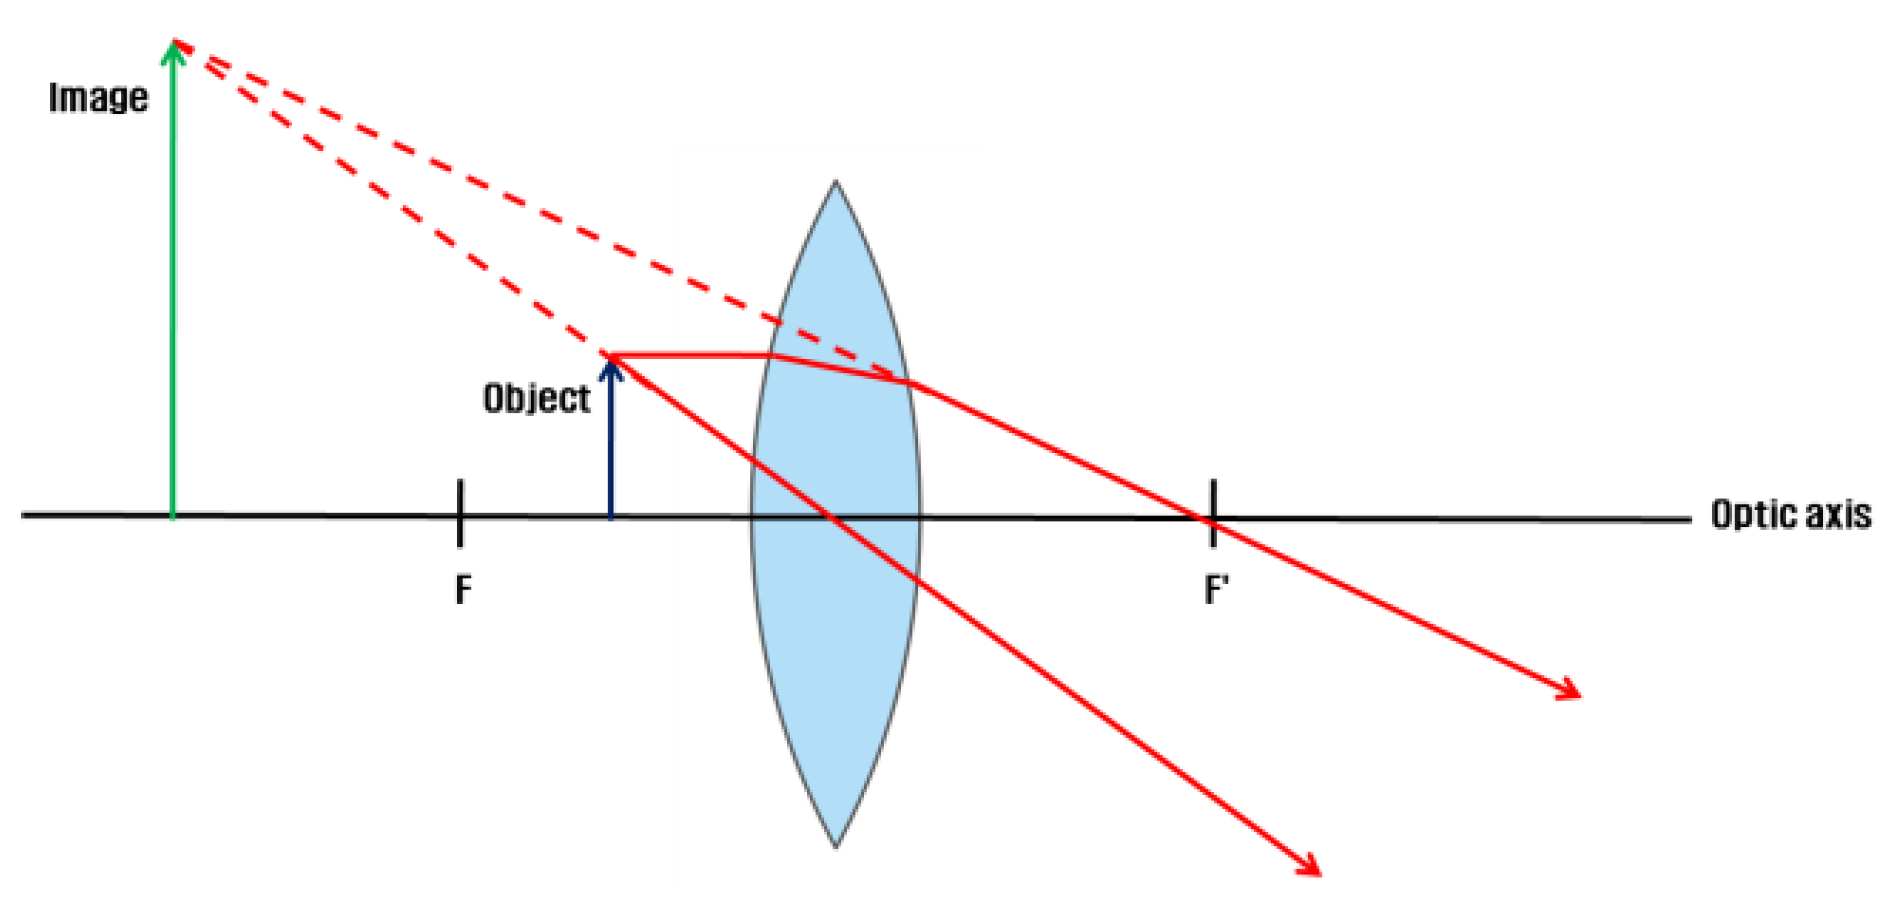
Figure 4.
Schematic diagram of the VR HMD optical system.
Figure 4.
Schematic diagram of the VR HMD optical system.

Methods
Participants
Thirty-nine participants aged 20–39 years were selected for this study (mean 23.87±3.21 years), who understood and agreed with the objective of this study, and did not suffer from any ophthalmological disease, mental illness, or systemic disease, and displayed a >0.8 far•near distance corrected visual acuity.
Procedure
Medical questionnaire and prior eye movement tes
The participants completed a medical questionnaire regarding eye movement abnormality and history, through their physical condition and H-S scale (Pursuit Eye Movement) prior to starting the experiment.
The questionnaire comprised six categories— occupation, physical activity (exercise and games), VR HMD experience, prior medical history, visual function training experience, and driving.
The study was carried out in the following order: medical questionnaire, H-S scale, visual function test (dominant eye, interpupillary distance (IPD), near point of convergence (NPC), near point of accommodation (NPA), and far and near phoria). DEM test, survey of subjective symptoms immediately following the DEM test, VHD test, NPC, NPA, far and near phoria and survey of subjective symptoms immediately following the VHD test.
Static DEM test was carried out first in order to raise the participants’ understanding on the experiment. To reduce fatigue effect, 1-minute interval was allowed between DEM vertical test and horizontal test, and between VHD vertical test and horizontal test. To reduce fatigue effect, 10-minutes interval was allowed between DEM test and VHD test.
Visual function test
The visual function test items were: dominant eye, IPD, NPC, NPA, far and near phoria. The Rosenbach method was used for the dominant eye, a digital PD meter (BRT-II) was used to measure IPD, a push-up bar was used for the near point test, and a Howell phoria card (Maples, Savoy, Harville, Golden, & Hoenes, 2009; Chiharu Yamaguchi, Hasebe, Ohkubo, Takaba, Sira, Hasebe, & Ohtsuki, 2012) was used for the far and near phoria test.
VHD chart production
The Nanum-Bareun Gothic (bold) font was used for the VHD test chart, and the Open Type Font (OTF) method was applied (Kim, Lee, & Ra, 2002; Kim, & Lee, 2002). Based on the Landolt C sign (William, 2006), which defines the sight and vision that distinguishes within 1.5 mm in 5.0 m distance, as 1.0, 1 arcminute each, it was produced in the size of 0.1 sign at 159.31 mm distance, which is the distance from the lens to the virtual display. This size corresponds to 4 points. When looking at the sign through the VR HMD, the built-in convex lens applies a magnification of ×4.43; therefore, the numbers on the chart were of a size appropriate to that magnification.
To facilitate comfortable single vision during the VHD test, a fusion point was set-up on the left top of the sign.
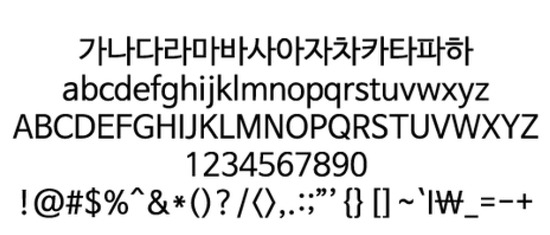
Figure 5.
Nanum-Bareun Gothic.
Figure 5.
Nanum-Bareun Gothic.

Survey of subjective symptoms
The survey comprised six items(dizzy, diplopia, definition, legibility, discomfort, ocular fatigue), and each was scored in accordance with the level of awareness using a 4-point Likert scale: “strongly disagree” 0 point, “disagree” 1 point, “neither agree nor disagree” 2 points, “agree” 3 points, and “strongly agree” 4 points. The survey was conducted twice, once after the DEM test and once after the VHD test.
Data analysis
For data analysis, a paired t-test, independent t-test, and simple correlation analysis were performed using the SPSS software (ver. 18.0 for Windows, SPSS Inc., Chicago, IL, USA). A parametric analysis was used for above 30 people and non-parametric analysis was used for below 30 people. A value of p<0.05 with 95% confidence intervals was taken to indicate significance.
Results
Near point test
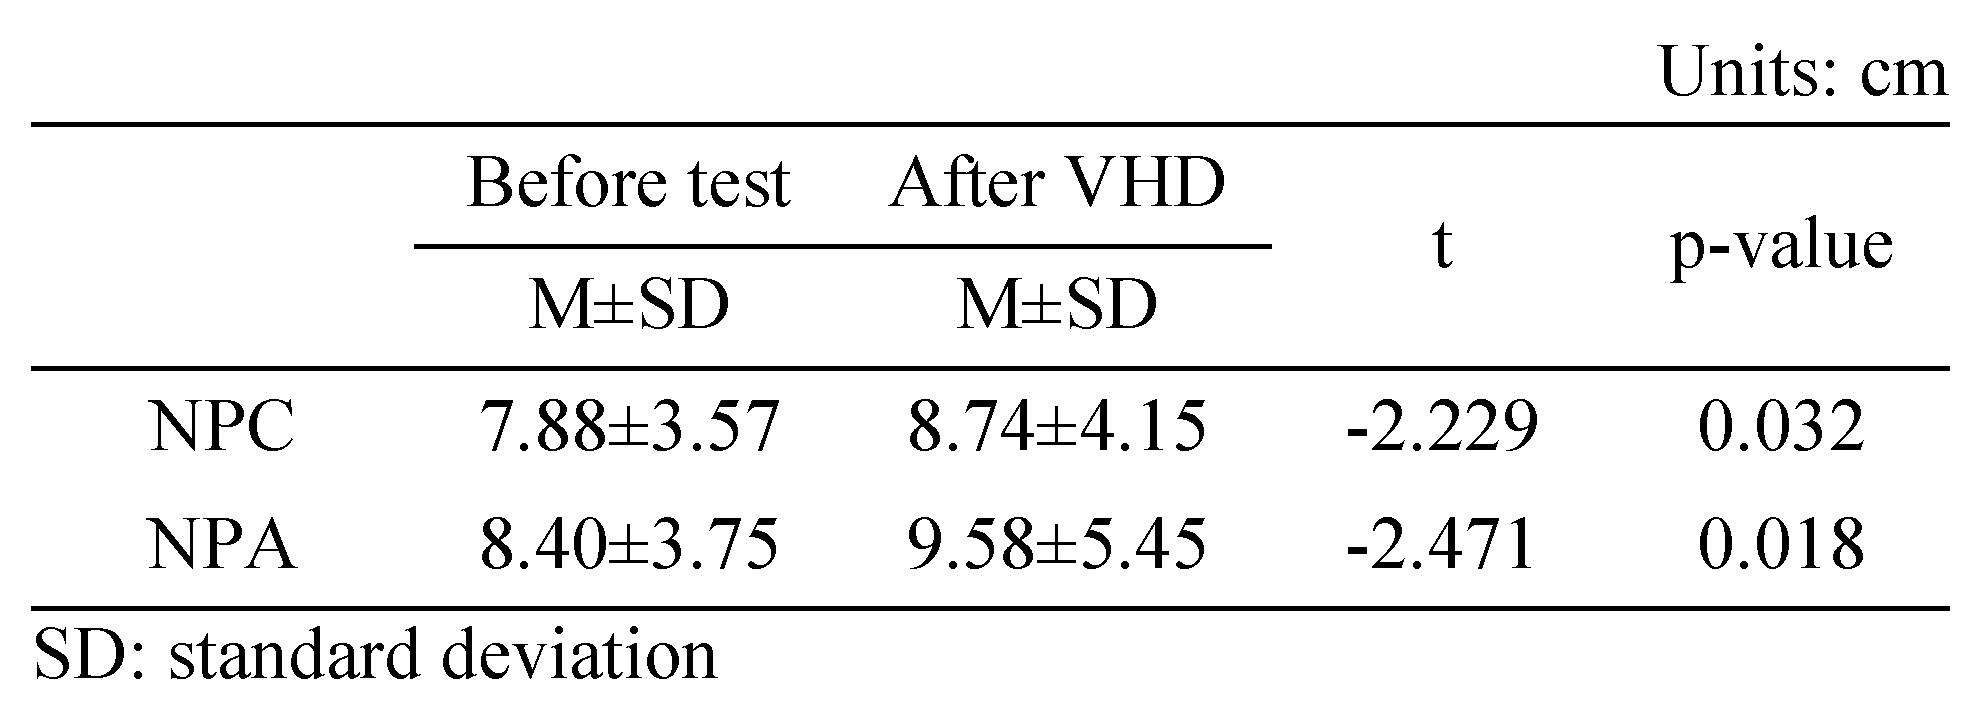
Change in NPC
Table 2 shows the results of the push-up method before and immediately after the VHD test of NPC. For NPC, convergence ability was significantly lower before (7.88±3.57 cm) compared to after (8.74±4.15 cm) the VHD test.

Table 2.
Near point change after VHD test.
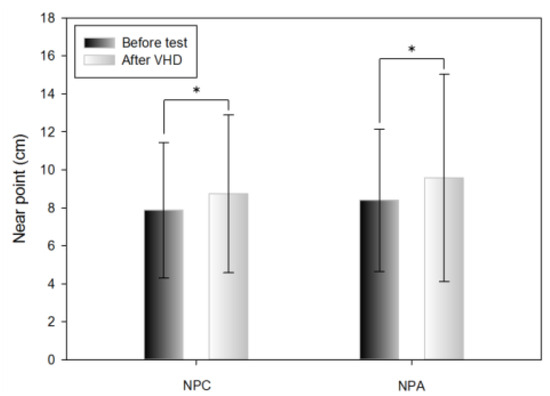
Figure 6.
Near point change after VHD test (*: p<0.05).
Figure 6.
Near point change after VHD test (*: p<0.05).
Change in NPA
Table 2 shows the results of the push-up method before and immediately after the VHD test of NPA. The amplitude of accommodation was significantly lower before (8.40±3.75 cm) compared to after (9.58±5.45 cm) the VHD test.
Phoria test
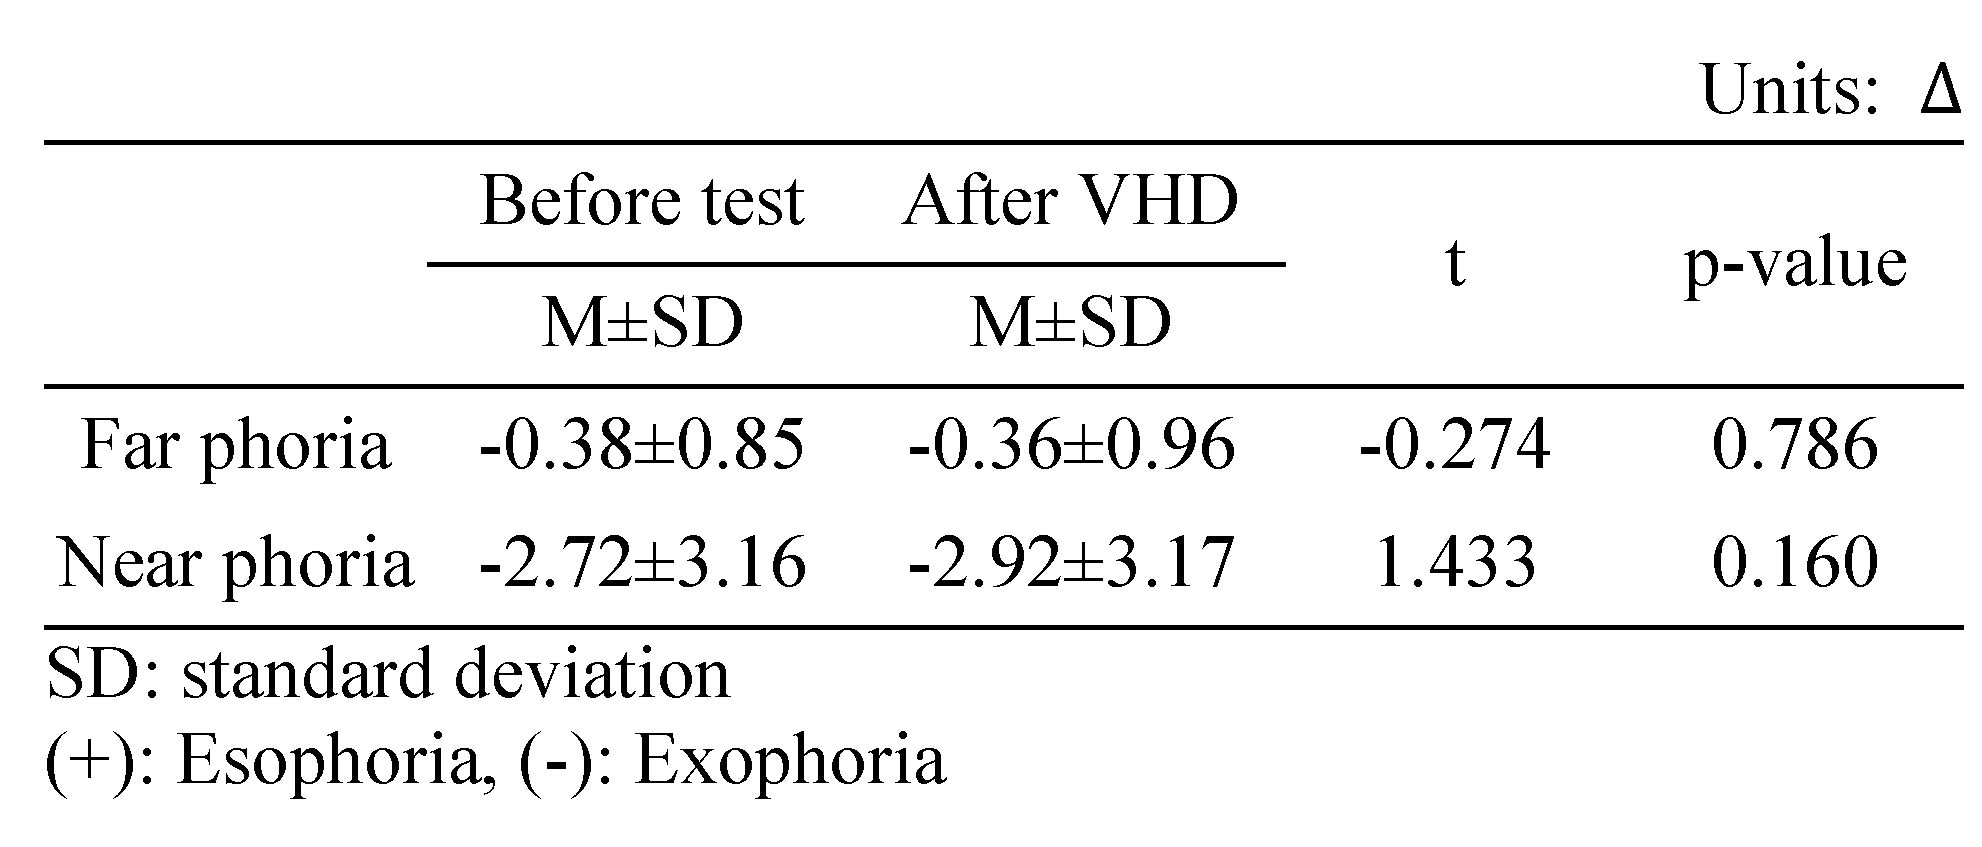
Change in horizontal far phoria
The Howell horizontal far phoria results did not differ significantly before and immediately after the VHD test (exo 0.38±0.85 △ and exo 0.36±0.96 △, respectively) (Table 3).
Table 3.
Changes in far and near phoria after the VHD test.
Change in the horizontal near phoria
The Howell horizontal near phoria results exhibited tendency to increase before and immediately after the VHD test,; however, the difference was not significant (exo 2.72±3.16 △ and exo 2.92±3.17 △, respectively) (Table 3).
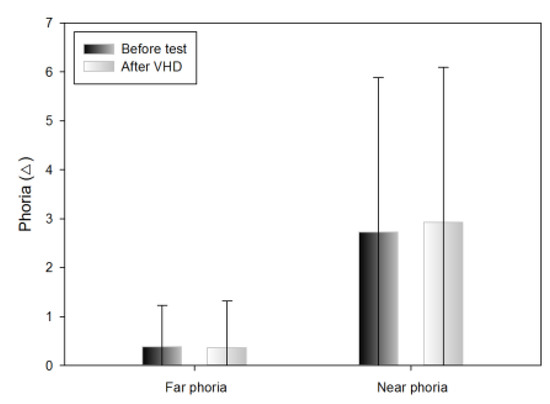
Figure 7.
Changes in far and near phoria after the VHD test (*: p<0.05).
Figure 7.
Changes in far and near phoria after the VHD test (*: p<0.05).
Subjective symptoms
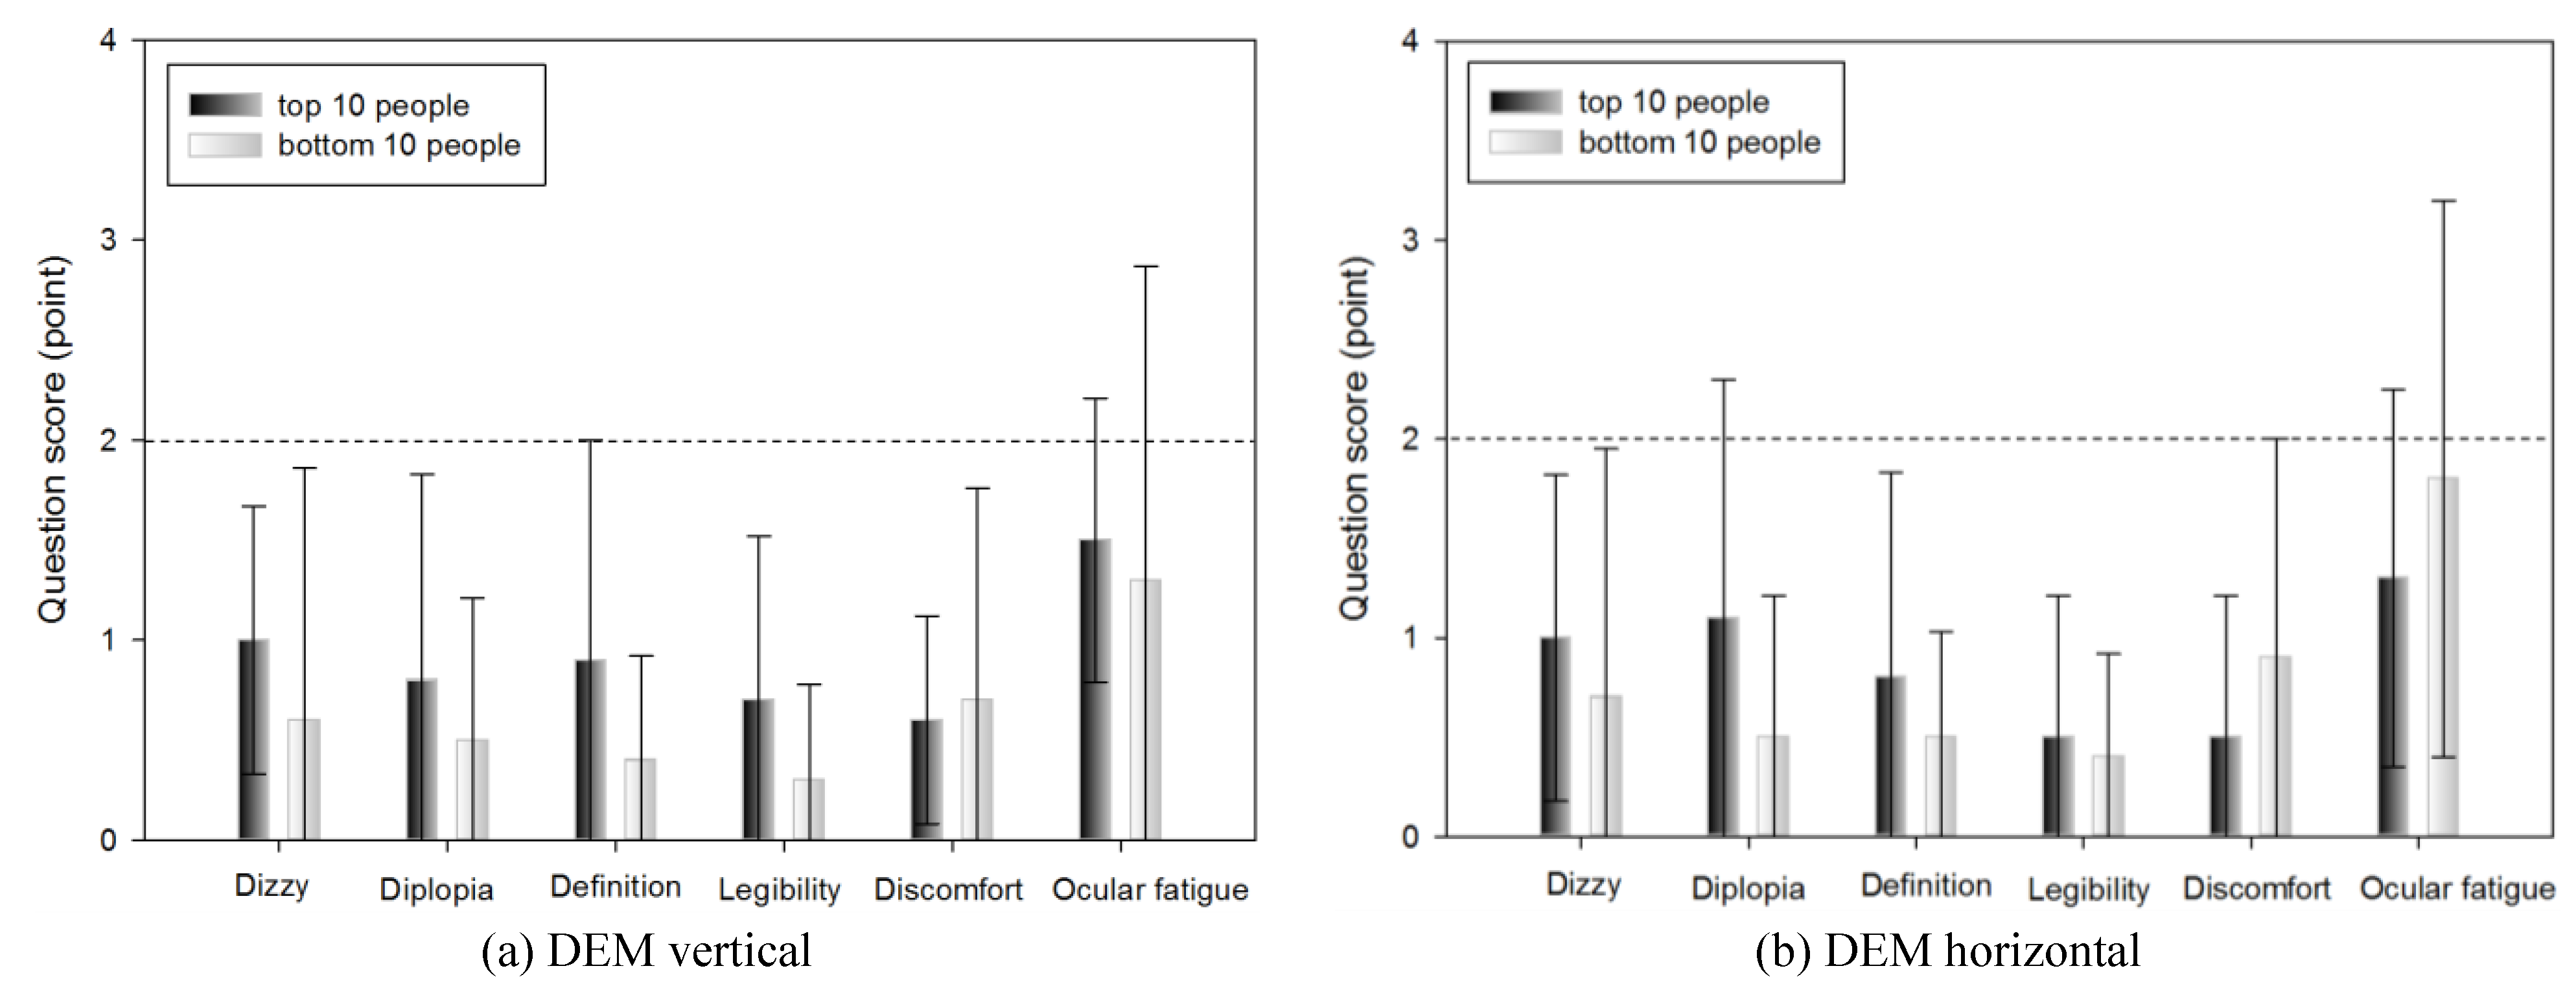
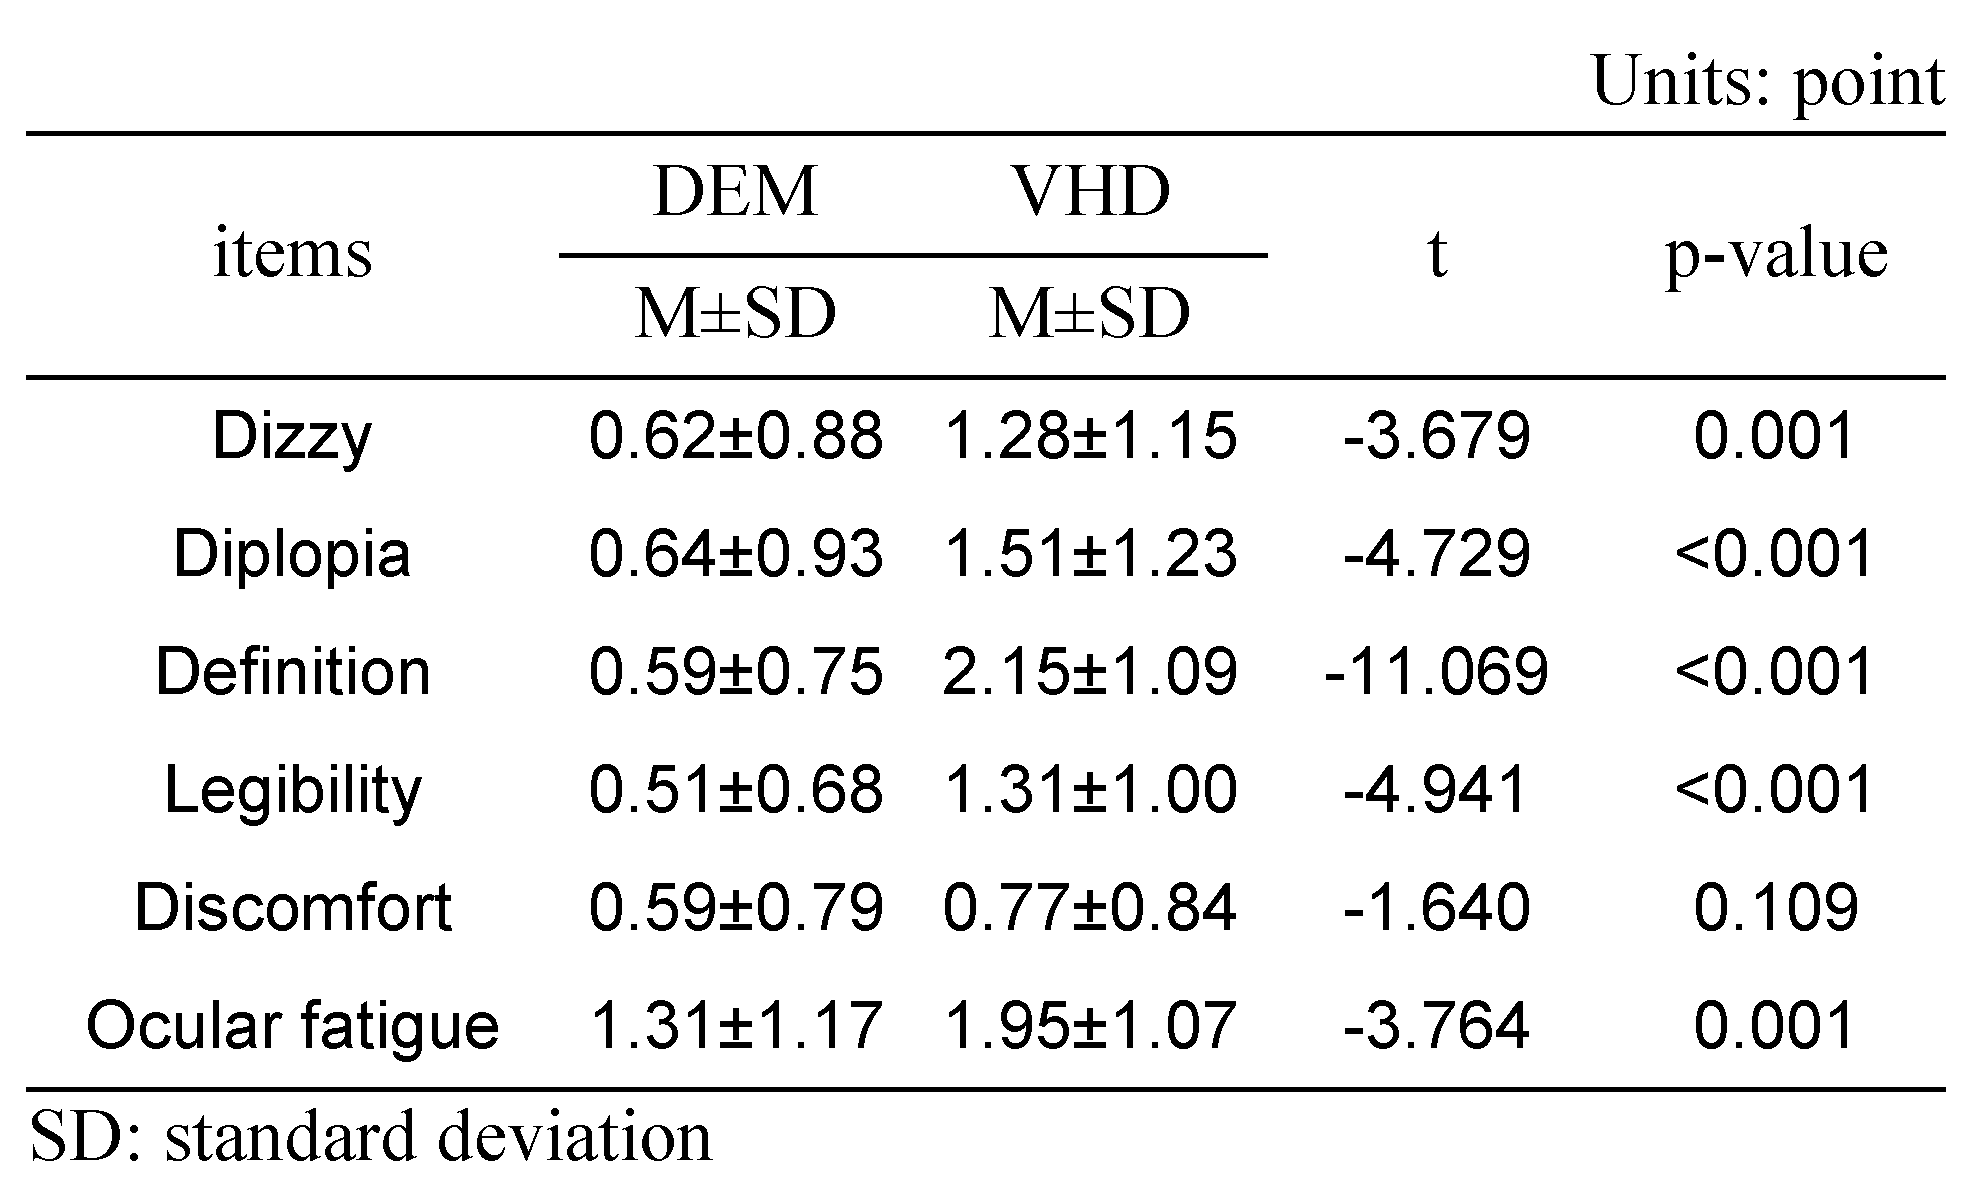
A subjective symptom survey was carried out immediately after the DEM test and the VHD test, which comprised: dizziness, diplopia, inappropriate definition of the screen, difficulty reading the sign, physical and psychological discomfort, and ocular fatigue.
Dizziness was greater immediately after the VHD test than immediately after the DEM test (0.62±0.88 and 1.28±1.15 points, respectively).
Diplopia was more evident immediately after the VHD test than immediately after the DEM test (0.64±0.93 and 1.51±1.23 points, respectively).
Chart definition was worse immediately after the VHD test than immediately after the DEM test (0.59±0.75 and 2.15±1.09 points, respectively).
Legibility was greater immediately after the VHD test than immediately after the DEM test (0.51±0.68 and 1.31±1.00 points, respectively).
Physical and psychological discomfort was greater immediately after the VHD test than immediately after the DEM test (0.59±0.79 and 0.77±0.84 points, respectively).
Ocular fatigue was greater immediately after the VHD test than immediately after the DEM test (1.31±1.17 and 1.95±1.07 points, respectively).
With the exception of physical and psychological discomfort, statistical significance was evident in all questions.
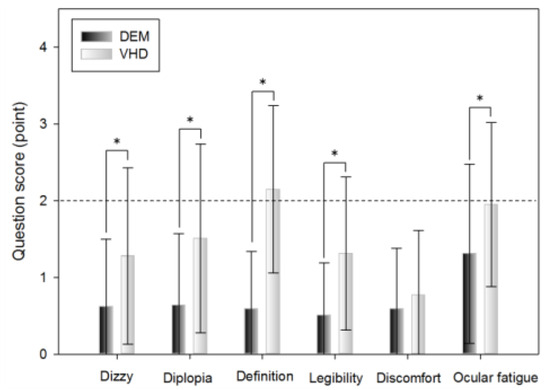
Figure 8.
Subjective symptoms (*: p<0.05).
Figure 8.
Subjective symptoms (*: p<0.05).
DEM and VHD
DEM
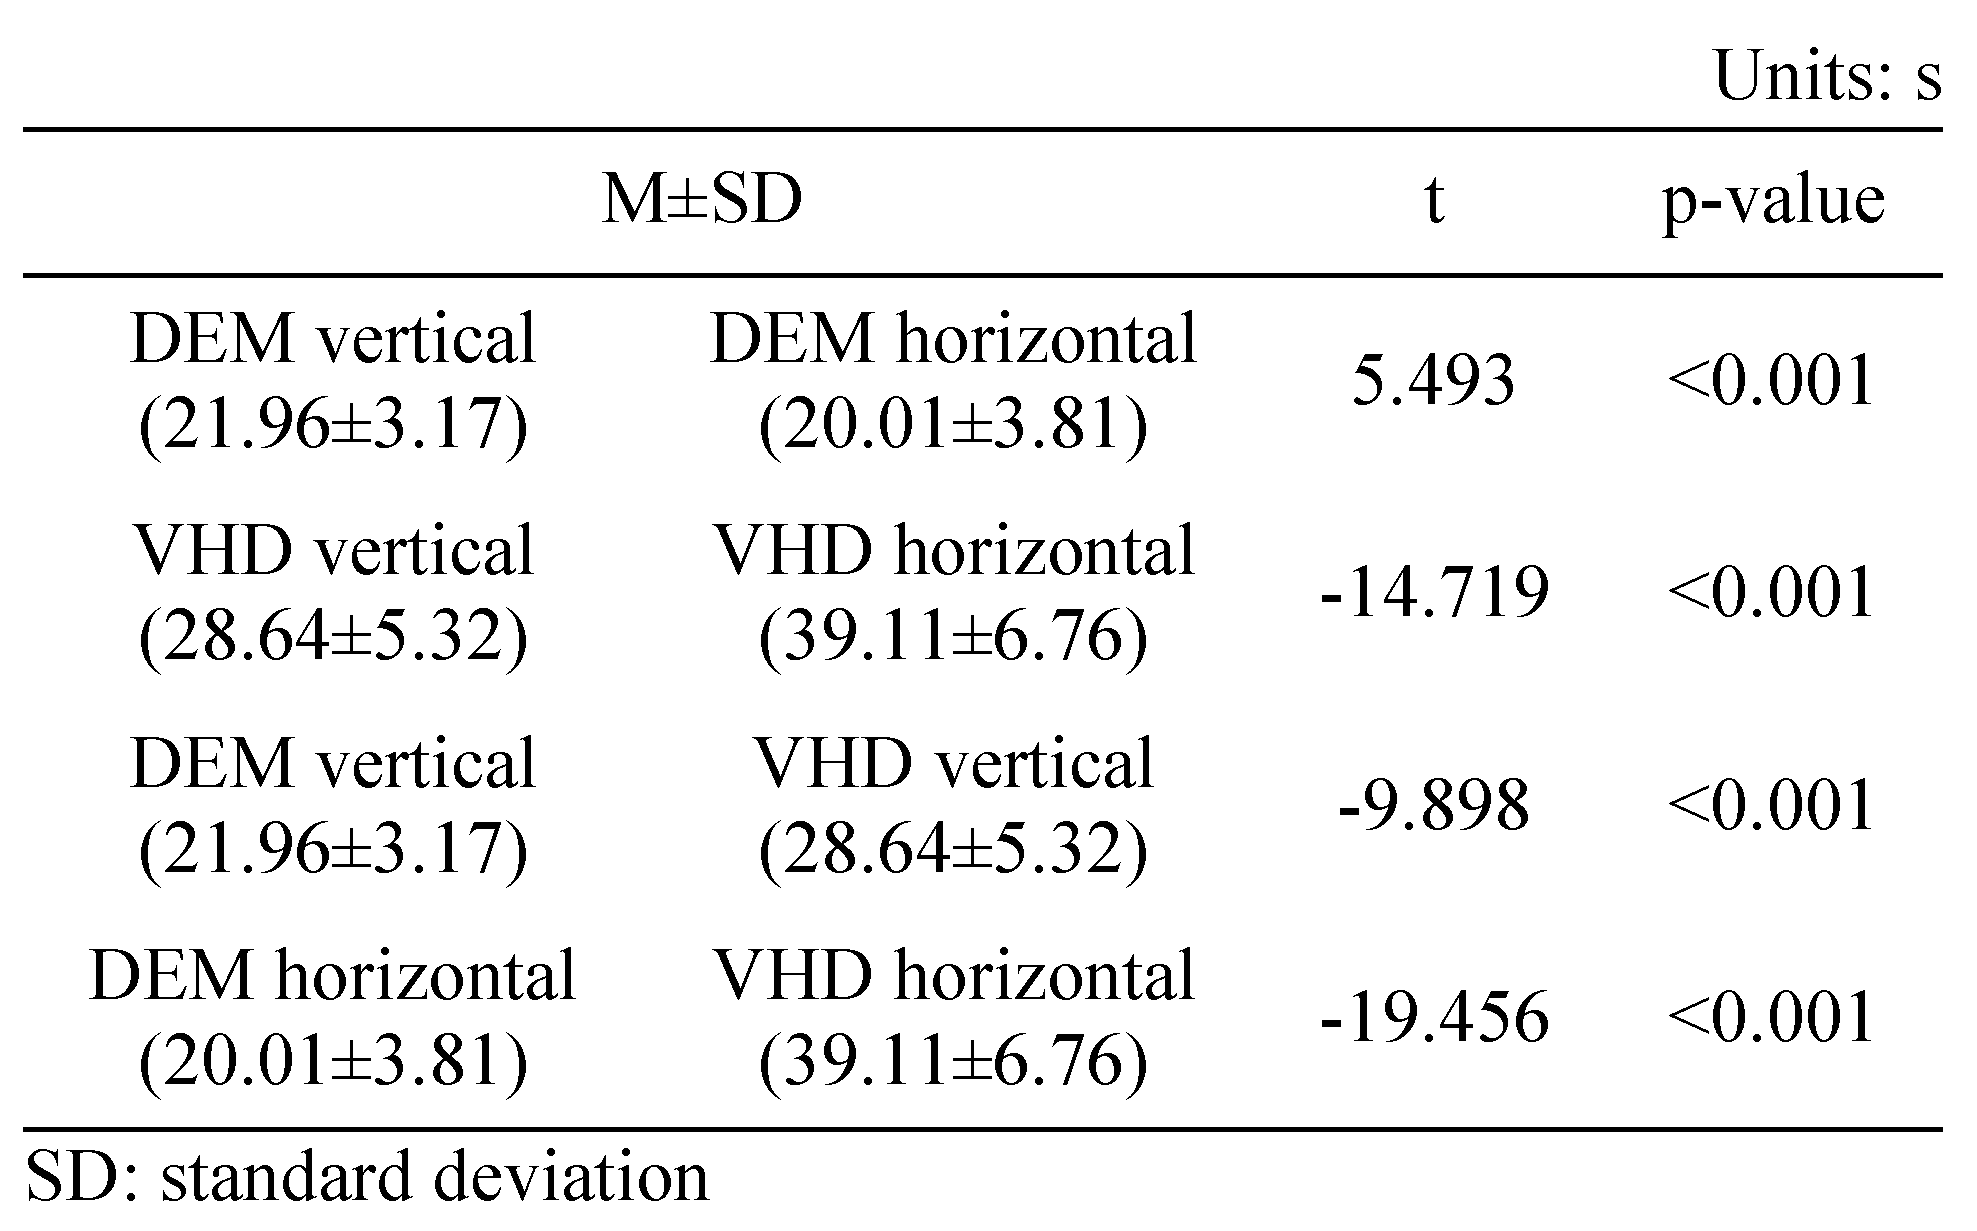
Table 5 shows the results of the vertical (Tests A, B) and horizontal (Test C) tests using the DEM chart. Horizontal movement was significantly faster than vertical movement (21.96±3.17 and 20.01±3.81 s, respectively).
Table 5.
Comparison of DEM and VHD.
VHD
Table 5 shows the results of the vertical (Test A, B) test and horizontal (Test C) tests using the VHD chart. Vertical movement was significantly faster than horizontal movement (28.64±5.32 and 39.11±6.76 s, respectively).
Comparison of DEM and VHD
Table 5 shows the vertical (Test A, B) and horizontal (Test C) test results using the DEM and VHD charts. The VHD measurement of vertical movement was significantly slower than the DEM measurement value (21.96±3.17 and 28.64±5.32 s, respectively). The VHD measurement of horizontal movement was significantly slower than the DEM measurement (20.01±3.81 and 39.11±6.76 s, respectively).
Correlation analysis of DEM and VHD
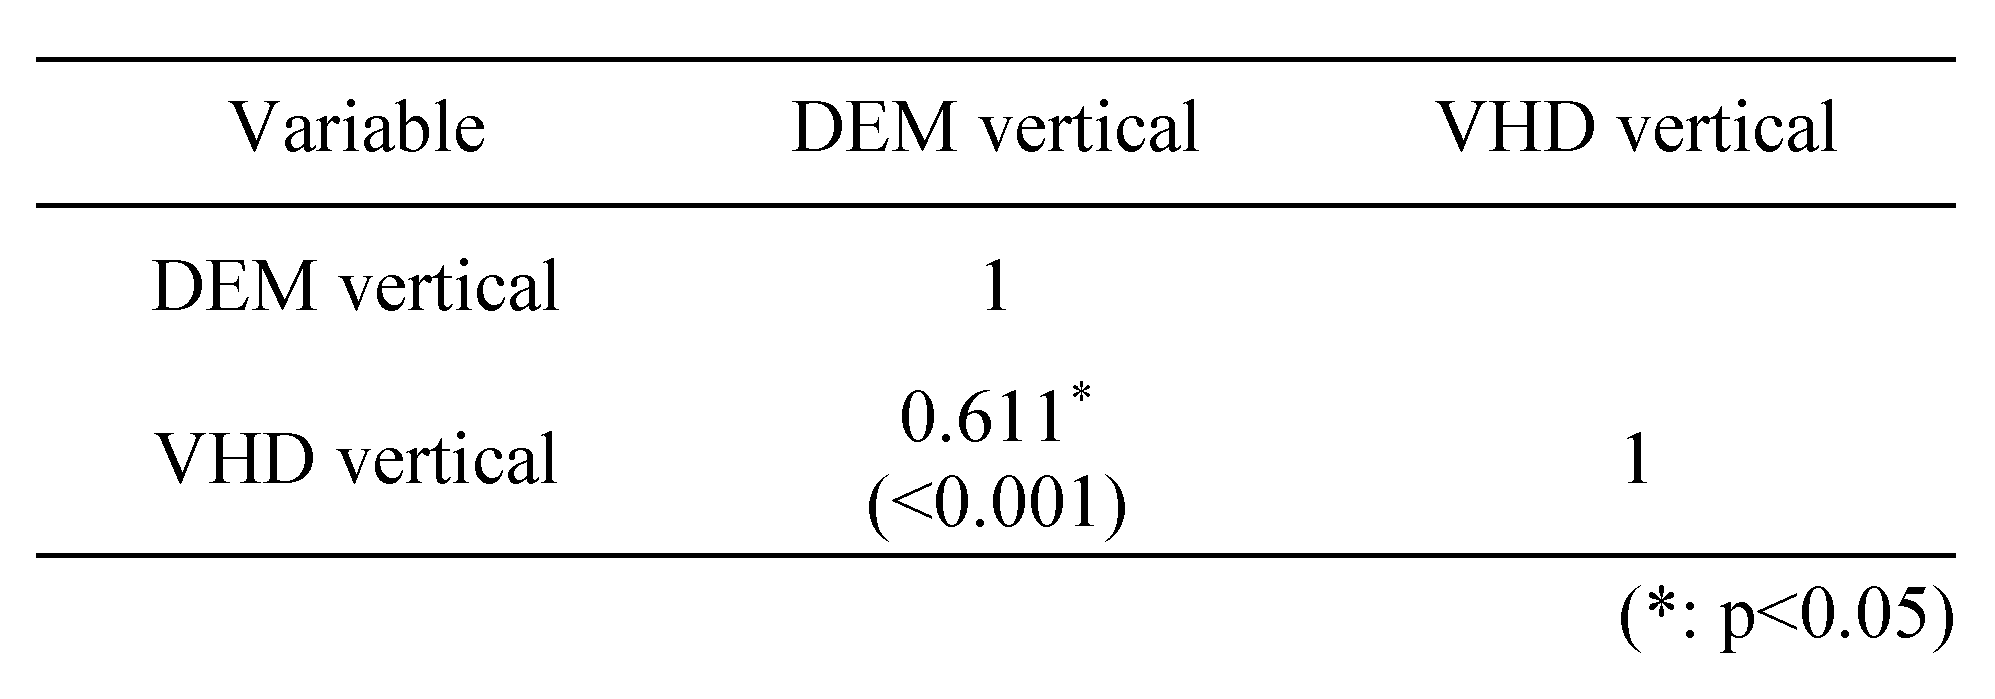
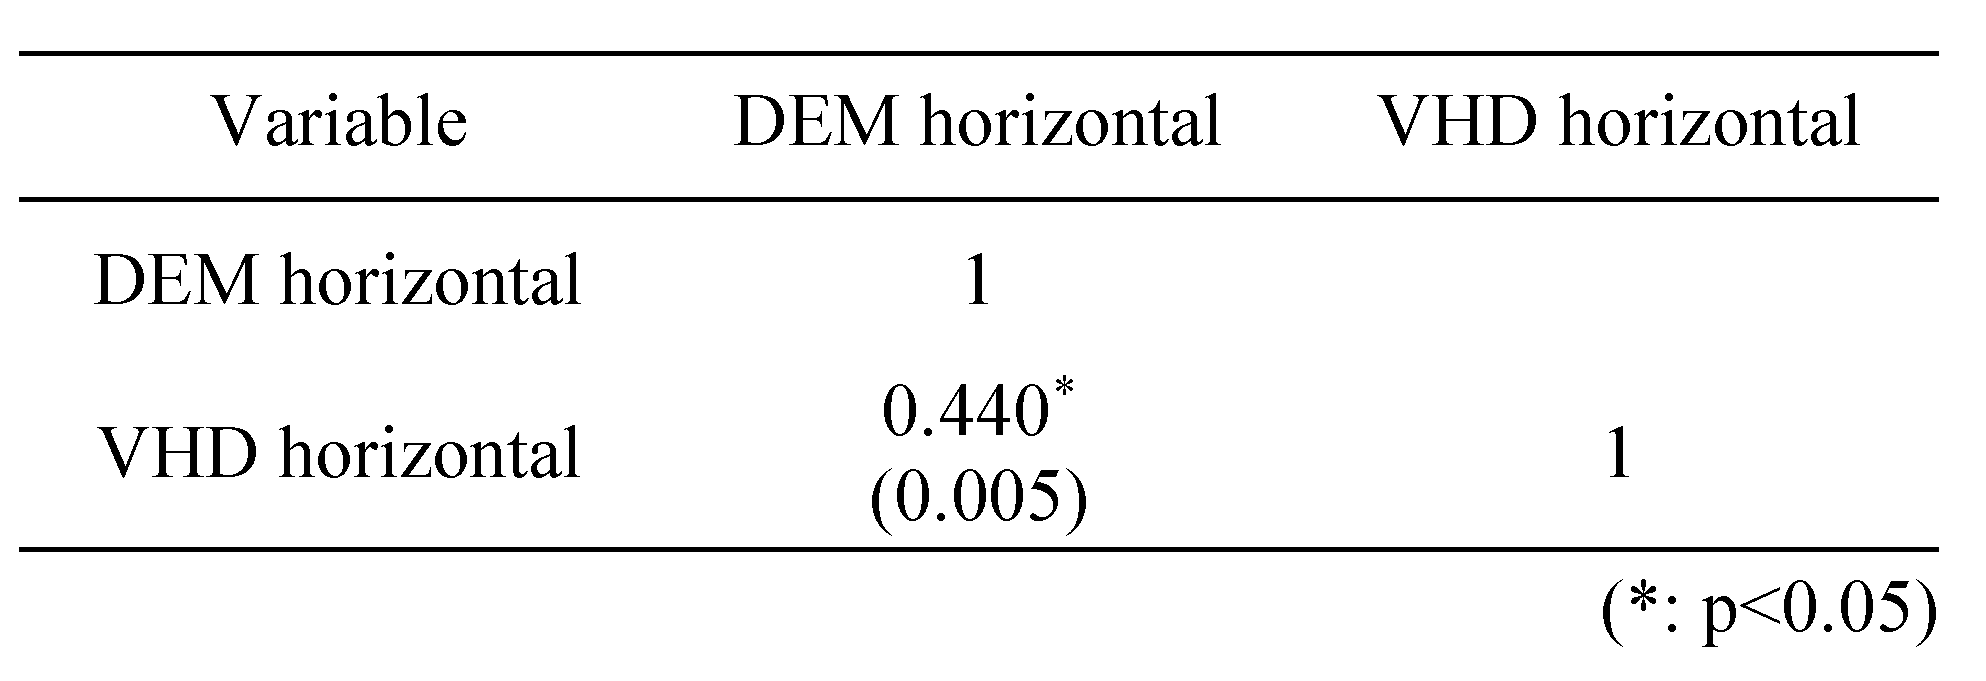
Table 6 shows a correlation analysis of the vertical (Test A, B) test using the DEM and VHD charts; a strong positive(+) correlation (0.7≥r≥0.3) was evident. Table 7 shows a correlation analysis of the horizontal (Test C) test using the DEM and VHD charts; a strong positive(+) correlation (0.7≥r≥0.3) was evident.
Table 6.
Correlation between DEM and VHD in the vertical test.
Table 7.
Correlation between DEM and VHD in the horizontal test.
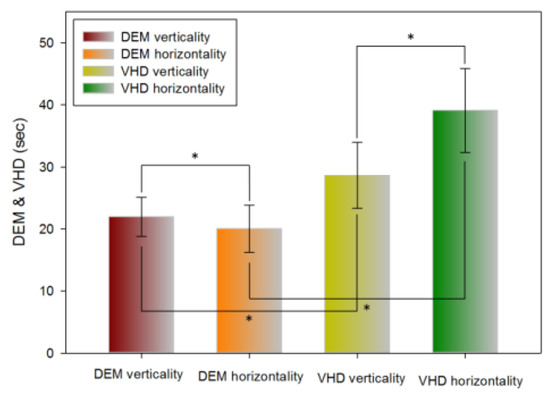
Figure 9.
Comparison of DEM and VHD results (*: p<0.05).
Figure 9.
Comparison of DEM and VHD results (*: p<0.05).

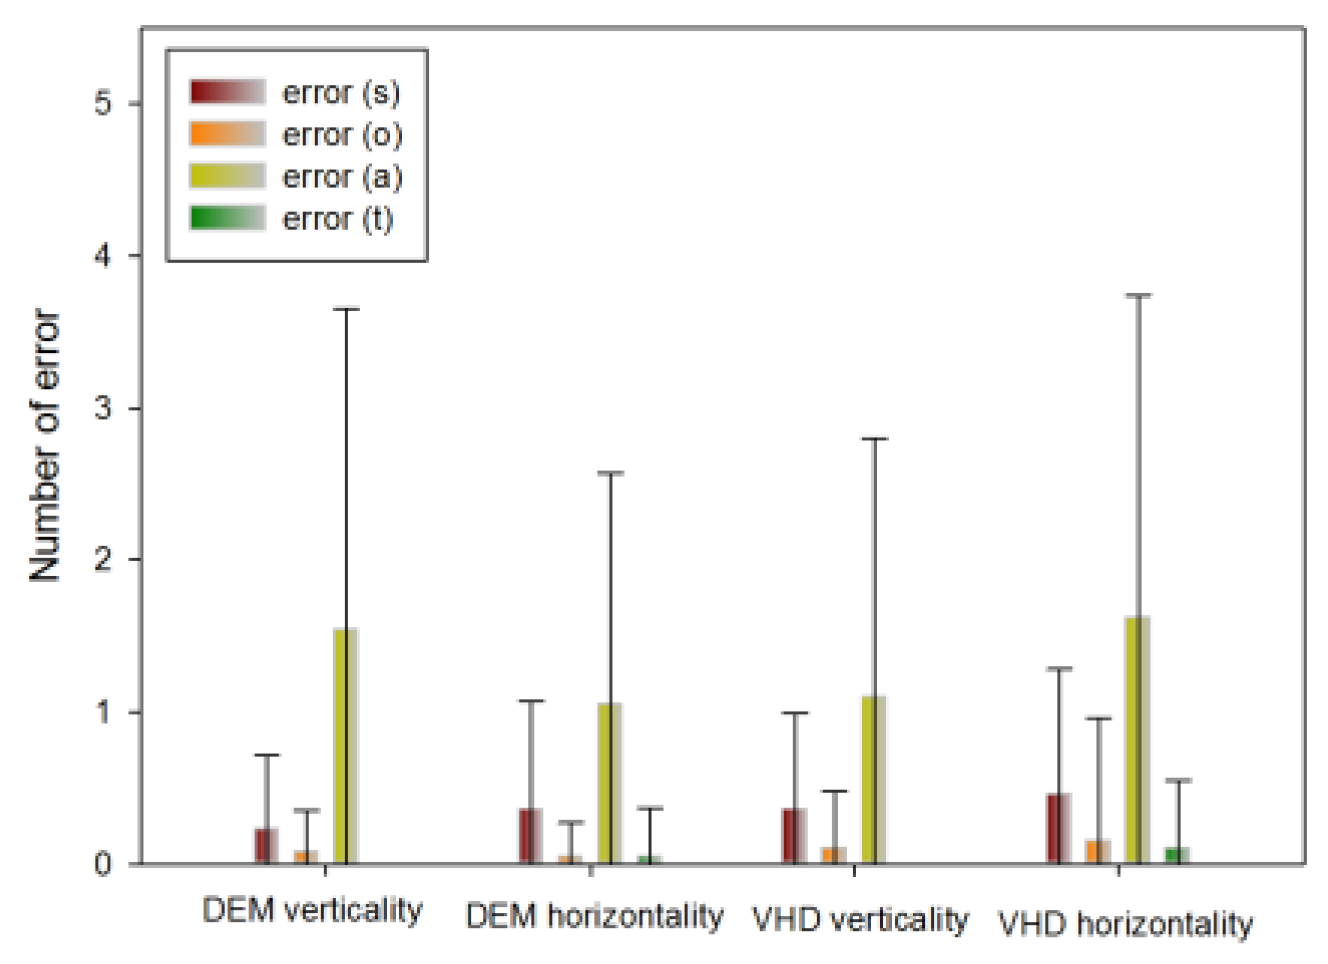
Error frequency comparison of each type between DEM and VHD
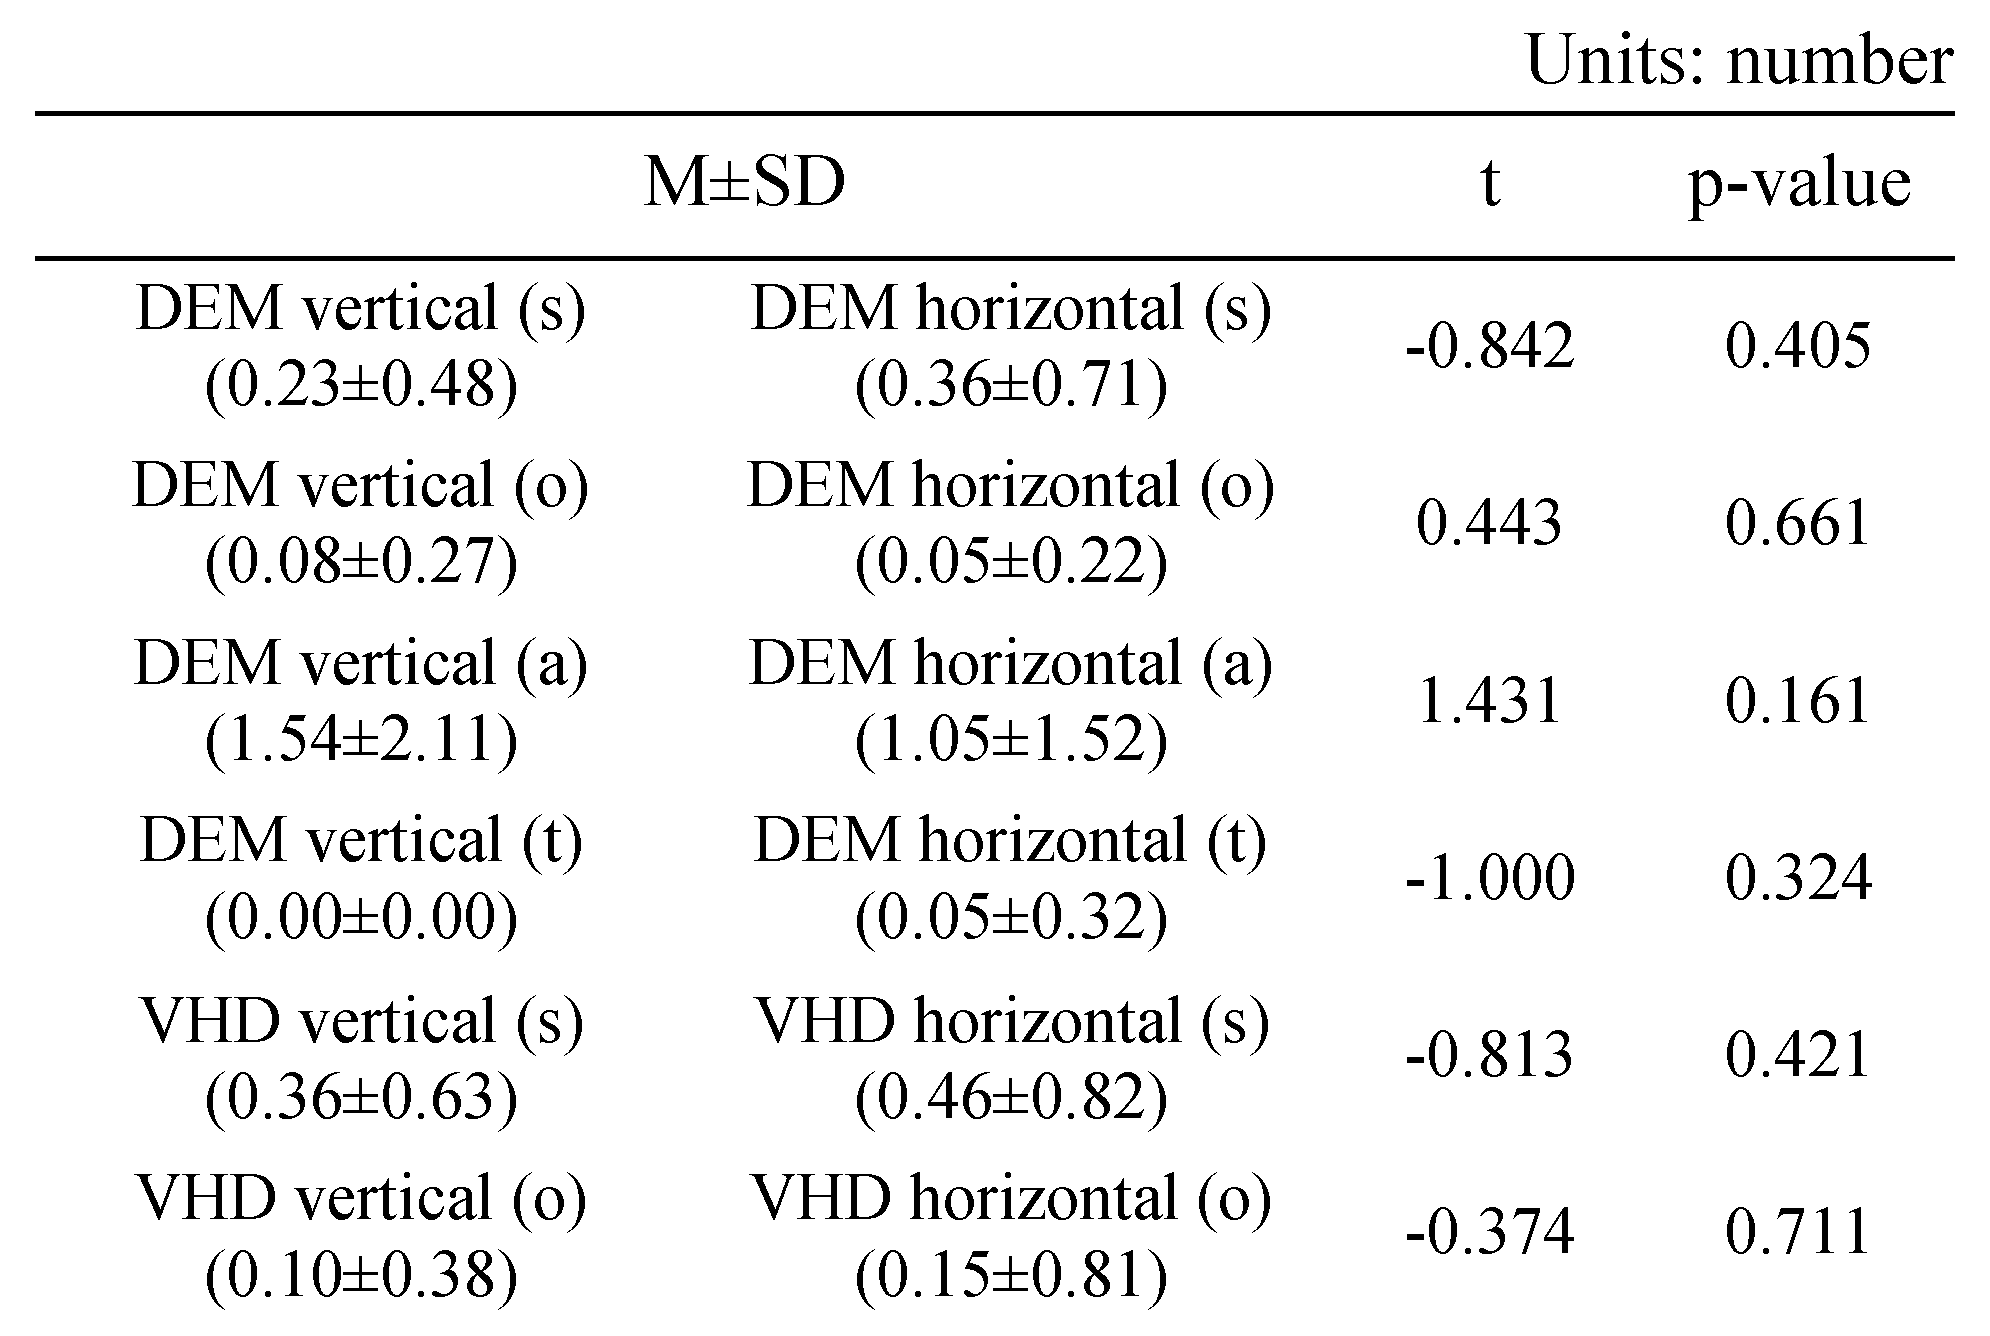
Table 8 shows the errors of the DEM and VHD tests.
Table 8.
Comparison of errors in DEM and VHD.
In the DEM vertical (Test A, B) test, the following number of errors occurred: s error (0.23±0.48), o error (0.08±0.27), a error (1.54±2.11), t error (0.00±0.00).
In the DEM horizontal (Test C) test, the following number of errors occurred: s error (0.36±0.71), o error (0.05±0.22), a error(1.05±1.52), t error (0.05±0.32).
In the VHD vertical (Test A, B) test, the following number of errors occurred: s error (0.36±0.63), o error (0.10±0.38), a error (1.10±1.70), t error (0.00±0.00).
In the VHD horizontal (Test C) test, the following number of errors occurred: s error (0.46±0.82), o error (0.15±0.81), a error (1.62±2.12), t error (0.10±0.45).
There was no significant difference in errors between DEM and VHD, or in the rate of occurrence of each error.
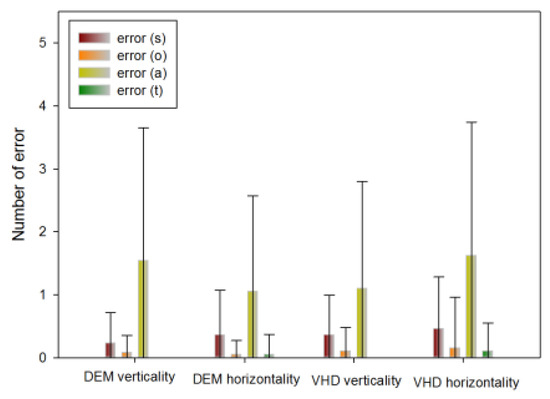
Figure 10.
Error occurrence in DEM and VHD(*: p<0.05).
Figure 10.
Error occurrence in DEM and VHD(*: p<0.05).
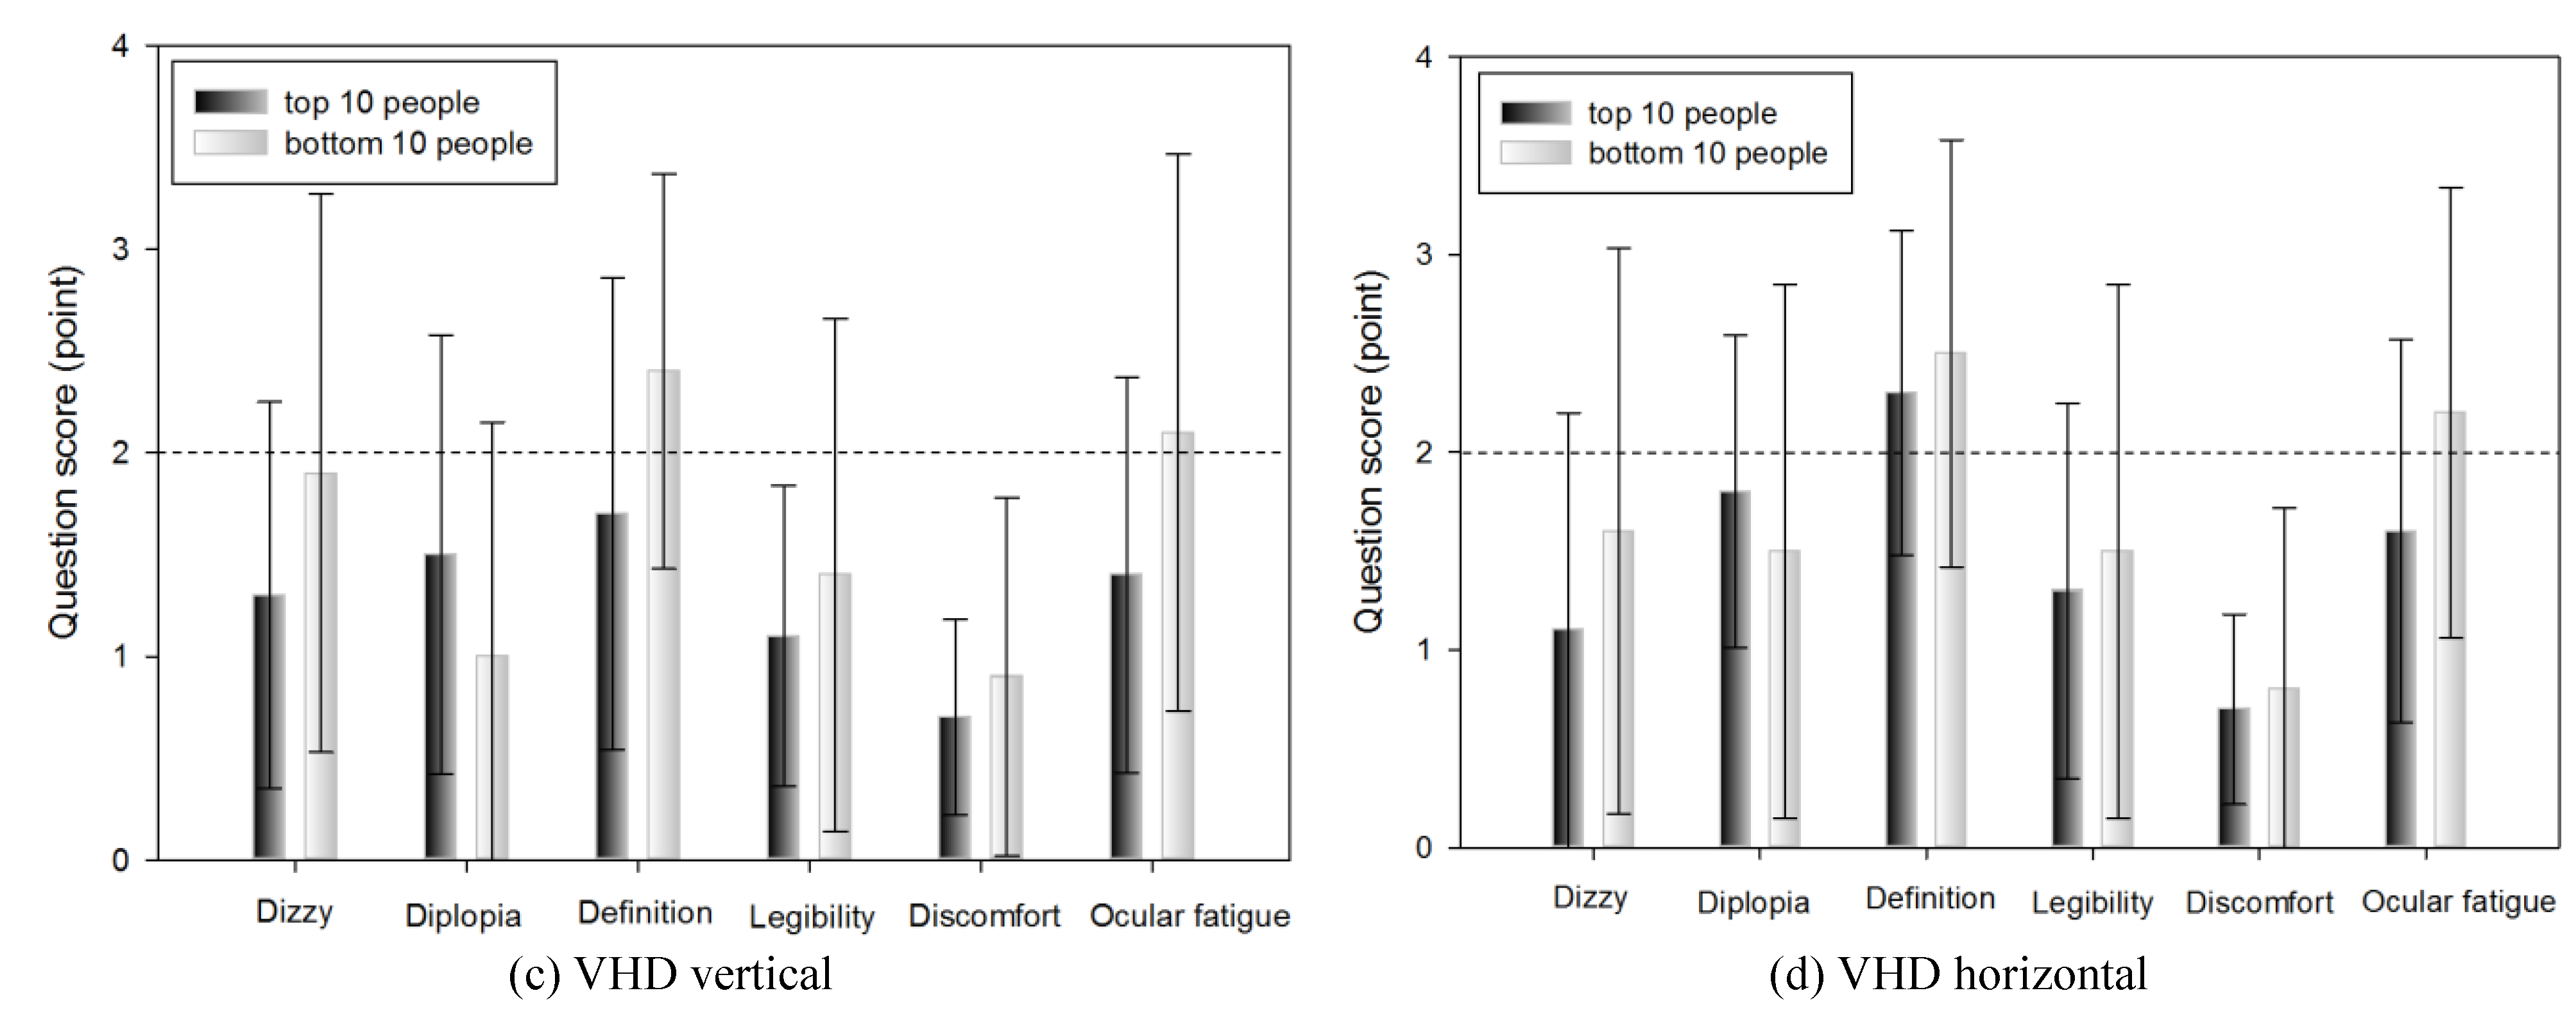
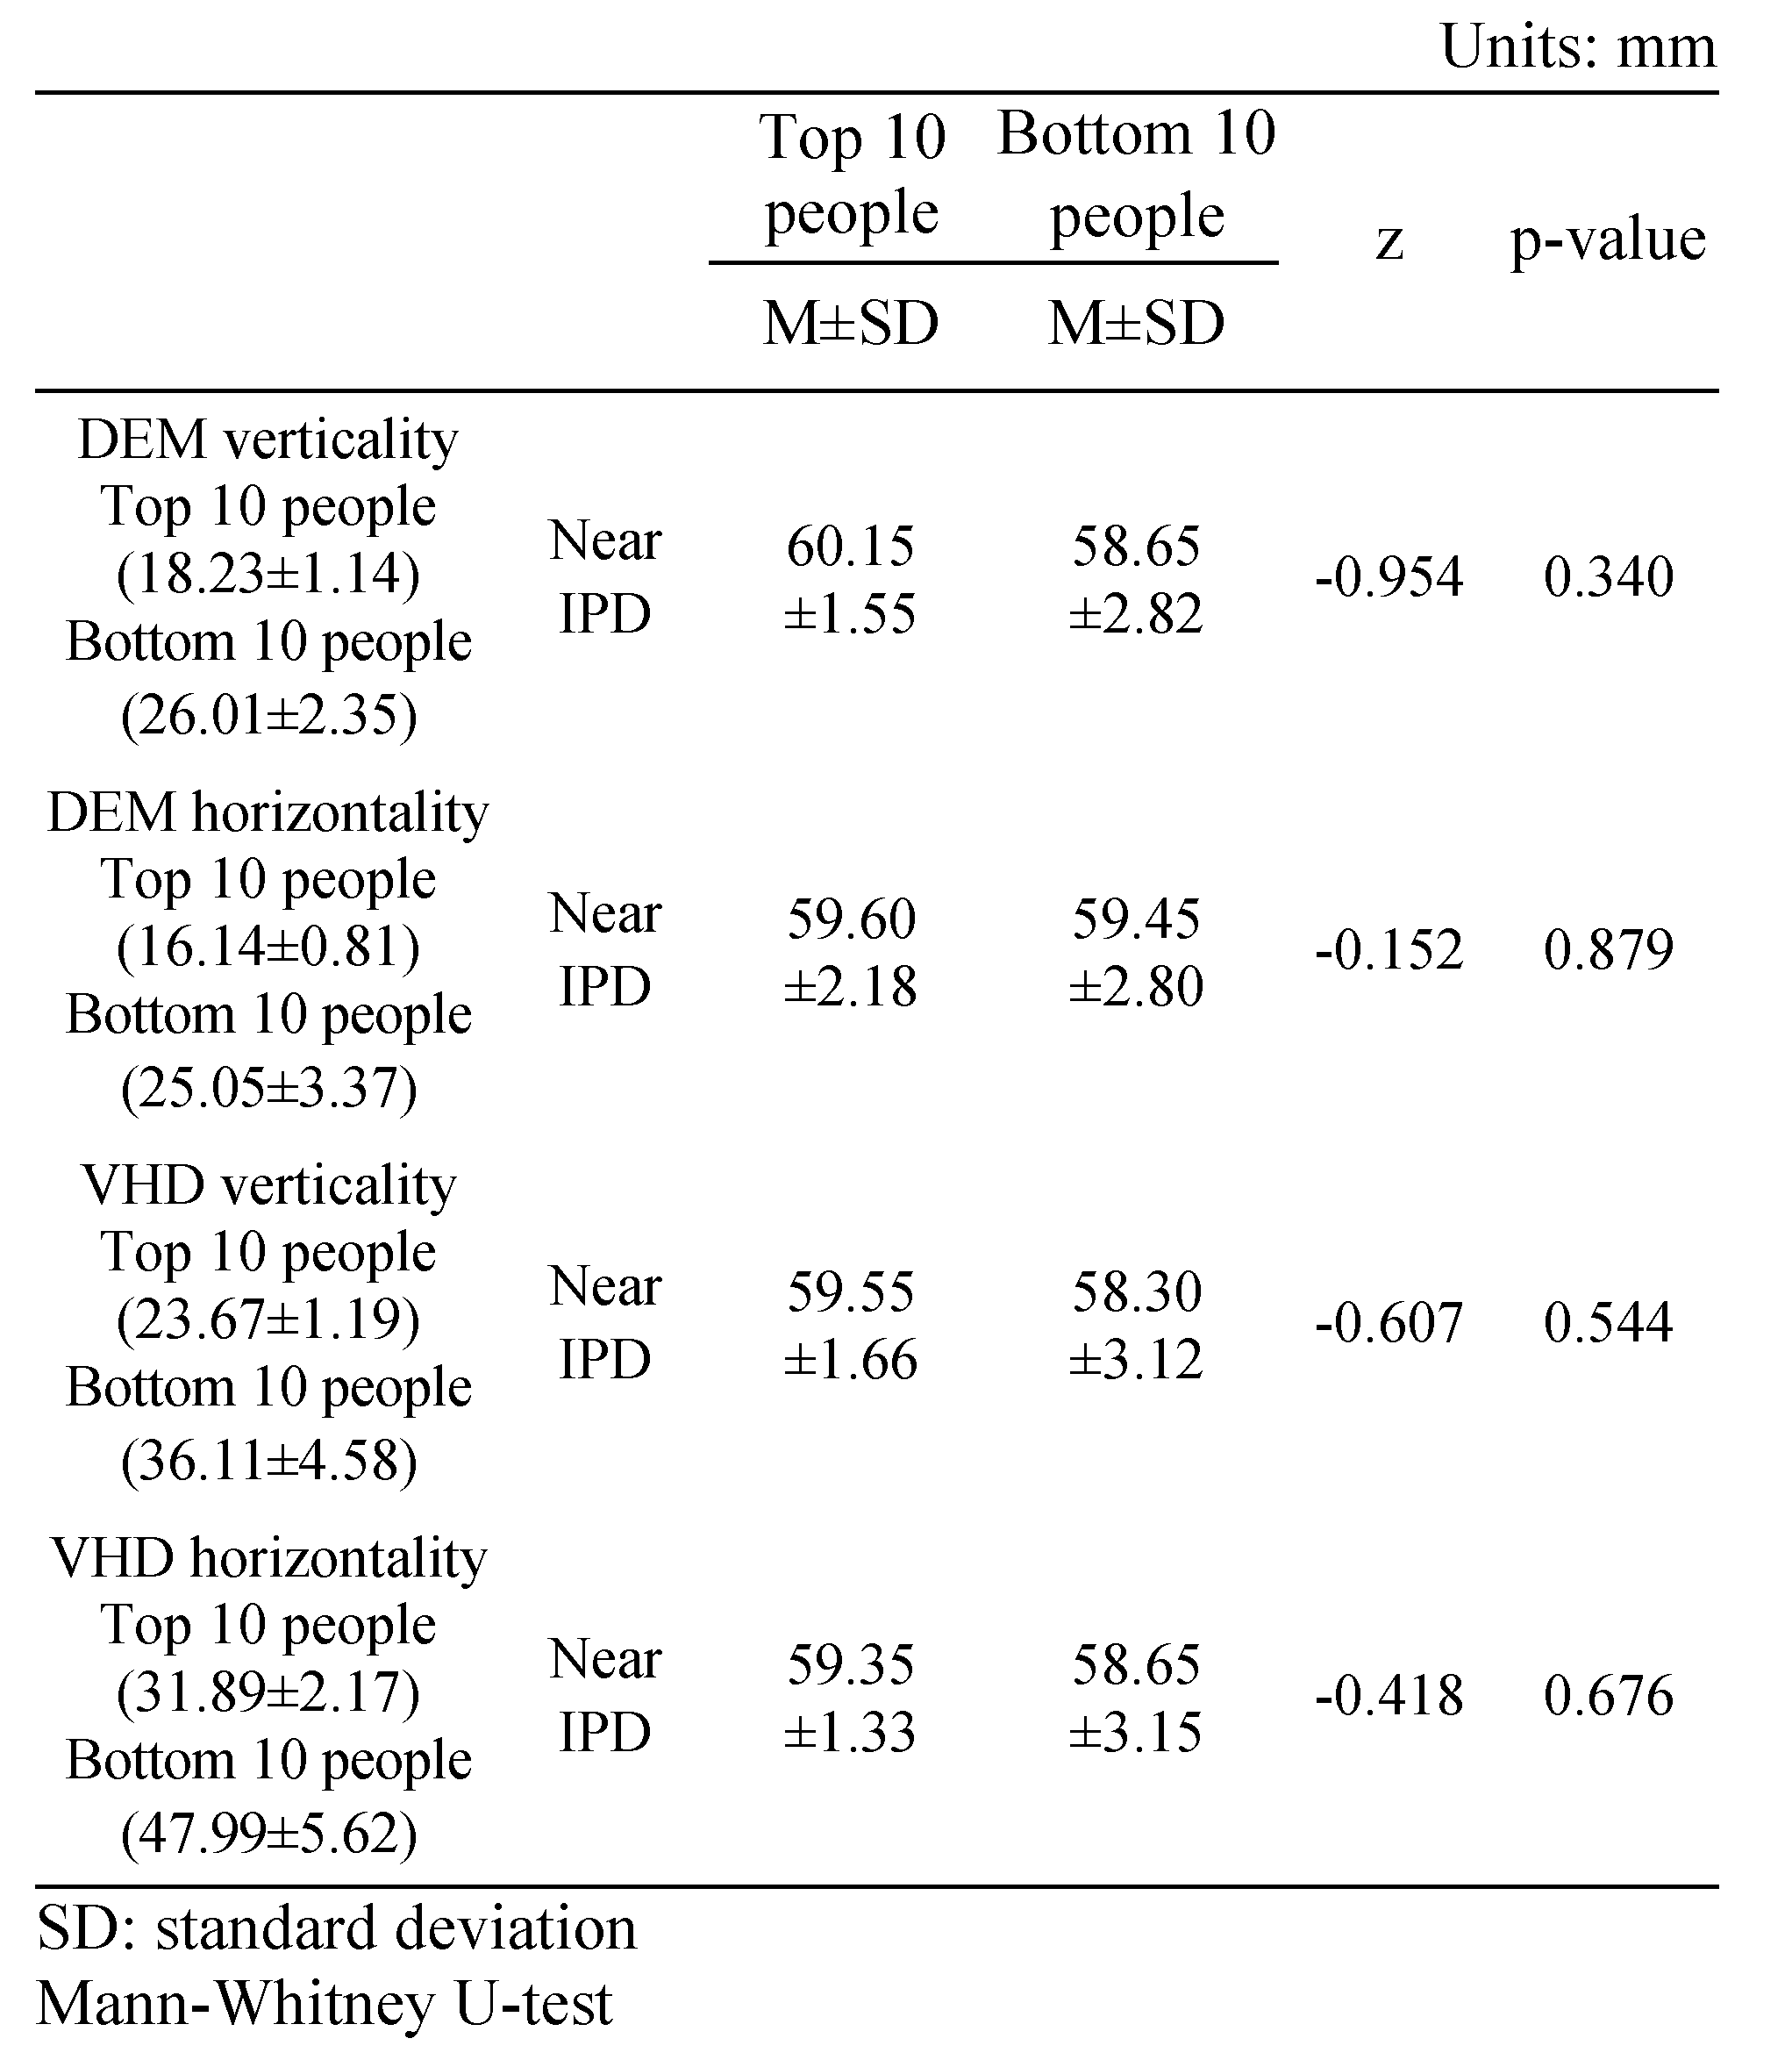
Near IPD of the top 10 and bottom 10 people by DEM and VHD test
Table 9 shows the near IPD measurements of the top 10 people (18.23±1.14 s) and bottom 10 people (26.01±2.35 s) in the DEM vertical test; no statistically significant difference was evident (60.15±1.55 and 58.65±2.82 mm, respectively).
Table 9.
Near IPD of the top 10 and bottom 10 people in the DEM and VHD tests.
Table 9 shows the near IPD measurements of the top 10 (16.14±0.81 s) and bottom 10 (25.05±3.37 s) people in the DEM horizontal test; no statistically significant difference was evident (59.60±2.18 and 59.45±2.80 mm, respectively).
Table 9 shows the near IPD measurements of the top 10 (23.67±1.19 s) and bottom 10 (36.11±4.58 s) people in the VHD vertical test; no statistically significant difference was evident (59.55±1.66 and 58.30±3.12 mm respectively).
Table 9 shows the near IPD measurements of the top 10 (31.89±2.17 s) and bottom 10 (47.99±5.62 s) people in the VHD horizontal test; no statistically significant difference was evident (59.35±1.33 and 58.65±3.15 mm, respectively).
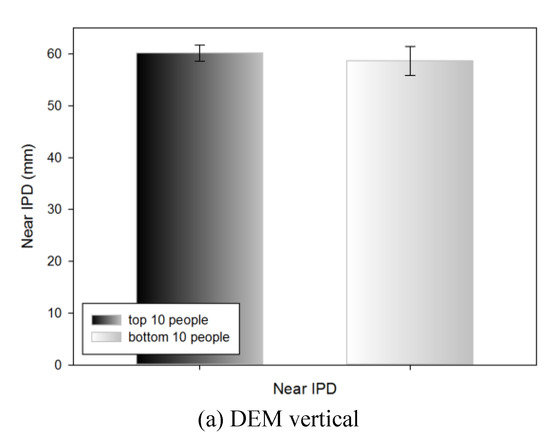
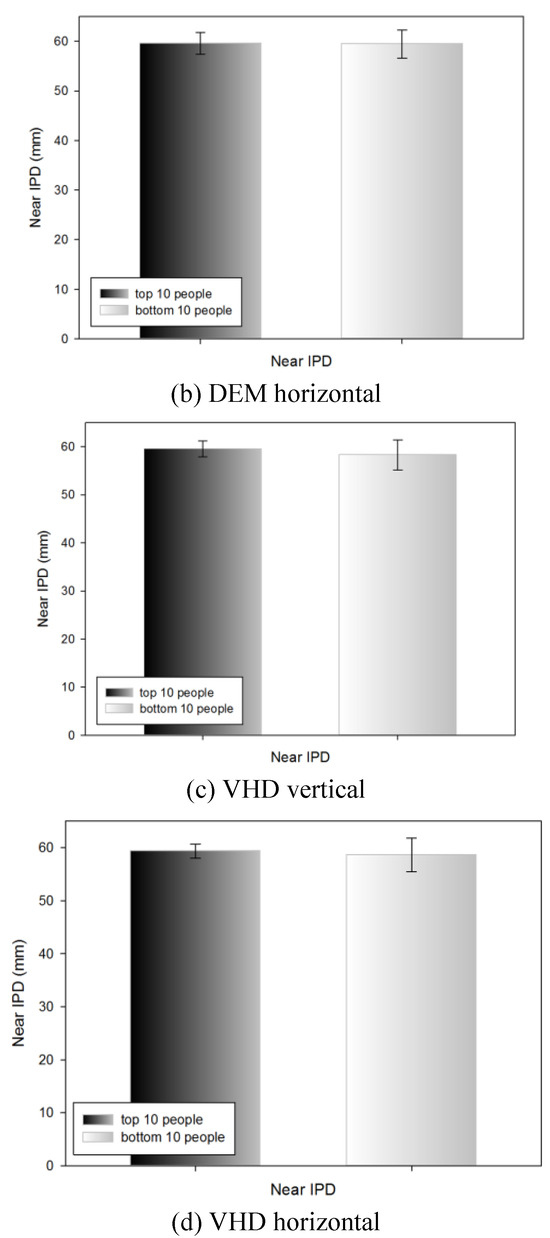
Figure 11.
Near IPD of the top 10 and bottom 10 people in the DEM and VHD tests (*: p<0.05).
Figure 11.
Near IPD of the top 10 and bottom 10 people in the DEM and VHD tests (*: p<0.05).

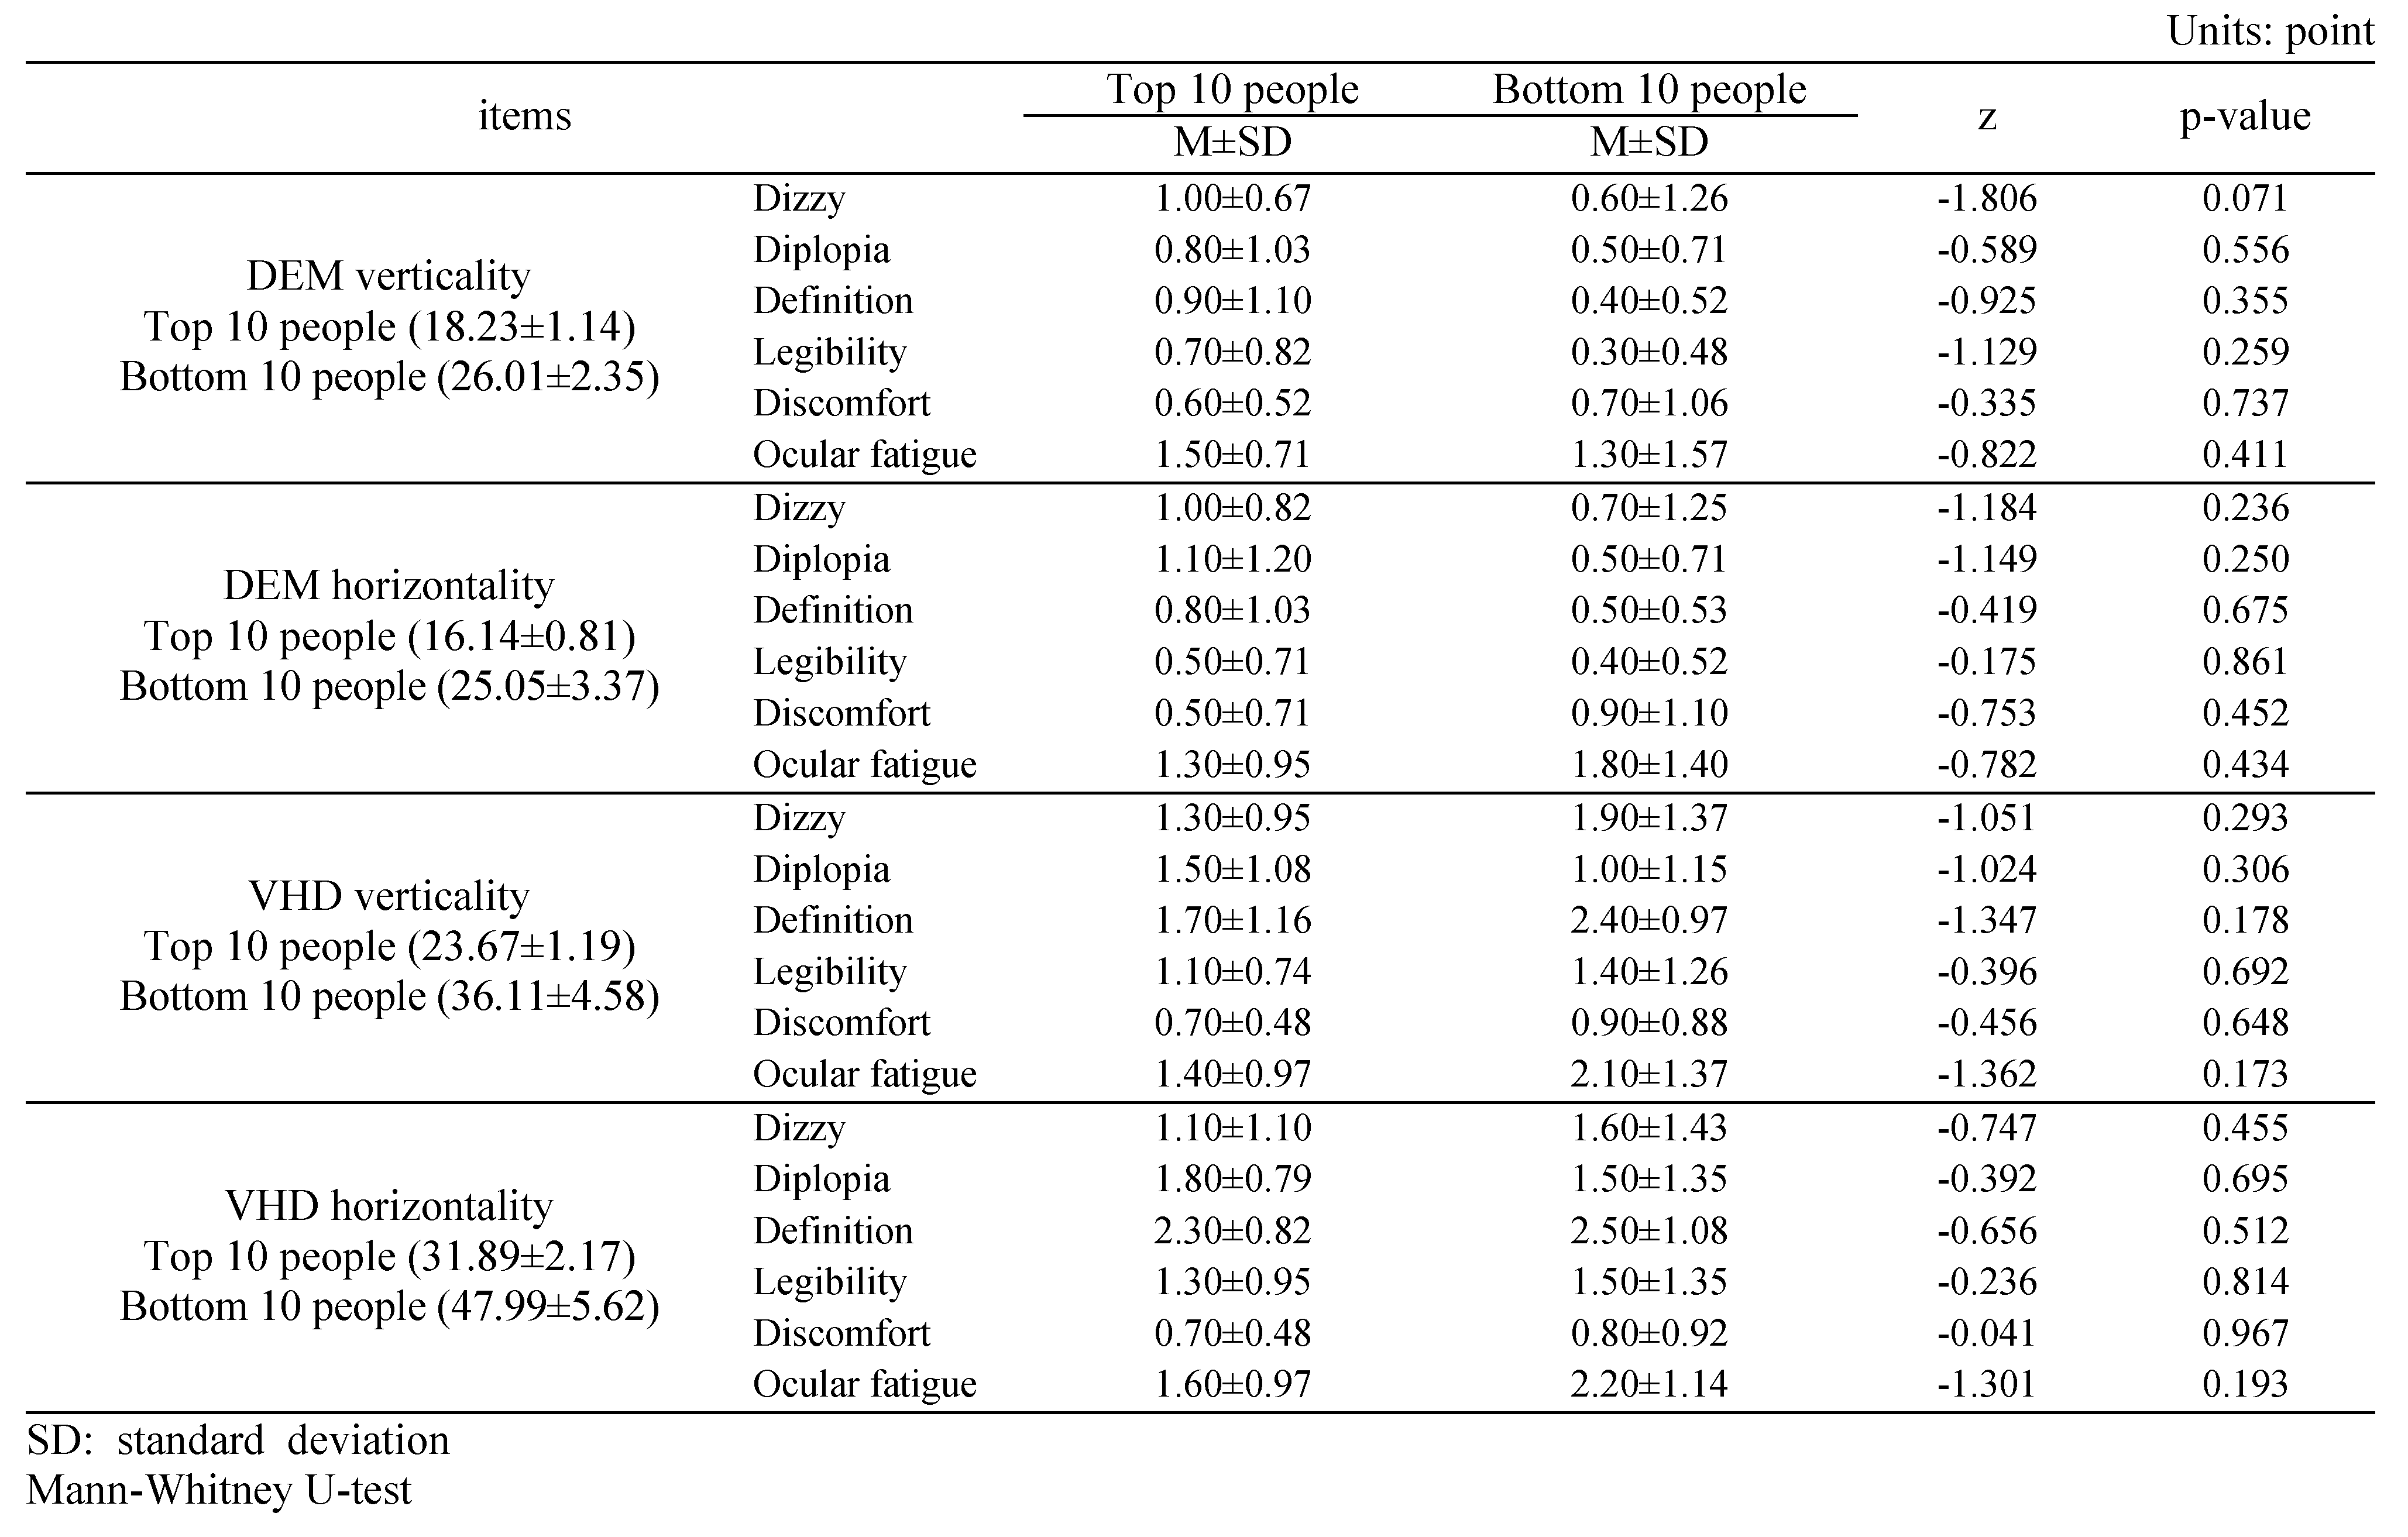
Subjective symptoms of the top 10 and bottom 10 people in DEM and VHD tests
Table 10 shows the subjective symptom survey scores of the top 10 (18.23±1.14 s) and bottom 10 people (26.01±2.35 s) in the DEM vertical test.
Table 10.
Subjective symptoms of the top 10 and bottom 10 people within DEM and VHD.
No significant difference was evident in any of the survey items.
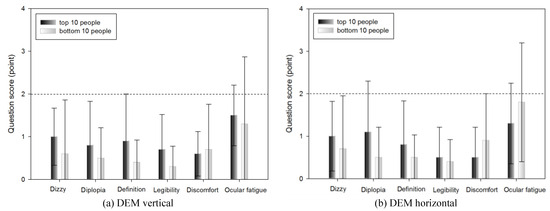
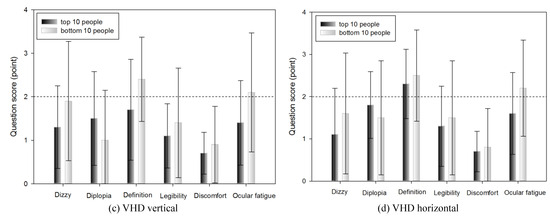
Figure 12.
Subjective symptoms of the top 10 and bottom 10 people within DEM and VHD (*: p<0.05).
Figure 12.
Subjective symptoms of the top 10 and bottom 10 people within DEM and VHD (*: p<0.05).
Discussion
Humans move their eye first before seeing an object or carrying out an action. Dynamic visual acuity is important for vision, as it facilitates recognition of an object in motion. However, unlike static visual acuity, which recognizes an object in non-motion, no standardized measurement system for dynamic visual acuity is available; therefore, this is frequently skipped in vision tests. Of the types of dynamic visual acuity, impulse eye movement is closely related to reading ability, and so is an important visual function for schoolchildren and adults.
DEM was designed to evaluate the accuracy, speed, and ability to state immediately after seeing with eyes of impulse eye movement related to reading ability. Of the impulse eye movement, as reading ability is included, the test is carried out in an environment while the subject reads a book sitting on a chair. However, the VHD is performed with the participant standing. The subject wears the VR HMD and reads the DEM chart in front of their eyes while moving their body and head.
Experiments of this study was performed to DEM test first followed by VHD test. Considering that if VHD test came first, visual tension and fatigue might occur easily due to the nature of VR device, this may likely to affect the DEM test data. As participants in the experiment had no experiences in visual function test in VR and dynamic environment, the DEM test was conducted first to enhance their understanding on the objective of the experiment. To prevent fatigue effect, 1-minute interval was allowed between DEM vertical test and horizontal test, similarly between VHD vertical test and horizontal test. To prevent order effect, 10-minutes interval was allowed between DEM test and VHD test.
Even though the outcome of DEM test and VED test similar in nature, there still exist the order effect, which is a potential limitation of this study.
The near point receded significantly after the VHD test. During the VHD test, the virtual distance from the eye to the display was near distance (159.31 mm) and from the burden of maintaining fusion stimulation by moving the body during the test, it can be interpreted as temporary receding of the near point. The phoria test results did not differ significantly before and after the VR HMD test, and the VHD test did not affect eye position.
With the exception of physical and psychological discomfort, the subjective symptom scores were significantly higher in VHD. If DEM is an impulse eye movement test conducted while in non-moving state, this result can be interpreted to have been the outcome from the aspect that VHD is a dynamic test which requires physically dynamic movement. The level of complaint of subjective symptoms regarding the overall items was 2 points (neither agree nor disagree), excluding the definition of VHD (2.15±1.09 points), indicating that in both DEM and VHD, there was no subjective symptom complaint and so it did not have a significant effect on the test. The VHD definition subjective symptom score was thus affected by the low resolution of the physical screen.
In the DEM test, horizontal reading was faster than vertical reading, while in the VHD test, vertical reading was faster than horizontal reading. For both vertical and horizontal reading, DEM was faster than VHD. DEM and VHD both showed consistent flow in the test result value. In Korean, text is read from left to right, therefore the DEM result can be seen to have come out to be faster in. When the chart is transplanted to the VR HMD, it is divided in the left right side by side method due to the characteristics of the VR HMD screen display method. At this point, the size of the converged image in each eye is divided in half; therefore, the horizontal view becomes narrower than the vertical view. Moreover, there are more numbers in the vertical direction than the horizontal direction. DEM was faster than VHD due to the difference between reading the chart that comes into view and by dynamic physical movement.
In the both the DEM and VHD, vertical and horizontal reading both showed a strong positive (+) correlation (0.7≥r≥0.3). Therefore, participants with high VHD scores also had high DEM scores. As VHD requires more physically dynamic movement than DEM, VHD requires higher visual ability, which likely caused the positive (+) correlation.
Regarding error frequency, there was no significant difference between vertical and horizontal in the DEM test, vertical and horizontal in the VHD test, and vertical and horizontal in the DEM and VHD tests. No errors occurred in the dynamic test during reading and physical movement, and there was no difference in the error frequency. The overall error frequency was less than 2, which is considered very low.
In the result comparison of near IPD after drawing out the top 10 and the bottom 10 people from the DEM, VHD test, as there was no significant difference, it was evident that there as no effect from IPD.
In the DEM test, the scores of the top 10 and bottom 10 people for all subjective symptom questions were <2. There was no statistically significant difference between the top and bottom 10 people. In DEM, which indicates reading ability, there was no difference in subjective symptom according to DEM score, suggesting that the test environment did not affect the participants.
In the comparison result of subjective symptom between the top and the bottom 10 people, after extracting them from the VHD test, excluding the item for occurrence of double vision, all others showed minutely higher subjective symptom in the group of bottom 10 people, however there was no statistically significant difference. As with DEM, this suggests that the dynamic physical movement test environment of the VHD did not affect the subjective symptoms of the participants.
In VR, motion sickness is the main issue. In this experiment, the VR HMD during the VHD was worn for less than 3 minutes, which likely explains why the subjects did not complain of subjective symptoms. Therefore, future use of the VR HMD for training would require determination of a reasonable usage period by monitoring the occurrence of subjective symptoms over time.
The effectiveness of VHD was verified by analysis of subjective symptoms, the consistency of results, error frequency, and test scores. The results strengthened the validity of use of VHD. Therefore, VHD enables measurement of dynamic visual acuity in an environment similar to real life, and it is judged that interest and effect can increase by adding various storytelling to the contents. And VHD training effect should be verified by comparison of the exercise and game groups with the corresponding comparison groups.
Acknowledgments
This research was supported by the MSIP (Ministry of Science, ICT and Future Planning), Korea, under the ITRC (Information Technology Research Center) support program (IITP-2016-R0992-16-1008) supervised by the IITP (Institute for Information & Communications Technology Promotion).
References
- Akinori, U., O. Yuji, and U. Yoshinori. 2006. A noncontact measurement of saccadic eye movement with two high-speed cameras. Proceedings of the 28th IEEE EMBS Annual International Conference 1: 5583–5586. [Google Scholar]
- Alessio, F., M. Silvio, and C. Tony. 2011. Validity reassessment of developmental eye movement (DEM) test in the Italian population. Optometry and Vision Development 42, 3: 155–167. [Google Scholar]
- Atchison, D. A., G. Smith, and N. Efron. 1979. The effect of pupil size on visual acuity in uncorrected and corrected myopia. American Journal of Optometry and Physiological Optics 56, 5: 315–323. [Google Scholar] [CrossRef]
- Ayton, L. N., L. A. Abel, T. R. Fricks, and N. A. McBrien. 2009. Developmental eye movement test: what is it really measuring? Optometry and Vision Science 86, 6: 722–730. [Google Scholar] [CrossRef]
- Bebguigui, N., and H. Ripoll. 1998. Effects of tennis practice in the coincidence timing accuracy of adults and children. Research Quarterly for Exercise and Sport 69: 217–223. [Google Scholar] [CrossRef]
- Berman, A. M. 1993. Clinical evaluation of the athlete. Optometry Clinics 3, 1: 1–26. [Google Scholar]
- Campbell, F. W., and D. G. Green. 1965. Optical and retinal factors affecting visual resolution. Journal of Physiology 181, 3: 576–593. [Google Scholar] [CrossRef]
- Coffey, B., and A. W. Reichow. 1990. Optometric evaluation of the elite athletes: the pacific sports visual performance profile. Problems in Optometry 1, 2: 32–58. [Google Scholar]
- Eugene, H. 2001. Optics, 4th edition. Addison Wesley: Reading, Ma. [Google Scholar]
- Gardner, J. J., and A. Sherman. 1995. Edited by DFC Loran and CJ MacEwan. Vision requirements in sport. In Sports Vision. Butterworth-Heinemann: London. [Google Scholar]
- Graham, B. E. 2007. Sports Vision: Vision care for the enhancement of sports performance. London: Butterworth-Heinemann. [Google Scholar]
- Hoffman, L. G., M. W. Rouse, and J. B. Ryan. 1981. Dynamic visual acuity: a review. Journal of the American Optometric Association 52: 883–887. [Google Scholar]
- Janet, M. P., M. Y. Fan, J. K. Pamela, T. B. Andrea, and R. Jack. 2006. A Comparison of the Developmental Eye Movement Test (DEM) and a Modified Version of the Adult Developmental Eye Movements Test (ADEM) with Older Adults. Journal of Behavioral Optometry 17, 3: 59–64. [Google Scholar]
- Janet, M. P., B. Kimberly, H. C. Emily, and A. C. Marcia. 2005. The need for adult norms on the developmental eye movement test (dem). Journal of Behavioral Optometry 16, 2: 38–41. [Google Scholar]
- Jason, J. 2015. The VR Book: Human-Centered Design for Virtual Reality. In ACM BOOKS, 1st Ed. ed. pp. 85–109. [Google Scholar]
- Joanne, M. W., and A. Bruce. 1997. An assessment of the Efficacy of sports vision training programs. Optometry and vision science 74, 8: 646–659. [Google Scholar]
- Kim, H. M. 2007. A Study on the Characteristics in Multi-sensory Communication Channel of Visual Information classified by the Human Senses. Korea Society of Basic Design & Art 8, 4: 801–811. [Google Scholar]
- Kim, J. H., K. N. Lee, and I. H. Ra. 2002. New Image Editor based on Combination of Bitmap and Vector Method. Journal of Korea Institute of Information and Communication Engineering 6, 2: 288–293. [Google Scholar]
- Kim, T. Y., S. H. Ryu, and Y. J. Hur. 2004. Research about CAVE Practical Use Way Through Culture Content’s Restoration Process that Utilize CAVE. Journal of Korea Game Society 4, 3: 11–20. [Google Scholar]
- Kim, Y. H., and Y. B. Lee. 2002. A study of improve vectorising technique on the internet. Journal of Korea Institute of Information and Communication Engineering 6, 2: 271–281. [Google Scholar]
- Kulp, M. T., and P. P. Schmidt. 1997. The relation of clinical saccadic eye movement testing to reading in kindergartners and first graders. Optometry and Vision Science 74, 1: 37–42. [Google Scholar]
- Kulp, M. T., and P. P. Schmidt. 1998. Relationship between visual skills and performance on saccadic eye movement testing. Optometry and Vision Science 75, 4: 284–287. [Google Scholar] [CrossRef]
- Kuppers, H. 1992. Schule der Farben: Grundzüge der Farbentheorie fur Computeranwender und andere. Köln: DuMont.
- Lee, M. A., J. M. Oh, and J. H. Jeong. 2010. The Effects of Sports Vision Training on Baseball Player’s Visual Performance and Base ball Records. Journal of Korean Ophthalmic Optics Society 15, 1: 87–97. [Google Scholar]
- Lee, M. H., and J. H. Sin. 2005. A Study on the Measurement of Dynamic Visual Acuity for Visual Acuity Chart Size. Korean Journal of Vision Science 7, 1: 129–133. [Google Scholar]
- Lee, M. H., K. C. Mah, and C. H. Won. 2000. A Studyon the Measurement of Dynamic Visual Acuity for Athletes and Nonathletes. Korean Journal of Vision Science 2, 1: 1–6. [Google Scholar]
- Lee, S. H., G. T. Ha, J. K. Cha, J. H. Kim, H. J. Lee, and S. H. Kim. 2015. CyberTouch—Touch and Cursor Interface for VR HMD. COMMUNICATIONS IN COMPUTER AND INFORMATION SCIENCE 528: 503–507. [Google Scholar]
- Maples, W. C., R. S. Savoy, B. J. Harville, L. R. Golden, and R. Hoenes. 2009. Comparison of Distance and Near Heterophoria by Two Clinical Methods. Optometry and Vision Development 40, 2: 100–106. [Google Scholar]
- Medland, C., H. Walter, and J. M. Woodhouse. 2010. Eye movements and poor reading: does the Developmental Eye Movement test measure cause or effect? Ophthalmic and Physiological Optics 30, 6: 740–747. [Google Scholar]
- Michael, S., G. Steve, E. Martin, E. Elmar, and M. Marcus. 2015. An Affordable Solution for Binocular Eye Tracking and Calibration in Head-mounted Displays. Proceedings of ACM Multimedia 2015. [Google Scholar]
- Mitsuru, N., T. Minoru, and K. Daisuke. 2005. Effects of aging and regular exercise on the visual function. Juntendo Medical Journal 51, 2: 153–159. [Google Scholar]
- Palter, S. F., O. Sobko-Koziupa, T. Gilhuly, and C. Pyer. 2000. Use of a Head Mounted Display (HMD) Virtual Reality (VR) Headset as a Patient Distraction Device for Surgical Procedures Under Local Anesthesia/Sedation. Fertility and sterility 74, 3: s203. [Google Scholar]
- Rizzo, A., A. Hartholt, M. Grimani, A. Leeds, and M. Liewer. 2014. Virtual Reality Exposure Therapy for Combat-Related Posttraumatic Stress Disorder. IEEE Computer Society 47, 7: 31–37. [Google Scholar]
- Schuemie, M. J., P. van der Straaten, M. Krijn, and C.A. van der Mast. 2001. Research on Presence in Virtual Reality: A Survey. CyberPsychology and Behavior 4, 2: 183–201. [Google Scholar]
- Sebastian, S., and M. Daniel. 2012. The impact of a sports vision training program in youth field hockey players. Journal of Sports Science and Medicine 11, 4: 624–631. [Google Scholar]
- Thomas, A. W., and F. Jeff. 2004. Sports Vision: Training for better performance. Human Kinetics 85. [Google Scholar]
- Webber, A., J. Wood, G. Gole, and B. Brown. 2011. DEM test, visagraph eye movement recordings, and reading ability in children. Optometry and Vision Science 88, 2: 295–302. [Google Scholar] [PubMed]
- WIKIPEDIA. Lens(optics). Available online: https://en.wikipedia.org/wiki/Lens_(optics).
- William, J. B. 2006. Borish’s Clinical Refraction. In BUTTERWORTH HEINEMANN, 2nd Ed. ed. pp. 217–246. [Google Scholar]
- Wills, J., R. Gillett, E. Eastwell, R. Abraham, K. Coffey, A. Webber, and J. Wood. 2012. Effect of simulated astigmatic refractive error on reading performance in the young. Optometry and Vision Science 89, 3: 271–276. [Google Scholar] [PubMed]
- Won, C. H., and K. C. Mah. 1993. Sports Vision Training. In DAIHAKS, 1st Ed. ed. pp. 23–24. [Google Scholar]
- Yamaguchi, C., K. Hasebe, S. Ohkubo, M. Takaba, Y. Sira, S. Hasebe, and H. Ohtsuki. 2012. Measurement of the AC/A Ratio Using Howell Phoria Card. Japanese Orthoptic Journal 41: 83–87. [Google Scholar]
- Yoshimitsu, K., and Y. Hiroshi. 2004. Training effects of visual function on college baseball players. Human Performance Measurement 1: 15–23. [Google Scholar]
- Zhao, Q. L., Z. Q. Wang, H. Q. Guo, Q. Sun, and Z. W. Lu. 2004. Head-mounted display with LCOS using diffractive optical element. Optik 115, 1: 11–14. [Google Scholar]
Copyright © 2016. This article is licensed under a Creative Commons Attribution 4.0 International License.