Next Article in Journal
Covert Attention Tracking: Towards Two-Dimensional Real-Time Recordings
Previous Article in Journal
Culture Shapes How We Look: Comparison Between Chinese and African University Students
 
 
Journal of Eye Movement Research is published by MDPI from Volume 18 Issue 1 (2025). Previous articles were published by another publisher in Open Access under a CC-BY (or CC-BY-NC-ND) licence, and they are hosted by MDPI on mdpi.com as a courtesy and upon agreement with Bern Open Publishing (BOP).
Article

Investigating the Spatial Pattern of Older Drivers’ Eye Fixation Behaviour and Associations with Their Visual Capacity

by
Qian (Chayn) Sun
1,
Jianhong (Cecilia) Xia
1,
Torbjörn Falkmer
1,2,3 and
Hoe Lee
1
1
Curtin University, Bentley, WA 6102, Australia
2
Linköping University, 581 83 Linköping, Sweden
3
La Trobe University, Sydney, NSW 2000, Australia
J. Eye Mov. Res. 2016, 9(6), 1-16; https://doi.org/10.16910/jemr.9.6.2 (registering DOI)
Submission received: 2 July 2016 / Published: 28 August 2016

Abstract

:
Visual capacity generally declines as people age, yet its impact on the visual search patterns along sections of different road during actual driving still remains undocumented. This on-road driving study simultaneously recorded 30 older drivers’ eye movement and precise vehicle movement trajectories. The vehicle positions were linked to every identified eye fixation for each individual driver, so that the locations of the driver’s gaze origin in geo-spatial coordinates were obtained. Spatial distribution pattern of drivers’ eye fixations were then mapped and analysed. In addition, the associations between older drivers’ visual capacity (processing speed, divided and selective attention) and their eye fixation patterns in various driving manoeuvres were investigated. The results indicate that driving scenarios have a significant impact on older drivers’ visual patterns. Older drivers performed more frequent eye fixations at roundabouts, while they tended to fixate on certain objects for longer periods during straight road driving. The key findings show that the processing speed and divided attention of older drivers were associated with their eye fixations at complex right-turns; drivers with a lower capacity in selective attention performed less frequent eye fixations at roundabouts. This study has also demonstrated that visualisation and spatial statistics are effective and intuitive approaches to eye movement analysis.

Introduction

Background

Older drivers have one of the highest vehicle crash rates in comparison with other population groups, largely due to the functional effects of the accumulation, and progression of age-related deterioration in visual, cognitive and motor conditions that impact on fitness to drive (Molnar et al., 2007). Numerous studies indicate that the predominant casualty crash type for older drivers involved complex road environments or high cognitive workload situations (Charlton et al., 2005). Statistically, older drivers are less likely to be involved in crashes caused by fatigue, high speed, weather condition, or alcohol than younger drivers. Conversely, older drivers are more likely to be involved in crashes in certain scenarios, such as manoeuvres through intersections; failure to yield the right of way; failure to identify hazards, or to heed stop signs/traffic signals; and problems involving turning and changing lanes (Clarke, Ward, Bartle, & Truman, 2010; Marmeleira, Ferreira, Melo, & Godinho, 2012; McGwin & Brown, 1999).
The decline in visual capacity appears directly related to the above crash scenarios in older drivers (Wood & Owsley, 2014). Several changes occur in the human eye with age making the visual system operate less efficiently. Visual search inefficiency may prevent the driver’s attention returning quickly to the already searched locations (Bedard et al., 2006). Driving in traffic typically requires the ability to differentiate between relevant and irrelevant information in often complex and challenging visual scenes, where potential hazards may occur in any part or in direction of the visual field (Lees, Cosman, Lee, Fricke, & Rizzo, 2010). For older adults, their mental and physical condition and their ability to concentrate behind the wheel deteriorate (Fancello, Pinna, & Fadda, 2013). Even in the normal ageing process there is a decline in various aspects of visual attention including selective attention, divided attention, sustained attention, and switching attention (Glisky, 2007). For example, the ability to divide their attention between a central location and the periphery experiences a sharp decline with ageing (Boot, Stothart, & Charness, 2014). Smither, Mouloua et al. (2004) stressed that it would take an older driver 1.5 to 1.7 times longer on average than a younger driver to scan for information. Apparently, for older drivers, visual attention ability is an important factor associated with accident risk (B. Sekuler, 2000; C. Owsley, Ball, Sloane, Roenker, & Bruni, 1991; Richardson & Marottoli, 2003). Older people decline in visual capacity at different rates and in different ways, however, the impact of these declines on visual search in driving remains undocumented. In addition, how older drivers’ oculomotion responds to the different driving manoeuvres hasn’t been fully explored owing to the difficulty in obtaining quantitative measurement of the drivers’ behaviours, especially in naturalistic settings.
Previous studies have shown that drivers’ physical and cognitive conditions, and driving habits result in different behaviours and performance on road at both the individual and group levels (Rapoport et al., 2013; Sagberg, Selpi, Bianchi Piccinini, & Engstrom, 2015). The investigation into the eye movement pattern of older drivers would help understand the characteristics of the oculomotor behaviour in this age cohort. At the individual level, such investigation may offer early detection of risky behaviour, such as excessive or insufficient gazing in certain scenarios, which can cause missed visual information (Nakayasu, Miyoshi, Kondo, Aoki, & Patterson, 2011). Underwood et al. (2003) found different sequences of visual patterns between experienced and novice drivers, suggesting that it may be of benefit to provide suitable intervention on visual search strategies for novice drivers. Konstantopoulos et al. (2012) investigated whether showing people where to look can provide information on why it is important to look in these locations. Such training interventions would have a great chance of improving visual processing, situational awareness, and ultimately driving behaviour. Thus, it is important to investigate the visual search behaviour in older drivers and identify the spatial distribution patterns.
To date, the common trends in eye movement research include attempts at understanding gaze patterns, e.g., where we look at and for how long (Schütz, Braun, & Gegenfurtner, 2011). For driving, visual activity is vital for steering since it provides spatial-temporal information about the desired travel path and general movement within the environment (A. S. Cohen & Studach, 1977; Cooper, Medeiros-Ward, & Strayer, 2013; Lee, 2008; Underwood et al., 2003). Gaze position measures can be a valuable source of information in cognitive studies of driving (Lappi & Lehtonen, 2013). For example, a landmark study by Land and Lee (1994) found that the tangent point as a guiding gaze fixation location is relevant for steering in curve driving. Wann and Swapp (2000) added explanation for the future path model, pointed out that gaze behavior during locomotion is to fixate points on the road ahead. Lappi (2013) drew a conclusion based on three experiments, that the drivers fixated on target points on the future path beyond the tangent point, and pursuit eye movements were used to track the points. The types of guiding and lookahead fixations were reported in Lehtonen et al. (2013). Despite that, few studies have examined gaze patterns from the perceivers’ positions, rather the locations eyes fixated on as recorded by the eye tracking device. In fact, from where and when the driver was fixating at a given object in driving are equally important as this allows human oculomotor behaviour to be revealed. Lappi and Lehtonen (2013) related eye movements to the vehicle trajectory, and presented the first on-road data where gaze stability was analyzed quantitatively at the level of individual fixations. Also by locating visual information, Lehtonen and Lappi (2014) continued to provide evidence for the effect of experience on visual scanning during different curve driving.
Thanks to the advanced tracking technologies and analytical applications, it is possible to record high resolution vehicle movement data, and further link the eye movements with the vehicle trajectories to demonstrate the spatial variation of the drivers’ visual behaviour. Such spatial patterns may be related to the older drivers’ visual capacity to scrutinize human oculomotor behavior responding to cognitive workloads, which may in turn be utilized in safety studies and to develop intervention strategies for older drivers (Hamel et al., 2013). To achieve this, drivers’ eye movement using an eye tracker and precise high-resolution vehicle trajectories using an advanced GNSS (Global Navigation Satellite System) were synchronously recorded. The eye fixations were analysed and geo-coded in a GIS (Geography Information System) environment with reference to the vehicle positions, so that every eye fixation was given a (x, y) coordinate of the driver’s origin of view. Individual drivers’ oculomotor path can be then recreated in GIS and overlaid with other spatial information, such as the driving route. In addition, drivers’ visual attention ability (processing speed, divided and selective attention) was evaluated using UFOV® (Useful Field of View) test. Spatial and statistical analysis were applied to investigate the gaze pattern and the correlations with older drivers’ visual capacity.

Research Aim

Eye movement measures provide useful information to investigate behavioral performance. This study introduces a new measurement of driving behaviour and examine eye fixations across a variety of driving tasks involving different visual and cognitive workloads. Tsai and Viirre et al. (2007) stressed that the attention capacity is limited and task dependent, so the oculomotor range is an important measure of driving performance.
While a great deal is known about the objects which the eyes fixate on and the temporal attributes of the fixations, less is known about spatial pattern of the entire oculomotor behavior during various driving manoeuvres. Considering that eye movement reflects changes in attention states, this investigation focuses on the effects of driving tasks on the oculomotor behavior for 30 older drivers. Going one step further from traditional eye movement study in driving, this paper extends the dimensions of eye movement tracking by recording from where (the vehicle positions) the driver started gazing at a certain object. This approach enables various spatial analysis and interpretation to be used in the current investigation.
This study is therefore aiming to provide insight into the oculomotor behaviour of older drivers by segmenting the driving route into different scenarios and understanding the impact of the visual capacity decline on their visual searching patterns. Additionally, eye fixation behaviour patterns in older drivers that could potentially lead to road crashes may be observed. Future research on older drivers’ eye movement in relation to driving behaviours, as well as the shortcomings of the study are discussed in this paper.

Methods

Subjects

In this paper, 30 participants aged from 60 to 80 (mean = 68.7, SD = 5.6) were selected as research subjects from the original PhD research project (Sun, Xia, Foster, Falkmer, & Lee, 2016) with 50 older drivers. The selection was based on the completeness of analysed eye tracking and vehicle tracking data. The eligibility of participation also included: holding a valid driver license and having an insured vehicle, driving at least 3–4 times a week, having no known mental and physical issues affecting driving, and no sedative medication taken prior to the assessment. Before the assessment, all subjects provided informed consent for participation in compliance with ethics requirements from the University Human Research Ethics Committee. All participants passed screening on visual acuity, and on Mini-Mental State Examination (MMSE) to smooth out any mental and cognitive functional deficits which would affect normal on-road driving.

Data Collections

Visual Capacity Test. This study utilized a PC version of UFOV® (Useful Field of View) test to evaluate the performance of processing speed, divided attention, and selective attention of subjects (Classen, Wang, Crizzle, Winter, & Lanford, 2013; Wood & Owsley, 2014). The test determines speed of processing abilities quantified by display speed threshold for central target identification alone in Subtest One, central target identification with peripheral target localization in Subtest Two, and central target identification with peripheral target localization in the presence of distractors in Subtest Three (Ball, Edwards, & Ross, 2007). Scores were expressed in milliseconds, representing the exposure duration required for a participant to perform. For each subtests, possible scores range from 13 ms to 500 ms. Lower scores correspond with better visual capacity. Edwards and Ross et al. (2006) stated that UFOV is a better predictor of vision problems in everyday life than standard visual field assessments, which detect sensory losses across the visual field. In addition, an association was found between low UFOV scores and speed processing deficits in older adults; UFOV performance also predicts important indices of mobility (Anstey, Wood, Lord, & Walker, 2005; Ball et al., 2007; Wood & Owsley, 2014). Since the UFOV test relies on the integrity of visual sensory information as well as the subject’s higher order processing abilities (Cynthia Owsley, Ball, & Keeton, 1995), it demonstrates reliable data regarding older adults’ visual capacity.
On-road Driving and Eye Tracking. The on-road driving experiments simultaneously recorded the vehicle movement and the driver’s eye movement (Sun, Xia, Nadarajah, et al., 2016). Participants were instructed to drive their own car through the campus of Curtin University in Perth, Australia, for about 10 km distance under normal traffic avoiding peak hours. The on-road driving lasted about half an hour. The driving route (Figure 6) contains a series of roundabouts and intersections.
A head-mounted Arrington ViewpointTM eye tracker (Figure 1) was used to record the eye movements of each participant during driving. The eye tracker consists of an eye camera and a scene camera, capturing gaze behavior and the scene in front of the driver respectively. The eye and scene images are superimposed by the eye tracking system and give real-time information about when and where in the environment line-of-gaze is located. The recording frequency is 60 Hz. A 16-point calibration procedure was carried out prior to the driving experiment. The eye tracker’s precision can be resolved to 0.25–0.5 degrees of the visual arc, when the recording resolution is 0.15 degrees in the visual field (Arrington, 2010).
The vehicle trajectory of each participant was recorded using a professional-grade GNSS receiver (Trimble R10) with 10 Hz tracking rates. The receiver was installed and initialized on the participant’s car roof prior to the on-road driving to warm up. Real-time kinematic (RTK) positioning technique was used to obtain precise vehicle trajectories and with methods described in detail in earlier publications (Sun et al., 2017; Sun, Xia, Foster, et al., 2016).

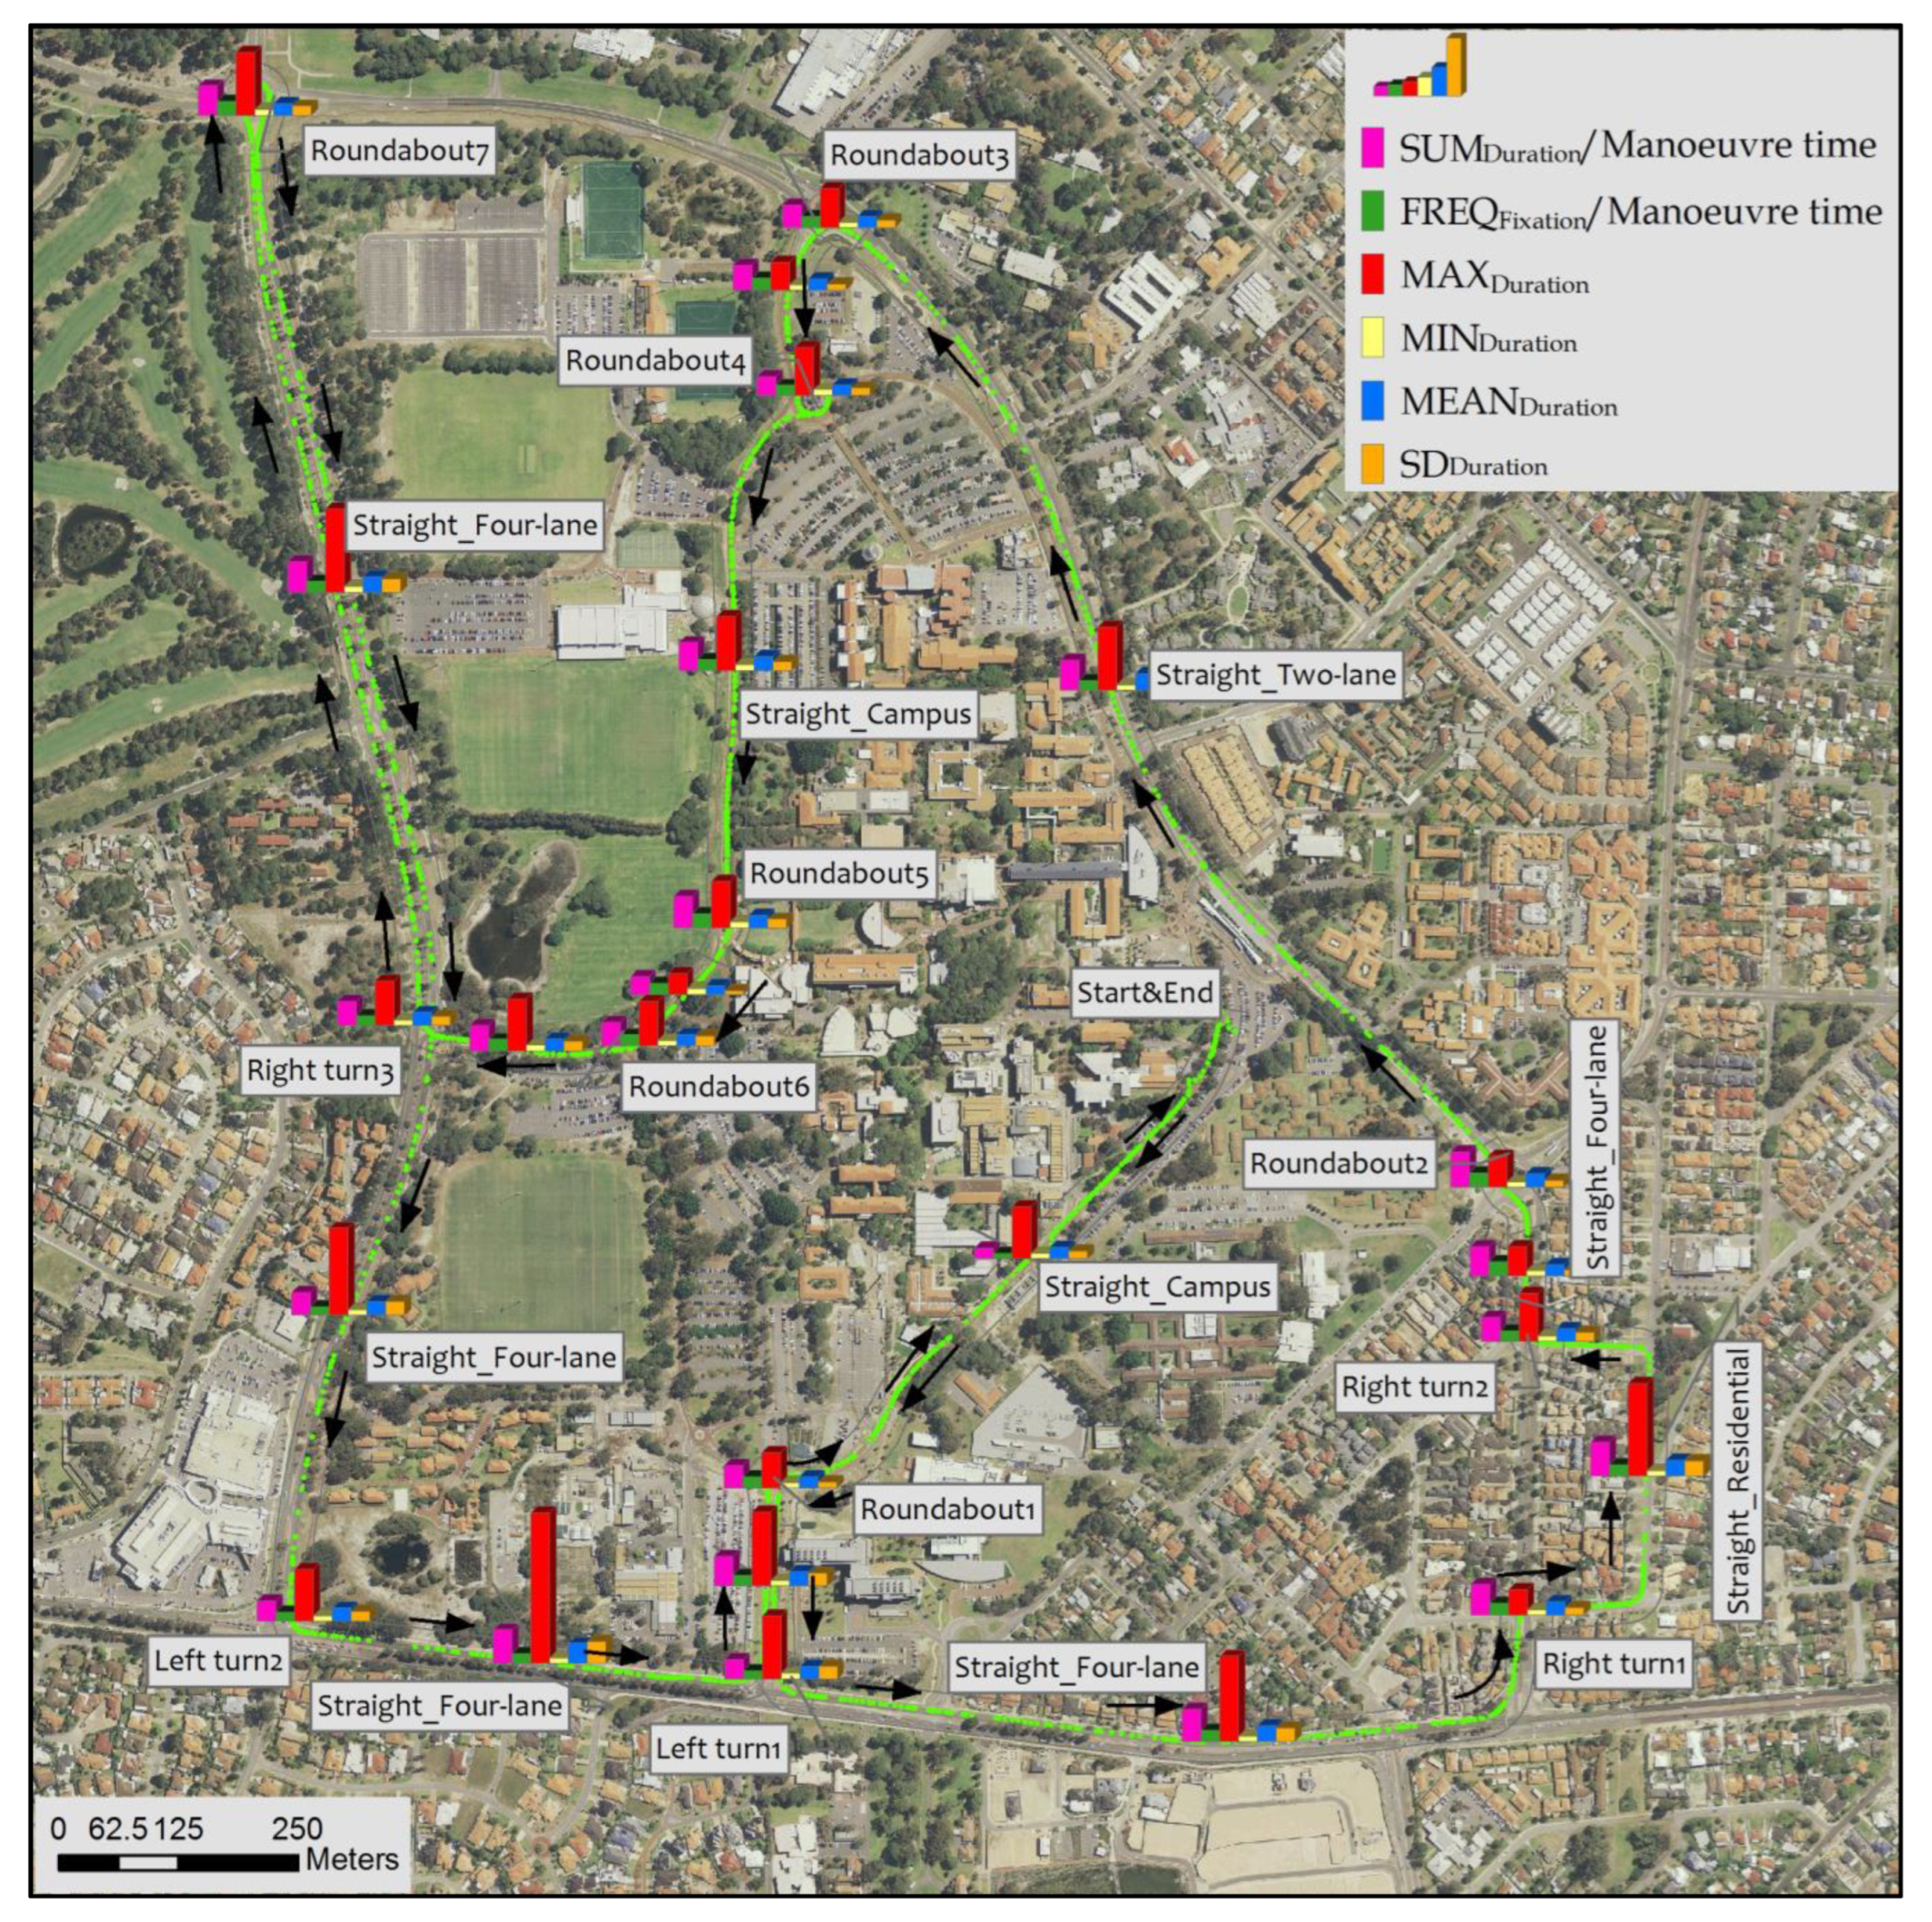
Data Analysis and Visualisation

Segmentation of Driving Manoeuvres. We created a set of 16 driving scenarios (see Figure 6) including two sections of left-turn, three sections of right-turn, seven sections of roundabouts and in between four sections of straight road driving. The driver workload varies in the different sections. For example, cognitive resources involving visuospatial and motor coordination are required for making turns (Schweizer et al., 2013). Driving through intersections and roundabouts thus requires precision in visualmotor coordination to complete the turning manoeuvre. This skill can sometimes be challenging for older adults. The curvature of roads plus moving cars in different directions places high demands on perception, attention, orientation and motor control that often decline with age. Measuring the shift of visual attention in older drivers in these tricky sections can predict their driving behaviours (Min, Min, & Kim, 2013). While those sections of straight road driving between turnings were meant to represent the relatively easy, less risky driving conditions.
Eye Tracking Data Analysis: Dispersion Centroid Mode Algorithm. Eye movements were analysed through the use of eye tracking video recording for each participants. The main purpose of this analysis was to separate saccadic eye movements, and noise, from fixations (periods where the gaze location is spatially relatively stable), in order to focus on conscious perception. Dealing with measures of fixations rather than the unfiltered raw data simplifies the analysis and interpretation, as every fixation was uniquely associated with a particular spatiotemporal location (Frederick, Katarzyna, & Brian, 2008), namely what that perceiver’s visual attention was focused on.
The tracking equipment records raw gaze data (xi, yi, ti), giving the gaze coordinates (xi, yi) at the time of ti, where clusters of gaze points can be potentially identified as fixations (Blignaut, 2009). To achieve this, a computational algorithm is needed to efficiently extract fixations from the original large dataset discarding noises and saccades.
This study employed the dispersion centroid mode algorithm for eye tracking data analysis; originated and validated by Falkmer et al. (2008). Fundamentally, the algorithm identifies the fixations as sets of consecutive points within a particular dispersion distance (Salvucci & Goldberg, 2000). Two parameters were defined for the algorithm: the duration threshold and the dispersion threshold. The minimum duration was set to 100 ms since fixations rarely have a shorter period (Amos S Cohen, 1977); and the maximum dispersion threshold was defined at 1° of visual angle in the field of view. A fixation defined by 100 ms and 1° will encompass all consecutive eye movements that occurred within 1° distance from each other for at least 100 ms.
The fixation identification algorithm utilizes a weighted procedure in accord with the fact that, in human oculomotor behaviour, our eyes first land close to the object of interest and then for micro saccades to adjust the eye position to the fixated object. Technically, the algorithm identifies fixations using a window that extends across consecutive data points (Salvucci & Goldberg, 2000). The weighting of the fixation generation takes the standpoint that humans want to maximize the fixation duration on any object and hence the window moves according to the combined weight of the previous fixation and the current one, in order to include as many gaze sampling points into a series of fixations as possible. The moving window was initialized to cover a minimum of three chronologically consecutive sampling gaze points, which all lasted at least 100 ms to meet the duration threshold. Next, the dispersion (maximum separation) of the sampling points was calculated by summing the distances from the centroid of the sampling points in the window. If the dispersion is lower than 1° of visual angle, the centroid point in the window was consequently noted as a fixation with the given start time and duration. Otherwise, the window moves to the next area to cover new points until the window’s dispersion is above the threshold. This dispersion dimension giving a spacing that allows for pursuit tracking to be classified as a fixation (Falkmer & Gregersen, 2005). The algorithm carried on with the window moving and fixation identification repeated to the end of the raw eye tracking data.
The actual identification of fixations can be quite challenging, particularly in a naturalistic setting (Falkmer & Gregersen, 2001; Lappi, 2015), due to the fact that all perceived objects are in relative motion. When driving around roundabouts or through intersections, the fixations are likely to represent pursuit movements. When turning, a fixation can be determined to have ended although in fact the driver was still looking at the same location in the environment (Itkonen, Pekkanen, & Lappi, 2015; Lappi, Pekkanen, & Itkonen, 2013). In order to ensure such eye movement is classified as a “fixation”, the speed the gaze rotates should be slow enough relative to the chosen dispersion threshold and the actual fixation durations to avoid breaking fixations. Based on the finding in Lappi et al. (2013) that the horizontal pursuit speed is half the rate of rotation of the vehicle. In this study, participants drove at an average speed between 20 to 30 km/h when manoeuvreing through roundabouts; the smallest roundabout radius is 14 m, where no participants drove over 25 km/h. Thus the required maximum horizontal pursuit speed is about 14 deg/s. Therefore, the fixation identification algorithm parameters works properly because the suggested fixations did not produce dispersion that would cause the identification method to break a fixation. Similarly, the threshold allows individual optokinetic nystagmus smooth pursuits included in fixations.
A post manual identification was also carried out to minimize errors and misclassifications from the data analysis program. To do this the raw data (eye tracking video footage) was divided frame by frame and viewed in fixation clusters. Each cluster was visually validated and additional attributes of eye fixations can be recorded.
Visualizing and Spatial Statistics of Geo-coded Eye Movement. The eye fixation data and vehicle trajectory were synchronized using time stamp as the common link, so each fixation has a (x, y) coordinates assigned from the vehicle position, in order to represent “from where” the driver started gazing; and the fixation duration from the eye tacking analysis gives the period of the gazing. The geocoded eye fixations data was then overlaid with driving route in a GIS environment. Accurate spatial gazing pattern analysis can be conducted by statistically reporting eye fixations in various driving sections.
To visualize eye movement patterns, the eye fixation positions were superimposed along with the vehicle trajectories for individual drivers A and B (see Figure 2, Figure 3, Figure 4 and Figure 5). The frequency, durations and the spatial distribution of drivers’ gaze behaviour vary significantly between two drivers; driver B performed more frequent eye fixation during both manoeuvres than driver A demonstrated. The spatial patterns indicate that driver B tended to shift his fixations to different objects during the manoeuvres, which might cause excessive work load. Nevertheless, both drivers performed more frequent eye movement in the second part of the roundabout, indicating their different visual strategies when getting information in order to exit the roundabout.
Figure 6 focuses on the statistical distribution of eye fixation in different driving sec-tions from an individual driver (driver C). Six statistical parameters of eye fixations were generated and mapped to the corresponding driving sections. The parameters include the following magnitude and statistics of eye fixation duration and frequency:
  • SUMDuration/Manoeuvre time (the ratio of total fixation duration to manoeuvre time)
  • FREQFixation/Manoeuvre time (the ratio of eye fixation count to the manoeuvre time)
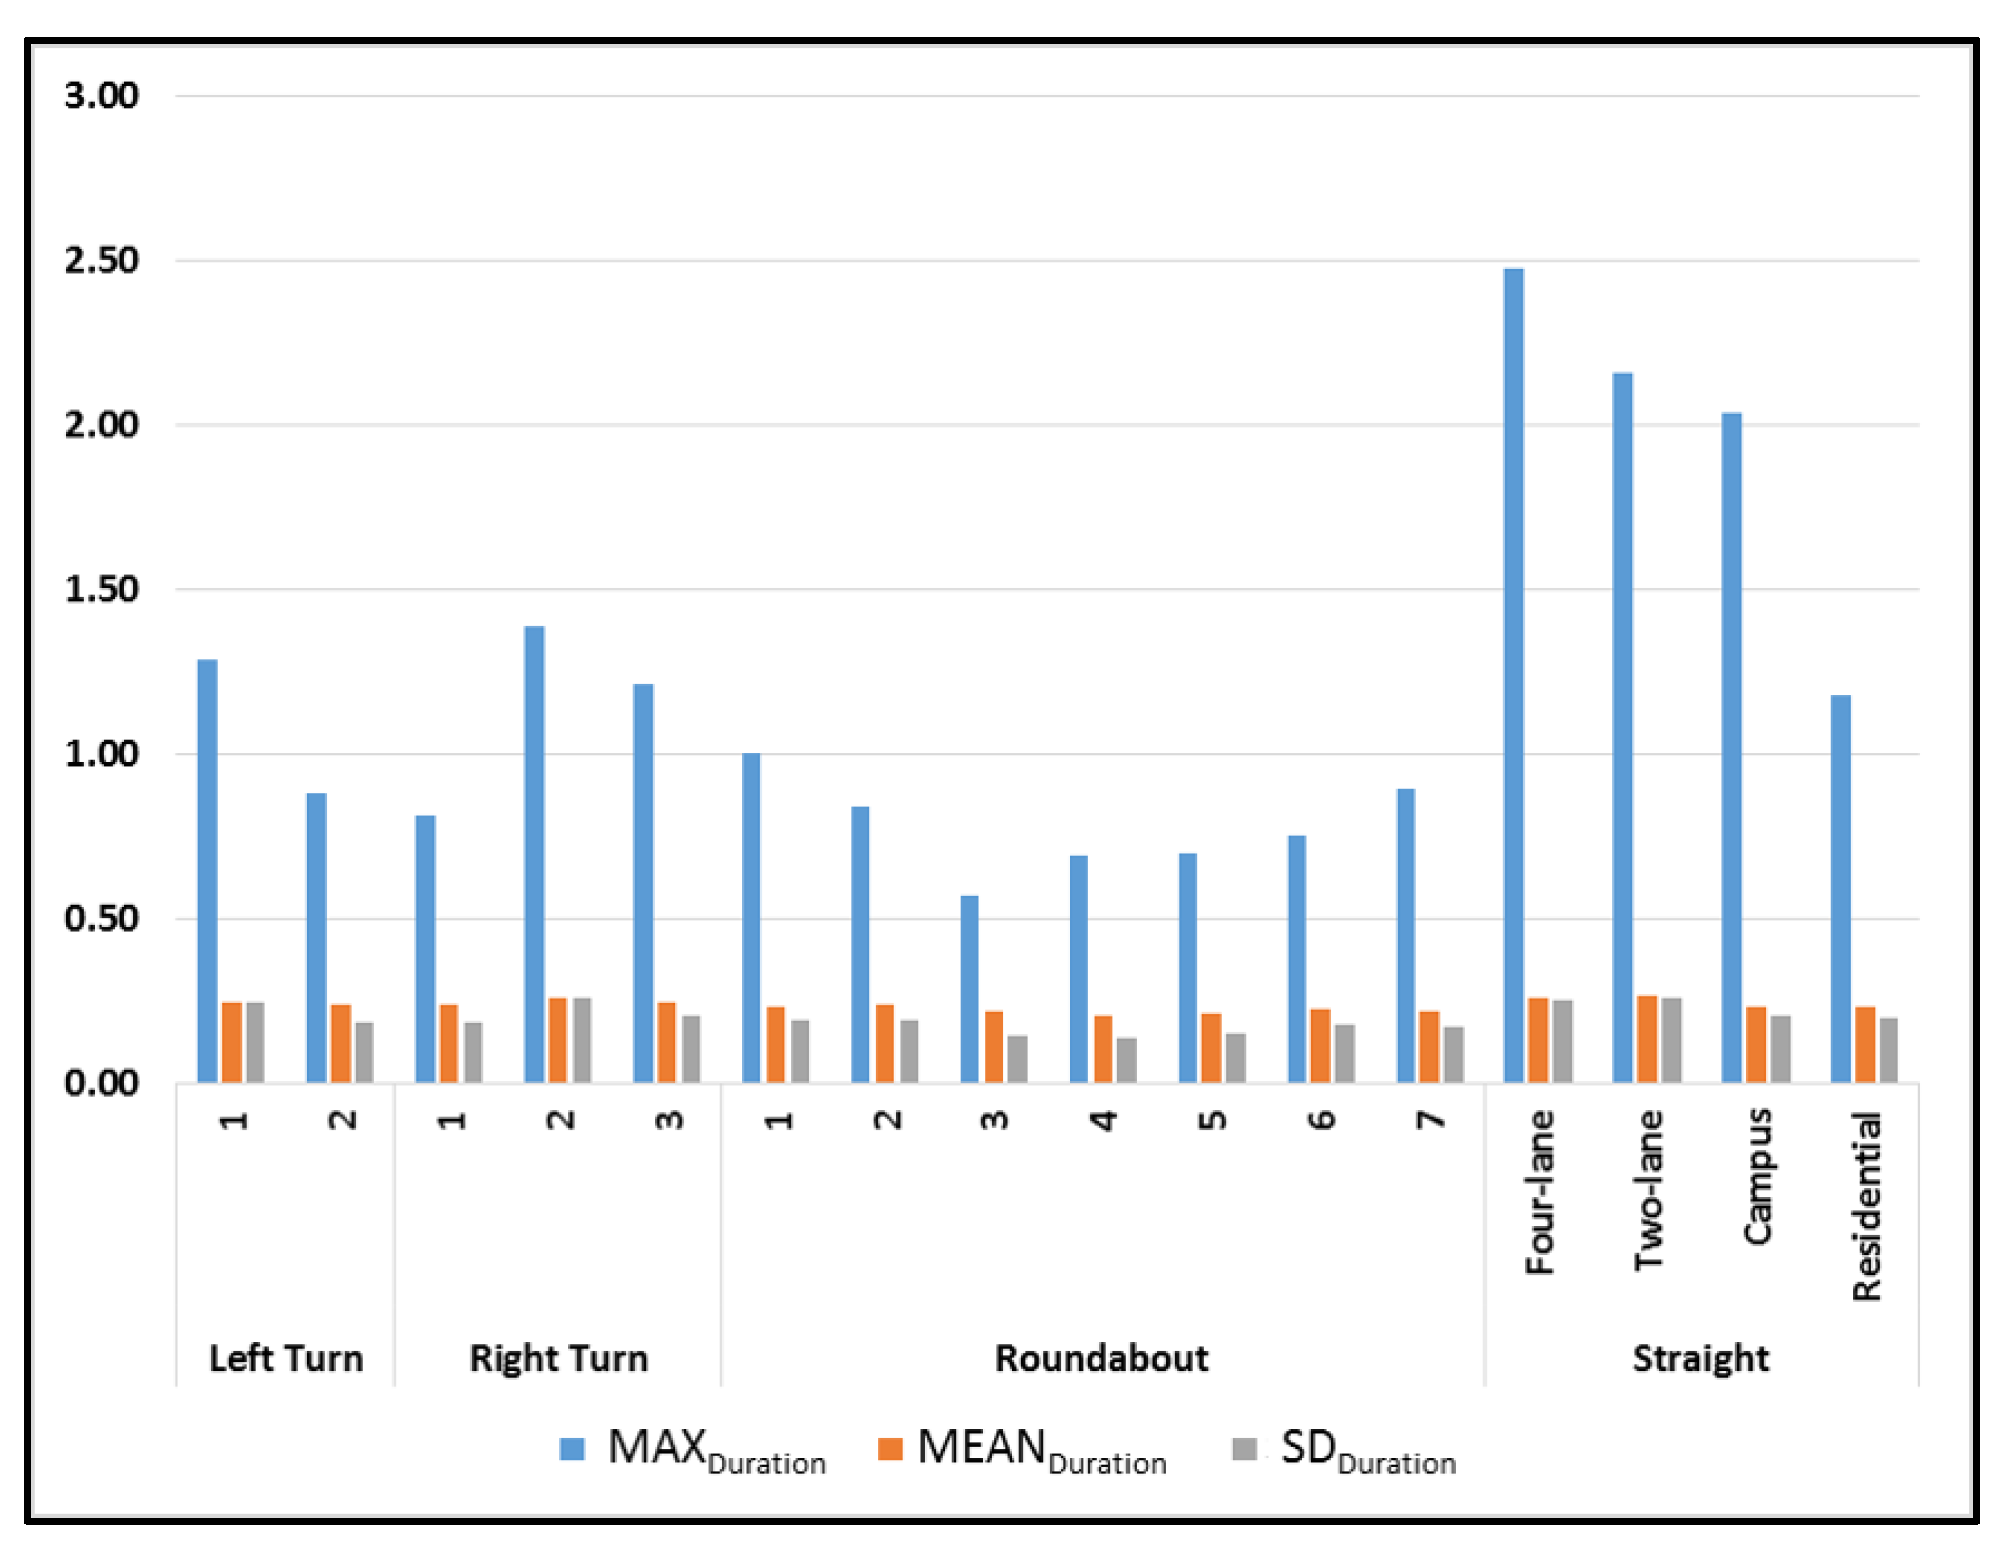
  • MAXDuration (the maximum fixation duration)
  • MINDuration (the minimum fixation duration)
  • MEANDuration (the mean of fixation duration)
  • SDDuration (the standard deviation of fixation durations)
Figure 6. The spatial distribution of eye fixations for different driving manoeuvres and sections by an individual driver (driver C) using statistical parameters of the driver’s eye fixations. The green dots are the driver’s viewpoints related to eye fixation behaviour, namely the locations of the driver’s gaze origin on the driving trajectory. Black arrows show the driving direction along the route.
Jemr 09 00030 g006
The statistical distribution of eye fixations in Figure 6 gives an example for analyzing individual drivers’ visual search behaviour in different driving sections. Some characteristics of the driver’s eye movement can be identified, for example during straight road driving, the maximum and standard deviation of fixation duration are higher than those observed driving at turning manoeuvres. No significant variations were observed for the other parameters in the different manoeuvres and sections. Moreover, the visualisation of the individuals’ gazing pattern is intuitive and graphically understandable for inspecting drivers’ oculomotor behaviour.
The aggregate spatial and statistical distribution of the eye fixation behaviour for the whole group, associated with their visual capacity were examined using statistical correla-tion methods. This exploration is to identify critical driving sections underpinning older drivers’ oculomotor behaviour due to their declined visual capacity. The potential factors related to driving situations can be investigated, such as the geometry of roundabouts or the complexity of driving scenes.

Results

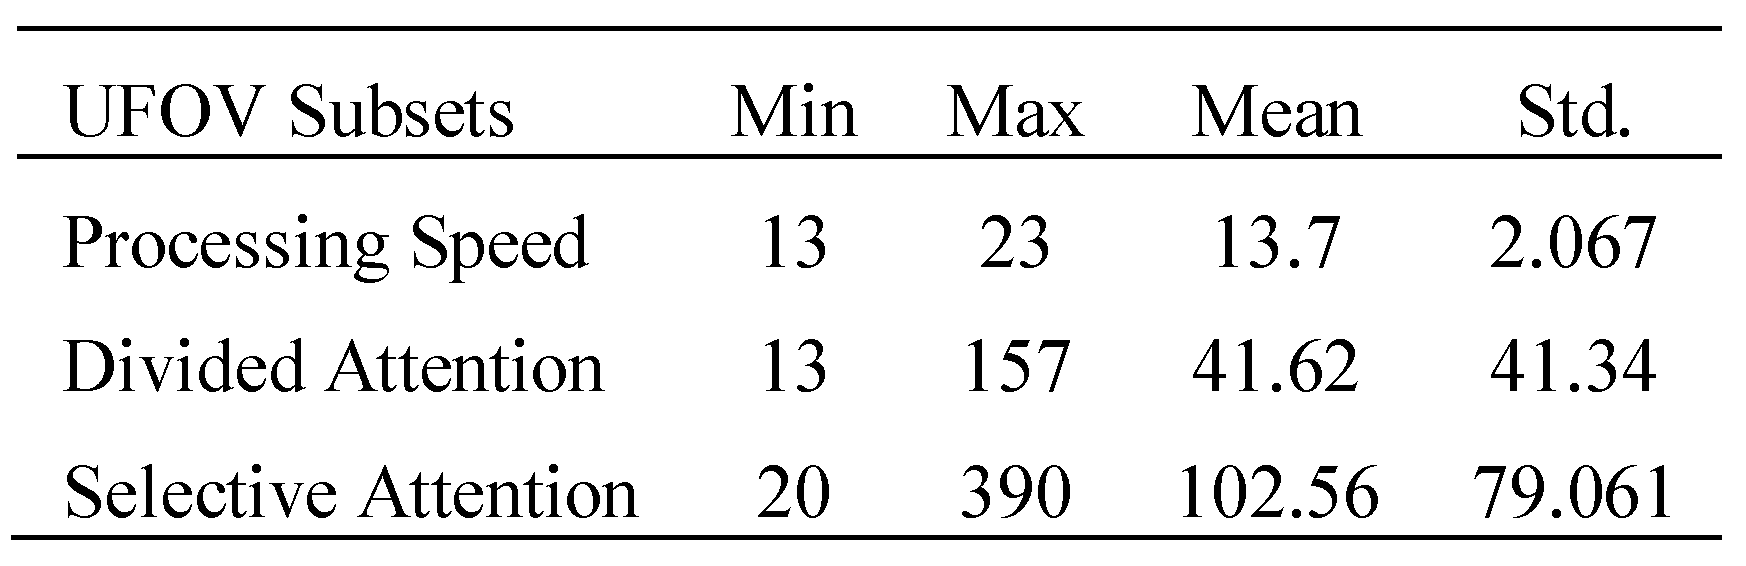
Visual Capacity on UFOV Test

Table 1 summarizes the UFOV scores of the 30 subjects. The higher scores indicate lower visual capacity and poorer performance on the test. Subset 3 (Selective attention) presents the highest variation range (20–390 milliseconds); while subset 1 (Processing speed) has the lowest range (13–23 milliseconds). In terms of the associations between participants’ age and their visual capacity, we have previously reported for the total 50 older drivers that there were low positive correlations between age and processing speed, divided and selective attention (r was .006, .242 and .251 respectively).

Statistical Parameters of Eye Fixations in Relation to Driving Manoeuvres

We present the summary of participants’ eye fixation performance in different driving manoeuvres and sections in Figure 7 and Figure 8. Five statistical parameters of eye fixations (SUMDuration/Manoeuvre time, FREQFixation/Manoeuvre time, MaxDuration, MeanDuration and SDDuration) were used to examine the oculomotor behaviour for this cohort. Of the total 16 sections, Figure 7 shows that, the in-campus straight road driving demonstrated the lowest values in both the total fixation duration (SUMDuration/Manoeuvre time) and fixation frequency (FREQFixation/Manoeuvre time). The highest total fixation duration (SUMDuration/Manoeuvre time) was found in the two-lane straight road driving, and in general, the roundabout manoeuvres possessed slightly more frequent eye fixations (FREQFixation/Manoeuvre time), followed by turns manoeuvre, and the straight road driving.
Figure 8 compared the statistics of the maximum, mean and standard deviation of fixation durations for the 16 driving sections. The maximum fixation durations (MaxDuration) of participants during straight road driving are significantly higher than both turns and roundabout performance. However, the mean (MeanDuration) and standard deviation of fixation durations (SDDuration) are similar with the slightly lower values observed for roundabout driving.
For visually exploratory inspection, Figure 9 illustrates a sample of spatial distribution of eye movement at a roundabout U-turn and straight road driving. The difference in visual search patterns is obvious, with the driver exhibiting larger fixation durations and larger variation of fixation durations (standard deviation of fixation duration), but less frequent fixations on the straight-driving, compared to the U-turn manoeuvre at the roundabout.

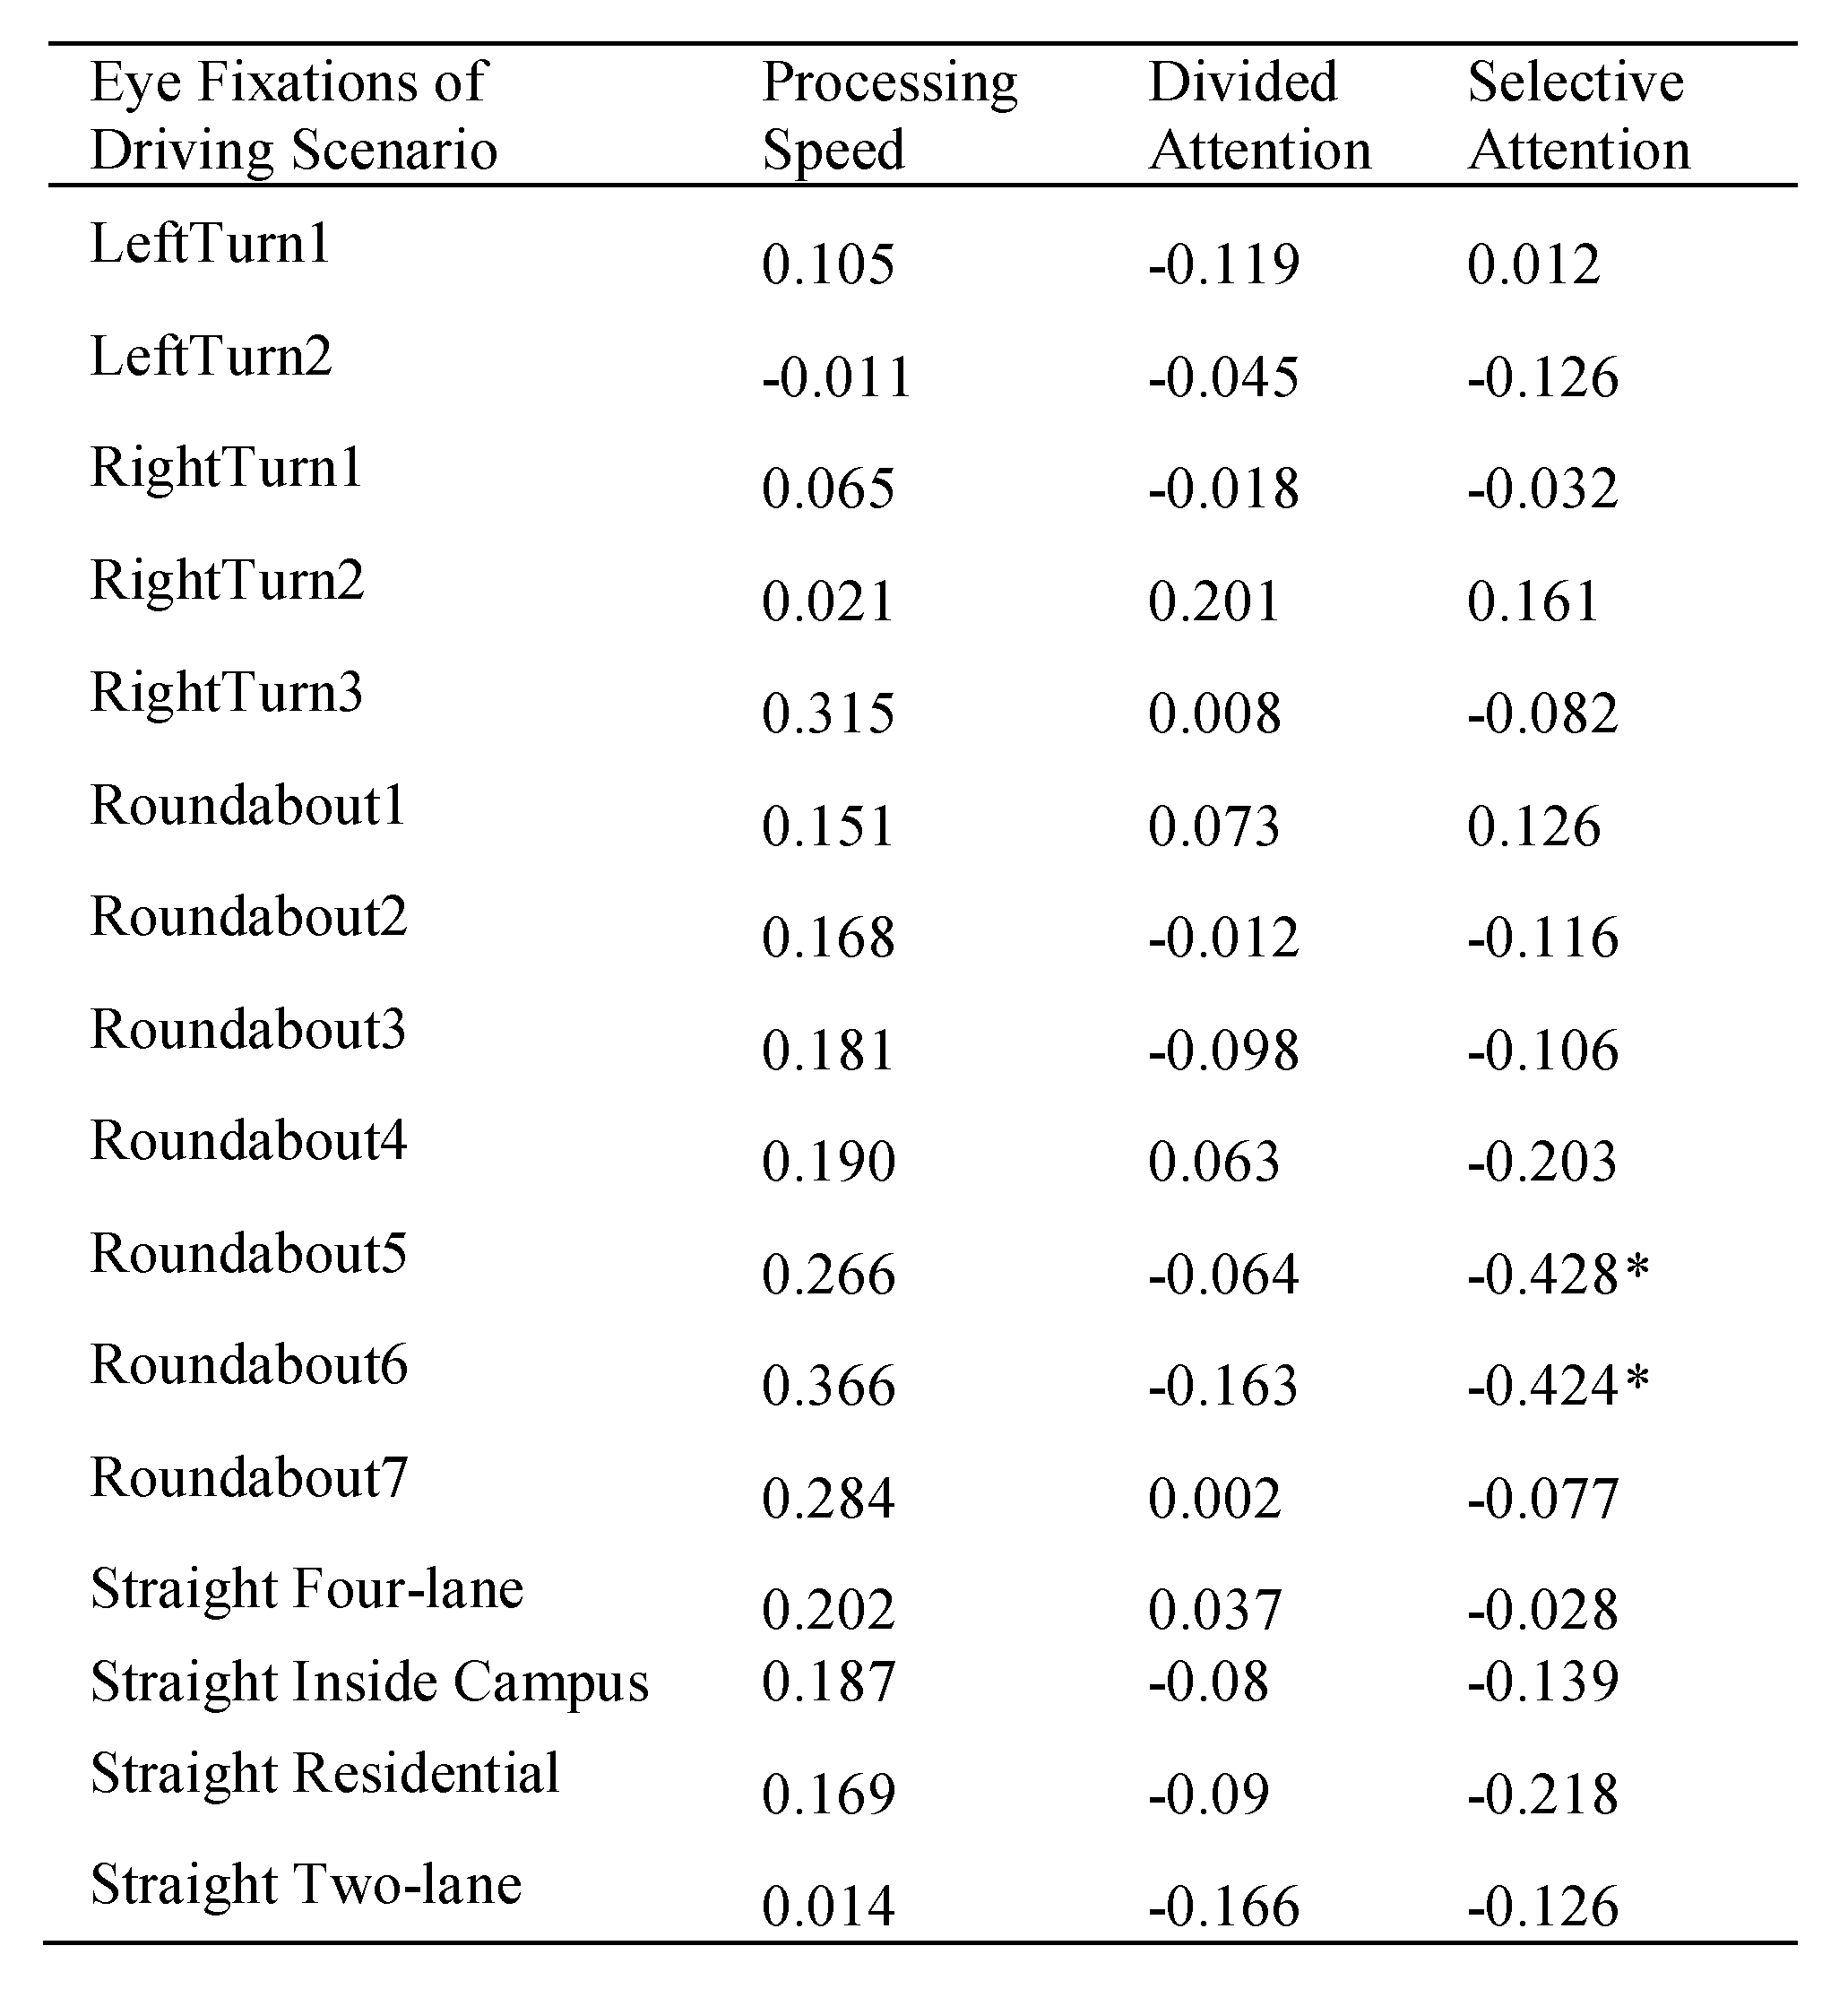
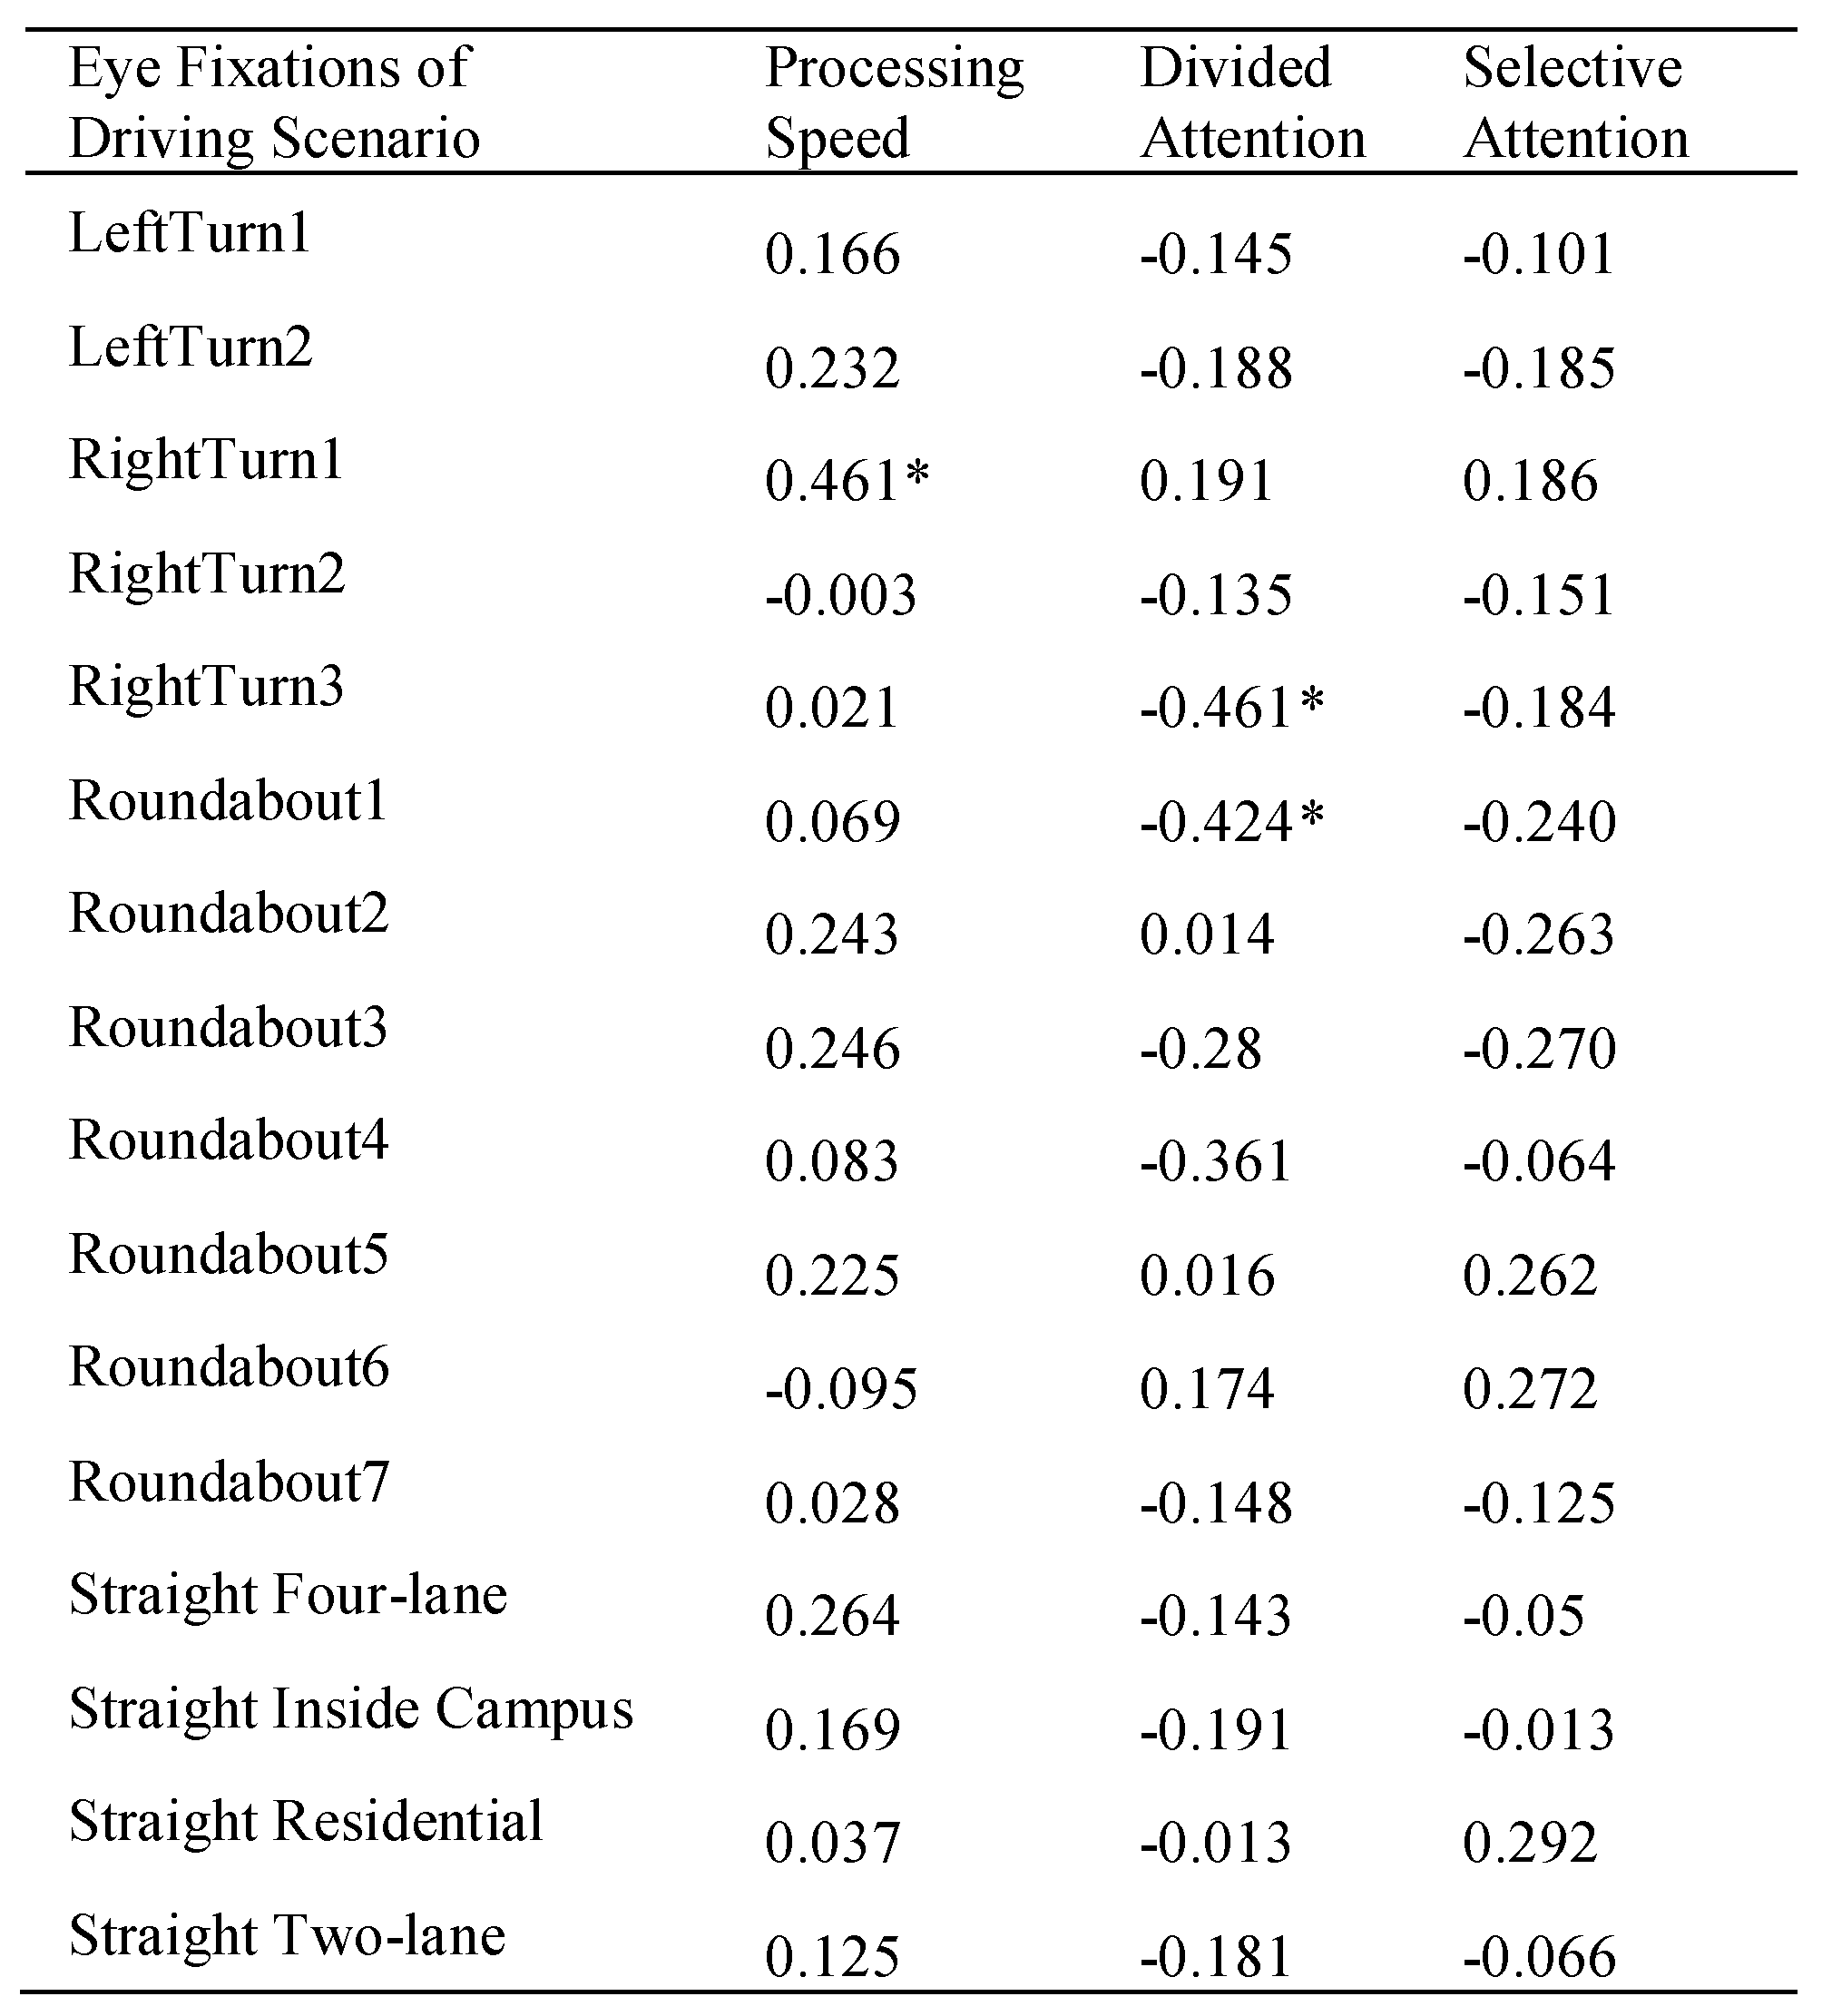
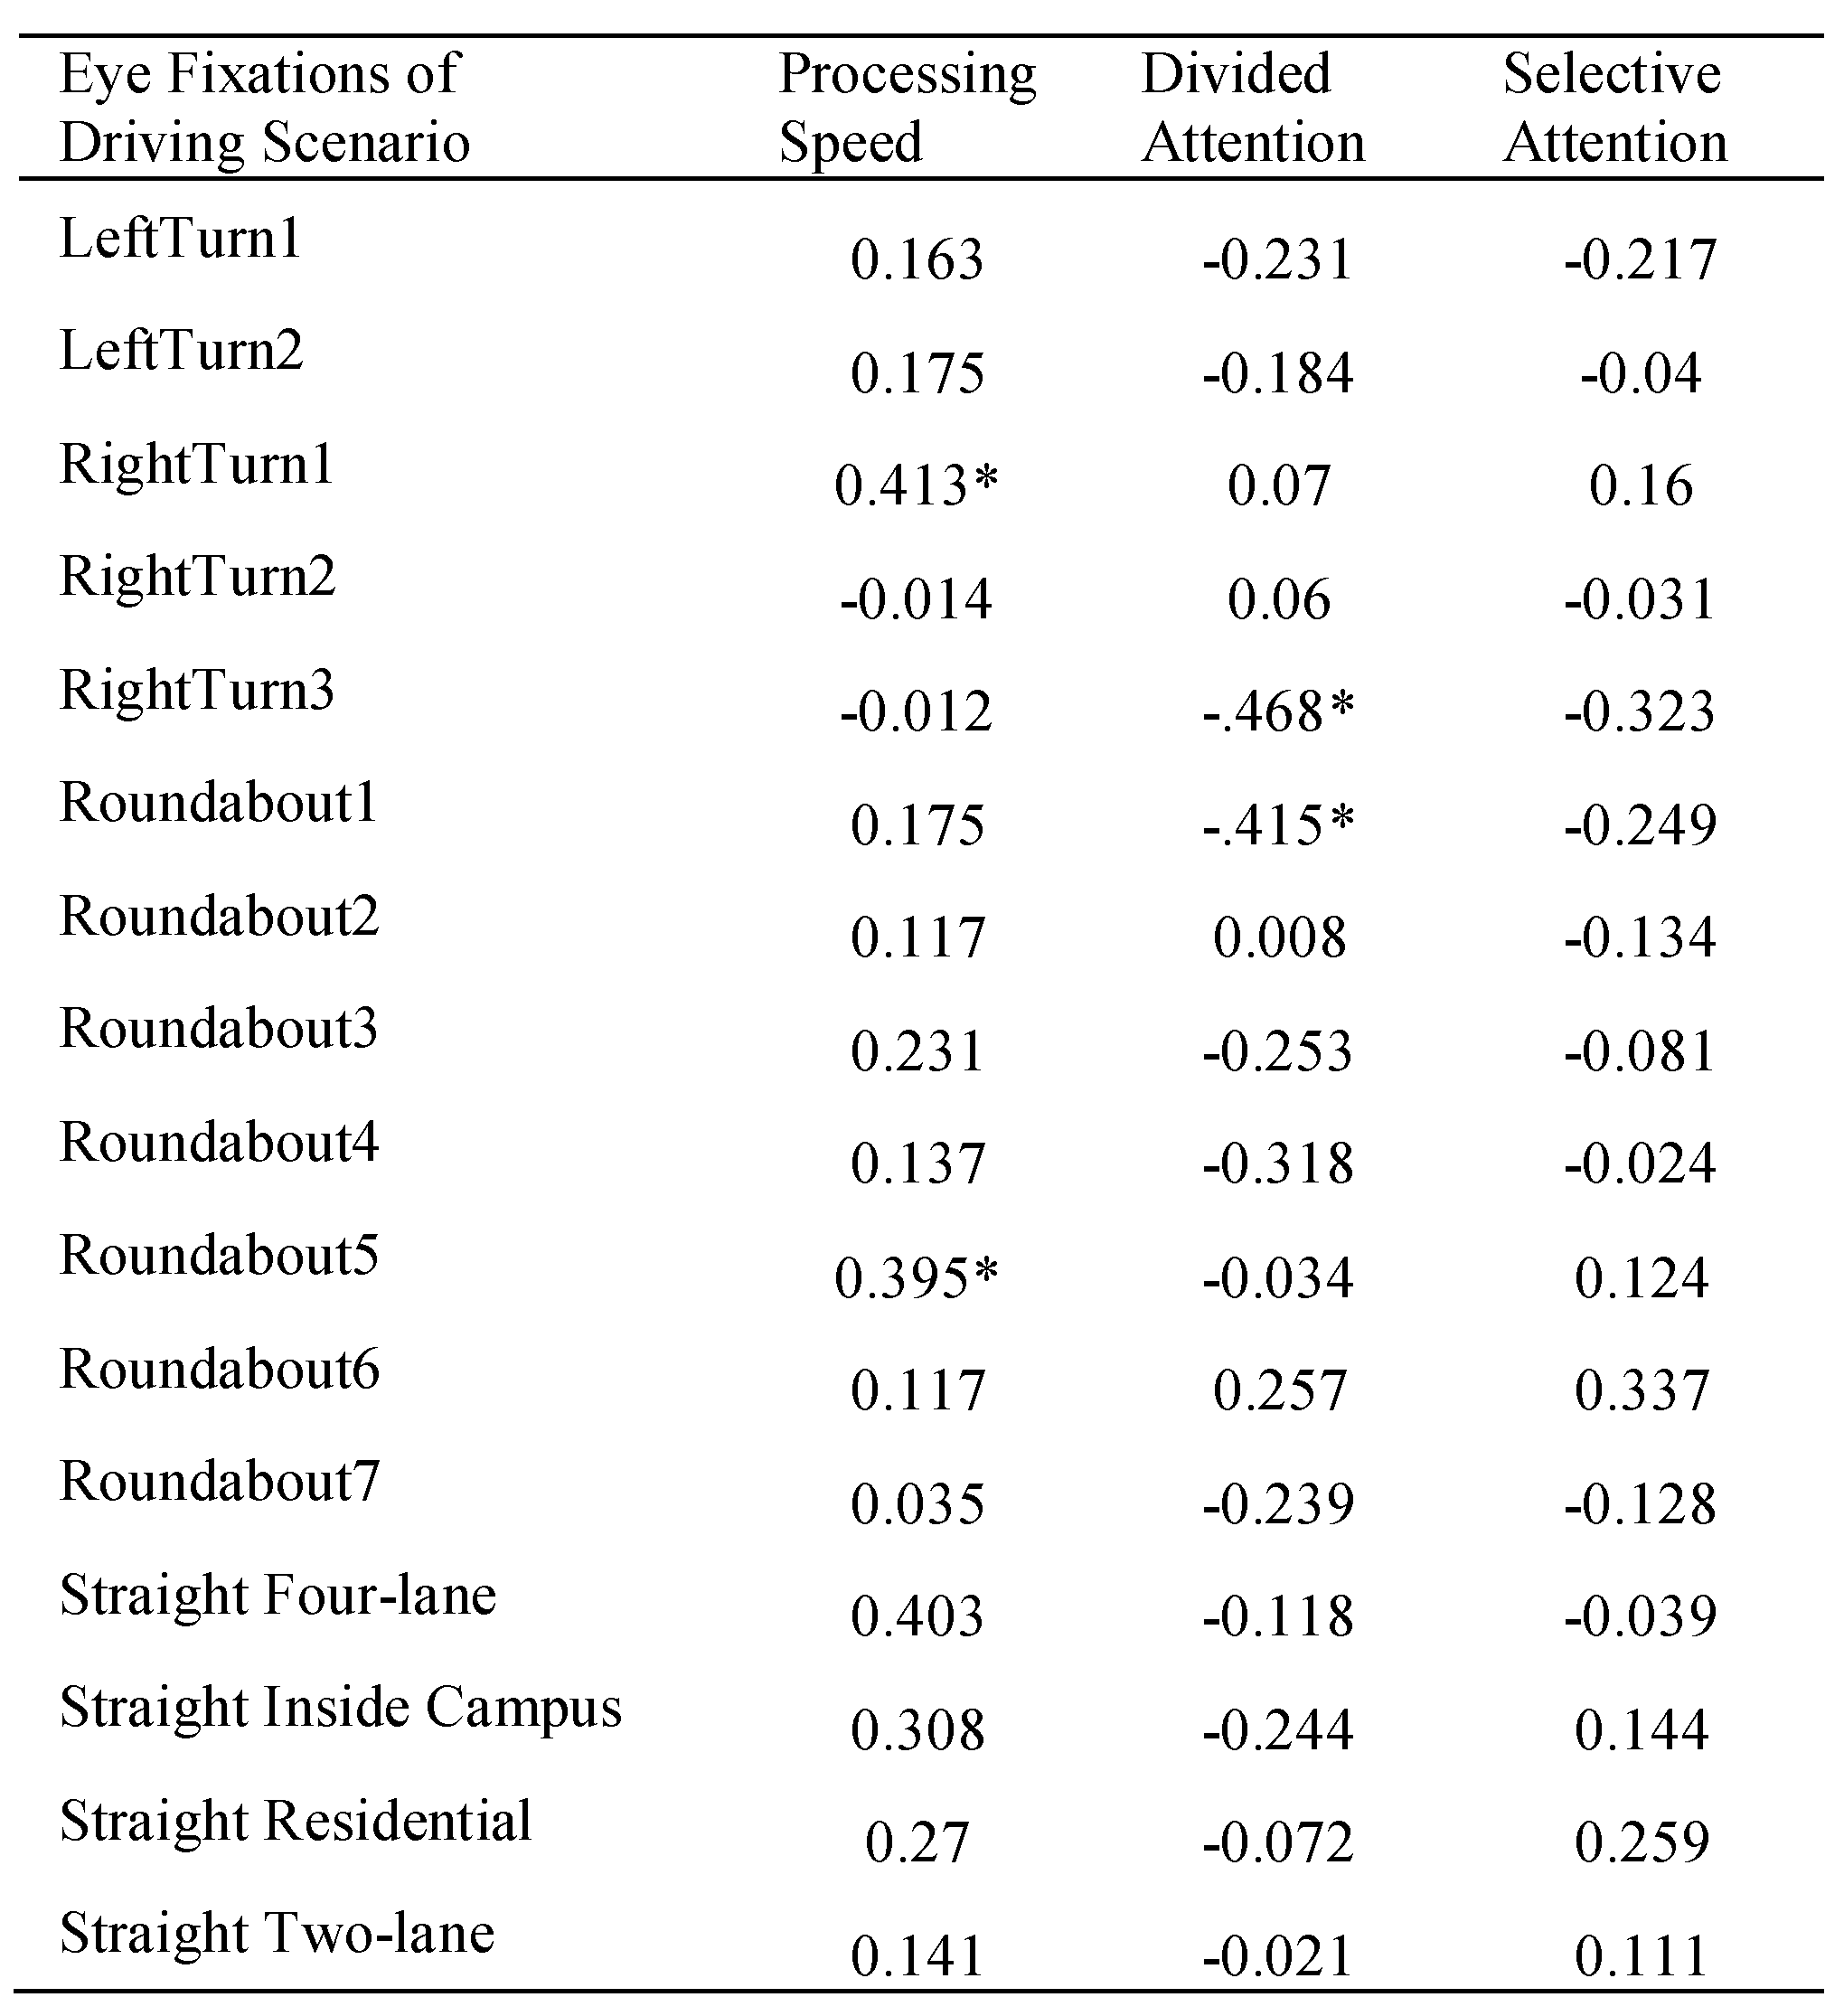
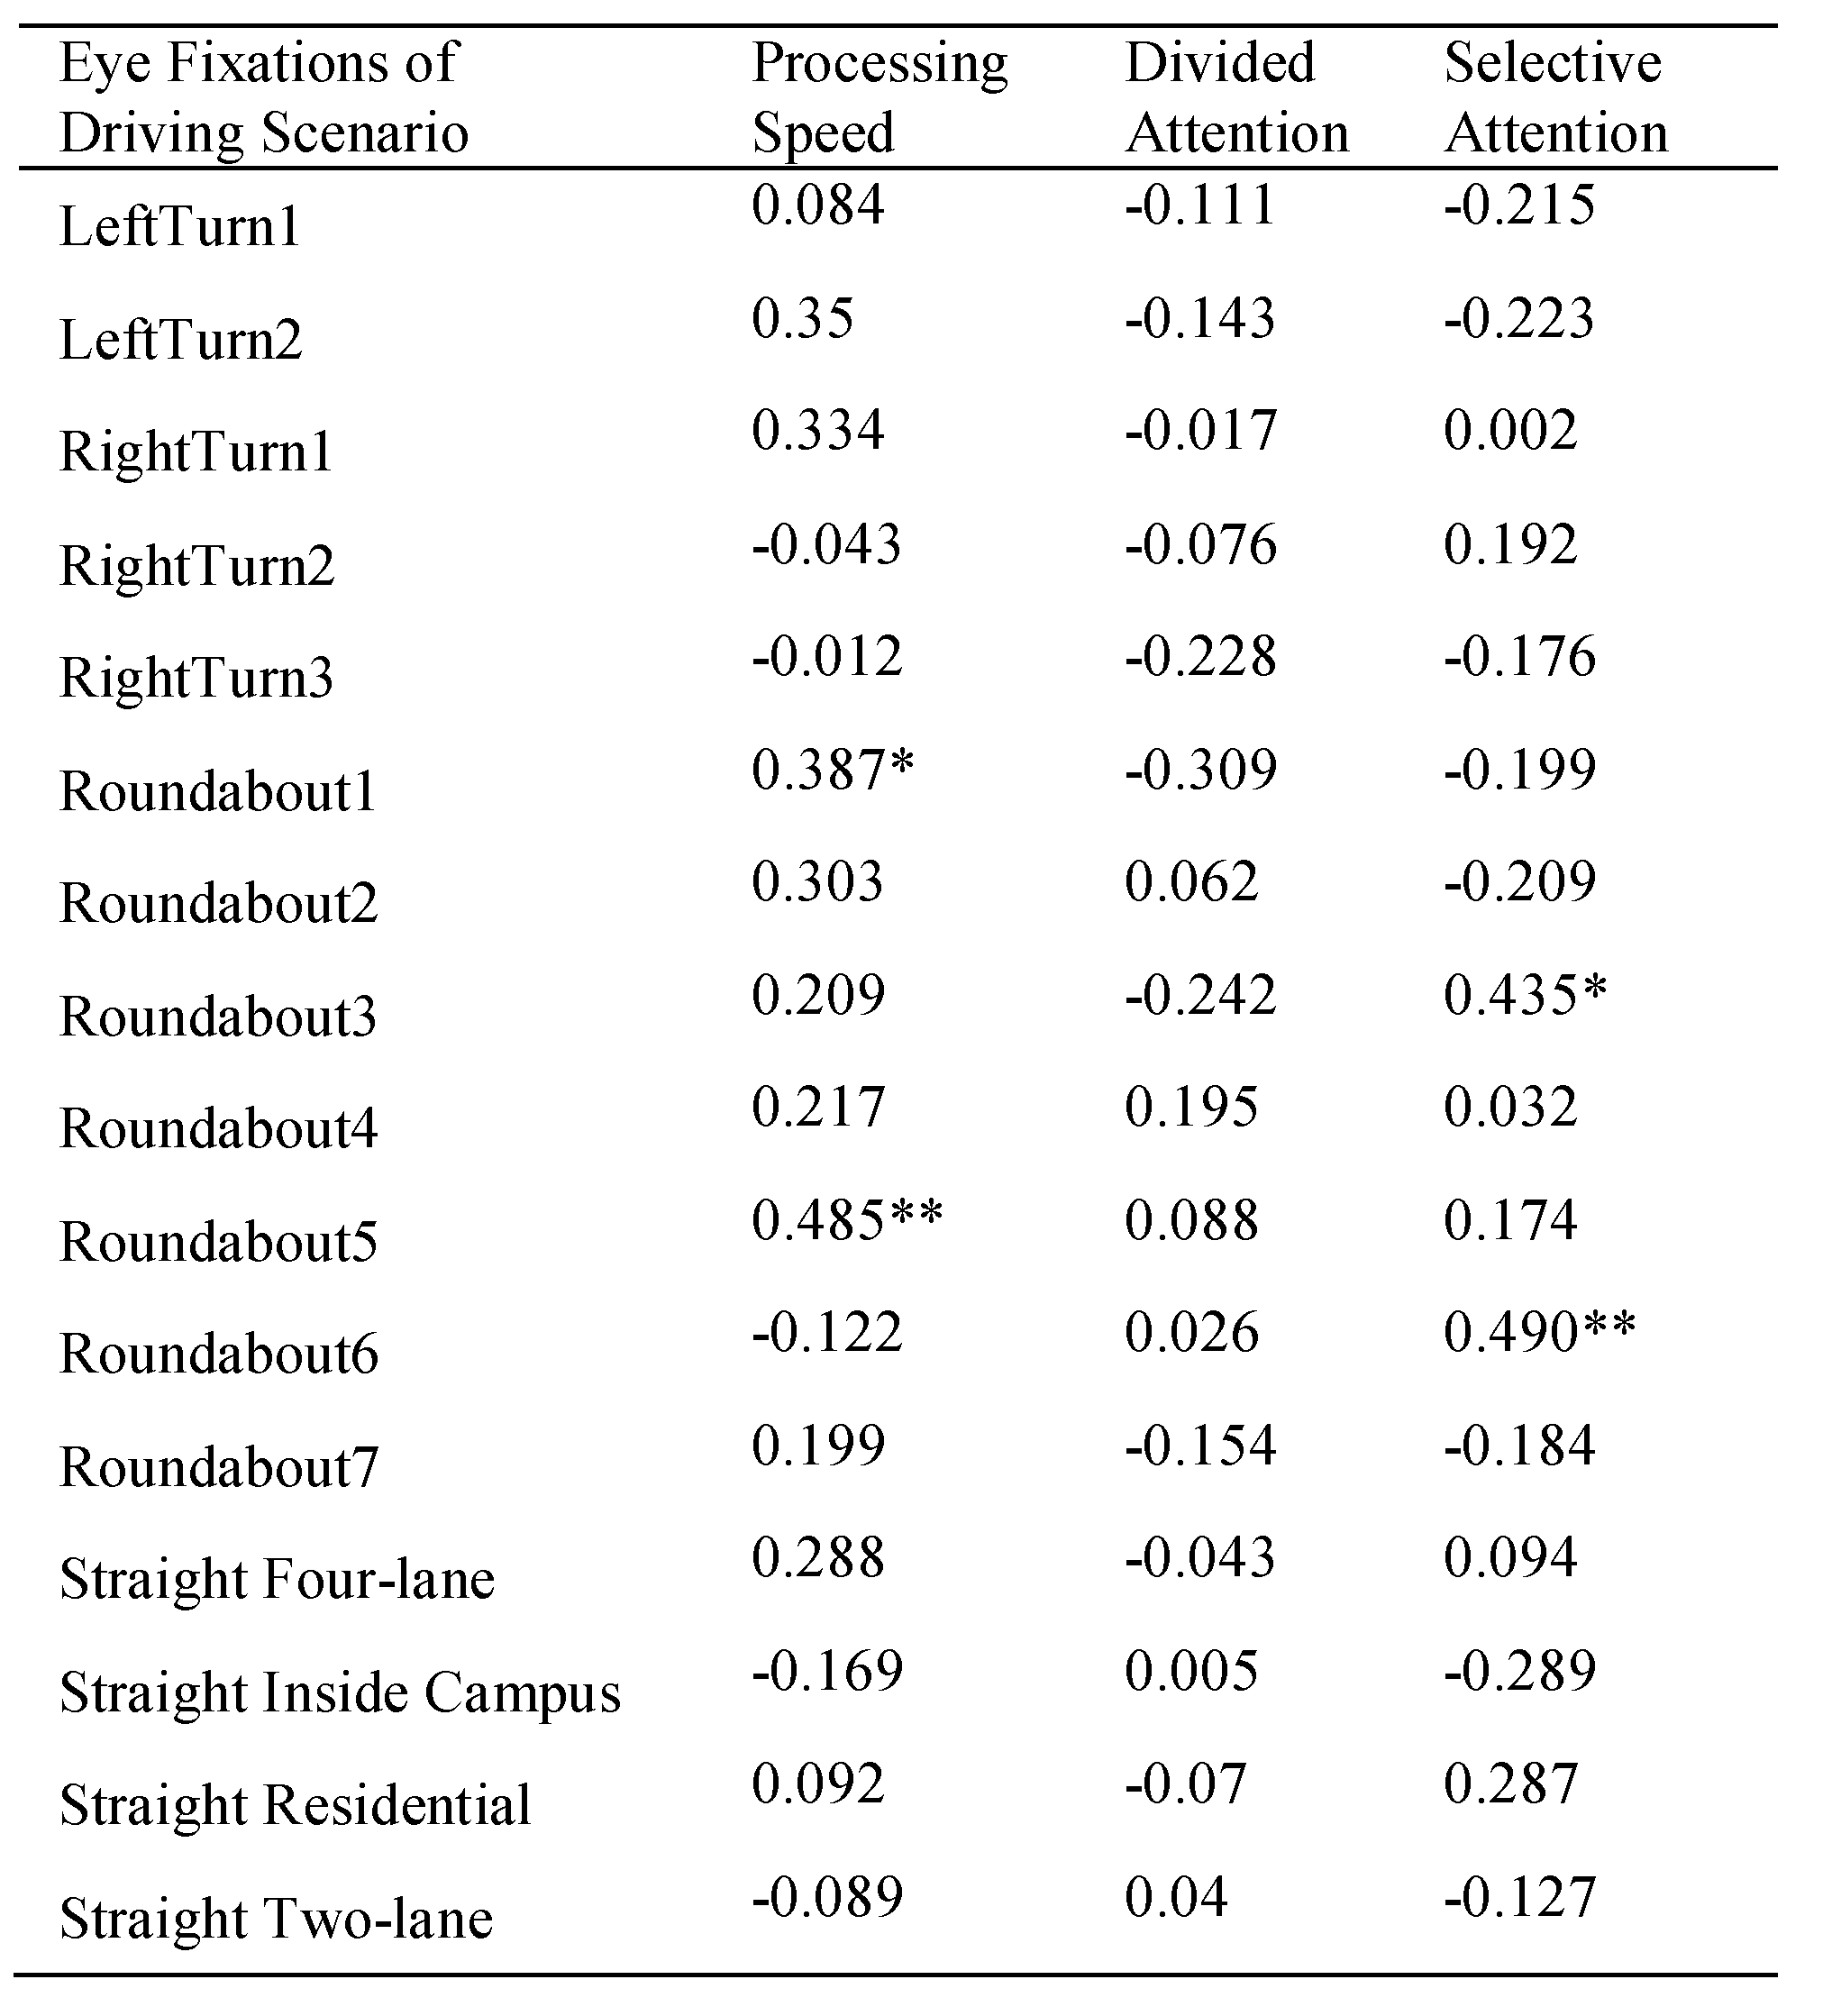
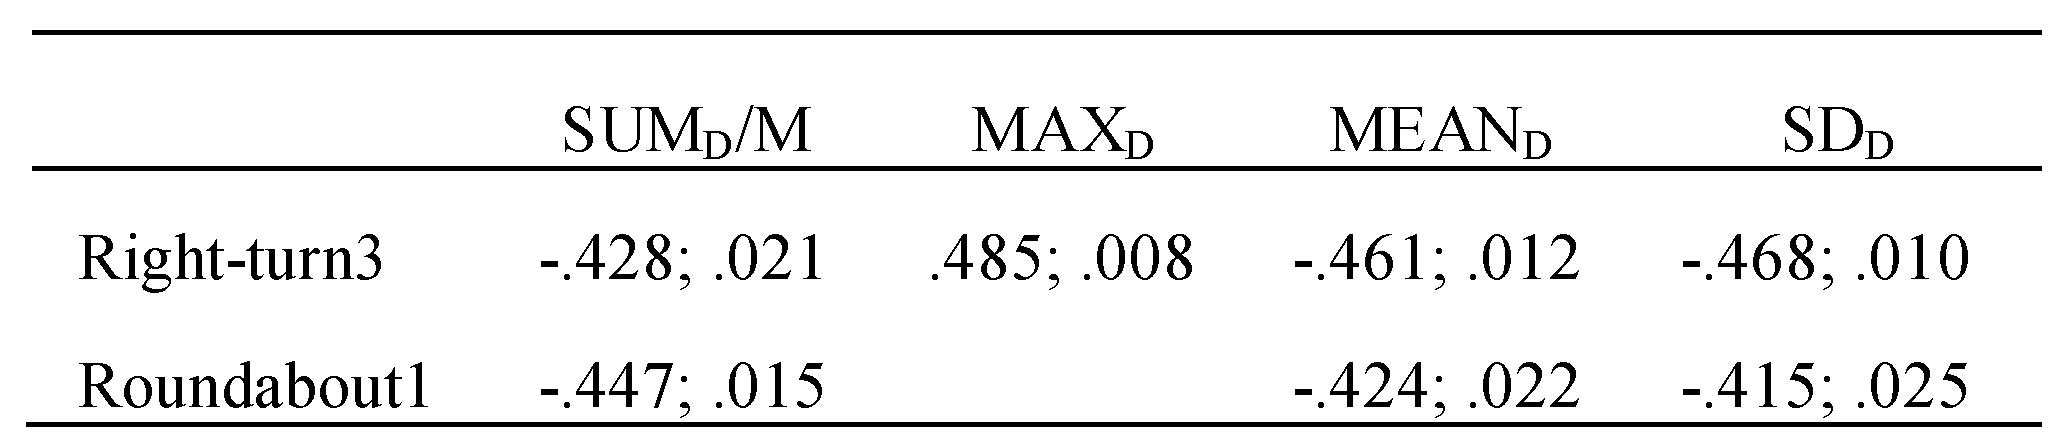
Correlations between Visual Capacity and Oculomotor Behaviour in Older Drivers

Pearson’s Correlations (SPSS®) were computed to investigate the relationship between participants’ oculomotor behaviour (eye fixation movements) and their UFOV subsets’ scores during different driving manoeuvres and sections. The five statistical parameters of eye fixations (SUMDuration/Manoeuvre time, FREQFixation/Manoeuvre time, MaxDuration, MeanDuration and SDDuration) were examined against three UFOV scores (processing speed, divided and selective attention). Table 2, Table 3, Table 4, Table 5 and Table 6 list all the correlation coefficients for the 16 driving sections. The objective was to compare the relationships between older drivers’ eye fixations and their visual attention abilities at different segmented driving sections. Then any hot spots of the relationships can be identified for further in-depth investigation.
In order to identify the hot spots where the eye fixation behaviours are associated with certain visual capacity in older drivers from all the correlation coefficients in Table 2, Table 3, Table 4, Table 5 and Table 6, the following tables (Table 7, Table 8 and Table 9) summarize the critical sections with significant correlations between processing speed, divided attention and selective attention with statistical parameters of eye fixations respectively.
The results in Table 7 show that older drivers’ processing speed was positively correlated to three statistical parameters of eye fixations at the right-turn 1 manoeuvre. The divided attention (Table 8) was associated with four statistical parameters of eye fixation at right-turn 3, and with three statistical parameters at roundabout 5. The selective attention (Table 9) was found to be negatively correlated with the frequency of eye fixations at some roundabout manoeuvres, but positively correlated to the maximum duration at roundabout 5 and 6.

Discussion and Conclusions

In this study, the vision-in-action paradigm was applied in the data collection and analysis, eye fixations were linked to vehicle trajectory so that the driver’s eye movement can be examined in different types of motor behaviour. The driving route was segmented into 16 sections containing four categories of driving manoeuvres (left turn, right turn, straight road and roundabout driving), in order to quantitatively assess older drivers’ oculomotor behaviour at the aggregate level. Eye fixation data were used since fixations reveal optimal placement of fovea, and hence the attention the perceiver intended to demonstrate. Both spatial and statistical analysis were performed to investigate older drivers’ oculomotor behaviour in relation to driving manoeuvres and their visual capacity scores.
The visualisation of individuals’ eye fixation movement presents intuitive and graphical understanding of older drivers’ oculomotor behaviour. It demonstrates an exploratory analysis of the main characteristics of drivers’ eye movement in actual driving. Since eye fixations were mapped along the vehicle trajectory, the spatial-temporal variation of individual drivers’ visual attention allocation can be viewed in detail, or compared with each other. Hazardous behaviour, such as excessive or insufficient eye fixations of individual drivers can be detected, so as to provide advice on the visual searching strategies. In the next phase of research, focus can be given on how oculomotion and locomotion intertwine in space over time (Sun, Xia, Foster, et al., 2016), and on identifying older drivers with underperforming visual-motor coordination.
The results of statistical parameters of eye fixations in different manoeuvres indicate that older drivers performed more frequent eye fixations when manoeuvreing through turns and roundabouts than during straight road driving, as these sections imposed higher visual load and demand on the perceptive and cognitive skills in the driver (Dukic & Broberg, 2012). According to the multiple resource theory (Wicken, 1984), visual workload is associated with the number and complexity of visual information sources (Wickens, 1991), which can explain the reason that typical car crashes for older drivers occur at intersections and turns (Scheiber, 1999). This is also consistent with findings in other studies (Mourant & Rockwell, 1970; Readinger, Chatziastros, Cunningham, Bülthoff, & Cutting, 2002; Senders, Kristofferson, Levison, Dietrich, & Ward, 1967; Wilkie, Kountouriotis, Merat, & Wann, 2010). Participants tended to fixate on certain objects for longer durations during straight road driving. When driving in campus straight ahead, the least frequent fixation was performed, suggesting less active visual activity due to less traffic and easier manoeuvreing. However, there were no significant variations for the other statistical parameters, such as the mean and standard deviation of fixation durations under different manoeuvres and sections. This was also reflected on the individual driver’s eye movement pattern presented in Figure 6.
As for the associations with older drivers’ visual capacity, the correlation coefficients (Table 2, Table 3, Table 4, Table 5 and Table 6) didn’t point out general correlation directions (positive or negative) of relationships in turns, roundabouts and straight driving roads. However, the data indicate stronger correlation strength for relationships between older drivers’ eye movement and visual capacity at roundabouts and intersections than the relationships during straight road driving. Significant correlations were observed in some sections (Table 7, Table 8 and Table 9), those driving manoeuvres and sections were identified in which certain visual abilities played more important roles during the driving. The results showed that older drivers’ processing speed and divided attention were associated with their eye fixations at the complex rightturns: right-turn 1 and 3. The processing speed was positively correlated to three statistical parameters of eye fixations at the right-turn 1 manoeuvre (Table 7), indicating older drivers taking longer fixation time to process visual information at this section, especially for the older drives with a slower processing speed, and they also have higher mean and standard deviation of eye fixation durations.
Figure 10 shows the traffic feature at right-turn 1, the manoeuvre occurs at the intersection without stop or giveway signs, therefore requires quick and more frequent response for information processing (Cynthia Owsley, 2013), which would affect drivers’ eye movements. Anstey et al. (2005) stated that the speed at which visual information processed is an important factor for successfully negotiating difficult or dangerous traffic situations. Similar findings of older drivers processing speed impacting on driving can be also found in Leversen et al. (2013). Driving passing right-turn 3 is another complex manoeuvre (Figure 4 and Figure 5), with turning into the four-lane road at an intersection presenting multiple and complex visual information in the driving scene. In this section, older drivers’ divided attention (Table 8) was found to be negatively correlated to SUMDuration/Manoeuvre time, MeanDuration and SDDuration, and positively associated with MaxDuration. These results infer that older drivers with better divided attention took a longer period of eye fixation, and demonstrated higher mean and deviation values but shorter maximum duration was observed. Similar correlations were found between divided attention and eye fixation at roundabout 1, which is the first turning manoeuvre in the entire driving route. Although it is not a very complex manoeuvre, drivers might have paid more attention driving through.
Selective attention is the visual ability to select the relevant information around the observers and to focus on the objects that require our attention. The results (Table 9) show older drivers’ selective attention to be negatively correlated with the frequency of eye fixations at roundabout 5 and 6. These two roundabouts are of smaller size and located in-campus with a lot of surrounding buildings and trees, which can interfere with driving attention. The correlations indicate that older drivers with poorer selective attention took less eye fixations during these two roundabout manoeuvres. The positive correlations between selective attention and the maximum duration parameter were found at roundabout 3 and 6. Overall, older drivers with lower capacity of selective attention performed less frequent of eye fixations at certain roundabout manoeuvres, they might have compensated with longer durations as their visual search strategy.
Despite the above key findings of both spatial and statistical analysis of eye movement, this study has some limitations: First is the discriminant validity of UFOV® test in the evaluation of visual capacity. Although UFOV has well-recognized reliability and validity in assessing older drivers’ fitness to drive, subset 1 (processing speed) showed small variation in the 30 subjects’ performance, suggesting a low discriminant validity of the subset 1. Secondly some assumptions were not identified in the study perhaps due to the moderate sample size. No significant correlations were found at right-turn 2 and the U-turn at roundabout 7 even though both are manoeuvres requiring high visual workload. Lastly, as a driving behaviour study in general, it tended to address the key eye movement type related to their visual attention: the fixations, yet the fixation identification algorithm simplifies the eye movement types, it was thought that the 16-points calibration before eye tracking and the frame by frame manual identification would minimize the errors and misclassifications in the output.
Future study would investigate more on the sequence of eye movement and integrate the attributes of fixated objects, the distance between the positions of perceiver and the fixated objects can be extracted as an additional spatial attributes. Other driving performance parameters, such as speed and lane control can also be used to examine the effect of older drivers’ oculomotor behaviour. Nevertheless, the spatial and statistical analysis of older drivers’ eye movement presented in this study provide a clear spatial link between older drivers’ oculomotor behaviour and their visual capacity under different driving manoeuvres and sections. It has added to the understanding of how vision is adjusted to regulate locomotion in older drivers. This paper is part of an ongoing investigation into the driving behaviour of older adults with focus on visual scanning behaviour. More in-depth investigations on visual-motor coordination of older drivers will be described in the next contributions.

Acknowledgments

The authors would like to thank Martha Sri Purwaningsih for collecting data, Marina Ciccarelli, Gal Rose and others in the eye tracking analysis team from the School of Occupational Therapy and Social Work, Curtin University, for analysing eye tracking data.
We would like to thank both reviewers for their insightful comments on the paper, as these comments led us to an improvement of the work.

Conflicts of Interest

The authors declare that there is no conflict of interest regarding the publication of this paper.

References

  1. Anstey, K. J., J. Wood, S. Lord, and J. Walker. 2005. Cognitive, sensory and physical factors enabling driving safety in older adults. Clinical psychology review 25, 1: 45–65. [Google Scholar] [CrossRef] [PubMed]
  2. Arrington, K. 2010. Viewpoint eye tracker. Available online: http://www.arringtonresearch.com/Fall2010Catalog.pdf.
  3. B. Sekuler, P. J. B. M. M. A. 2000. Effects of Aging on the Useful Field of View. Exp Aging Res 26, 2: 103–120. [Google Scholar] [CrossRef] [PubMed]
  4. Ball, K., J. D. Edwards, and L. A. Ross. 2007. The impact of speed of processing training on cognitive and everyday functions. Journals of Gerontology—Series B Psychological Sciences and Social Sciences 62, SPEC. ISSUE 1: 19–31. [Google Scholar] [CrossRef]
  5. Bedard, M., E. Leonard, J. McAuliffe, B. Weaver, C. Gibbons, and S. Dubois. 2006. Visual attention and older drivers: The contribution of inhibition of return to safe driving. Exp Aging Res 32, 2: 119–135. [Google Scholar] [CrossRef]
  6. Blignaut, P. 2009. Fixation identification: The optimum threshold for a dispersion algorithm. Attention, Perception, & Psychophysics 71, 4: 881–895. [Google Scholar] [CrossRef]
  7. Boot, W. R., C. Stothart, and N. Charness. 2014. Improving the Safety of Aging Road Users: A MiniReview. Gerontology 60, 1: 90–96. [Google Scholar] [CrossRef]
  8. Charlton, J. L., B. Fildes, S. Koppel, C. Muir, J. Scully, D. Andrea, and M. Hammer. 2005. Visual search patterns in older and younger drivers. Paper presented at the Proceedings Australasian Road Safety Research Policing Education Conference. [Google Scholar]
  9. Clarke, D., P. Ward, C. Bartle, and W. Truman. 2010. Older drivers’ road traffic crashes in the UK. Accident analysis and prevention 42, 4: 1018–1024. [Google Scholar] [CrossRef]
  10. Classen, S., Y. Wang, A. M. Crizzle, S. M. Winter, and D. N. Lanford. 2013. Predicting older driver on-road performance by means of the useful field of view and trail making test part b. American Journal of Occupational Therapy 67, 5: 574–582. [Google Scholar] [CrossRef]
  11. Cohen, A. S. 1977. Is the duration of an eye fixation a sufficient criterion referring to information input? Perceptual and motor skills. [Google Scholar] [CrossRef]
  12. Cohen, A. S., and H. Studach. 1977. Eye movements while driving cars around curves. Perceptual and motor skills 44, 3 I: 683–689. [Google Scholar] [CrossRef]
  13. Cooper, J. M., N. Medeiros-Ward, and D. L. Strayer. 2013. The impact of eye movements and cognitive workload on lateral position variability in driving. Human Factors 55, 5: 1001–1014. [Google Scholar] [CrossRef] [PubMed]
  14. Dukic, T., and T. Broberg. 2012. Older drivers’ visual search behaviour at intersections. Transportation Research Part F: Traffic Psychology and Behaviour 15, 4: 462–470. [Google Scholar] [CrossRef]
  15. Edwards, J. D., L. A. Ross, V. G. Wadley, O. J. Clay, M. Crowe, D. L. Roenker, and K. K. Ball. 2006. The useful field of view test: Normative data for older adults. Arch Clin Neuropsychol 21, 4: 275–286. [Google Scholar] [CrossRef]
  16. Falkmer, T., J. Dahlman, T. Dukic, A. Bjällmark, and M. Larsson. 2008. Fixation identification in centroid versus start-point modes using eye-tracking data. Perceptual and motor skills 106, 3: 710–724. [Google Scholar] [CrossRef]
  17. Falkmer, T., and N. P. Gregersen. 2001. Fixation patterns of learner drivers with and without cerebral palsy (CP) when driving in real traffic environments. Transportation Research Part F: Traffic Psychology and Behaviour 4, 3: 171–185. [Google Scholar] [CrossRef]
  18. Transportation Research Part F: Traffic Psychology and Behaviour 4, 3: 171–185. [CrossRef]
  19. Falkmer, T., and N. P. Gregersen. 2005. A comparison of eye movement behavior of inexperienced and experienced drivers in real traffic environments. Optometry and Vision Science 82, 8: 732–739. [Google Scholar] [CrossRef]
  20. Fancello, G., C. Pinna, and P. Fadda. 2013. Visual perception of the roundabout in old age. In WIT Transactions on the Built Environment. Vol. 130, pp. 721–732. [Google Scholar] [CrossRef]
  21. Frederick, S., C. Katarzyna, and S. Brian. 2008. The Amorphous Fixation Measure Revisited: With Applications to Autism. Paper presented at the 30th Annual Meeting of the Cognitive Science Society, Washington, DC. [Google Scholar]
  22. Glisky, E. L. 2007. Changes in cognitive function in human aging. In Brain aging: Models, methods, and mechanisms. CRC Press: pp. 3–20. [Google Scholar]
  23. Hamel, J., S. De Beukelaer, A. Kraft, S. Ohl, H. J. Audebert, and S. A. Brandt. 2013. Age-related changes in visual exploratory behavior in a natural scene setting. Frontiers in Psychology 4: 339. [Google Scholar] [CrossRef]
  24. Itkonen, T., J. Pekkanen, and O. Lappi. 2015. Driver Gaze Behavior Is Different in Normal Curve Driving and when Looking at the Tangent Point. PLoS ONE 10, 8: e0135505. [Google Scholar] [CrossRef]
  25. Konstantopoulos, P., P. Chapman, and D. Crundall. 2012. Exploring the ability to identify visual search differences when observing drivers’ eye movements. Transportation Research Part F: Traffic Psychology and Behaviour 15, 3: 378–386. [Google Scholar] [CrossRef]
  26. Land, M. F., and D. N. Lee. 1994. Where we look when we steer. Nature 369, 6483: 742–744. [Google Scholar] [CrossRef] [PubMed]
  27. Lappi, O. 2013. Eyes on the Road: Eye Movements and the Visual Control of Locomotion in Curve Driving. Available online: http://urn.fi/URN:ISBN:978-952-10-9646-4.
  28. Lappi, O. 2015. Eye tracking in the wild: The good, the bad and the ugly. Journal of Eye Movement Research 8, 5. [Google Scholar] [CrossRef]
  29. Lappi, O., and E. Lehtonen. 2013. Eye-movements in real curve driving: Pursuit-like optokinesis in vehicle frame of reference, stability in an allocentricreference coordinate system. Journal of Eye Movement Research 6, 1. [Google Scholar] [CrossRef]
  30. Lappi, O., J. Pekkanen, and T. H. Itkonen. 2013. Pursuit eye-movements in curve driving differentiate between future path and tangent point models. PLoS ONE 8, 7: e68326. [Google Scholar] [CrossRef]
  31. Lee, J. D. 2008. Fifty years of driving safety research. Human Factors 50, 3: 521–528. [Google Scholar] [CrossRef]
  32. Lees, M. N., J. D. Cosman, J. D. Lee, N. Fricke, and M. Rizzo. 2010. Translating cognitive neuroscience to the driver’s operational environment: A neuroergonomic approach. The American Journal of Psychology 123, 4: 391–411. [Google Scholar] [CrossRef]
  33. Lehtonen, E., O. Lappi, I. Koirikivi, and H. Summala. 2014. Effect of driving experience on anticipatory look-ahead fixations in real curve driving. Accident Analysis & Prevention 70, 0: 195–208. [Google Scholar] [CrossRef]
  34. Lehtonen, E., O. Lappi, H. Kotkanen, and H. Summala. 2013. Look-ahead fixations in curve driving. Ergonomics 56, 1: 34–44. [Google Scholar] [CrossRef]
  35. Leversen, J. S. R., B. Hopkins, and H. Sigmundsson. 2013. Ageing and driving: Examining the effects of visual processing demands. Transportation Research Part F: Traffic Psychology and Behaviour 17: 1–4. [Google Scholar] [CrossRef]
  36. Marmeleira, J., I. Ferreira, F. Melo, and M. Godinho. 2012. Associations of Physical Activity with Driving-Related Cognitive Abilities in Older Drivers: An Exploratory Study1,2. Perceptual and motor skills 115, 2: 521–533. [Google Scholar] [CrossRef]
  37. McGwin, J. G., and D. B. Brown. 1999. Characteristics of traffic crashes among young, middle-aged, and older drivers. Accident Analysis & Prevention 31, 3: 181–198. [Google Scholar] [CrossRef]
  38. Min, Y.-K., B.-C. Min, and B. Kim. 2013. Changes in eye movements and driving performance at different intersections as a function of age and turn type. International Journal of Industrial Ergonomics 43, 4: 342–349. [Google Scholar] [CrossRef]
  39. Molnar, F. J., S. C. Marshall, M. Man-Son-Hing, K. G. Wilson, A. M. Byszewski, and I. Stiell. 2007. Acceptability and concurrent validity of measures to predict older driver involvement in motor vehicle crashes: An Emergency Department pilot case-control study. Accident analysis and prevention 39, 5: 10561063. [Google Scholar] [CrossRef]
  40. Mourant, R. R., and T. H. Rockwell. 1970. Mapping eyemovement patterns to the visual scene in driving: An exploratory study. Human Factors: The Journal of the Human Factors and Ergonomics Society 12, 1: 81–87. [Google Scholar] [CrossRef]
  41. Nakayasu, H., T. Miyoshi, N. Kondo, H. Aoki, and P. Patterson. 2011. Analysis of Driver Perceptions and Behavior When Driving in an Unfamiliar Traffic Regulation. JACIII 15, 8: 1039–1048. [Google Scholar]
  42. Owsley, C. 2013. Visual processing speed. Vision Research 90: 52–56. [Google Scholar] [CrossRef]
  43. Owsley, C., K. Ball, and D. M. Keeton. 1995. Relationship between visual sensitivity and target localization in older adults. Vision Research 35, 4: 579–587. [Google Scholar] [CrossRef]
  44. Owsley, C., K. Ball, M. E. Sloane, D. L. Roenker, and J. R. Bruni. 1991. Visual/cognitive correlates of vehicle accidents in older drivers. Psychology and aging 6, 3: 403–415. [Google Scholar] [CrossRef]
  45. Rapoport, M. J., G. Naglie, K. Weegar, A. Myers, D. Cameron, A. Crizzle, and S. Marshall. 2013. The relationship between cognitive performance, perceptions of driving comfort and abilities, and selfreported driving restrictions among healthy older drivers. Accident Analysis & Prevention 61: 288–295. [Google Scholar] [CrossRef]
  46. Readinger, W. O., A. Chatziastros, D. W. Cunningham, H. H. Bülthoff, and J. E. Cutting. 2002. Gazeeccentricity effects on road position and steering. Journal of Experimental Psychology: Applied 8, 4: 247–258. [Google Scholar]
  47. Richardson, E. D., and R. A. Marottoli. 2003. Visual attention and driving behaviors among communityliving older persons. Journals of Gerontology—Series A Biological Sciences and Medical Sciences 58, 9: 832–836. [Google Scholar] [CrossRef] [PubMed]
  48. Sagberg, F., Selpi, G. F. Bianchi Piccinini, and J. Engstrom. 2015. A Review of Research on Driving Styles and Road Safety. Hum Factors 57, 7: 1248–1275. [Google Scholar] [CrossRef] [PubMed]
  49. Salvucci, D. D., and J. H. Goldberg. 2000. Identifying fixations and saccades in eye-tracking protocols. Paper presented at the Proceedings of the 2000 symposium on Eye tracking research & applications, Palm Beach Gardens, Florida, USA. [Google Scholar] [CrossRef]
  50. Schütz, A. C., D. I. Braun, and K. R. Gegenfurtner. 2011. Eye movements and perception: A selective review. Journal of Vision 11, 5: 9–9. [Google Scholar] [CrossRef] [PubMed]
  51. Schweizer, T. A., K. Kan, Y. Hung, F. Tam, G. Naglie, and S. Graham. 2013. Brain activity during driving with distraction: An immersive fMRI study. Frontiers in Human Neuroscience(FEB). [Google Scholar] [CrossRef]
  52. Senders, J. W., A. Kristofferson, W. Levison, C. Dietrich, and J. Ward. 1967. The attentional demand of automobile driving. Highway research record (195). [Google Scholar]
  53. Smither, J. A. A., M. Mouloua, P. A. Hancock, J. Duley, R. Adams, and K. Latorella. 2004. Aging and driving Part I: Implications of perceptual and physical changes. Human Performance Situation Awareness and Automation: Current Research and Trends, Vol. 1–2, pp. 315–319. [Google Scholar]
  54. Sun, Q., R. Odolinski, J. Xia, J. Foster, T. Falkmer, and H. Lee. 2017. Validating the efficacy of GPS tracking vehicle movement for driving behaviour assessment. Travel Behaviour and Society 6, 32–43. [Google Scholar] [CrossRef]
  55. Sun, Q., J. Xia, N. Nadarajah, T. Falkmer, J. Foster, and H. Lee. 2016. Assessing drivers’ visual-motor coordination using eye tracking, GNSS and GIS: A spatial turn in driving psychology. Journal of Spatial Science, 1–18. [Google Scholar] [CrossRef]
  56. Sun, Q., J. C. Xia, J. Foster, T. Falkmer, and H. Lee. 2016. Framework for investigating older adults’ driving behaviours and the underlying cognitive mechanisms . Paper presented at the World Conference on Transport Research—WCTR 2016, Shanghai, China. [Google Scholar]
  57. Tsai, Y. F., E. Viirre, C. Strychacz, B. Chase, and T. P. Jung. 2007. Task performance and eye activity: Predicting behavior relating to cognitive workload. Aviat Space Environ Med 78, 5 Suppl: B176–185. [Google Scholar]
  58. Underwood, G., P. Chapman, N. Brocklehurst, J. Underwood, and D. Crundall. 2003. Visual attention while driving: Sequences of eye fixations made by experienced and novice drivers. Ergonomics 46, 6: 629–646. [Google Scholar] [CrossRef]
  59. Wann, J. P., and D. K. Swapp. 2000. Why you should look where you are going. Nat Neurosci 3, 7: 647648. [Google Scholar] [CrossRef]
  60. Wickens, C. D. 1991. Processing resources and attention. Multiple-task performance, 3–34. [Google Scholar]
  61. Wilkie, R., G. Kountouriotis, N. Merat, and J. Wann. 2010. Using vision to control locomotion: Looking where you want to go. Experimental brain research 204, 4: 539–547. [Google Scholar] [CrossRef] [PubMed]
  62. Wood, J. M., and C. Owsley. 2014. Useful Field of View Test. Gerontology 60, 4: 315–318. [Google Scholar] [CrossRef] [PubMed]
Figure 1. Arrington viewpoint headmounted eye tracker.
Jemr 09 00030 g001
Figure 2. The spatial distribution of eye fixation behaviour at roundabout U-turn from driver A.
Jemr 09 00030 g002
Figure 3. The spatial distribution of eye fixation behaviour at roundabout U-turn from driver B.
Jemr 09 00030 g003
Figure 4. The spatial distribution of eye fixation behaviour at right-turn from driver A.
Jemr 09 00030 g004
Figure 5. The spatial distribution of eye fixation behaviour at right-turn by driver B.
Jemr 09 00030 g005
Figure 7. The statistics of SUMDuration/Manoeuvre time, and FREQFixation/Manoeuvre time at different driving manoeuvres and sections.
Jemr 09 00030 g007
Figure 8. The statistics of the maximum, mean and standard deviation of eye fixations durations at different driving manoeuvres and sections.
Jemr 09 00030 g008
Figure 9. The spatial distribution of eye fixation behaviour at a roundabout U-turn and straight road driving from one driver.
Jemr 09 00030 g009
Figure 10. The driving manoeuvre at right-turn 1 and the eye fixation movement by an individual driver as an example.
Jemr 09 00030 g010
Table 1. Descriptive statistics of UFOV scores (unit as milliseconds).
Jemr 09 00030 i001
Table 2. Correlation coefficients between visual capacity and fixation duration (SUMDuration/Manoeuvre time) at different driving scenarios (*p<.05; **p<.01, 2-tailed).
Jemr 09 00030 i002
Table 3. Correlation coefficients between visual capacity and fixation frequency and manoeuvre time at different driving scenarios (*p<.05; **p<.01, 2-tailed).
Jemr 09 00030 i003
Table 4. Correlation coefficients between visual capacity and mean fixation duration at different driving scenarios (*p<.05; **p<.01, 2tailed).
Jemr 09 00030 i004
Table 5. Correlation coefficients between visual capacity and standard duration of fixation duration at different driving scenarios (*p<.05; **p<.01, 2-tailed).
Jemr 09 00030 i005
Table 6. Correlation coefficients between visual capacity and maximum fixation duration at different driving scenarios (*p<.05; **p<.01, 2-tailed).
Jemr 09 00030 i006
Table 7. Significant correlations (r, p-value) summary between processing speed and eye fixations parameters.
Jemr 09 00030 i007
Table 8. Significant correlations (r, p-value) summary between divided attention and eye fixations parame-ters.
Jemr 09 00030 i008
Table 9. Significant correlations (r, p-value) summary between selective attention and eye fixations param-eters.
Jemr 09 00030 i009

