Abstract
Previous cross-cultural studies have found that cultures can shape eye movement during scene perception, but those researches have been limited to the West. This study recruited Chinese and African students to document cultural effects on two phases of scene perception. In the free-viewing phase, Africans fixated more on the focal objects than Chinese, while Chinese paid more attention to the backgrounds than Africans especially on the fourth and fifth fixations. In the recognition phase, there was no cultural difference in perception, but Chinese recognized more objects than Africans. We conclude that cultural differences exist in scene perception when there is no explicit task and more clearly in its later period, and that some differences may be hidden in deeper processes (e.g., memory) during an explicit task.
Introduction
Culture may be defined at macro, ecological, and societal levels in terms of values (general goal states) and practices (behavioral routines often designed to achieve the values) that are collectively distributed and, to an important extent, shared (Kitayama & Uskul, 2011; Edel, 1954; Shweder & Bourne, 1982). Cultural differences can be seen in every aspect of a person’s social life, like food and language. Cultural differences also have been found in perception, for example in face recognition (Miellet, Vizioli, He, Zhou, & Caldara, 2013; Ng, Steele, & Sasaki, 2016), facial expressions (Jack, Blais, Scheepers, Schyns, & Caldara, 2009; Jack, Sun, Delis, Garrod, & Schyns, 2016), and psychological esthetics (Masuda, Gonzalez, Kwan, & Nisbett, 2008). Here we test whether there are cultural differences in scene perception, namely perception of the real-world environment, with the scene being composed of background and object (Henderson & Hollingworth, 1999).
Based on the comparison of East and West, researchers conducting cross-culture studies on scene perception have different views. One perspective holds that Asians look at scenes differently from the way Westerners do, with Asians paying more attention to the focal objects than the backgrounds and being more sensitive to contextual changes. This cultural difference has been documented in many studies. For example, Masuda and Nisbett (2001) asked Japanese and U.S. participants to watch a video about fish swimming, and then to describe what they saw and to recognize the fish in different backgrounds. They found that, compared with U.S. participants, Japanese viewers reported seeing more fish in the background and recognized fewer fish when the background was new. Similar results were also found in a perceptual judgment study based on a framed-line test (Kitayama, Duffy, Kawamura, & Larsen, 2003), a change blindness study (Masuda & Nisbett, 2006), an eye movement study (Chua, Boland, & Nisbett, 2005), and a study on perception in infants (Waxman et al., 2016) and children 7–9 years old (Senzaki, Masuda, Takada, & Okada, 2016). The assumption is that culture (e.g., cultural experiences, cultural values, social structures and social practices) might lead to automatic and inflexible differences in the mechanisms supporting stimulus perception, so different attention patterns are shown in scene perception (Nisbett & Norenzayan, 2002; Nisbett & Miyamoto, 2005).
Other research has not found cultural differences in scene perception. Rayner et al. (2007) reported that there was little evidence that culture affected scene perception, and Miellet et al. (2010) also found that culture did not impact extrafoveal information use in natural scenes. Even when the materials were the same as those used by Chua et al. (2005) or the scenes were unusual or strange, there were still no differences between Chinese and U.S. participants (Evans, Rotello, Li, & Rayner, 2009; Rayner, Castelhano, & Yang, 2009). Their studies showed that the salient area, for example an unusual area, and focal objects would attract more attention quickly, consistent with the stimulus-driven processing theory in scene perception (Evans et al., 2009; Miellet et al., 2010; Rayner et al., 2009). From this perspective, the assumption is that cultural differences do not influence processing at the basic level of oculomotor control.
From the above studies, we see there are conflicts about culture affecting scene perception. These conflicts may be due in part to differences in materials and definitions used across studies. Moreover, the previous scene perception studies were limited to participants from West and East Asia. It is in this context that we designed the current study.
Our study’s first aim was to test whether there is a cultural difference between Chinese and Africans in scene perception as shown in eye movement data. According to Nisbett and his colleagues (Nisbett & Miyamoto, 2005; Nisbett & Norenzayan, 2002), the answer would be yes, because Chinese and Africans share the cultural value of collectivism (Triandis, 1989; Triandis, Bontempo, Villareal, Asai, & Lucca, 1988); that is, people pay more attention to the group such as the family or the tribe than to the individual. Thus, when it comes to scene perception, they would allocate more attention to background information than to the focal object. But there are also important differences between these two groups. First, Chinese have a higher score on collectivism than Africans (Triandis, 1989). This may be because China is a socialist country with a high regard for Confucianism, the socio-cultural traditions that put groups’ interests above an individual’s. Second, Africa used to be a colony of the West, so Africans may be relatively more influenced than Chinese by the Western value of individualism. Finally, Africans are more likely than Chinese to live in an animal husbandry environment. In that environment, the relationships between people may be not so important (White, 1943). Because many Chinese live in an agricultural environment, they are likely to pay more attention to the cooperation and dependence between individuals. Accordingly, Africans may have some cultural-specificindividualist elements shown in some groups. This has been shown in studies based on Zimbabwe college students, South Africa University students and educated Kenyans (Eaton & Louw, 2000; Ma & Schoeneman, 1997; Mpofu, 1994). In summary, due to historical, societal and economic reasons, Africans may have collectivistic societies, but with a relatively greater individualistic tendency when compared to East Asians. In the context of scene perception, Africans may pay less attention to the scene’s background than Chinese and may be less influenced when the background has changed. Thus, in the current study, the two groups’ attention patterns in scene perception were evaluated in light of the similarities and differences between African and Chinese cultures.
Our study’s other aim was to test whether or not the viewing task is a moderator of the association between culture and scene perception. As Nisbett and Norenzayan (2002) said, culture shapes how we look, and this processing mechanism is automated and stable. Thus, no matter whether there are viewing tasks or not, cultural differences would be shown in scene perception. However, previous studies never tested the viewing task as a moderator. In the no-cultural-differences studies, there were stimulus-driven processes guiding more attention to the salient area when there was no explicit viewing task. Thus, we assume that the cultural difference might be apparent only during certain stages and that this can be shown by using the dynamic analysis method. People have quite limited awareness of their own fixation patterns, and this is therefore a limitation of assessments based on oral reports and paper tests. However, eyetracking technique solves this problem by providing a timely record of the viewer’s attention distribution and by objectively providing insights to the allocation of visual attention and information processing (Rayner, 1998, 2009; Van Gog & Scheiter, 2010).
In addition, because some of the contradictory results in earlier research may have been due to the use of different experiment materials and different definitions of interest areas and focal objects, we wanted to be able to compare our results with at least one study using the same methodology as our own (Boland, Chua, & Nisbett, 2008). To this end, our study’s materials and operations were the same as Chua et al. (2005).
In summary, we studied Chinese and African college students to test cultural differences in scene perception, using eye-tracking technique. Using the same experiment materials and the same definitions of interest areas and focal objects as Chua et al. (2005), we let participants freely view scenes and then to report on recognition. We expected Chinese to spend more time looking at the backgrounds and less time looking at the focal objects than the Africans in both the free-viewing phase and recognition phase. Furthermore, we expected Chinese to be more influenced by the background than by the object, so when the background changed, they would recognize fewer focal objects than Africans.
Methods
Participants
Twenty-two Africans (16 males, 6 females) and 22 Chinese (6 males, 16 females) participated in the experiment. The mean ages of Africans and Chinese were 27.2 (SD = 4.79) and 24.4 (SD = 1.62) respectively. The African participants were black, native Africans who were studying in China as graduate students or postgraduate students. The African participants’ countries of origin were as follows: 1 Botswana, 2 Congo, 1 Eritrea, 2 Ghana, 1 Kenya, 1 Lesotho, 1 Mali, 2 Malawi, 2 Mozambique, 1 Rwanda, 1 South Africa, 2 Togo, 1 Tanzania, 1 Uganda, 1 Zambia, 2 Zimbabwe; these countries represented 15 presidential republics, 4 semi-presidential republics, 2 parliamentary republics, and 1 dual system of constitutional monarchy. The Chinese participants were native Chinese Han and their education level was similar to that of the Africans. The Chinese participants’ provinces of origin were as follows: 1 Shandong, 7 Hubei, 2 Hebei, 3 Anhui, 3 Henan, 1 Shanghai, 1 Zhejiang, 2 Hunan, 1 Fujian, 1 Jiangxi. All participants had normal or corrected-to-normal vision. No participants had nutritional diseases, eye diseases, color blindness or color weakness. All participants received credit toward a course assignment or they were given a small payment for their participation.
Stimuli
Because the experimental tasks and experimental materials might affect the results (Boland, et al., 2008), we chose the view-recognize task as our visual task. This task is a classic experimental paradigm used by many cross-culture researchers and has high effectiveness in testing cultural differences in scene perception and memory (Chua et al., 2005; Masuda & Nisbett, 2001; Rayner et al., 2007; Waxman et al., 2016).
We chose pictures used in previous experiments to maintain the reliability and validity (Chua et al., 2005). All images had only one focal object (the focal object was an animal or a non-living thing, e.g., fish and car), and except for the focal object, the rest of the scene was defined as the background. The study phase had 37 pictures, in which one was used to practice. The recognition phase had 74 pictures that were based on the 36 picturesin the study phase, but the focal objects or backgrounds might change in the pictures. Apart from 2 practice pictures, the recognition phase had 18 original focal objects with original backgrounds, 18 original focal objects with new backgrounds, 18 new focal objects with original backgrounds, and 18 new focal objects with new backgrounds. The size of all pictures was 800×600 pixels. See examples in Figure 1.
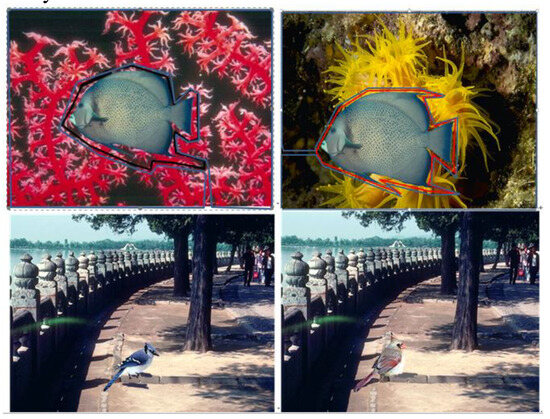
Figure 1.
Sample pictures presented in the study (pictures were from Chua et al. (2005) with the author’s consent for research use) Note: The left column was from learning phase and the right column was from recognition phase. For detail, the upper right picture was the original focal object with a new background, and the bottom right was the new focal object with an old background. The focal objects in the sample pictures were the fish and the bird. For the upper left picture, the fish with black line marked out was the interest area of focal object and the rest with blue line surrounded was the the interest area of background. Other pictures were the same as this picture with both focal object and background, two interest areas.
The paper questionnaires used in the experiments included a pretest questionnaire and an object-familiarity scale. The pretest questionnaire collected demographic information such as the participants’ gender, age, educational level, and history of nutritional disease and visual diseases. The object-familiarity scale was a 7-point rating scale developed by Chua and his colleagues (2005), ranging from 1 = very unfamiliar to 7 = very familiar. The participants evaluated their familiarity with the objects in the pictures according to their own experience.
African participants received English language materials, and Chinese participants received Chinese language materials. All English expressions that appeared in the experiments were first translated from Chinese into English by two native English speaking professionals whose second language was Chinese, and then translated by English major students back to Chinese. If there were inconsistencies, the two professionals discussed them to reach agreement. The two professionals showed 99% agreement on the wording of the translation.
Apparatus
The eye movements of each participant were tracked with an EyeLink 1000 eye tracker (SR Research, Canada). This eye tracker was a desktop type eye tracker sampling pupil and corneal reflections at 1000 Hz. The scenes (which subtended a visual angle of 28.7° horizontally and 22.9° vertically) were displayed at a resolution of 1024×768 pixels on a 19-in. monitor. Although the eyetracking system compensated for head movements, a chin rest located 75 cm away from the monitor was used to minimize disruption.
Procedure
The experimental procedure included: pretest phase, study phase, distraction phase, recognition phase and familiarity assessment phase. In the pretest phase, all participants were told about the experimental procedure, signed the informed consent and finished the pretest questionnaire. Those who passed the pretest phase would then be brought to the experiment room.
In the study phase, the participants sat on a chair and placed their chin on a chin chest. They were instructed to view several pictures, one at a time. Each picture was presented for 5 s and before the next picture was presented, the participants orally rated how much they liked the scene, using a scale from 1 = don’t like at all to 7 = like very much. This 7-point preference scale was developed by Chua and his colleagues (2005) to encourage the participants view the pictures carefully. After the instructions were given to the participants, they would have a trial to practice. The eye tracker had a 9-point calibration and validation. At the beginning of each trial, a cross fixation marker appeared in the center of the screen. The cross lasted 1 s and then the picture appeared. There were 36 trials.
In the distraction phase, participants were moved to a separate room to do a backward counting task, subtracting 7 starting from 100 to 0. This distracter task was shown on a computer and lasted no more than 20 minutes. Then the participants were brought back to the experi-ment room to do the recognition task.
In the recognition phase, we explained the definitions of the focal object and background to the participants and made sure they had fully understood the definitions. Then, they were told to view pictures and judge whether the focal objects of the pictures had appeared in the study phase. The participants reported “yes” if they believed that they had seen the focal object in the study phase, or “no” if they believed that it was new. If they were unsure, they were told to make a guess. We recorded participants’ answers according to the stimuli’s presentation order to compute the correct rate as the recognition score. Several training rounds with feedback about answers being right or wrong were conducted before participants started the task. This phase was also under eye tracker recording and the calibration, fixation marker, stimulus settings and other settings were the same as in the study phase. We should mention that the main aim of the focal recognition task was to use a task condition (in addition to a free-viewing condition) to test the perception differences, not memory differences, between the two cultures.
After they finished the recognition phase, the participants went to another room to complete the objectfamiliarity scale. All focal objects that appeared during the experiment were shown against a white screen on a computer. The entire experiment lasted about 40 minutes.
Results
The results included test data and eye movement data. The test data included recognition scores, picture preference scores and object familiarity scores. Because different phases had different tasks, the eye movement data were divided into study phase and recognition phase to test if there were cultural differences in different tasks.
Tests results
For picture preferences, there was no difference between Chinese (M = 162.50, SD = 18.29) and Africans (M = 156.68, SD = 24.78), F (1, 42) < 1, p > 0.05, η 2 = 0.02 (note: ηp2 is partial ηp2, the same below). For object familiarity scores, Africans (M = 369.91, SD = 61.67) reported greater familiarity with the focal objects than Chinese (M = 336.28, SD = 45.55), F (1, 42) = 4.23, p < 0.05, ηp2 = 0.09.
The recognition score was investigated using a 2 (culture: Chinese, African) × 2 (background: new, old) mixed ANOVA. A non-significant interaction effect showed that contrary to our expectations, Chinese participants’ recognition scores were not more influenced by the background than African participants, F (1, 42) < 1, p > 0.05, η 2 = 0.02. There was no main effect for background, F (1, 42) = 2.50, p > 0.05, ηp = 0.06, but Chinese recognized more objects than Africans, F (1, 42) = 6.60, p < 0.05, η 2 = 0.14.
Eye movement results
We expected that Chinese and Africans would show different attention bias to objects and backgrounds, and once the backgrounds change there might be differential attention to the change. Thus in both phases, we treated the focal objects and backgrounds as interest areas separately. See examples in Figure 1.
For the study phase, we used a 2 (culture: Chinese, African) × 2 (area: object, background) mixed ANOVA analysis with culture as a between participant factor and area as a within participant factor. For the recognition phase, we used a 2 (culture: Chinese, African) × 2 (background: new, old) mixed ANOVA analysis with culture as a between participant factor and background as a within participant factor. We used mean IA dwell time (DT), mean IA dwell time % (DT %), mean IA fixation count (FC) and mean first run dwell time (FRDT) as indices of temporal and spatial processing in the task. IA dwell time is the summation of the duration across all fixations on the current interest area; IA dwell time % is the percentage of trial time spent on the current interest area; IA mean fixation count is the total number of fixations falling in the interest area; IA first run dwell time is the summation of the duration across all fixations of the first run within the current interest area. It is generally assumed that dwell time (and dwell time %) reflects the time needed to process the information and first run dwell time reflects interest in the information (see: Rayner, 1998).
Eye movement data in the study phase
In the study phase, eye movement data varied across the conditions (see Table 1). For DT%, all participants showed longer dwell time on the objects than backgrounds, F (1, 42) = 123.09, p < 0.05, η 2 = 0.75. The predicted interaction was significant, F (1, 42) = 5.96, p < 0.05, η 2 = 0.12; Africans spent significantly longer dwell time on objects than Chinese, F (1, 42) = 9.66, p < 0.001; Chinese spent longer dwell time on backgrounds than Africans, F (1, 42) = 3.42, p = 0.07. The main effect of culture was non-significant, F (1, 42) = 1.61, p > 0.05, η 2 = 0.04.

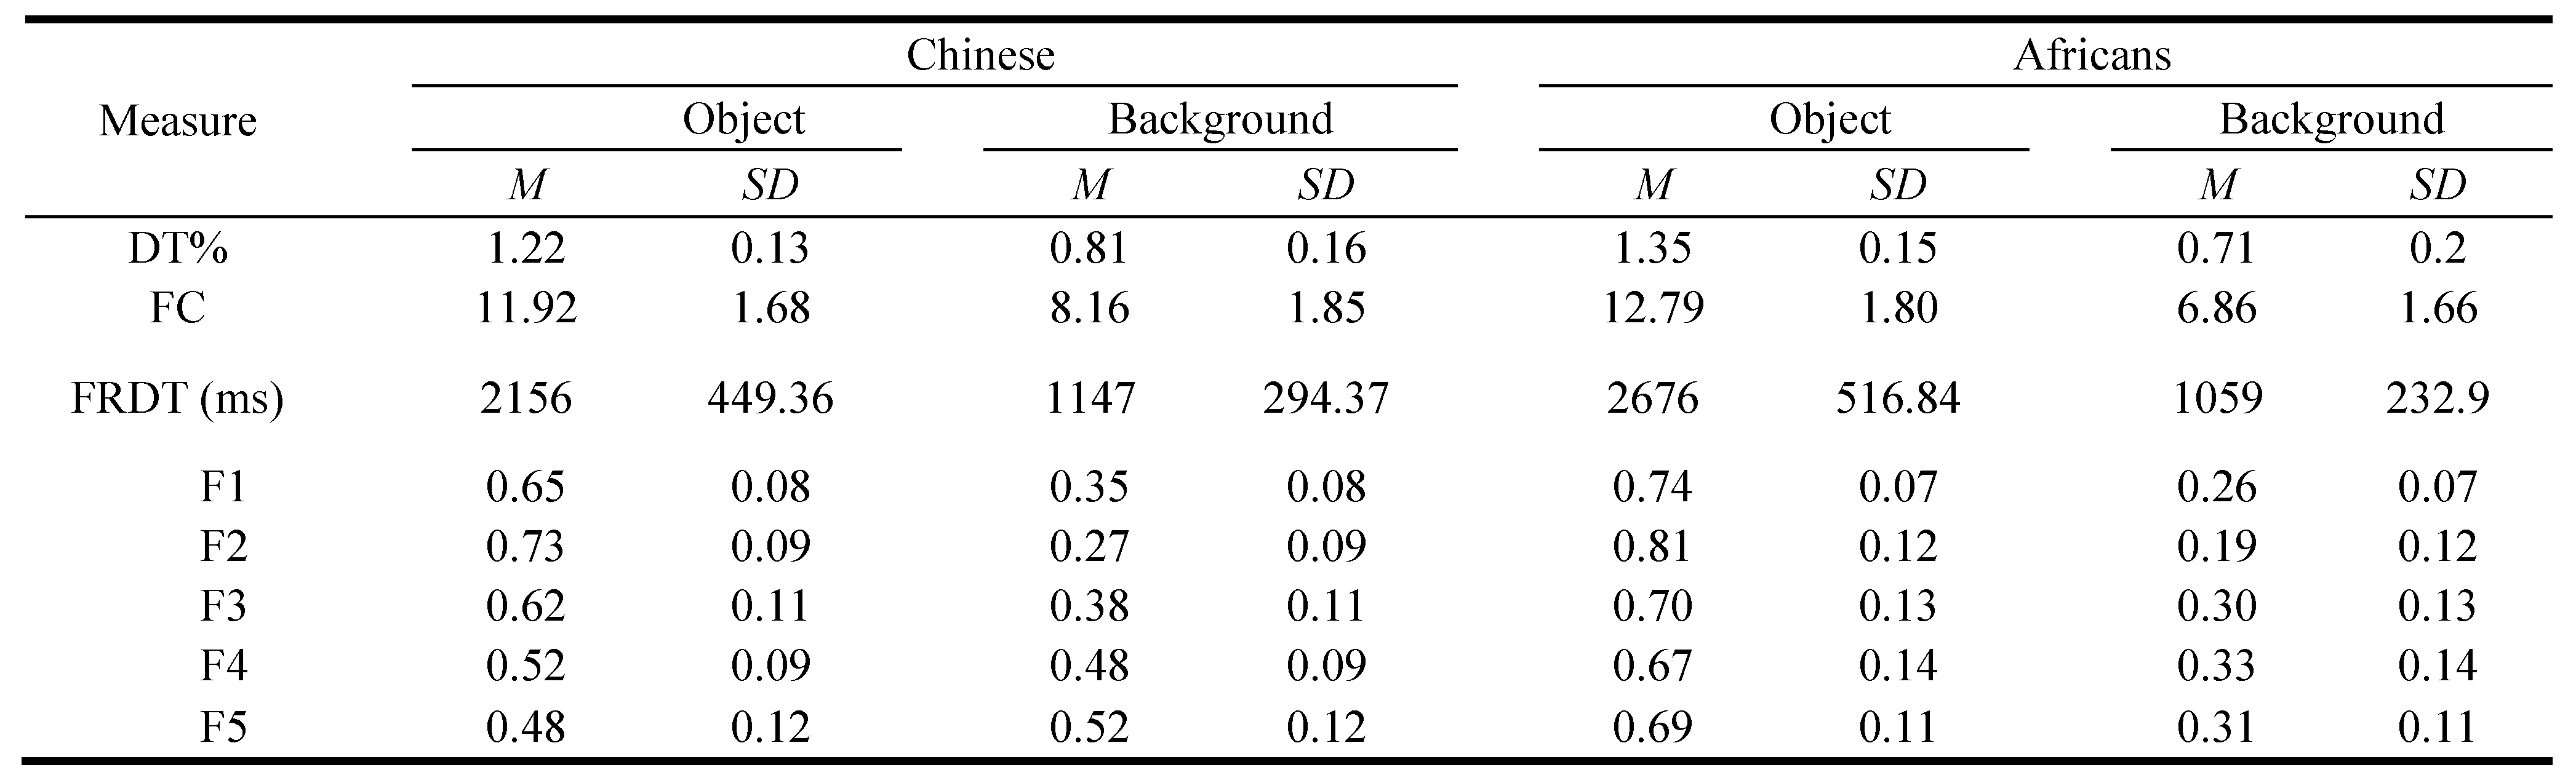
Table 1.
Eye movement measures for objects and backgrounds in study phase.
For FC, all participants showed more fixation counts on the objects than backgrounds, F (1, 42) = 137.42, p < 0.001, η 2 = 0.77. The interaction was significant, F (1, 42) = 6.82, p < 0.01, η 2 = 0.14; Africans showed significantly more fixation counts on objects than backgrounds, F (1, 42) = 102.74, p < 0.001; Chinese showed significantly more fixation counts on objects than backgrounds, F (1, 42) = 41.50, p < 0.001. The main effect of culture was non-significant, F (1, 42) < 1, p > 0.05, η 2 = 0.01.
For FRDT, Africans showed longer FRDT than Chinese, F (1, 42) = 6.80, p < 0.01, η 2 = 0.14, and all participants showed longer FRDT on the objects than backgrounds, F (1, 42) = 246.58, p < 0.001, η 2 = 0.85. The predicted interaction was significant, F (1, 42) = 13.25, p < 0.001, η 2 = 0.24; Africans spent significantly longer FRDT on objects than Chinese, F (1, 42) = 12.71, p < 0.01.
To better understand the time course of the cultural difference, we examined each picture’s first five fixations, from the first fixation to the fifth fixation (F1 to F5). Because every picture had only two interest areas, that is the focal object and the background, the participants’ fixation would be on either object or background. If the fixation was on the object, the object score was 1 point and the background score was 0 point. Then, we computed each participant’s ratio of fixations on the 36 pictures. Because the object scores were negatively correlated with background scores, only the objects’ first five fixations were used in a one-way ANOVA. Results indicated a main effect of culture for all five fixations: F1, F (1, 42) = 17.72, p < 0.001, η 2 = 0.30; F2, F (1, 42) = 7.06, p <0.05, η 2 = 0.14; F3, F (1, 42) = 5.40, p < 0.05, η 2 = 0.11; F4, F (1, 42) = 17.33, p < 0.001, η 2 = 0.29; and F5, F (1, 43) = 35.96, p < 0.01, η 2 = 0.46. That means Africans had greater probability to fixate on focal objects than Chinese on the first five fixations. For eye movement data, see Table 1 and Figure 2.
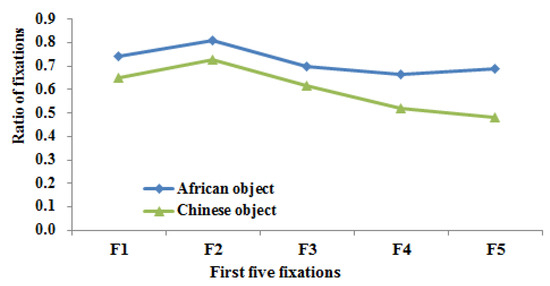
Figure 2.
The fixations’ ratio of first five fixations by condition in study phase.
Figure 2 shows Africans fixated on objects more than backgrounds from F1 to F5, but Chinese first fixated on objects, and then turned to backgrounds. To understand the Chinese fixation pattern, a repeated measurement ANOVA was conducted in the subsample of Chinese participants. Results indicated that Chinese significantly fixated more on objects than backgrounds on the first three fixations: F1, F (1, 21) = 68.29, p < 0.001, η 2 = 0.04 or F5, F (1, 21) < 1, p > 0.05, η 2 = 0.02.
Eye movement data in the recognition phase
In the recognition phase we tested whether there were cultural differences in eye movements when the backgrounds changed. Data for the focal object and background were computed separately. Eye movement data varied across the conditions (see Table 2).
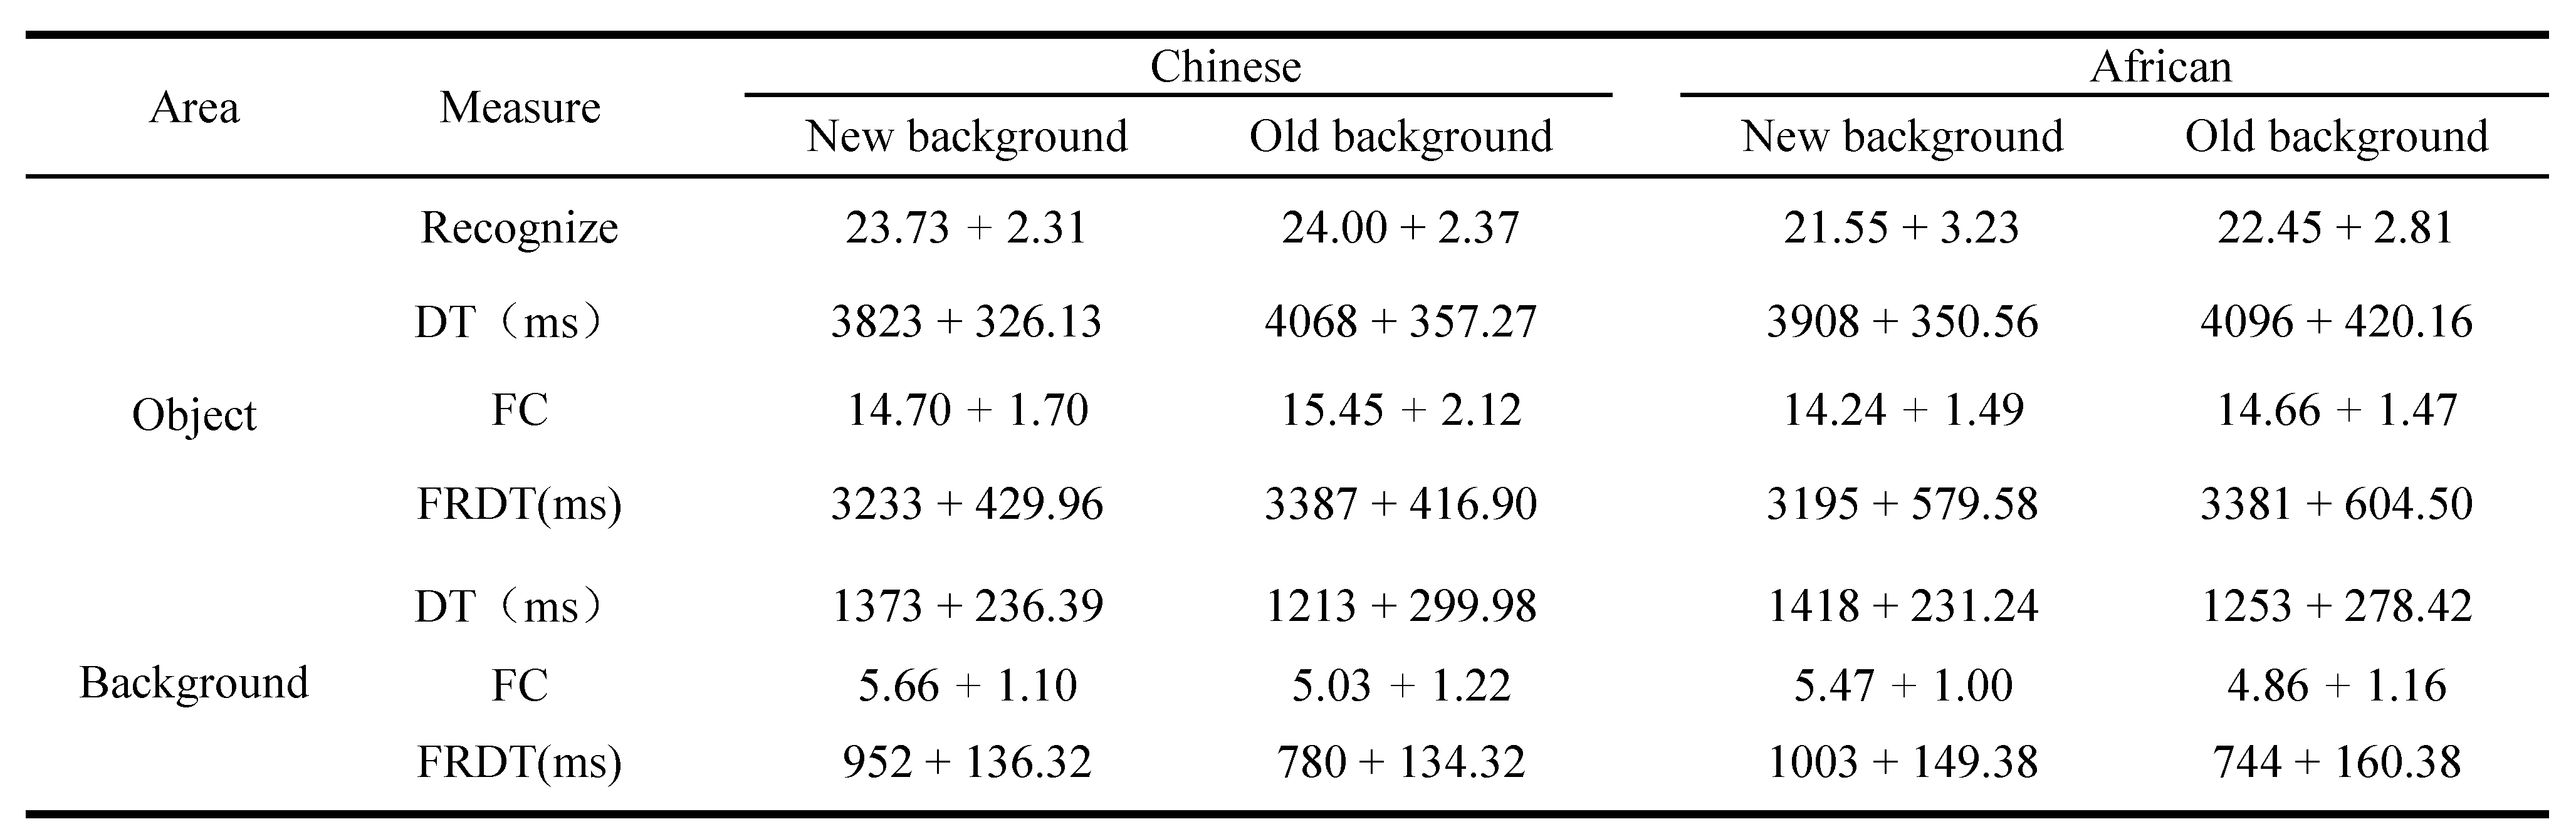
Table 2.
Recognition score and eye data by condition in recognition phase (M + SD).
When the background was old, all participants showed longer DT, F (1, 42) = 94.11, p < 0.001, η 2 = 0.69, more FC, F (1, 42) = 23.97, p < 0.001, η 2 = 0.36, and longer FRDT, F (1, 42) = 15.94, p < 0.001, η 2 = 0.28, on objects than when the background was new. There were no cultural differences (DT, F (1, 42) < 1, p > 0.05, η 2 = 0.01; FC, F (1, 42) = 1.56, p > 0.05, η 2 = 0.036; FRDT, F (1, 42) < 1, p > 0.05, η 2 = 0.001) and no interactions (DT, F (1, 42) = 1.63, p > 0.05, η 2 = 0.04; FC, F (1, 42) = 1.73, p > 0.05, η 2 = 0.04; FRDT, F (1, 42) < 1, p > 0.05, η 2 = 0.003) were found.
When the background was new, all participants showed longer DT, F (1, 42) = 40.21, p < 0.001, η 2 = 0.49, more FC, F (1, 42) = 44.43, p < 0.001, η 2 = 0.51, and longer FRDT, F (1, 42) = 15.94, p < 0.001, η 2 = 0.28, on backgrounds than when the background was old. There was no main effect of culture (DT, F (1, 42) < 1, p > 0.05, η 2 = 0.008; FC, F (1, 42) < 1, p > 0.05, η 2 = 0.007; FRDT, F (1, 42) <1, p > 0.05) and no interactions (DT, F (1, 42) <1, p > 0.05; FC, F (1, 42) < 1, p > 0.05,η 2 = 0; FRDT, F (1, 42) = 2.17, p > 0.05, η 2 = 0.05) were found.
Discussion
Our study demonstrates that culture has an effect on scene perception under conditions of a free-viewing task and more clearly in its later period. This was illustrated by the eye movement data in the free-viewing phase and its first five fixations. Culture may not affect shallow perceptual processing as assessed by eye movement during a perception task such as recognition, but rather may affect memory. These results add to the literature on scene perception by expanding the culture groups to African and Chinese cultures. Our assumptions and results are different from previous studies. In the remainder of this Discussion, we discuss some limiting conditions on this evidence and then consider some differences between our findings and prior work on cultural differences in scene perception.
Two main features of this work limit the conclusions. First, the African group was made up of African students who were studying in China, and the convenience sampling method may bias the conclusions. However, that kind of participants’ shortcoming also exists in former designs (Chua et al., 2005; Kitayama et al., 2003; Masuda & Nisbett, 2001; Masuda & Nisbett, 2006). Second, the materials and the definition of focal object we used were taken from Chua et al. (2005), meaning that our conclusions are limited to scenes that only contain one focal object. Some researchers may disagree with our findings because of the type of scene, and whether other scenes, for example scenes containing three focal objects, would generate similar results remains to be further studied. Besides this factor, gender differences play a role in independent/interdependent self-images, which influence information processing; women are more likely to encode information in terms of relationship (Cross & Madson, 1997; Markus & Kitayama, 1991). Moreover, the influences of preference bias for objects and of familiarity on memory were not found in our study. Future studies should take the above-mentioned variables into account.
One important finding of the present study is that culture had an effect on scene perception under a freeviewing condition in its later period. Specifically, our results in the free-viewing learning phase showed that the African viewers had longer dwell time than the Chinese viewers on the focal objects, whereas the Chinese viewers had longer dwell time than the African viewers on the backgrounds. These results illustrate that when there is no explicit task, there are cultural differences in scene perception. However, in a recognition task, those cultural differences are gone, with both Chinese and African participants allocating more fixations on the focal objects. Other cultural differences were noted over the course of the first five fixations of the learning stage. African participants allocated more fixations on the focal objects than on the backgrounds on all five fixations; Chinese participants showed this same pattern for the first three fixations but then showed no difference between focal objects and backgrounds on the fourth and fifth fixations. This result shows the cultural differences are clearer in the later period of the free-viewing condition.
Our findings contribute something new to the discussion of cultural differences in scene perception. Some studies have found cultural differences in scene perception, but they did not test this effect under various task conditions (Chua et al., 2005; Kitayama et al., 2003; Masuda & Nisbett, 2001; Masuda & Nisbett, 2006; Waxman et al., 2016). One study reported the difference in time series between Chinese and U.S. participants, but they did not consider that time may be an important factor that influences the cultural differences reflected by scene perception (Chua et al., 2005). In addition, prior studies did not take into consideration the viewing task; participants were tested under a free-viewing task or just tested under one condition, such as describing or finding differences (Chua et al., 2005; Kitayama et al., 2003; Masuda & Nisbett, 2001; Masuda & Nisbett, 2006). Some other studies have found no cultural differences in scene perception, not only on the ordinary/ecological scenes, but also on unusual scenes (Evans, et al., 2009; Miellet et al., 2010; Rayner et al., 2007; 2009). We consider the variation in materials and the definition of the focal object as the main reasons for these contradictory results. Because of differences in definition, some things were treated as focal objects in some studies (Evans et al., 2009; Rayner et al., 2007; 2009) but may be backgrounds in other studies (Chua et al., 2005; Kitayama et al., 2003; Masuda & Nisbett, 2001; Masuda & Nisbett, 2006). Then, when there was more than one object (Rayner et al., 2007, 2009), participants’ attention to the objects would be much more evident than attention to the backgrounds. Thus, the cultural effect on scene perception may be masked. Thus, it is necessary to study the cultural effect on different types of scenes in the future. In our study, with one-focalobject scenes, there were clear cultural differences in scene perception.
Our study also investigated the reasons behind these cultural differences. Some studies hypothesized that East Asian participants would pay more attention to the backgrounds than Western participants, because East Asians are from collectivist countries that have complex social networks, which may lead them to pay more attention to context (Chua et al., 2005; Kitayama et al., 2003; Masuda & Nisbett, 2001; Masuda & Nisbett, 2006; Senzaki, et al., 2016, Waxman et al., 2016). In our study, Chinese viewers had higher dwell time on the backgrounds but lower dwell time on objects than the African viewers. Although both Chinese and Africans are from collectivist cultures (Triandis, 1989), African participants may have an individualist tendency when compared to East Asians, consistent with their lower score on collectivism (Triandis, 1989) and for their animal husbandry living style (Guglielmino, Viganotti, Hewlett, & CavalliSforza, 1995; White, 1943). Another thing that needs to be noted is that many African countries used to be Western colonies and the majority of countries of origin of our African participants are capitalist presidential republics or semi-presidential republics. In addition, almost every country in Africa uses one of the Western languages as their official language. So we could say that our African participants may have an individualistic tendency when compared to East Asians. Similar results were also found in some studies in Africa (Eaton & Louw, 2000; Ma & Schoeneman, 1997; Mpofu, 1994). Relatively speaking, because of the higher collectivist tendency, Chinese viewers are more likely to shift their attention to the background information area as time goes by.
Another significant finding of the current study is that when participants are engaged in a viewing task, cultural differences may be hidden; that is, they may not be evident in scene perception but may be evident in memory. Our data showed that, in the recognition phase, which had clear searching aims, no cultural difference was found and all the participants distributed more attention to the focal objects than to the backgrounds without being influenced by the changing backgrounds. This phenomenon was consistent with task-driven process, in which participants pay attention to the target until they finish their task (DeAngelus & Pelz, 2009; Yarbus, 1967). The cultural difference did not show up in shallow perception, but rather in memory; the Chinese participants recognized more focal objects than the African participants. We attribute this difference to educational differences between the two cultures, as the Chinese education system emphasizes memorization and may have better educational equipment than African countries. This possibility is consistent with research showing that culture can impact memory (Gutchess & Huff, 2016). One interesting result of our study is when asked to report how familiar the focal objects were, Chinese reported less familiarity than Africans, which means that although Chinese were less familiar with the focal objects they remembered more. This may also reflect a cultural phenomenon, because Chinese, influenced by Confucianism, are often more modest and prudent than Westeners about their performance (Murphy, 1993). That is, they might under-report their familiarity with the objects. Thus, in our study, they subjectively reported low familiarity but objectively memorized more.
The present findings make an important contribution to cross-cultural research on perception. Culture not only impacts face recognition (Miellet et al., 2013; Ng et al., 2016), facial expressions (Jack et al., 2009; 2016) and psychological esthetics (Masuda, et al., 2008), but also affects scene perception and memory. Moreover, this research highlights the importance of the nature of the stimuli and tasks in studies of cultural differences. Our focus on African and Chinese participants not only expands the cultural groups that have been researched, but also provides more general evidence of cross-cultural differences in scene perception.
Acknowledgments
This research was founded by National Natural Science Foundation of China Grant (# 31300864) and SelfDetermined Research Funds of CCNU from the Colleges’ Basic Research and Operation of MOE (#CCNU16A02023) to the second author FW, and Excellent PhD Program of CCNU (2015YBZD006) to the first author ZD.
References
- Boland, J. E., H. F. Chua, and R. E. Nisbett. 2008. Edited by K. Rayner, D. Shen, X. Bai and G. Yan. How we see it: Culturally different eye movement patterns over visual scenes. In Cognitive and cultural influences on eye movements. Tianjin People’s Press/Psychology Press: pp. 363–378. [Google Scholar]
- Chua, H. F., J. E. Boland, and R. E. Nisbett. 2005. Cultural variation in eye movements during scene perception. Proceedings of the National Academy of Sciences 102, 35: 12629–12633. [Google Scholar] [CrossRef] [PubMed]
- Cross, S. E., and L. Madson. 1997. Models of the self: Self-construals and gender. Psychological Bulletin 122, 1: 5–37. [Google Scholar] [CrossRef] [PubMed]
- DeAngelus, A. M., and J. B. Pelz. 2009. Top-down control of eye movements: Yarbus revisited. Visual Cognition 17, 67: 790–811. [Google Scholar] [CrossRef]
- Eaton, L., and J. Louw. 2000. Culture and self in South Africa: Individualism-collectivism predictions. The Journal of Social Psychology 140, 2: 210–217. [Google Scholar] [CrossRef]
- Evans, K., C. M. Rotello, X. Li, and K. Rayner. 2009. Scene perception and memory revealed by eye movements and ROC analyses: Does a cultural difference truly exist? Quarterly Journal of Experimental Psychology 62, 2: 276–285. [Google Scholar] [CrossRef]
- Gutchess, A., and S. Huff. 2016. Edited by J. Chiao, S.-C. Li, R. Seligman and R. Turner. Cross-Cultural Differences in Memory. In The Oxford Handbook of Cultural Neuroscience. Oxford University press: pp. 155–180. [Google Scholar]
- Guglielmino, C. R., C. Viganotti, B. Hewlett, and L. L. CavalliSforza. 1995. Cultural variation in Africa: Role of mechanisms of transmission and adaptation. Proceedings of the National Academy of Sciences 92, 16: 7585–7589. [Google Scholar] [CrossRef]
- Henderson, J. M., and A. Hollingworth. 1999. High-level scene perception. Annual Review of Psychology 50, 1: 243–271. [Google Scholar] [CrossRef]
- Jack, R. E., C. Blais, C. Scheepers, P. G. Schyns, and R. Caldara. 2009. Cultural confusions show that facial expressions are not universal. Current Biology 19, 18: 1543–1548. [Google Scholar] [CrossRef]
- Jack, R. E., W. Sun, I. Delis, O. G. Garrod, and P. G. Schyns. 2016. Four not six: Revealing culturally common facial expressions of emotion. Journal of Experimental Psychology: General 145, 6: 708–730. [Google Scholar] [CrossRef]
- Kitayama, S., S. Duffy, T. Kawamura, and J. T. Larsen. 2003. Perceiving an object and its context in different cultures: A cultural look at new look. Psychological Science 14, 3: 201–206. [Google Scholar] [CrossRef]
- Kitayama, S., and A. K. Uskul. 2011. Culture, mind, and the brain: Current evidence and future directions. Annual Review of Psychology 62, 1: 419–449. [Google Scholar] [CrossRef] [PubMed]
- Edel, A. 1954. Culture; A Critical Review of Concepts and Definitions. The Journal of Philosophy 51, 19: 559–563. [Google Scholar] [CrossRef]
- Ma, V., and T. J. Schoeneman. 1997. Individualism versus collectivism: A comparison of Kenyan and American self-concepts. Basic and Applied Social Psychology 19, 2: 261–273. [Google Scholar] [CrossRef]
- Markus, H. R., and S. Kitayama. 1991. Culture and the self: Implications for cognition, emotion, and motivation. Psychological Review 98, 2: 224. [Google Scholar] [CrossRef]
- Masuda, T., R. Gonzalez, L. Kwan, and R. E. Nisbett. 2008. Culture and aesthetic preference: Comparing the attention to context of East Asians and Americans. Personality and Social Psychology Bulletin 34, 9: 1260–1275. [Google Scholar] [CrossRef]
- Masuda, T., and R. E. Nisbett. 2001. Attending holistically versus analytically: Comparing the context sensitivity of Japanese and Americans. Journal of Personality and Social Psychology 81, 5: 922–934. [Google Scholar] [CrossRef]
- Masuda, T., and R. E. Nisbett. 2006. Culture and change blindness. Cognitive Science 30, 2: 381–399. [Google Scholar] [CrossRef]
- Miellet, S., L. Vizioli, L. He, X. Zhou, and R. Caldara. 2013. Mapping face recognition information use across cultures. Frontiers in Psychology 4, 34: 1–12. [Google Scholar] [CrossRef]
- Miellet, S., X. Zhou, L. He, H. Rodger, and R. Caldara. 2010. Investigating cultural diversity for extrafoveal information use in visual scenes. Journal of Vision 10, 6: 21. [Google Scholar] [CrossRef]
- Mpofu, E. 1994. Exploring the self-concept in an African culture. The Journal of Genetic Psychology: Research and Theory on Human Development 155, 3: 341–354. [Google Scholar] [CrossRef]
- Murphy, K. R. 1993. Modesty bias in self-ratings of performance: A test of the cultural relativity hypothesis. Personnel Psychology 46, 2: 357–363. [Google Scholar] [CrossRef]
- Ng, A. H., J. R. Steele, and J. Y. Sasaki. 2016. Will you remember me? Cultural differences in own-group face recognition biases. Journal of Experimental Social Psychology 64: 21–26. [Google Scholar] [CrossRef]
- Nisbett, R. E., and Y. Miyamoto. 2005. The influence of culture: Holistic versus analytic perception. Trends in Cognitive Sciences 9, 10: 467–473. [Google Scholar] [CrossRef] [PubMed]
- Nisbett, R. E., and A. Norenzayan. 2002. Culture and cognition. Edited by D. Medin and H. Pashler. In Stevens’ Handbook of Experimental Psychology, Third Edition, Volume Two: Memory and Cognitive Processes. New York: John Wiley & Sons. [Google Scholar]
- Rayner, K. 1998. Eye movements in reading and information processing: 20 years of research. Psychological Bulletin 124, 3: 372. [Google Scholar] [CrossRef]
- Rayner, K. 2009. Eye movements and attention in reading, scene perception, and visual search. The Quarterly Journal of Experimental Psychology 62, 8: 14571506. [Google Scholar] [CrossRef]
- Rayner, K., X. Li, C. C. Williams, K. R. Cave, and A. D. Well. 2007. Eye movements during information processing tasks: Individual differences and cultural effects. Vision Research 47, 21: 2714–2726. [Google Scholar] [CrossRef]
- Rayner, K., M. S. Castelhano, and J. Yang. 2009. Eye movements when looking at unusual/weird scenes: Are there cultural differences? Journal of Experimental Psychology: Learning, Memory, and Cognition 35, 1: 254–259. [Google Scholar] [CrossRef]
- Senzaki, S., T. Masuda, A. Takada, and H. Okada. 2016. The communication of culturally dominant modes of attention from parents to children: A comparison of Canadian and Japanese parent-child conversations during a joint scene description task. PLoS ONE 11, 1: e0147199. [Google Scholar] [CrossRef]
- Triandis, H. C. 1989. The self and social behavior in differing cultural contexts. Psychological Review 96, 3: 506–520. [Google Scholar] [CrossRef]
- Triandis, H. C., R. Bontempo, M. J. Villareal, M. Asai, and N. Lucca. 1988. Individualism and collectivism: Cross-cultural perspectives on self-ingroup relationships. Journal of Personality and Social Psychology 54, 2: 323–338. [Google Scholar] [CrossRef]
- Van Gog, T., and K. Scheiter. 2010. Eye tracking as a tool to study and enhance multimedia learning. Learning and Instruction 20, 2: 95–99. [Google Scholar] [CrossRef]
- Waxman, S. R., X. Fu, B. Ferguson, K. Geraghty, E. Leddon, J. Liang, and et al. 2016. How early is infants’ attention to objects and actions shaped by culture? New evidence from 24-month-olds raised in the US and China. Frontiers in Psychology 7: 97. [Google Scholar] [CrossRef] [PubMed]
- White, L. A. 1943. Energy and the evolution of culture. American Anthropologist 45, 3: 335–356. [Google Scholar] [CrossRef]
- Yarbus, A. L. 1967. Eye movements and vision. Plenum press New York: Vol. 2. [Google Scholar]
Copyright © 2016. This article is licensed under a Creative Commons Attribution 4.0 International License.