Introduction
Eye movement data can provide a powerful source of information that is useful for determining viewers’ interest and intentions. Observing eye movements is an effective way to study visual perception. Visual perception may include reading of onscreen text. One of the most widespread interactions between humans and computers is the reading of onscreen electronic text. Study of eye movements provides a window to the cognitive processes of perception and comprehension that take place during reading.
For many of us, learning and working in day-to-day life involve a lot of reading. We read text for various purposes: desire to gain knowledge, interest, translation, comprehension, correction, copying, etc. There are many factors that may affect the readability of text presented on a computer screen.
Mills and Weldon (
1987) mentioned several elements that have potential to improve readability on the screen, among them the features (overall size, width, design, and case) of characters, the display’s formatting, the contrast and the color of both characters and background, and dynamic aspects of the screen.
With the development of technology, use of electronic text formats for reading has increased rapidly. In reading electronic text we have to deal with both static and dynamic text. For instance, reading for translation, i.e. reading text in order to create a translation of it, usually is based on static text. In contrast, reading during print interpreting (a communication mode for hard of hearing) means that text is read as it is emerges dynamically while a print interpreter creates a transcript of spoken information. The various formats for presentation of dynamic text include scrolling, paging, leading, and RSVP (rapid serial visual presentation). In scrolling, the text is presented in a display area that could be larger than the screen. Readers need to “scroll” the page to continue reading. Paging presents the text divided into pages that fit the screen; the reader can move one page at a time to continue reading. In leading, the text is scrolled horizontally from right to left in a single line across the screen. Finally, RSVP presents the text in successive chunks of one or more words at a time in a fixed location on the screen at a predetermined rate.
The study presented here involved analysis of eye movement data while participants read text on a computer screen, with several text presentation formats. These formats include sentences as part of a full paragraph, sentences presented one by one, sentences presented in chunks at a predefined rate (RSVP), and line-by-line presentation that matches the width of the computer screen. Studying the effect of different text presentation formats in reading from the computer screen could bear interesting fruit. The aim of our study was to investigate the effect of these various text presentation modes on standard eye movement metrics (fixation duration, fixation count per minute, regressions). Several studies have examined reading of onscreen text in different contexts and languages. Many studies were conducted mostly to evaluate users’ comprehension rate with different text presentation formats. Nevertheless, no study has considered the presentation formats used in this paper by systematically varying the size of the text block and studied their effect on reading using eye movement metrics. Moreover, most studies concerned with dynamic text have been done using mobile devices, whereas our interest was in reading from a full-size screen, either from a monitor or from its projection on the wall.
We set as the null hypothesis that the text presentation formats do not have an effect on the typical metrics for eye movements. Our results indicate that eye movement metrics are influenced by the text presentation formats. The shortest presentation format got significantly higher fixation durations and more regressions than the longer formats. Consequently, the fixation count was smaller for the shortest format than for the others. In the post test questionnaire, participants indicated the shortest format as their least preferred option. Our earlier study revealed that reading for translation differs significantly from reading one’s own emerging (translated) text (
Sharmin et al., 2008). On the other hand, print interpreting requires the audience to read text emerging on the screen interpreted from the speech in real time. We can apply the eye tracking knowledge of this study to develop tools for various onscreen reading purposes, such as reading for translation and reading print interpreted text. In general, these results may help to determine suitable text presentation formats for reading emerging text.
Previous literature related to the topic is reviewed in the next section, after which we present the method of this study including detailed description of the participants, apparatus, procedure, and design. Analysis and results are addressed in the section following that, before final discussion and conclusions.
Background
Kang and Muter (
1989) discovered that comprehension with the leading text presentation technique (also known as Times Square) was as good as that with RSVP. They also compared RSVP to three versions of Times Square format, with the only variation being in the size of the steps by which the display was scrolled. Kang and Muter found that readers preferred smooth scrolling Times Square over other conditions. However, there was no eye movement analysis in their study.
Mills and Weldon (
1985) argued that the difficulty, discriminability, and comprehensibility of text may be reflected in the eye movement data. Therefore, these measurements can be used as a method of assessing the cognitive effort involved in reading of text.
Some eye movement studies have been conducted to determine an appropriate reading format for a small display, such as that of a cellular phone. When displaying text on a cell phone’s display screen,
Öquist and Lundin (
2007) found that text presented in paging format was read significantly more rapidly than that in scrolling or RSVP. No significant differences in comprehension with these formats emerged. The results showed that paging offered the best readability in a cell-phone context and scrolling is the predominant method used nowadays. It was also found that RSVP significantly decreased eye movements, while leading was found to increase them. In RSVP, users’ eyes remain in a fixed position to view the text; hence, reading involved less eye movement than in other presentation formats. Also,
Mills and Weldon (
1987) reported no real difference between scrolling and paging where readability of text on a computer screen is concerned, though
Schwartz et al. (
1983) found that novices tend to prefer paging.
Chen and Tsoi (
1988) examined the leading text presentation format using English language in terms of users’ comprehension. The results indicated that leading display speed has a significant effect on comprehension of information in English. In an experiment conducted by
Juola et al. (
1995), sentences were presented on a small display using RSVP and leading formats. Their results indicated that reading was more accurate for the sentences presented in RSVP format than those in leading format. Another study of presenting Chinese text for the small screen, of a wristwatch, by
Chien and Chen (
2007), found presentation method to be a significant factor for improvement of reading comprehension. Reading comprehension was significantly better with word-by-word format than with character-by-character. In a dual-task condition, participants had significantly higher reading comprehension scores with speed settings of 150 and 250 cpm (characters per minute) than with the faster setting, 350 cpm.
Three text presentation methods: word-by-word, sentence-by-sentence, and a full page on a 15-inch display were compared by
Rahman and Muter (
1999). Their findings indicated that reading efficiency was better with the sentence-by-sentence condition than with the word-byword condition.
A study by
Bernard et al. (
2001) compared three RSVP presentation styles: a word-by-word, three-line, and 10-line format. Their results showed that the participants had significantly better reading comprehension with word-by-word and 10-line format than with three-line format.
Another study by
Lin and Shieh (
2006) investigated the effects of the presentation method by using characterby-character and word-by-word presentations for Chinese text. They found that on a single-line screen with leading, recall efficiency was significantly greater for the wordby-word format than for the character-by-character format. When examining the effects of the layout of the presentation method with single-line eight-character and word-by-word formats, they also found that the word-byword format was significantly superior to the single-line eight-character format.
Regressive eye movements can be a sensitive indicator of reading disruption.
Sanders and Stern (
1980) studied eye movement patterns with atypical text formats and found that number of regressions is a better predictor of reading disruption than reading speed.
An empirical study by
Dillon et al. (
1990) found that splitting sentences between screens causes readers to return to the previous page significantly more often to reread text. Splitting was likely to disrupt the comprehension process by placing an extra burden on the limited capacity of working memory to retain the sense of the current conceptual unit. Furthermore, 10–20% of the eye movements found in reading in this condition were regressions to earlier fixated words. The subjective data too revealed a preference for larger screens and high awareness of text format.
Method
Participants
Seventeen participants took part in the experiment (three males and 14 females). Good data from 16 participants were used for the analysis. Data from one participant was discarded due to technical difficulties in achieving accurate calibration. The participants’ average age was 24.9, with an SD of 1.53 and a range of 22–27 years. All of them were students at the University of Tampere in at least the second year of their studies of English translation as a major or minor subject.
Apparatus
A Tobii 1750 remote eye-tracking device was used to track the users’ gaze on its integrated 17-inch TFT color monitor (with 1280 x 1024 resolution). The experiment was recorded with ClearView and Translog/GWM (gazeto-word mapping). GWM (
Špakov, 2008) was developed for mapping gaze coordinates to words on a text document, a functionality that is not routinely provided by eye trackers.
Procedure and design
Participants were informed about the test procedure at the outset. Then the eye tracker was calibrated for their eyes. The distance between monitor and participant was 50–60 cm. The participants were also told that there would be a questionnaire with a few questions related to the text at the end. The motivation here was to encourage them to read the passages carefully. Each participant then read eight pieces of text during the experiment. All the texts were about 100 words long and the topics were about global warming and climate change.
![Jemr 05 00014 i001]()
An example piece of text follows: The Major Economies process is seeking to find consensus among key countries and all industrialized countries must continue to take the lead in emission reductions, in accordance with the principle of common but differentiated responsibilities. The European Union has offered a very courageous commitment for international progress and a new international climate deal that addresses the interests of both developed and developing countries will make everyone a winner. We need a political response to what the scientists are telling us is necessary because a speedy and concerted international action can still avoid some of the most catastrophic projections.
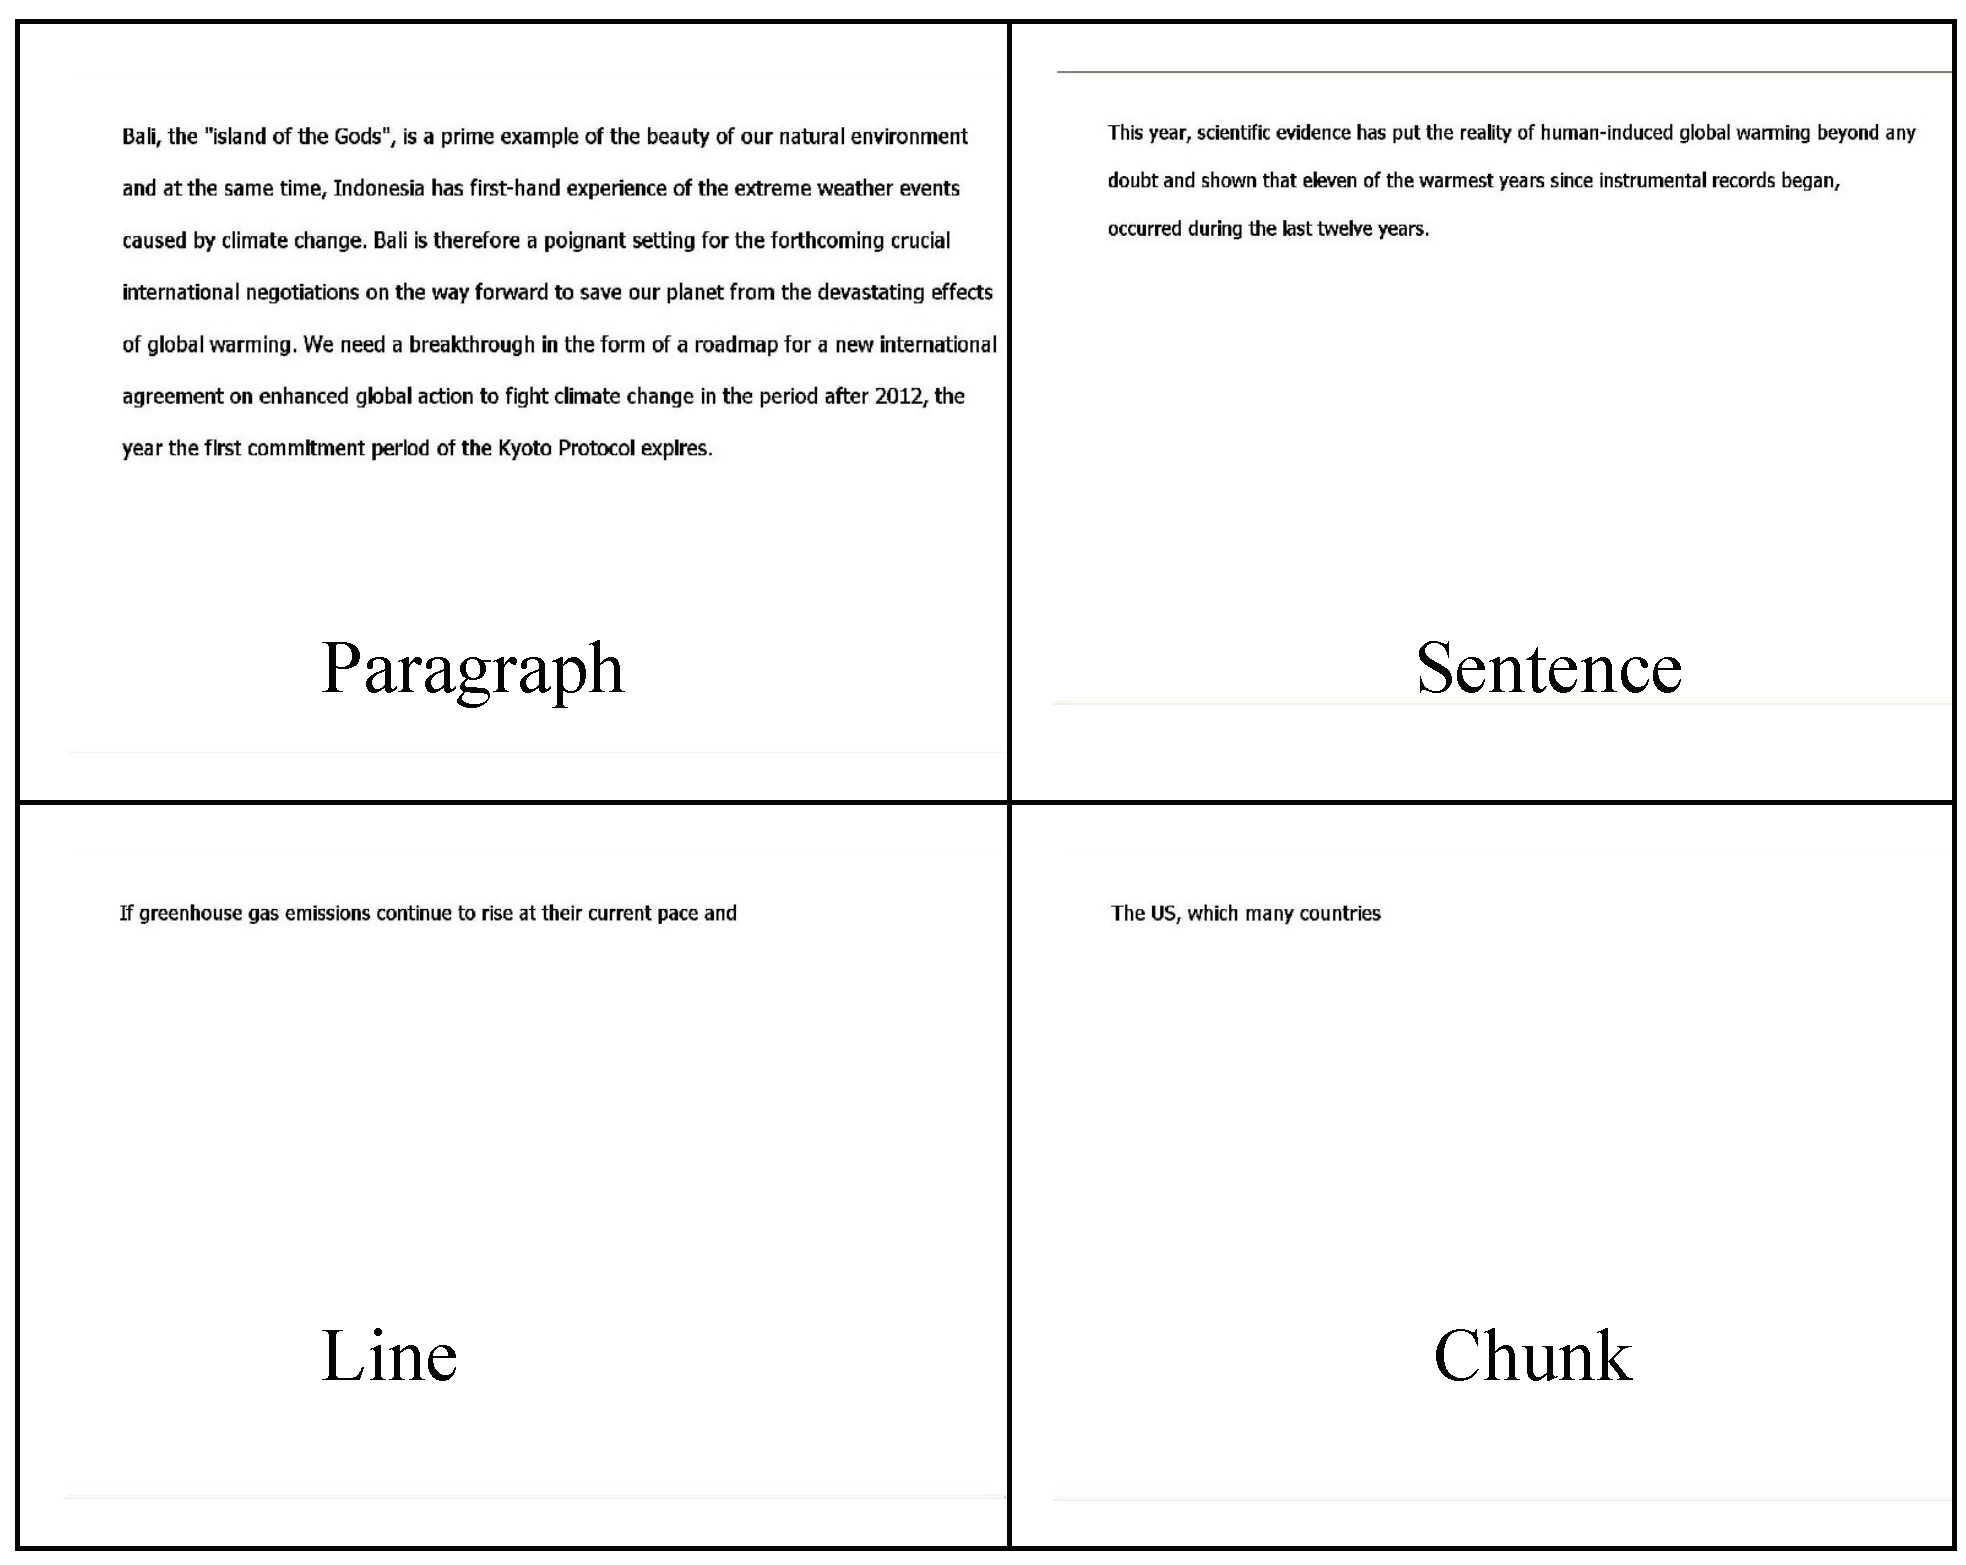
The experiment was divided into two parts. In Part 1, participants read four passages and the changing of text was paced automatically. In Part 2, they read four other passages and the pacing was manual. The motivation behind using both automatic and manual pacing was to understand whether the speed of automatic pacing was appropriate and whether it was close to manual pacing. In each part of the experiment the pieces of text were presented each with a different presentation format (paragraph, sentence-by-sentence, line-by-line, or chunks) (see Figure 1) using a 4 x 4 Latin square format. The passages were organized in such a way that they were counterbalanced.
For the automatically changing text, we calculated approximate optimal timing for the exposure. Unfortunately, there is little or no documentation in previous studies as to exactly how exposure times have been calculated (
Juola et al. (
1982),
Juola et al. (
1995), Masson (1983), Muter (1996), and
Rahman and Muter (
1999)).
Here the average number of characters that can be displayed (fchr) is divided by the product of the average word length (wavg) for the current language and a sixtieth of the presentation speed (wpm). The result is a fixed exposure time for each chunk of text, measured in seconds (time0).
Our investigation used the following formula to calculate timing in seconds to present text during automatic pacing. It was derived especially for chunks, but the same was used for sentence, line, and even paragraph units.
where
NCC = number of characters in each chunk,
NCW = average number of characters in each word: 6, WPM = expected reading speed in words per minute: 140, and
S = number of spaces.
In our study, chunks were constructed according to the rule that there should be at most 30 characters in a chunk, with spaces and special characters included, and no chunk extending beyond the period at the end of a sentence. The WPM parameter was determined through pilot tests.
At the end of the experiment, all participants filled in a background questionnaire. Their opinions were collected regarding readability and understanding of the text, and also on pacing and stress levels during the automatic and manual parts of the experiment. A few questions were asked about the passages.
Raw data with fixation durations was collected using the GWM tool (
Špakov, 2008) which uses the dispersion based algorithm (see, e.g.,
Salvucci and Goldberg (
2000)) for fixation computation. In our analysis the filter settings used 40 pixels for maximum fixation radius and 100 milliseconds for minimum fixation duration. For the analysis we considered three independent variables: average fixation duration, number of fixations or fixation count, and the number of regressions. MS Excel and the statistical tool SPSS were used for data analysis aimed at determining the effect of presentation format on fixation duration, fixation count, and number of regressions.
Results
Average reading speeds for different text presentation formats were calculated when the participants used manual pacing. Participants read the text in paragraph format at 136 words per minute whereas the reading speeds were 128, 156, and 137 words per minute for sentence-bysentence, line-by-line and chunk presentation formats, respectively. No statistically significant difference was revealed between the text presentation formats in terms of reading speed, because of the high variation per participants. The median reading speeds varied between 134 and 144 words per minute, confirming that our setting for the automatic pacing was appropriate.
The main aim of this study was to see how fixation duration, fixation count, and the number of regressions (dependent variables) would co-vary with the presentation formats for the passages (independent variable). Effects of the independent variable on dependent variables are discussed below, in two subsections, followed by an analysis of the participants’ subjective opinions.
Effect of text presentation format on fixation duration and fixation count
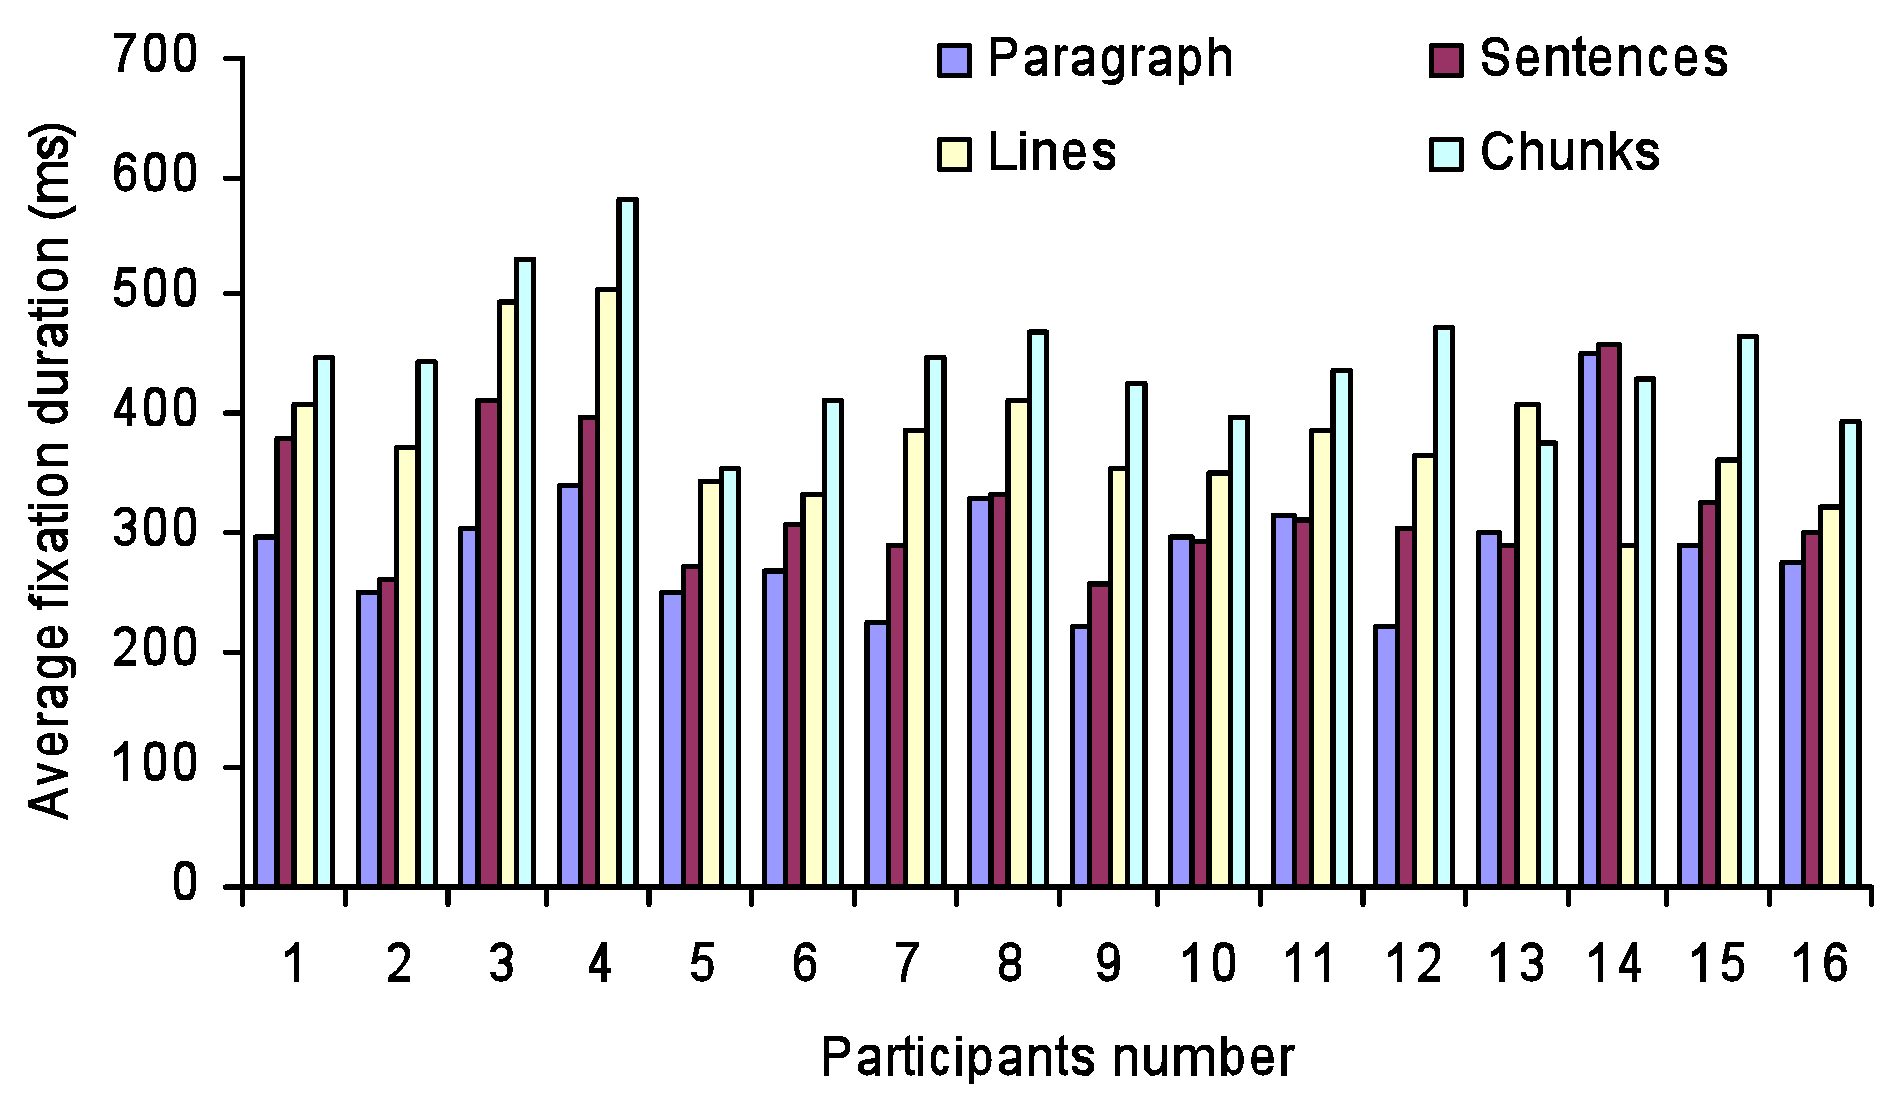
One-way repeated measures ANOVA showed that fixation duration was affected significantly by changes in presentation format (F
3,60 = 22.102,
p < .001 for automatic pacing and F
3,60 = 8.951,
p < .001 for manual pacing). In both automatic and manual pacing, the longer the presentation unit was, the shorter the average fixation duration observed (see
Figure 2).
More specifically, Bonferroni post hoc tests for multiple comparisons found significant differences in average fixation duration in automatic pacing between lines and the other three formats (paragraph, sentences, and chunks) and also between chunks and the other three formats. All of these mean differences were significant at the .05 level. In manual pacing, average fixation duration differed significantly between the format with the smallest presentation unit (i.e., chunks) and the other three formats (paragraph, sentences, and lines) at p < .05.
One-way repeated measures ANOVA also revealed that fixation count per minute or normalized fixation count was affected significantly by differences in presentation format (F
3,60 = 22.938,
p < .001 for automatic pacing and F
3,60 = 9.681,
p < .001 for manual pacing). Predictably, the trend observed with normalized fixation count (see
Figure 3) was opposite that seen with average fixation duration. Larger presentation units produced a higher number of fixations than did the smaller units.
More specific analysis via Bonferroni post hoc tests for multiple comparisons found that the normalized fixation count in automatic pacing differed significantly within each pair in combinations of the four presentation formats. The mean differences were significant at the .05 level. On the other hand, with manual pacing the smallest format unit (chunks) showed a significantly lower fixation count than the other three formats did, with p < .01. The other small-unit format, lines, had a significantly lower fixation count than the paragraph only at p <.05.
Thus it was observed that all the smaller units were associated with significantly longer average fixation duration and lower normalized fixation count than the relatively large units. It was more likely that smaller presentation units for the text brought ambiguity and hence the fixation duration increased for retrieval of the content’s meaning. On the other hand, larger sections of text represented clearer meaning of the context: the viewer can read the text without any interruption. Therefore, instead of paying great attention to any other place in the text, the reader pursues smooth reading with relatively short fixation duration. As a result, in automatic pacing, since the time for reading text in different formats was the same, a higher numbers of fixations appeared, corresponding to shorter fixation durations.
Effect of text presentation format on the number of regressions
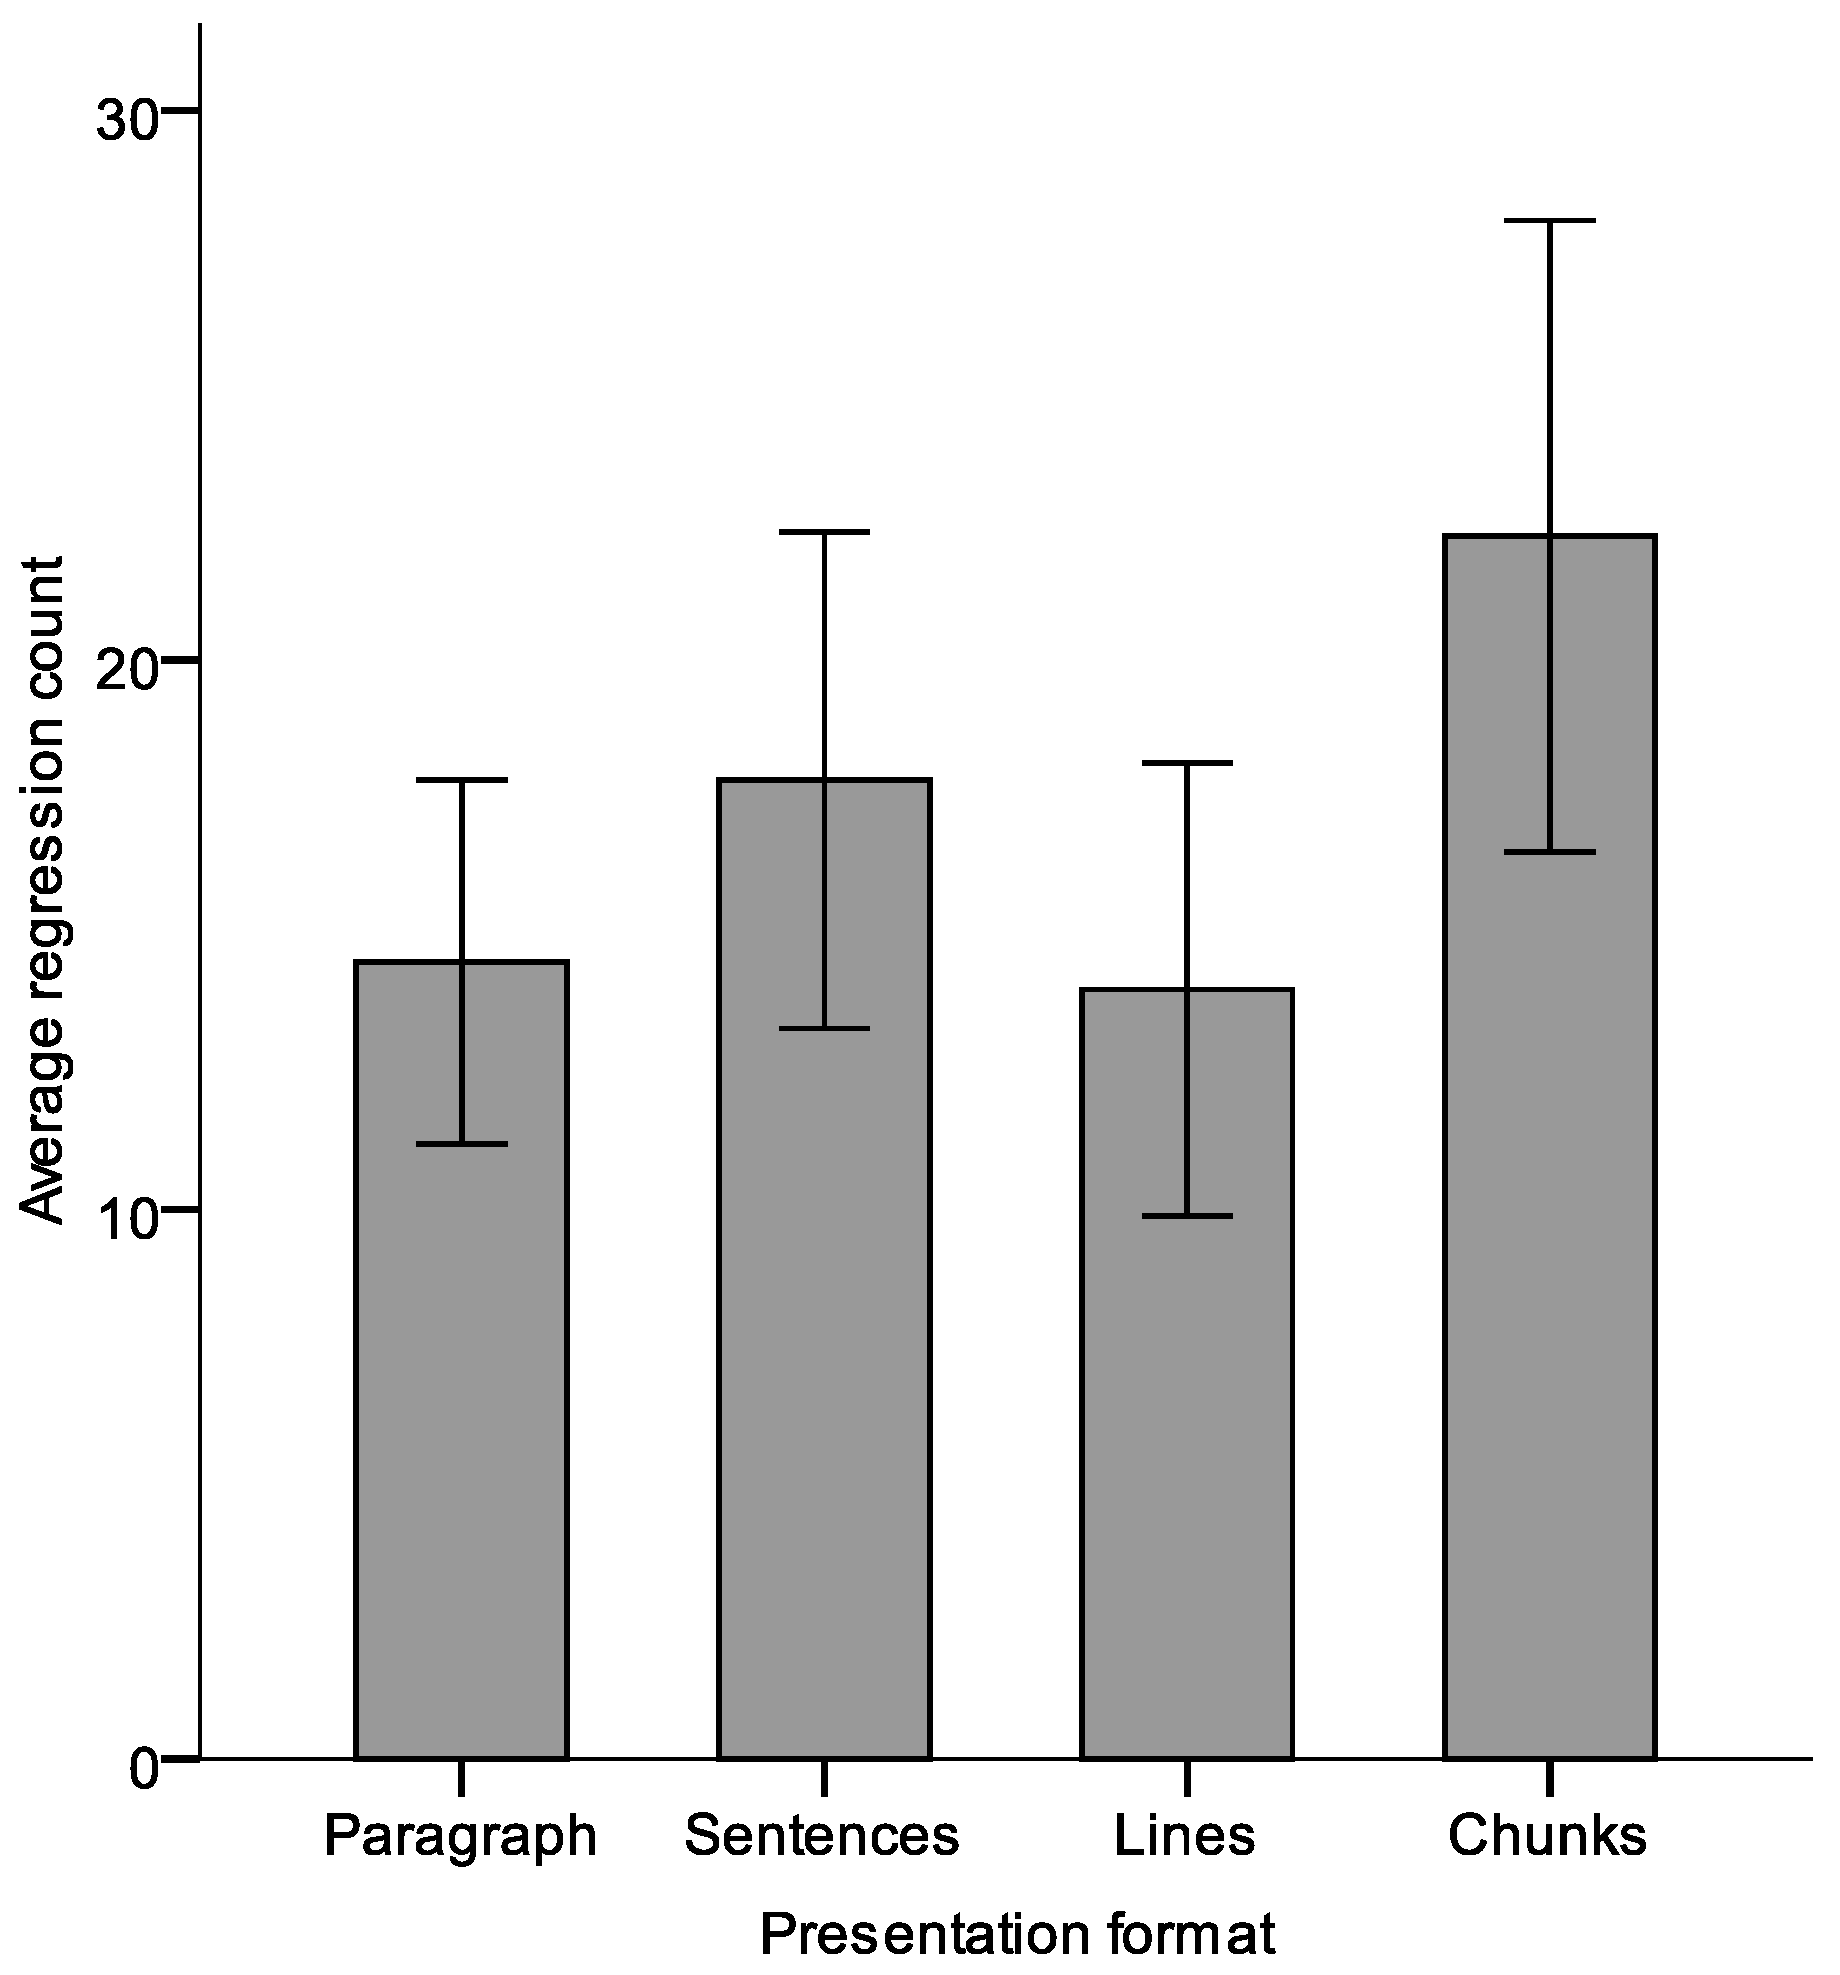
Presentation formats also influence the number of regressions. One-way repeated measures ANOVA revealed that the number of regressions was affected significantly by presentation format when the pacing was manual with F
3,60 = 2.843 and
p < .05 (see
Figure 4). Post hoc tests for multiple comparisons found that in manual pacing the smallest unit (chunks) showed a significantly greater number of regressions than did the largest unit (paragraph) and the relatively large unit of lines. The mean differences were significant at the 0.05 level.
Thus, regressions were observed more over chunks than with the paragraph format. Readers went back and forward often while reading chunks. On the other hand, the eyes followed a pattern of smooth reading with the paragraph format. Usually, we reread more when there is ambiguity in the text. Using smaller portions of the text (small chunks at a time) does not provide enough information for understanding of the context. Users might feel more cognitive pressure when reading text in chunks. To overcome the ambiguity, participants tended to reread more. These findings also supported the results related to fixation duration and fixation count.
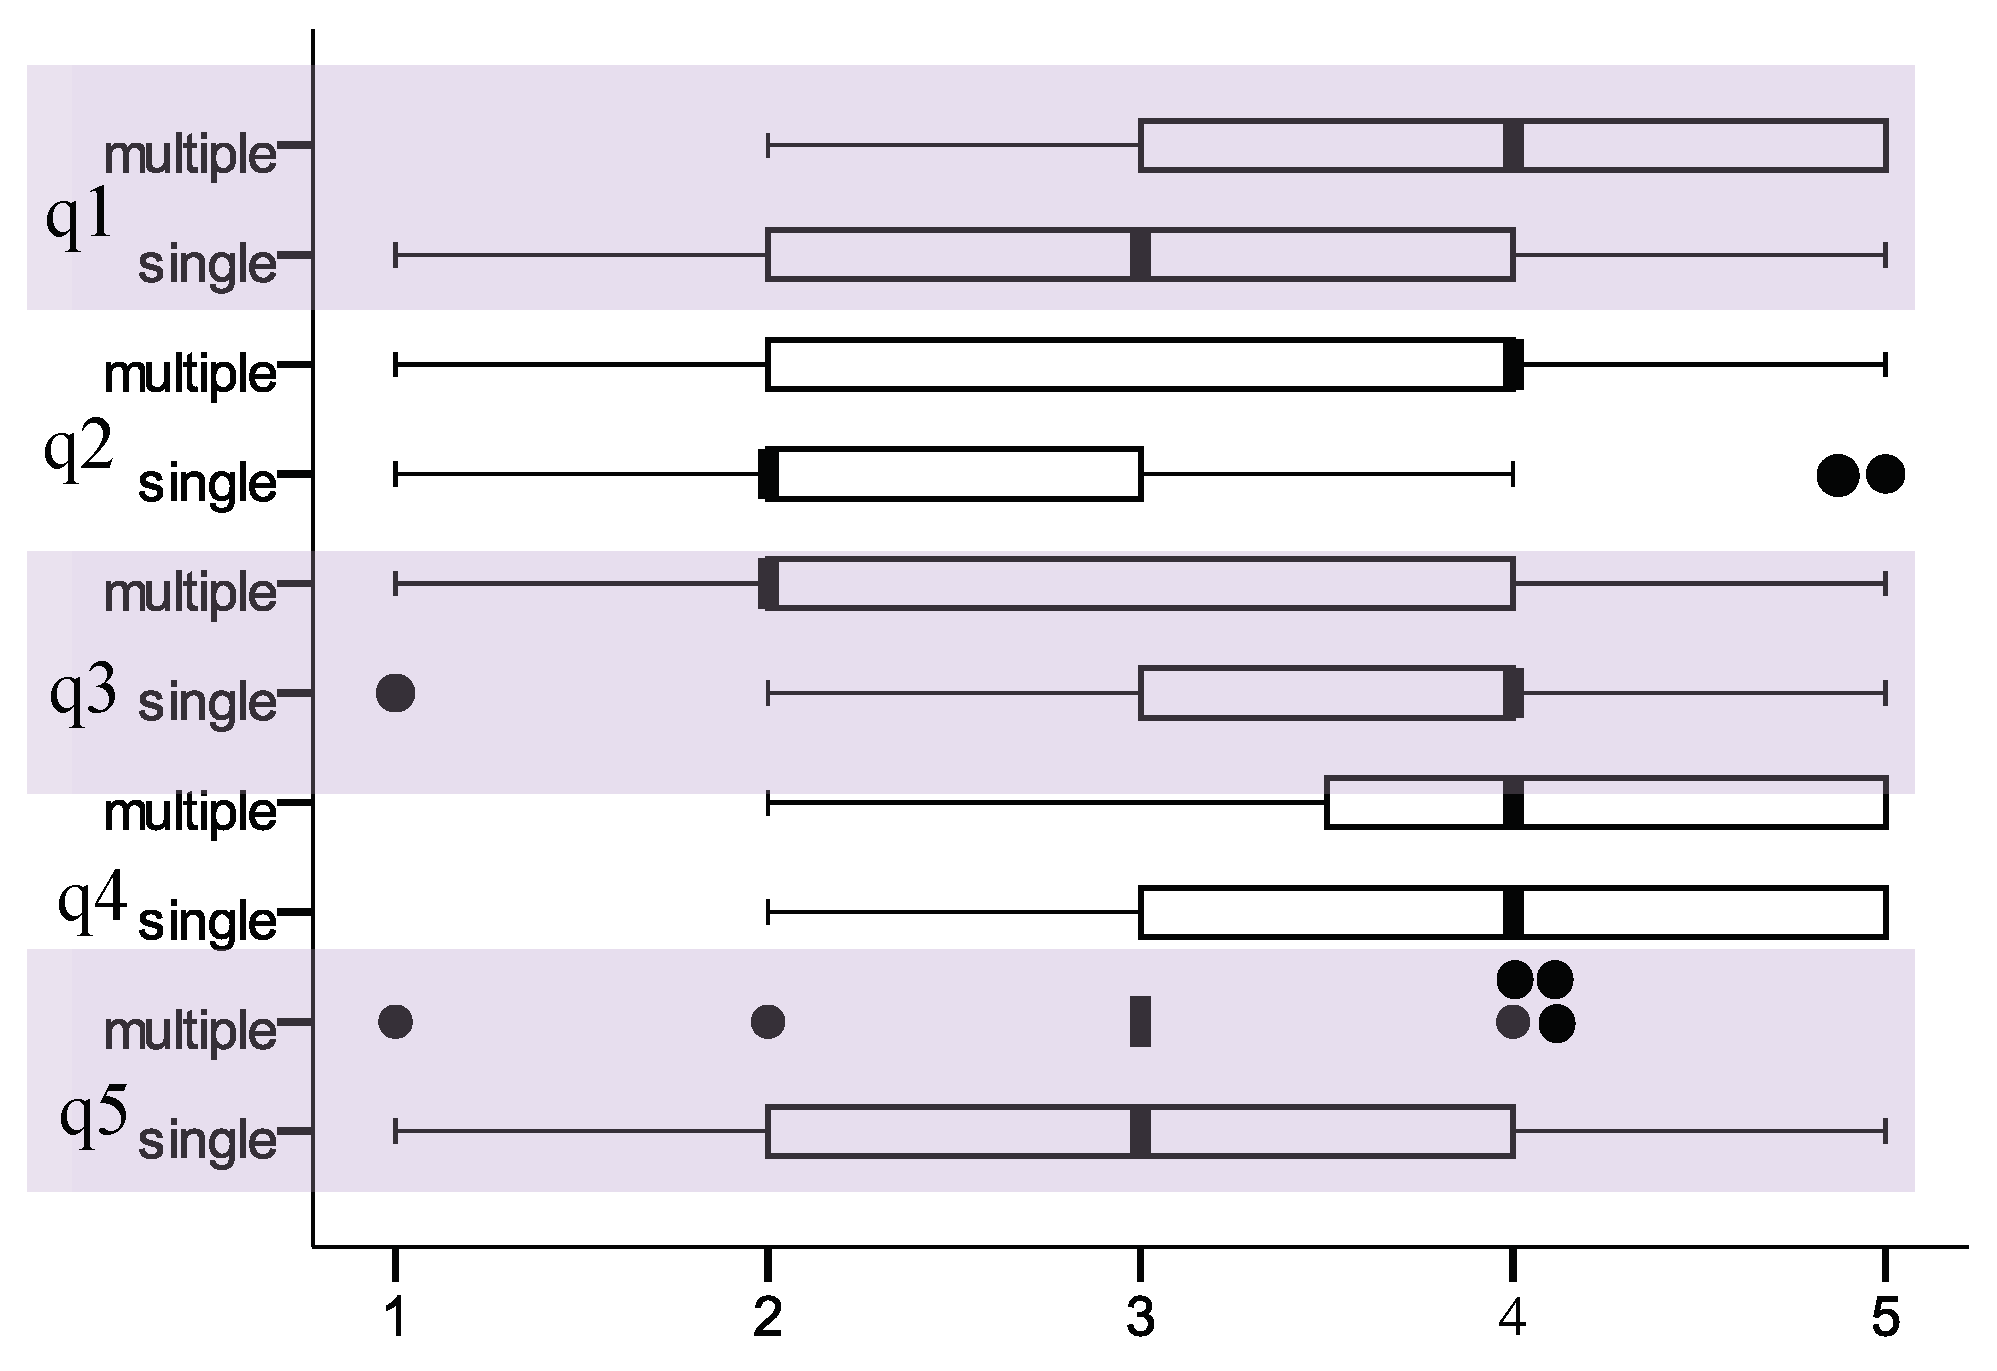
The post-test questionnaire administered to the participants at the end of the experiment comprised short questions to answer from the text. The motivation was to see that the participants had read the text carefully. The post-test questionnaire also gathered subjective opinions on the text presentation formats. There were five claims to be rated on a five-point Likert scale (1 = fully agree, 2 = agree somewhat, 3 = neutral, 4 = disagree somewhat, and 5 = fully disagree) for each text presentation format. The claims are presented in Table 1. Claim 5 used ratings from 1 = “too slow” to 5 = “too fast”. The box plot in
Figure 5 presents, in compact form, the responses for the claims from all participants. Each box represents 50% of the data. Edges of the boxes represent lower and upper quartiles of the data, respectively. The bar in the box indicates the median. The dots denote outliers that are further away from the box than 1.5 times its length. Whiskers extend up to the maximum and minimum value of the data points that are not considered outliers. To simplify the figure, we have grouped the data, originally separate for each of the four presentation formats (paragraph, sentence-by-sentence, line-by-line, and in chunks), into two sets, as if there were only two formats. Data from the paragraph and the sentence-by-sentence formats are referred to as “multiple” as those formats consisted of text in multiple lines. Correspondingly, the line-by-line and chunk presentation formats are referred to as “single” (see
Figure 5).
In automatic pacing, the text appeared on the screen for a constant duration. Out of 16 participants, 13 expressed the opinion that they did not have to concentrate more to read the text with a larger presentation unit (paragraph or full-sentence) when the pacing was automatic (claim q1 in Table 1). They encountered difficulties and had to concentrate more when reading with relatively small presentation units (line and chunks). In automatic pacing, the number of regressions was significantly higher for chunks than with paragraph format. With paired-samples t-test, the test statistics values were t = −2.437, df = 15, and p < .05.
On the other hand, the participants reported that automatic pacing affected their understanding of the meaning of the text while they were reading with a larger unit, more than when they were reading smaller units of text (claim q2). Consequently, larger text presentation units were more stressful to read than smaller units were (claim q3). Participants’ responses to these two claims in some respects contradict the responses to claim q1 and other findings.
Regardless of the presentation format, most of the participants thought that the passages were much easier to read when the pacing was controlled manually (claim q4). The speed of the automatic pacing was satisfactory for both the bigger and smaller units. For chunks, the respondents had mixed opinions. Six claimed that the pacing was slow, and another six claimed that it was faster.
Discussion
Our results indicated that smaller text presentation units (chunks and line-by-line) produced significantly higher average fixation duration and lower normalized fixation count than did the relatively bigger units (sentence-by-sentence and paragraph). According to
Mills and Weldon (
1985) eye movement data may reflect the difficulty, discriminability and comprehensibility of text. Therefore, we may assume that smaller units for presentation of the text created ambiguity, which led to increased fixation duration. In contrast, larger text presentation units represent clearer meaning of the context and elimination of ambiguity, since the viewer can read the text without any interruption. Therefore, instead of paying much attention to a single place in the text, the reader performs smooth reading with relatively short fixation duration. These findings are also in line with the studies of
Mills and Weldon (
1987) and
Rudnicky and Kolers (
1984), who claimed that larger text sizes are considered more readable than smaller ones.
Post hoc analysis for multiple comparisons found significantly more regressions with the shortest sections (chunks) than with the largest unit (paragraph) and a relatively long-unit format (lines). Often rereading occurs more when there is ambiguity in the text. Smaller snippets of text (i.e., short chunks at a time) do not provide enough information for understanding of the context. Users might feel more cognitive pressure while reading text in chunks. Our findings are consistent with those of
Dillon et al. (
1990), who found that splitting sentences causes a reader to reread more. Splitting was more likely to disrupt the comprehension process by placing an extra burden on the limited capacity of working memory.
The post-test questionnaire in our study revealed that the participants preferred the sentence and paragraph formats. Their least favored format was chunks. Most of the participants expressed the opinion that they did not have to concentrate more to read the text with a larger presentation unit (paragraph or full-sentence) when the timing to read was fixed or the pacing was automatic. They encountered difficulties and had to concentrate more when reading with relatively small presentation units (line or chunk). Correspondingly, statistical analysis showed that as the text unit shrank from paragraph to sentences and then to chunks, the eye movement metrics changed. The number of regressions was also lower for the paragraph than with chunks. Therefore, the null hypothesis that the presentation formats do not have any effect on the typical eye movement metrics can be rejected. We may summarize our findings as follows: There exists significant effect of text presentation format on the eye movement metrics (fixation duration, fixation count, and regressions) when we read onscreen text.
Our results confirm the findings of the previous studies discussed above and extends them in two ways. First, the length of the text unit to be read was varied systematically. Thus the results allow a quantitative analysis of the effect of the length of the unit, which should help in contrasting the results of previous studies that typically have covered only a part of this design spectrum. Second, our analysis was based on eye movement metrics, which most of the studies on reading dynamic text have not done. Again, although the conclusions concerning the preferred formats match those obtained previously, the eye movement data allows a quantitative analysis of the effects of the different formats.
The reading speeds obtained in our study were lower than those in the study of
Öquist and Lundin (
2007), who used a mobile device instead of the desktop monitor. This suggests that the width of the display can negatively affect reading speed. However, this would require further experimentation.
Our next step is to apply the current findings in developing a print interpreting tool which provides dynamic text to read for the hard of hearing people as a media of communication. The settings of the available print interpreting tool allow letter-by-letter and word-by-word presentation of the text. The findings of our study should provide useful knowledge to improve this tool with better text presentation formats.