Abstract
When humans pursue sinusoidal target motion they rapidly learn to track with minimal phase error despite inherent visuomotor processing delays; prior evidence suggests that prediction might even occur within the first cycle. Here, this has been examined by evoking reactive responses to single cycle stimuli having randomised periodicity and peak velocity. Periodicity was varied within three specific ranges with differing average periodicity. Initial responses in the first half-cycle were remarkably similar within periodicity ranges, irrespective of target velocity or frequency, but differed between ranges. In contrast, in the second half-cycle eye velocity closely matched the target in velocity and timing, irrespective of differences in eye velocity in the first half. Abrupt transitions occurred between first and second half-cycles, consistent with the hypothesis that target motion information is sampled and stored within the first half-cycle, irrespective of actual eye velocity evoked, and then released as a predictive estimate in the second half.
Introduction
The majority of experiments in which the initial component of ocular pursuit has been investigated have focussed on responses to randomised presentation of ramp or step-ramp stimuli (e.g. Carl & Gellman (1987)) . The aim has generally been to examine what is generally thought to be the visually driven part of the response to the exclusion of other influences such as prediction. By contrast, there have been very few studies examining transient responses to more complex stimuli such as sinusoids. Although sinusoidal stimuli have frequently been used to examine pursuit they are known to encourage prediction and analysis has concentrated on the steady-state conditions (Lisberger, Evinger, Johanson, & Fuchs, 1981). The aim of the current experiment was to examine what happens to the pursuit response in the transition between the onset of the initial visually driven component and the attainment of the predictive state. It is known from a previous experiment that this can happen very quickly (Barnes, Barnes, & Chakraborti, 2000). When single cycle sinusoidal stimuli of identical peak velocity and frequency were presented repeatedly at randomised intervals there was considerable learning of velocity and periodicity after the first cycle, resulting in a reduction of phase error. But there was also some evidence that this phase shifting process might happen even more quickly, perhaps within the first half-cycle (Barnes et al., 2000). In addition, it was notable that the response in the first half-cycle often did not fit the expected pattern. After the initial latent period and subsequent rise of eye velocity towards target velocity eye velocity did not appear to be modulated in accord with target velocity for the remaining half-cycle. The objective of the current experiment was therefore to investigate in more detail what happens to the velocity response in the first half-cycle as well as to examine the transition to the second half-cycle.
One of the factors that is likely to affect the response in the first half-cycle is the randomisation of the stimuli. Generally this has been taken to be necessary to evoke a reactive, visually-dependent response (Carl & Gellman, 1987; Lisberger & Westbrook, 1985). However, recent experiments have shown that pursuit responses may be heavily influenced by the history of the magnitude and timing of prior stimuli. This has been known to be true for anticipatory responses for many years (Kowler, Martins, & Pavel, 1984) and more recent studies have shed more light on the issue (Heinen, Badler, & Ting, 2005; Collins & Barnes, 2009). More surprisingly perhaps, prior stimuli have also been shown to affect the reactive response. In two recent publications it has been shown that the gain of reactive pursuit can be modified by prior stimuli of various kinds (Tabata, Miura, & Kawano, 2008; Tabata, Miura, Taki, Matsuura, & Kawano, 2006). The method used in the current experiments has been adapted from two other recent studies in our laboratory (Barnes & Collins, 2011; Collins & Barnes, 2009). In these studies it was shown that when a stimulus is composed of concatenated alternating segments of variable duration the magnitude and timing of the resultant eye velocity varies with the range of segment durations and velocities comprising the stimulus. In some instances this led to an unexpected reduction in peak eye velocity thought to be associated with a tendency to average the timing of anticipatory responses during randomised presentations. In the current experiment similar randomisations have been used to modify the velocity and frequency of single cycle sinusoidal stimuli within different ranges of frequency. The objective was to determine whether similar systematic modifications of the first half-cycle response could be observed and, if so, whether this would lead also to changes in the second half-cycle. The results show that despite degraded pursuit in the first half, subjects are able to learn the periodicity and magnitude of the stimulus so as to produce an appropriate predictive response to the second half.
Method
Subjects
Six subjects (two female) participated; their mean age was 37.6 years (SD 13.0). Five had prior experience of oculomotor experiments. All experiments were conducted in accordance with the declaration of Helsinki and with the approval of the local ethics committee. All subjects took part after giving voluntary, informed consent; they had no known neurological or oculomotor problems and had normal or corrected-tonormal vision.
Apparatus
Subjects sat in a darkened room and were presented with a red target against a blank background. The target was a circle subtending 1° in diameter at the eye; it was formed by optically reducing the image of an ultra-bright LED array that could be switched on and off very rapidly (rise time ~5µs), which was important for the presentation of catch trials. The target image was projected onto a screen (2.5m wide x 1.5m high) located 1.5m from the subject’s head. The target was moved in the horizontal axis by a servo-controlled mirror; its motion was controlled by a computer-generated waveform. The head was immobilized by side-clamps and a chin-rest. Eye movements were recorded by a limbus tracking device (Skalar Iris) that was firmly attached to the head.
Procedure
Each trial comprised a series of single cycle sinusoidal stimuli (each referred to as a presentation) which started from 16° left of centre and moved rightwards before returning leftward again, ending at the starting point (see Figure 1). Between presentations there was a randomised delay of 700-2300ms, during which the subject maintained fixation on the stationary target. In the following description the half-period of each presentation will be referred to, rather than its frequency, in order to maintain compatibility with the time domain description of the simpler constant velocity ramp stimuli used in previous studies (Collins & Barnes, 2009; Barnes & Collins, 2011). Eight different half-periods were presented 4 times each within a trial, the halfperiods falling within a specific range as defined below. In addition, 4 catch presentations were randomly embedded, in which the target was extinguished for the second half-cycle. This yielded a total of 36 presentations per trial. Half-period presentation order was randomised within each trial, the only constraint being that the same half-period was never presented consecutively. In addition, each presentation had one of 4 randomly assigned peak target velocities (28.3, 34.5, 40.8 and 47.1 deg/s), with the exception that catch presentations had only the highest peak velocity. Note that simple multiples of velocity were avoided in order to increase the number of displacement and timing combinations. Two differently randomised trials were given with the net result that within a total of 72 presentations there were 2 for each half-period and peak velocity and 1 catch trial for each half-period. Three halfperiod ranges were presented, in which half-period increased from the range minimum (Min) to the range maximum (Max) in increments of 60ms as follows: Short range: Min = 420ms, Max = 840ms (mean = 630ms); Medium range: Min = 600ms, Max = 1020ms (mean = 810ms); Long range: Min = 780ms, Max = 1200ms (mean = 990ms). As noted above, each subject carried out 2 trials (with different randomisation) for each half-period range, giving a total of 6 trials. Subjects were informed that the timing of target reversals would be unpredictable and were simply instructed to follow the target as closely as possible.
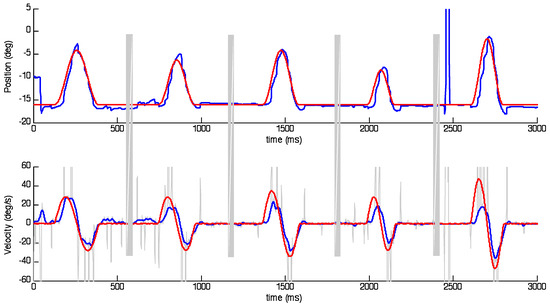
Figure 1.
Examples of target (red) and eye (blue) responses represented as position (upper) and velocity (lower). Stimuli were presented as single cycle sinusoids with randomised peak velocity and frequency. Grey bands indicate randomised delay periods during which data was not collected. Grey spikes in velocity trace indicate saccades that have been removed to obtain smooth eye velocity after interpolation.
Data Analysis
Recorded data were low-pass filtered at 80Hz and sampled every 4ms (i.e. 250Hz). Subsequent data analysis was carried out with Matlab Software (The Mathworks, Inc.). Eye and target velocity and acceleration were derived from the digitized data by the two-point central difference method and saccades were removed from the eye velocity signal using a technique described in detail elsewhere (Bennett & Barnes, 2003). Linear interpolation was used to fill the gaps left by the saccades removed (see Collins & Barnes (2006) for justification of using this technique) and the resultant data were then further filtered using a zero-phase autoregressive low-pass digital filter with a cut-off frequency of 30Hz. Target motion and eye response data for each presentation were collated in bins phase locked to the start of target motion and sorted according to target velocity and half-period. Statistical comparisons within the data were made using repeatedmeasures analysis of variance (Anova).
Results
Typical responses to the first six presentations of the transient sinusoid stimulus are shown in Figure 1. Within these responses it is evident that although the response to the first half-cycle lags behind the stimulus and frequently has reduced peak velocity (lower traces), in the second half-cycle there is much less phase error and peak eye velocity is generally closer to target velocity. Examination of eye displacement (upper trace) indicates that despite the reduction in velocity, eye position matches target position with little error, as a result of the action of corrective saccades.
The main effect reported here concerns the way in which the range of frequency stimuli within each trial influences the first and second halves of each sinusoidal response. This effect becomes evident after segregating the responses into bins with common halfperiod and averaging across the number of repeats within each bin. The result is shown in Figure 2 where both velocity and acceleration have been averaged over 6 subjects, 4 target velocity levels and 2 repeats for the three ranges of half-period examined (Long (top), Medium (middle) and Short (bottom)). Note that, for each range, only 3 of the 8 half-periods have been shown, for clarity; these are the shortest (blue), longest (red) and an intermediate example (green). The most notable feature is that, within each range, the responses in the first half-cycle are initially very similar, with eye velocity rising to a similar peak velocity at a similar time irrespective of frequency; in contrast, those in the second half-cycle match target velocity more closely, particularly with regard to the timing of peak velocity. These effects are compared in Figure 3, which shows calculated values of the magnitude and timing of peak velocity as a function of half-period. Analysis of variance indicated that time to peak in the first half-cycle (Tpk1, Figure 3) increased significantly (F7,120 = 5.73, p<0.001) within each range but its slope was considerably less than the ideal (shown by the solid blue line) that would be required for zero phase error. Moreover, comparison of the Tpk1 values for the 2 half-period values common to all ranges (780 and 840ms) indicated that Tpk1 increased significantly when moving from the Short to the Long range (F2,60 =9.66; p<0.001). By contrast, in the second half-cycle, timing of peak velocity (Tpk2, Figure 3D) lay very close to the midpoint of the half-cycle (solid blue line), indicating minimal phase error for most half-period values. Only for the shortest half-period (420ms) did Tpk2 lie outside the dashed line indicating the expected 80ms latency of visual feedback. Peak velocity in the first halfcycle (Vpk1, Figure 3) also remained relatively constant within each range but was well below mean peak target velocity (blue line) and decreased significantly when moving from the Long to the Short range (F2,120 = 75.73; p<0.001). Conversely, Vpk2 values (Figure 3) lay on a continuum, progressively increasing to towards mean target velocity (blue line), with no significant difference between Vpk2 values for half-periods common to all ranges. Neither Tpk1 nor Tpk2 were significantly modified by target peak velocity (Figure 4). In contrast, Vpk1 showed a small increase with target velocity (Figure 4), whereas in the second half-cycle, Vpk2 exhibited a much stronger dependence on target velocity with Vpk2 values very close to target velocity in the Long and Medium ranges. Given the surprisingly limited effect of target velocity on Vpk1, evidence was sought for a dependence of Vpk1 on prior target velocity, but no significant correlation was found.
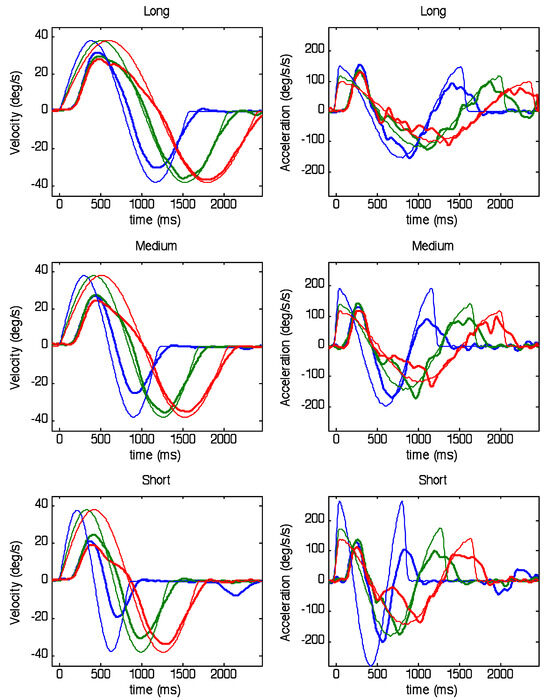
Figure 2.
Velocity (left) and acceleration (right) of eye (thick traces) and target (thin traces) obtained after collation of all stimuli and responses into bins of common periodicity for each of the ranges of periodicity (Short, Medium and Long). Responses are averaged across all subjects and target velocities. For clarity, only three of the eight periodicity bins are shown; in each range, blue, green and red traces represent the 1st (i.e. highest frequency), 5th and 8th (i.e. lowest frequency) bins, respectively. Note particularly, the discontinuity in eye velocity and acceleration in red traces at mid-cycle.
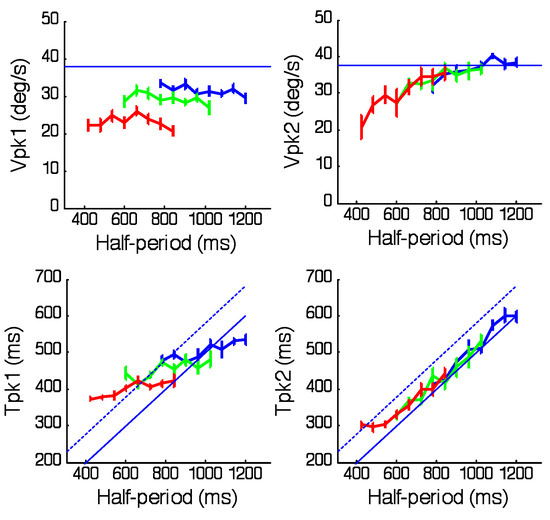
Figure 3.
Effects of half-period duration on the magnitude (Vpk1,1st half-cycle; Vpk2,2nd half-cycle) and corresponding timing (Tpk1, Tpk2) of peak eye velocity in each of the 3 periodicity ranges; Short (red), Medium (green) and Long (blue) after averaging across target velocity. Mean of 6 subjects ± 1SEM. Solid blue lines indicate desired mean peak velocity (upper plots) or desired timing of peak velocity for zero phase error (lower plots). Broken lines show a time 80ms after desired peak.
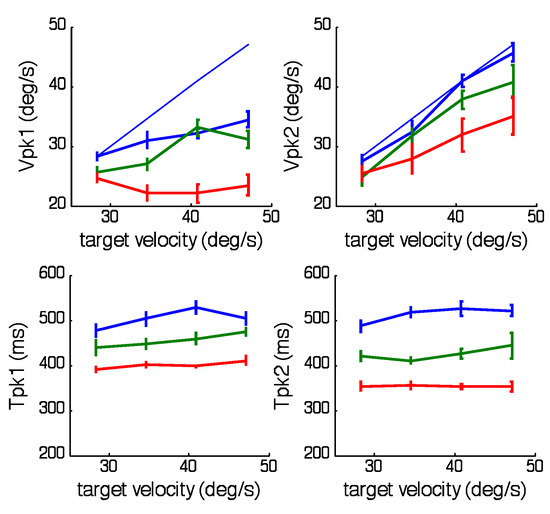
Figure 4.
Effects of target velocity on the magnitude (Vpk1,1st half-cycle; Vpk2,2nd half-cycle) and corresponding timing (Tpk1, Tpk2) of peak eye velocity in each of the 3 periodicity ranges; Short (red), Medium (green) and Long (blue) after averaging across all half-periods within each range. Mean of 6 subjects ± 1SEM. Solid blue lines indicate desired mean peak velocity.
The changes in the magnitude and timing of peak eye velocity show that, within the first half-cycle, the subjects have rapidly learnt to generate a response to the second half that is graded in magnitude and has very little phase error. Examination of eye acceleration (Figure 2, right panels) reveals some of the processes involved. In the first half-cycle the magnitude (Apk1) and timing (Tapk1) of the peak acceleration were remarkably constant within each range and unaffected by target velocity, as shown in Figure 5. For the 2 halfperiods common to all ranges there was a small, but significant (F2,60=13.4; p<0.001), increase in Apk1 when moving from the Short to the Long range . Following the initial attainment of peak, eye acceleration fell towards zero (corresponding to the point of peak velocity), giving a very similar bell-shaped profile (Figure 2, right panels). However, after reversing direction, eye acceleration followed a very different course depending on the target frequency. Most interesting are the examples corresponding to the lowest frequency within each range (plotted in red), in which the acceleration in the reversed direction remained very low up until a point that was very close to the reversal of target direction. At this point, there was an abrupt increase in (negative) acceleration that brought eye acceleration very close to target acceleration. In the velocity traces (Figure 2left hand panels) this abrupt acceleration was seen as the sudden change in slope of eye velocity just before the target direction change. Following this abrupt change, eye acceleration closely matched target acceleration for the second half-cycle, regardless of half-period range. Although the lowest frequency in each range exhibited the abrupt change most clearly, it could also be seen at other intermediate frequencies (e.g. green traces, Figure 2).
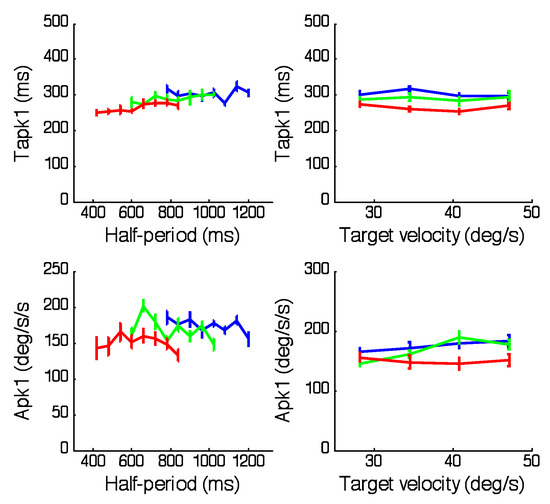
Figure 5.
Magnitude (Apk1,1st half-cycle) and corresponding timing (Tapk1) of peak eye acceleration in each of the 3 periodicity ranges; Short (red), Medium (green) and Long (blue). In the left hand panels values have been averaged across target velocity, whereas on the right, they have been averaged across all half-periods within each range. Mean of 6 subjects ± 1SEM.
An important factor is that the abrupt change in acceleration occurs just prior to the change of direction and is therefore not likely to be driven by visual feedback, especially since it is a negative acceleration that is being initiated at a time when target velocity is still positive. Since the timing of the target direction change was randomised, the timing of this acceleration increase must have been based on the timing information derived from the first half-cycle. Moreover, the acceleration level at the beginning of the second half-cycle was dependent on both the peak target velocity (which was randomised) and the frequency of target motion, so that a very wide range of accelerations were required to match target acceleration. The effectiveness of this predictive matching can be assessed by examining eye acceleration 80ms after the direction change (mid-cycle acceleration, Figure 6). The reason for choosing this time comes from the results of the occasional catch trials embedded in the experimental procedure. These show that when the target disappeared unexpectedly at the change of direction, eye velocity continued to be similar to the standard response long after the time (80ms) at which visual feedback would have an influence (Figure 7). Any response generated after this time was therefore largely controlled by internal predictive mechanisms. As shown in Figure 6, although there was a lot of variability in eye acceleration (which was partly associated with the increased noise created by double differentiation of eye position) it is apparent that mid-cycle acceleration was greater for the highest target velocity (thick green traces) than for the lowest (thick blue traces) and decreased as half-period increased in all ranges. Analysis of variance confirmed there were significant effects of target velocity (F3,160=12.39; p<0.001) and half-period (F7,160=12.23; p<0.001) on mid-cycle acceleration. Mid-cycle eye acceleration was quite close to target acceleration (shown by thin lines) for the Medium and Long ranges, though not for the Short range. As expected, there was a close similarity between acceleration levels for the catch trials (red traces) and the highest target velocity of the standard task. The dashed green line in Figure 6 represents eye acceleration 80ms before direction change for the highest target velocity and thus illustrates the abrupt change in acceleration that takes place over this period.
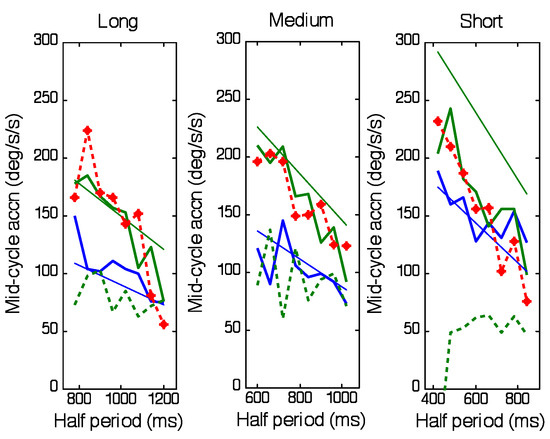
Figure 6.
Eye acceleration 80ms after the end of the first halfcycle as a function of half-period for each of the 3 periodicity ranges (Short, Medium and Long). Thick blue and green traces represent values obtained for lowest and highest target velocities, respectively. Red trace represents catch trials at highest velocity. Thin blue and green lines indicate stimulus acceleration. Dashed green line indicates acceleration 80ms before end of first half-cycle for highest velocity. Mean of 6 subjects.
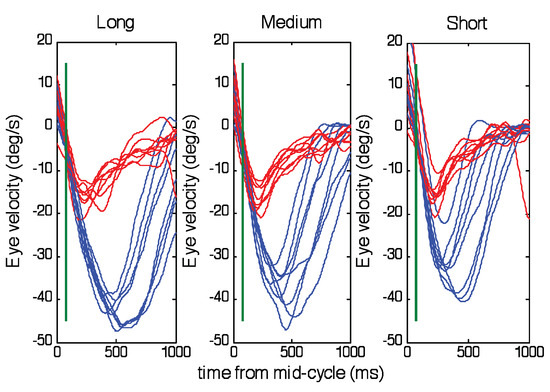
Figure 7.
Comparison of eye velocity in the second half-cycle for the regular (blue) and catch (red) trials. Each trace represents the mean across all subjects for each of the half-periods within each periodicity range (Short, Medium and Long). The green vertical line indicates 80ms after mid-cycle.
The net effect of these findings is that when responses to a half-period common to all ranges are compared, as in Figure 8 (half-period = 840ms), it becomes evident that velocity profiles in the first halfcycle are dependent on the half-period range whereas those in the second half-cycle are much more similar to each other. Responses in the Long range (blue traces) show a continuously changing velocity profile in the first half; those from the Medium (green) and Short (red) ranges have lower peak velocities and exhibit an abrupt change in velocity just prior to the change of direction. Examination of the corresponding eye acceleration (Figure 8 right) clearly reveals the discontinuity that occurs in the first half-cycle of the Short (red) and Medium (green) range responses, which contrasts with the close matching to target acceleration in the second half-cycle for all ranges.
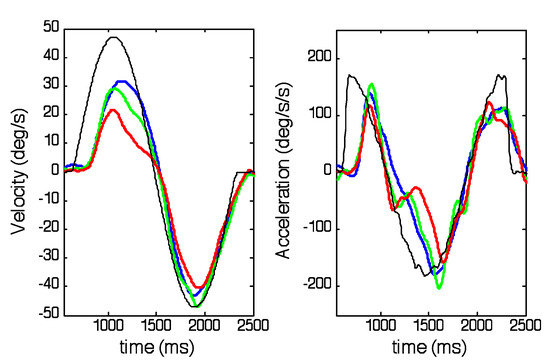
Figure 8.
The effects of half-period range on eye velocity (left) and acceleration (right) for a stimulus half-period (840ms) common to all 3 ranges; Short (red), Medium (green) and Long (blue). Thin black traces represent target velocity (left) and acceleration (right). Responses averaged across all subjects for target peak velocity of 47.1deg/s.
Discussion
This experiment demonstrates two important aspects of the ocular pursuit response to sinusoidal stimuli. Firstly, it shows that the magnitude of the response in the first half-cycle is influenced as much by context as it is by visual feedback, the magnitude and timing of the response being dependent on the range of frequencies presented within a given trial. Secondly, the results show that whatever the response in the first half-cycle the response in the subsequent half-cycle is similar irrespective of the range of frequencies present and, moreover, is appropriately scaled in magnitude and timing to the individual characteristics of the second half-cycle. The discussion that follows will concentrate on attempting to explain how these effects occur.
Firstly, the changes in peak velocity in the first half-cycle exhibit similar properties to those found previously for randomised stimuli of a more continuous nature. In the first of these studies (Collins & Barnes, 2009) the basic stimulus was a succession of constant velocity ramps that had randomised durations (RDs) identical to the half-periods used in the current experiment. The results indicated that, despite randomisation, subjects initiated an anticipatory decline in eye velocity prior to each target direction change and that the time at which this occurred was based on a running average of the RDs presented within that series. As a result the time of anticipatory decline was dependent on the mean duration of the ramps within a given sequence. In the second study (Barnes & Collins, 2011) the ramps were replaced by half-cycle sinusoids in which, unlike the ramps, stimulus deceleration provided cues about the impending occurrence of target direction changes. However, despite the presence of these cues, the timing of anticipatory deceleration was still found to be dependent on the range of RDs (equivalent to half-periods in the current experiment) within the range. In both studies it was found that, in the Short range, responses to all frequencies in the range had attenuated peak velocity even when comparable RDs in the Long range matched or exceeded target peak velocity. In the concatenated ramp responses this peak velocity attenuation in the Short range was clearly associated with an earlier onset of anticipatory deceleration than in the Long range. When ranges with even shorter mean RDs were used the attenuation was even greater. It was concluded that the decline in peak velocity was probably associated with the early deceleration encroaching upon the initial accelerative response to the target motion. In the current experiment this effect has been observed in a more accentuated manner; i.e. there is a greater decline in peak eye velocity between the Long and the Short range than observed previously. This may reflect the fact that each response was reactive and therefore started later and did not reach target velocity as early as in the situation where anticipatory smooth pursuit boosted the initial response.
However, it is also likely that the randomisation of target velocity in addition to the frequency may have reduced initial eye acceleration and rendered it relatively insensitive to actual target velocity. This is evident in the constancy of the initial eye acceleration pulse that occurs in the first half-cycle (Figure 5). It appears that in the face of the uncertainty of the impending target velocity a stereotyped acceleration is generated that is largely uninfluenced by current target velocity. Only towards the end of this initial acceleration is there evidence of the influence of visual feedback in the small increase in peak eye velocity as target velocity increases. A somewhat similar effect has been demonstrated for anticipatory smooth pursuit by (Heinen et al., 2005); when ramp stimuli had predictable timing and direction but randomised velocity, anticipatory eye velocity was fairly constant irrespective of target velocity and was intermediate to the anticipatory velocities evoked by stimuli of predictable velocity. In such responses the anticipatory velocity appears dependent on the history of prior target velocity (Kowler & McKee, 1987; Poliakoff, Collins, & Barnes, 2005)), producing an averaging effect similar to that for timing. More pertinently, it has also been shown that history of prior target velocity affects the reactive acceleration of pursuit (Tabata et al., 2008; Tabata et al., 2006). These authors used a task in which a ramp stimulus of variable velocity was preceded by a very brief target perturbation, acting as a probe for the pursuit response. The velocity evoked by the perturbation was found to be influenced by the history of prior ramp velocity. The effects were interpreted as changes in pursuit gain with stimulus history. Whether this conclusion applies to the results of the current experiment remains in doubt, since no correlation of initial peak velocity (Vpk1) with prior stimulus velocity was found. It is possible that a different strategy was adopted in the current experiment, one that entails matching only the lowest velocity, on the basis that no overshooting of target velocity will be created and positional errors can easily be corrected by the saccadic system.
In the second half-cycle, behaviour was very different to that observed in the first half-cycle. For the longest half-periods within each series there was an abrupt change in eye acceleration just before the start of the second half-cycle that enabled the eye to follow the target much more effectively than in the first half. It is evident from the velocity profiles in Figure 2 (red and green traces) that the attainment of this appropriately scaled acceleration at the beginning of the second halfcycle enabled eye velocity to track target velocity with minimal phase error and near unity gain throughout the whole half-cycle. The fact that the timing of peak velocity (Tpk1) was so close to the time of peak target velocity and, in particular, was well within the latency of visual feedback for all but the lowest frequency, indicates that this response was predictive, not dependent on visual feedback. This is confirmed by the response in the catch trials (Figure 7) which continued well after the 80ms latent period following the unexpected disappearance of the target. This result was not unexpected given the response to catch trials in two previous experiments using similar sinusoidal stimuli. Barnes et al., (2000) used a catch trial paradigm in which repeated single cycle sinusoids of one peak velocity were unexpectedly changed to one with much lower peak velocity. Subjects generated a sinusoidally modulated response appropriate to the higher peak velocity for ~400ms before being able to reduce eye velocity to the new lower level, the overshoot of velocity creating a positional error that had to be corrected with saccades. Orban de Xivry et al. (2008) showed a very similar effect when examining eye velocity during the disappearance of a target moving on a circular path.
The implication is that the magnitude and frequency of the motion have been rapidly learnt in the first half, and that the stored information is then used to construct the predictive response for the second half that is graded in magnitude and appropriate in timing. How both the timing and velocity of the response can be so appropriate in the 2nd half-cycle when they are clearly not so in the first half-cycle is not known. We previously suggested that an efference copy of eye velocity itself might be stored in each half-cycle and then used to predictively drive the eye in the next halfcycle (Barnes & Asselman, 1991). Although giving good simulations of the gain and phase of sinusoidal pursuit over a wide range of frequencies (Barnes, 1994), this concept is not compatible with the current observations. The more likely explanation, as outlined in more recent publications (e.g. Barnes & Collins, 2011) is that what is stored is an internal representation of target velocity, reconstructed by the summation of an efference copy of eye velocity and the retinal velocity error signal. In this way the timing and magnitude characteristics of the stimulus may be stored irrespective of the actual smooth eye velocity. This then allows an explanation of the previous observation that even when the subjects simply view, but do not pursue, the first presentation of a repeated sequence, they are still able to make a predictive response to the second presentation (Barnes et al., 2000).
The most important factor that governs the behaviour in the two half-cycles is probably the expectation associated with each. In the first half-cycle the subject has an expectation of target frequency that is based on prior experience and produces a response that is cut off after a time that is based on averaging of timing in prior stimuli. Eye velocity, on the other hand, appears to be based on the lowest velocity experienced when target velocity is randomised. In the second half-cycle the expectation is quite different; the subject’s experience ence indicates that this will always have the same velocity and periodicity as the first half and it is possible therefore to use the information gleaned from the first half to generate a predictive response that overcomes time delays in visuomotor processing. This difference in expectation between the first and second half-cycles is similar to that observed recently by de Hemptinne et al. (2010) for to-and-fro movement on a circular trajectory. Although it is clear that some prediction does occur in the second half-cycle it is likely that this will not represent the optimum level of phase shift that can be obtained, particularly for higher frequency stimuli, which may require two or three presentations to reach a minimum phase (Barnes et al., 2000). As suggested previously (Barnes & Collins, 2011; Bennett & Barnes, 2004) it is likely that the changed expectation at the beginning of the second half-cycle allows internal (extra-retinal) pursuit control to be switched to the output of a predictive drive based on stored motion information; the abrupt change of acceleration just prior to the second half-cycle may be a manifestation of this behaviour.
References
- Barnes, G. R. 1994. Edited by J. M. Delgado-Garcia, E. Godaux and P. P. Vidal. A model of predictive processes in oculomotor control based on experimental results in humans. In Information processing underlying gaze control. Oxford: Elsevier Science Ltd., pp. 279–290. [Google Scholar]
- Barnes, G. R., and P. T. Asselman. 1991. The mechanism of prediction in human smooth pursuit eye movements. Journal of Physiology (London) 439: 439–461. [Google Scholar] [CrossRef] [PubMed]
- Barnes, G. R., D. M. Barnes, and S. R. Chakraborti. 2000. Ocular pursuit responses to repeated, single-cycle sinusoids reveal behavior compatible with predictive pursuit. Journal of Neurophysiology 84: 2340–2355. [Google Scholar] [CrossRef] [PubMed][Green Version]
- Barnes, G. R., and C. J. Collins. 2011. The influence of cues and stimulus history on the non-linear frequency characteristics of the pursuit response to randomized target motion. Experimental Brain Research 212, 2: 225–240. [Google Scholar] [PubMed]
- Bennett, S. J., and G. R. Barnes. 2003. Human ocular pursuit during the transient disappearance of a moving target. Journal of Neurophysiology 90: 2504–2520. [Google Scholar] [CrossRef] [PubMed]
- Bennett, S. J., and G. R. Barnes. 2004. Predictive smooth ocular pursuit during the transient disappearance of a visual target. Journal of Neurophysiology 92: 578–590. [Google Scholar] [PubMed]
- Carl, J. R., and R. S. Gellman. 1987. Human smooth pursuit: stimulus-dependent responses. Journal of Neurophysiology 57: 1446–1463. [Google Scholar] [CrossRef] [PubMed]
- Collins, C. J. S., and G. R. Barnes. 2006. The occluded onset pursuit paradigm: prolonging anticipatory smooth pursuit in the absence of visual feedback. Experimental Brain Research 175: 11–20. [Google Scholar] [CrossRef] [PubMed]
- Collins, C. J. S., and G. R. Barnes. 2009. Predicting the unpredictable: weighted averaging of past stimulus timing facilitates ocular pursuit of randomly timed stimuli. Journal of Neuroscience 29: 13302–13314. [Google Scholar] [PubMed]
- de Hemptinne, C., G. R. Barnes, and M. Missal. 2010. Influence of previous target motion on anticipatory pursuit deceleration. Experimental Brain Research 207, 173–184. [Google Scholar] [CrossRef] [PubMed]
- Heinen, S. J., J. B. Badler, and W. Ting. 2005. Timing and Velocity randomization similarly affect anticipatory pursuit. Journal of Vision 5: 493–503. [Google Scholar] [PubMed]
- Kowler, E., A. J. Martins, and M. Pavel. 1984. The effect of expectations on slow oculomotor control IV. Anticipatory smooth eye movements depend on prior target motions. Vision Research 24: 197–210. [Google Scholar] [PubMed]
- Kowler, E., and S. P. McKee. 1987. Sensitivity of smooth eye movement to small differences in target velocity. Vision Research 27: 993–1015. [Google Scholar] [PubMed]
- Lisberger, S. G., C. Evinger, G. W. Johanson, and A. F. Fuchs. 1981. Relationship between eye acceleration and retinal image velocity during foveal smooth pursuit in man and monkey. Journal of Neurophysiology 46: 229–249. [Google Scholar] [CrossRef] [PubMed]
- Lisberger, S. G., and L. E. Westbrook. 1985. Properties of visual inputs that initiate horizontal smooth pursuit eye movements in monkeys. Journal of Neuroscience 6: 1662–1673. [Google Scholar]
- Orban de Xivry, J.-J., M. Missal, and P. Lefèvre. 2008. A dynamic representation of target motion drives predictive smooth pursuit during target blanking. Journal of Vision 8: 6.1–13. [Google Scholar] [CrossRef] [PubMed][Green Version]
- Poliakoff, E., C. J. S. Collins, and G. R. Barnes. 2005. Attention and selection for predictive smooth pursuit eye movements. Cognitive Brain Research 25, 3: 688–700. [Google Scholar] [CrossRef] [PubMed]
- Tabata, H., K. Miura, and K. Kawano. 2008. Trial-bytrial updating of the gain in preparation for smooth pursuit eye movement based on past experience in humans. Journal of Neurophysiology 99, 2: 747–758. [Google Scholar] [CrossRef] [PubMed][Green Version]
- Tabata, H., K. Miura, M. Taki, K. Matsuura, and K. Kawano. 2006. Preparatory gain modulation of visuomotor transmission for smooth pursuit eye movements in monkeys. Journal of Neurophysiology 96, 6: 3051–3063. [Google Scholar] [PubMed]
© 2012 by the authors. This article is licensed under a Creative Commons Attribution 4.0 International License.