Repeated Web Page Visits and the Scanpath Theory: A Recurrent Pattern Detection Approach
Abstract
:Introduction
The Scanpath Theory
Applicability to Real-World Stimuli
Identification of Similarity in Eye Movement Sequences
Markov analysis
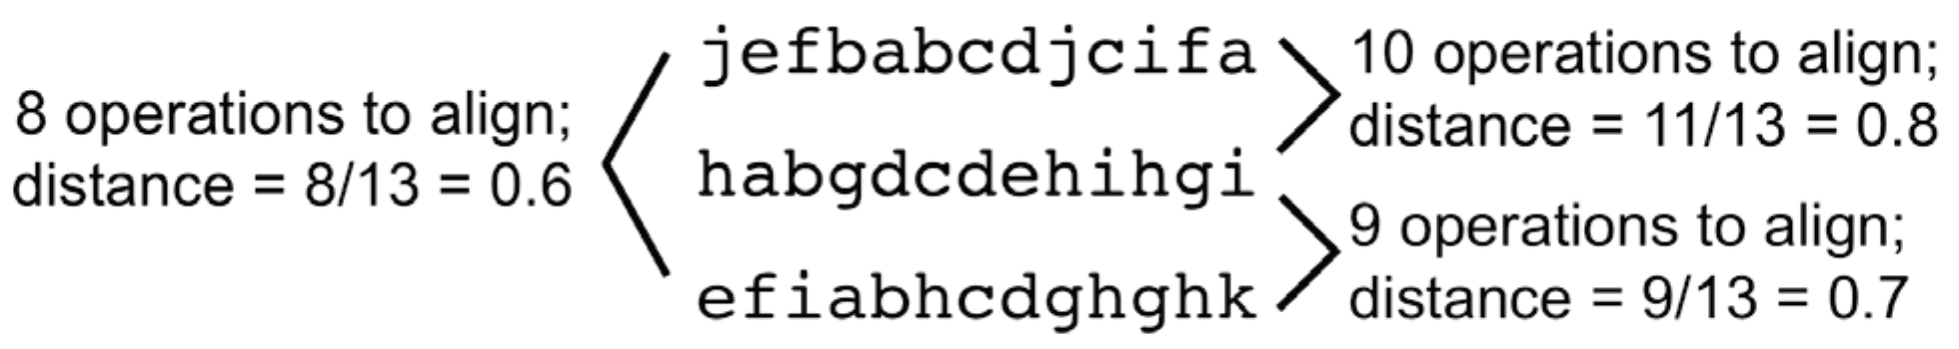
String-editing
T-Pattern detection
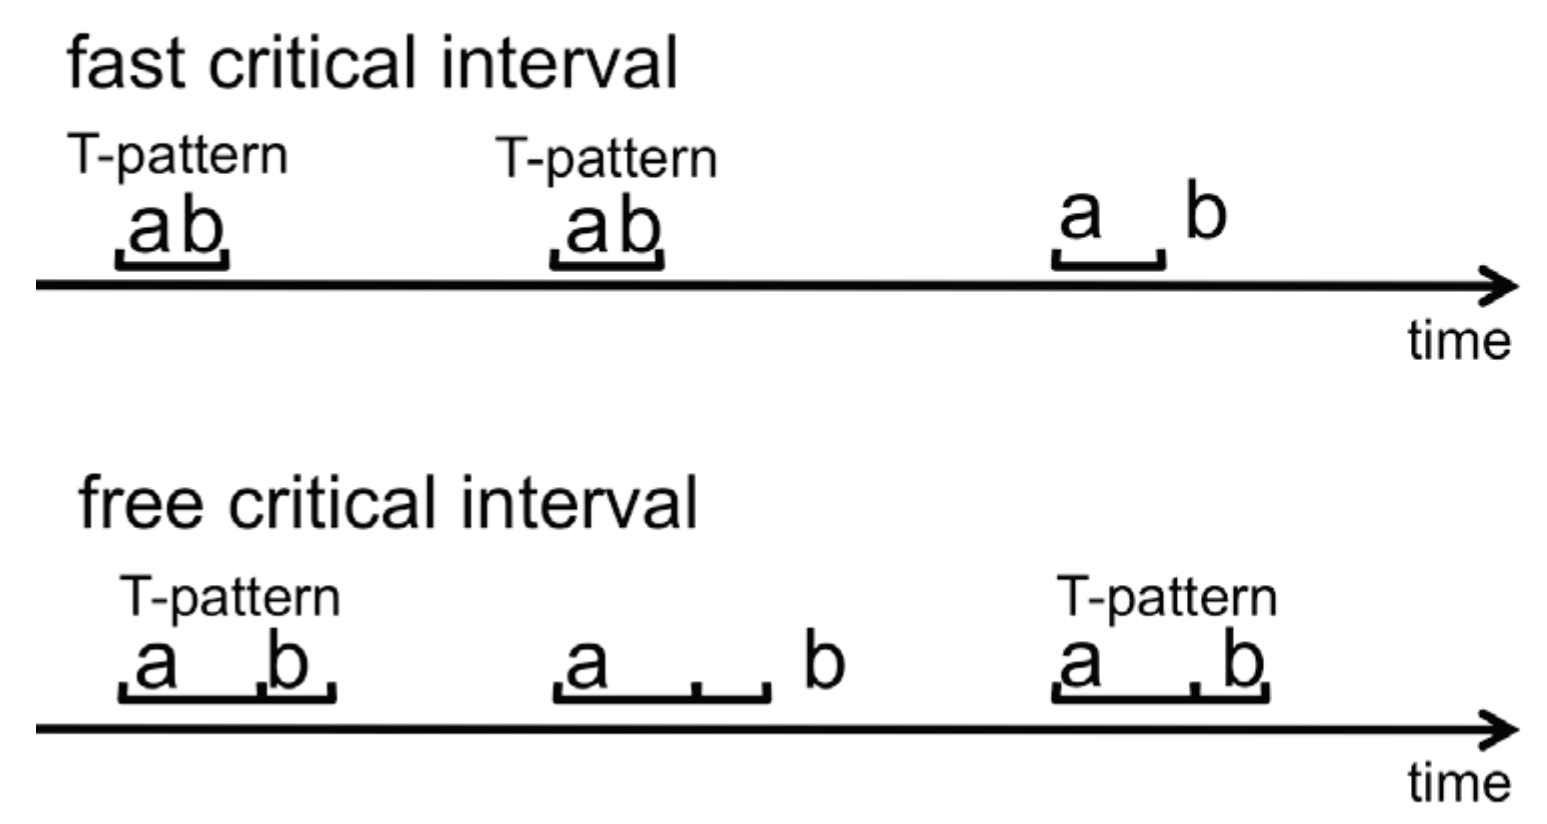
The critical interval algorithm measures the time from each occurrence (end) of Xleft to the first following or concurrent occurrence (beginning) of Xright. Using this distribution and some preset significance level, it searches for the longest possible interval [d1, d2] such that (Xleft) (ending at t) is, significantly more often than expected by h0, followed within [t+d1, t+d2] by the beginning of another component (Xright); where h0 is that (Xright) is independently randomly distributed over the observation period [t1, t2] with a constant probability per time unit = N(Xright) / (t2-t1+1); where N(Xright) is the number occurrences of Xright. (Magnusson, 2005, p. 11)
Advantages of T-pattern detection over Markov analysis and string-editing
- (1)
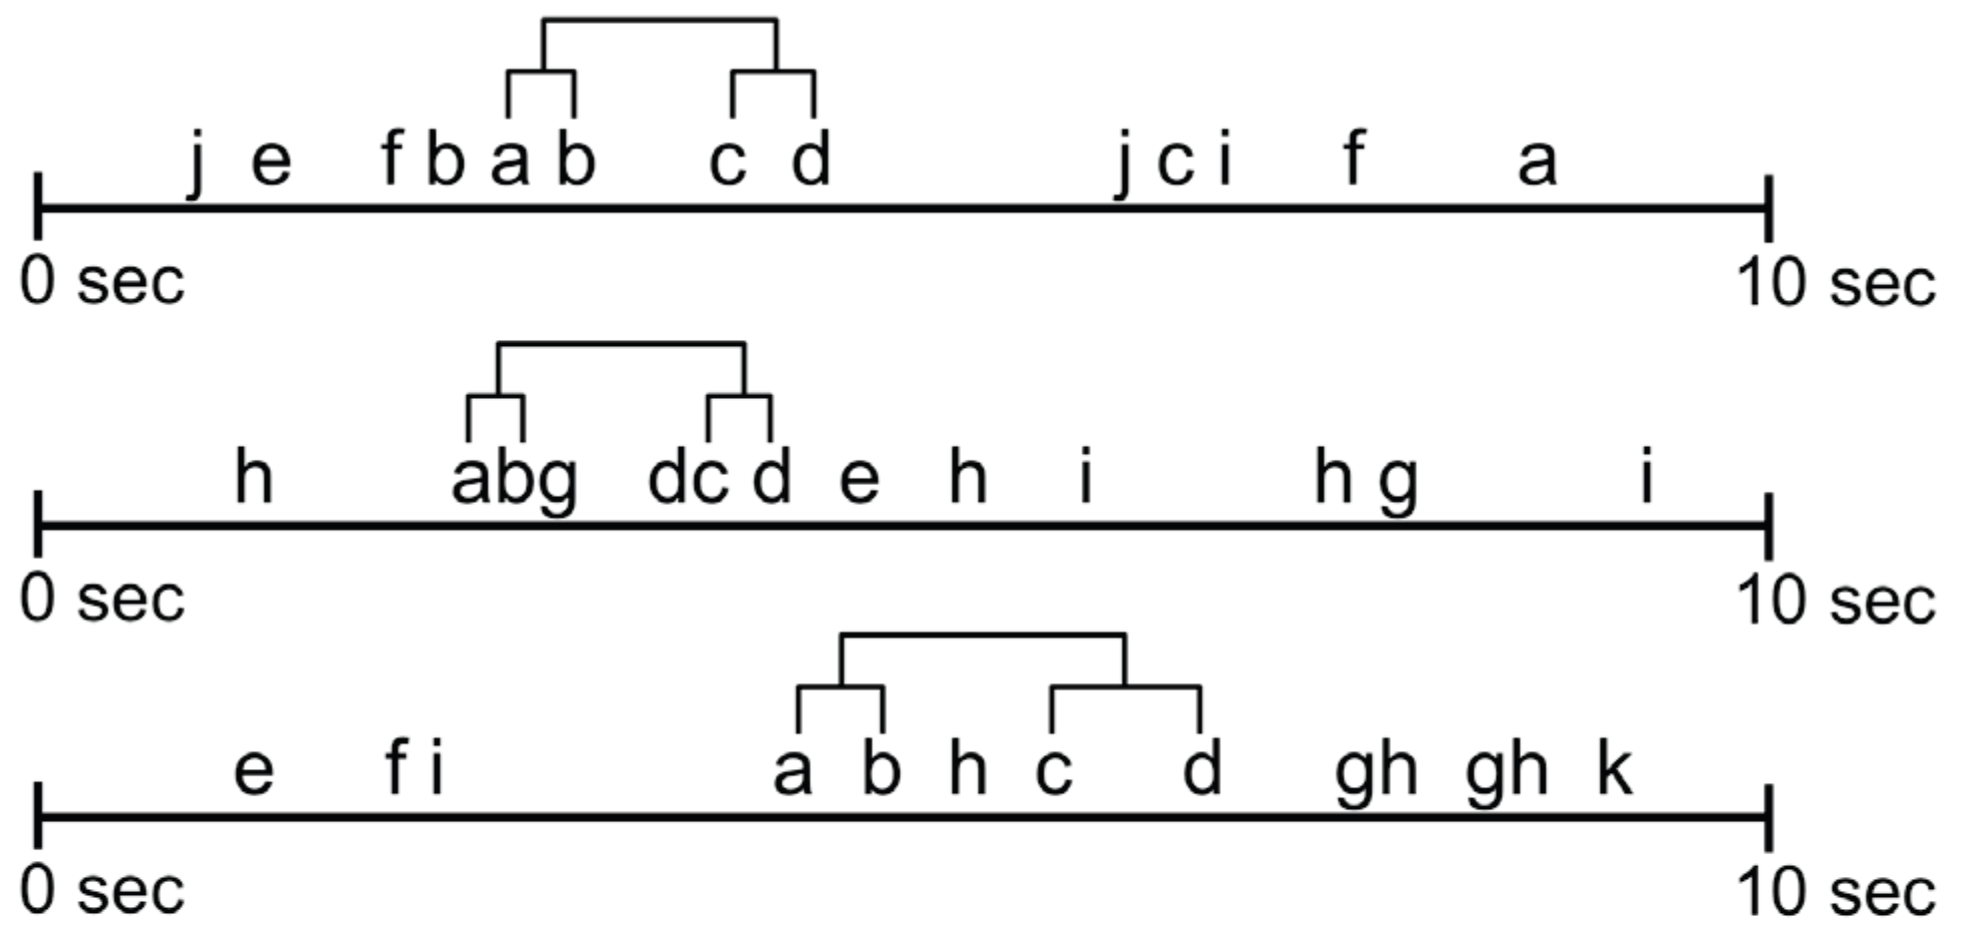
- Recurrent patterns are extracted and become observable. For example, the beginning and end of a repetitive scanpath can be identified as the beginning and end of the associated T-pattern and the ROIs contained in the pattern can be studied. A T-pattern does not necessarily represent a continuous sequence in the ROI fixation data on each occurrence, i.e. on occurrences of the T-pattern, other ROIs may have been looked at between pattern components (see Figure 5). Thus, some variation in the eye movement sequences is accounted for.
- (2)
- T-pattern detection does not require a reduction of eye movement data to ordinal sequence data or transition frequency data. The real-time temporal dimension is preserved and more accuracy retained regarding the identification of relevant similarities.
- (3)
- The number of sequences to be compared in one analysis run is unlimited.
- (4)
- The technique is robust to a high number of noise elements in the data. T-patterns need not represent continuous sequences of ROIs and a T-pattern may span just part of a sequence. For example, consider the two gaze sequences ‘gabcdegweiuhviuuwedeertiugearg’ and ‘tabcderqnmqxtcsxlfkfzcoqfoosxq’, each letter representing an ROI. They would show low similarity with stringediting and the recurrent pattern (abcde) at the beginning could go unnoticed, even if repeated across many stimulus exposures.
- (5)
- The metrics provided by T-pattern detection (e.g., T-pattern quantity, length, and occurrence frequency) measure repetition not similarity. If many and long Tpatterns are detected and they occur frequently this means that, possibly intermittent, subsequence repetition is high. String-editing in contrast quantifies the similarity of complete sequences. For the repetitive scanpath paradigm, the repetition perspective may be the more relevant criterion.
Hypotheses
Method
Participants
Stimuli and Procedure
Task
Apparatus
Data Preparation
Scanpath Definition for T-Pattern Detection
Modifications for Testing Hypotheses 2 and 3
Validation of T-Patterns Against Chance Occurrence
Results


Discussion
Conclusion
Future Work
References
- Açık, A., S. Onat, F. Schumann, W. Einhäuser, and P. Kö-nig. 2009. Effects of luminance contrast and its modifications on fixation behavior during free viewing of images from different categories. Vision Research 49: 1541–1553. [Google Scholar] [CrossRef] [PubMed]
- Ballard, D. H., M. M. Hayhoe, and J. B. Pelz. 1995. Memory representations in natural tasks. Journal of Cognitive Neuroscience 7: 66–80. [Google Scholar] [CrossRef] [PubMed]
- Biederman, I., R. J. Mezzanotte, and J. C. Rabinowitz. 1982. Scene perception: Detecting and judging objects undergoing relational violations. Cognitive Psychology 14: 143–177. [Google Scholar] [CrossRef]
- Brandt, S. A., and L. W. Stark. 1997. Spontaneous eye movements during visual imagery reflect the content of the visual scene. Journal of Cognitive Neuroscience 9: 27–38. [Google Scholar] [CrossRef] [PubMed]
- Borgatti, E. F., M. Everett, and L. C. Freeman. 1992. UCINET IV (Version 1.0) [Computer software. Analytic Technologies, Columbia, SC. [Google Scholar]
- Cave, K. R., and J. M. Wolfe. 1990. Modeling the role of parallel processing in visual search. Cognitive Psychology 22: 225–271. [Google Scholar] [CrossRef]
- Chun, M. M., and Y. Jiang. 1998. Contextual cueing: implicit learning and memory of visual context guides spatial attention. Cognitive Psychology 36: 28–71. [Google Scholar] [CrossRef] [PubMed]
- Cockburn, A., and B. McKenzie. 2001. What do web users do? An empirical analysis of web use. Interna-tional Journal of Human-Computer Studies 54: 903–922. [Google Scholar] [CrossRef]
- Donders, F. C. On the speed of mental processes. In Attention and Performance II. Acta Psychologica. Edited by W. G. Koster. vol. 30, pp. 412–431, (Original work published in 1868).
- Ellis, S. R., and J. D. Smith. 1985. Patterns of statistical dependency in visual scanning. In Eye movements and human information processing. Edited by R. Groner, G. W. McConkie and C. Menz. Am-sterdam: Elsevier: pp. 221–238. [Google Scholar]
- Faraday, P. 2000. Visually critiquing web pages. Proc. 6th Conference on Human Factors and the Web, Aus-tin, Texas. [Google Scholar]
- Foulsham, T., and G. Underwood. 2008. What can sali-ency models predict about eye movements? Spatial and sequential aspects of fixations during encoding and recognition. Journal of Vision 8: 1–17. [Google Scholar] [CrossRef]
- Friedman, A. 1979. Framing pictures: The role of knowledge in automatized encoding and memory for gist. Journal of Experimental Psychology: General 108: 316–355. [Google Scholar] [CrossRef]
- Fujita, T., C. M. Privitera, and L. W. Stark. 2007. Image-type dependent eigen-regions-of-interest define con-spicuity operators for predicting human scanpath fixa-tion. Computers in Biology and Medicine 37: 965–974. [Google Scholar] [CrossRef]
- Gbadamosi, J., and W. H. Zangemeister. 2001. Visual imagery in hemianopic patients. Journal of Cognitive Neuroscience 13: 855–866. [Google Scholar] [CrossRef] [PubMed]
- Goldstein, D. G., and G. Gigerenzer. 2002. Models of ecological rationality: The recognition heuristic. Psy-chological Review 109: 75–90. [Google Scholar] [CrossRef]
- Gray, W. D., and W.-T. Fu. 2004. Soft constraints in in-teractive behavior: The case of ignoring perfect knowledge in-the-world for imperfect knowledge in-the-head. Cognitive Science 28: 359–382. [Google Scholar]
- Gray, W. D., C. R. Sims, W.-T. Fu, and M. J. Schoelles. 2006. The soft constraints hypothesis: A rational analysis approach to resource allocation for interac-tive behavior. Psychological Review 113: 461–482. [Google Scholar] [CrossRef]
- Green, D. M., and J. A. Swets. 1966. Signal detection theory and psychophysics. New York: Wiley. [Google Scholar]
- Grier, R. A., P. Kortum, and J. T. Miller. 2007. How users view web pages: An exploration of cognititve and perceptual mechanisms. In Human Computer Interaction Re-search in Web Design and Evaluation. Edited by P. Zaphiris and S. Kur-niawan. Idea Group Publishing: Hershey: pp. 22–41. [Google Scholar]
- Groner, R., and M. Groner. 1982. Towards a hypothetico-deductive theory of cognitive activity. In Cognition and eye movements. Edited by R. Groner and P. Fraisse. Amsterdam: Elsevier: pp. 100–121. [Google Scholar]
- Groner, R., and M. Groner. 1983. A stochastic hypothesis testing model for multi-term series problems based on eye fixations. In Eye movements and psychological functions: International views. Edited by R. Groner, C. Menz, D. Fisher and R. A. Monty. Hills-dale, NJ: Lawrence Erlbaum: pp. 257–274. [Google Scholar]
- Groner, R., and C. Menz. 1985. The effects of stimulus characteristics, task requirements and individual differences on scanning patterns. In Eye movements and human information processing. Edited by R. Groner, G. W. McConkie and C. Menz. Amsterdam: Elsevier, pp. 239–251. [Google Scholar]
- Groner, R., F. Walder, and M. Groner. 1984. Looking at faces: Local and global aspects of scanpaths. In Theoretical and applied aspects of eye movement research. Edited by A. G. Gale and F. Johnson. Amsterdam: Elsevier, pp. 523–533. [Google Scholar]
- Guan, Z., S. Lee, E. Cuddihy, and J. Ramey. 2006. The validity of the stimulated retrospective think-aloud method as measured by eye tracking. <i>Proc. CHI. </i>ACM Press: pp. 1253–1262. [Google Scholar]
- Hassenzahl, M., R. Kekez, and M. Burmester. 2002. The importance of a software's pragmatic quality depends on usage modes. In Proceedings of the 6th International Conference on Work With Display Units (WWDU). Edited by H. Luczak, A. E. Çakir and G. Ça-kir. Berlin: Ergonomic: pp. 275–276. [Google Scholar]
- Henderson, J. M. 2003. Human gaze control during real-world scene perception. Trends in Cognitive Sciences 7: 498–504. [Google Scholar] [CrossRef] [PubMed]
- Hoffman, D. L., and T. P. Novak. 1996. Marketing in hypermedia computer-mediated environments: Conceptual foundations. Journal of Marketing 60: 50–68. [Google Scholar] [CrossRef]
- Itti, L., and C. Koch. 2000. A saliency-based search mechanism for overt and covert shifts of visual attention. Vision Research 40: 1489–1506. [Google Scholar] [CrossRef]
- Jeannerod, M., P. Gerin, and J. Pernier. 1968. Déplace-ments et fixations du regard dans l’exploration libre d’une scène visuelle. Vision Research 8: 81–97. [Google Scholar] [CrossRef]
- Josephson, S., and M. E. Holmes. 2002. Attention to repeated images on the World-Wide Web: Another look at scanpath theory. Behavior Research Methods, Instruments, & Computers 34: 539–548. [Google Scholar]
- Laeng, B., and D. Teodorescu. 2002. Eye scanpaths during visual imagery reenact those of perception of the same visual scene. Cognitive Science 26: 207–231. [Google Scholar] [CrossRef]
- Levenshtein, V. I. 1966. Binary codes capable of correcting deletions, insertions, and reversals. Soviet Physics Doklady 10: 707–710. [Google Scholar]
- Liter, J. C., and H. H. Bülthoff. 1998. An introduction to object recognition. Zeitschrift für Naturforschung C 53: 610–621. [Google Scholar] [CrossRef] [PubMed]
- Locher, P. J., and C. F. Nodine. 1973. Influence of stimu-lus symmetry on visual scanning patterns. Perception & Psychophysics 13: 408–412. [Google Scholar]
- Locher, P. J., and C. F. Nodine. 1974. The role of scan-paths in the recognition of random shapes. Perception & Psychophysics 15: 308–314. [Google Scholar]
- Loftus, G. R., and N. H. Mackworth. 1978. Cognitive determinants of fixation location during picture view-ing. Journal of Experimental Psychology: Human Perception and Performance 4: 565–572. [Google Scholar] [PubMed]
- Magnusson, M. S. 2000. Discovering hidden time pat-terns in behavior: T-patterns and their detection. Behavior Research Methods, Instruments, & Computers 31: 93–110. [Google Scholar]
- Magnusson, M. S. 2004. Theme (Version 5.0) [Com-puter software]. Wageningen, Netherlands: Noldus Information Technology. [Google Scholar]
- Magnusson, M. S. 2005. Understanding social interac-tion: Discovering hidden structure with model and al-gorithms. In The hidden structure of inter-action: From neurons to culture patterns. Edited by L. Anolli, S. Duncan Jr., M. S. Magnus-son and G. Riva. Amsterdam: IOS Press, pp. 3–22. [Google Scholar]
- Magnusson, M. S. 2006. Structure and communication in interactions. In From communi-cation to presence: Cognition, emotions and culture towards the ultimate communicative experience. Fest-schrift in honor of Luigi Anolli. Edited by G. Riva, M. T. Anguera, B. K. Wiederhold and F. Mantovani. Amsterdam: IOS Press, pp. 127–146. [Google Scholar]
- Mandler, G. 1980. Recognizing: The judgment of previous occurrence. Psychological Review 87: 252–271. [Google Scholar] [CrossRef]
- Mannan, S. K., K. H. Ruddock, and D. S. Wooding. 1997. Fixation sequences made during visual examination of briefly presented 2D images. Spatial Vision, vol. 11, pp. 157–178. [Google Scholar]
- Myers, C. W., and W. D. Gray. 2007. Are eye move-ments involved in cued target recall from repeating spatial contexts? In Proceedings of the 29th Annual Conference of the Cognitive Science Society. Edited by D. McNamara and G. Trafton. Nashville, TN, Hillsdale, NJ: Lawrence Erlbaum, pp. 515–520. [Google Scholar]
- Needleman, S. B., and C. D. Wunsch. 1970. A general method applicable to the search for similarities in the amino acid sequence of two proteins. Journal of Molecular Biology 48: 443–453. [Google Scholar] [CrossRef]
- Noton, D., and L. Stark. 1971a. Scanpaths in eye movements during pattern perception. Science 171: 308–311. [Google Scholar] [CrossRef]
- Noton, D., and L. Stark. 1971b. Scanpaths in saccadic eye movements while viewing and recognizing patterns. Vision Research 11: 929–942. [Google Scholar] [CrossRef]
- Nyström, M., and K. Holmqvist. 2008. Semantic override of low-level features in image viewing–both initially and overall. Journal of Eye Movement Research 2: 1–11. [Google Scholar] [CrossRef]
- Obendorf, H., H. Weinreich, E. Herder, and M. Mayer. 2007. Web page revisitation revisited: Implications of a long-term click-stream study of browser usage. <i>Proc. CHI. </i>ACM Press: pp. 597–606. [Google Scholar]
- Pan, B., H. A. Hembrooke, G. K. Gay, L. A. Granka, M. K. Feusner, and J. K. Newman. 2004. The determinants of web page viewing behavior: An eye-tracking study. <i>Proc. ETRA. </i>ACM Press: pp. 147–154. [Google Scholar]
- Parker, R. E. 1978. Picture processing during recognition. Journal of Experimental Psychology: Human Perception and Performance 4: 284–293. [Google Scholar] [PubMed]
- Peterson, M. S., M. R. Beck, and M. Vomela. 2007. Vis-ual search is guided by prospective and retrospective memory. Perception & Psychophysics 69: 123–135. [Google Scholar]
- Pieters, R., E. Rosbergen, and M. Wedel. 1999. Visual attention to repeated print advertising: A test of scan-path theory. Journal of Marketing Research 36: 424–438. [Google Scholar] [CrossRef]
- Posner, M. I. 1978. Chronometric explorations of mind. Hillsdale, NJ: Lawrence Erlbaum Associates. [Google Scholar]
- Privitera, C. M. 2006. The scanpath theory: its defini-tion and later developments. In Proc. SPIE-IS&T Electronic Imag-ing, SPIE Human Vision and Elec-tronic Imaging XI. Edited by B. E. Rogowitz, T. N. Pappas and S. J. Daly. The International Society for Optical Engineering: Vol. 6057, pp. 87–91. [Google Scholar]
- Privitera, C. M., and L. W. Stark. 1998. Evaluating image processing algorithms that predict regions of interest. Pattern Recognition Letters 19: 1037–1043. [Google Scholar] [CrossRef]
- Privitera, C. M., and L. W. Stark. 2000. Algorithms for defining visual regions-of-interest: Comparison with eye fixations. IEEE Transactions on Pattern Analysis and Machine Intelligence 22: 970–982. [Google Scholar] [CrossRef]
- Rada, R., and C. Murphy. 1992. Searching versus browsing in hypertext. Hypermedia 4: 1–30. [Google Scholar] [CrossRef]
- Rayner, K. 1998. Eye movements in reading and infor-mation processing: 20 years of research. Psychological Bulletin 124, 3: 372–422. [Google Scholar] [CrossRef]
- Rybak, I. A., V. I. Gusakova, A. V. Golovan, L. N. Pod-ladchikova, and N. A. Shevtsova. 1998. A model of attention-guided visual perception and recognition. Vision Research 38: 2387–2400. [Google Scholar] [CrossRef]
- Sankoff, D., and J. B. Kruskal, eds. 1983. Time warps, string edits, and macromolecules: The theory and practice of sequence comparison. Reading, Mass.: Addison-Wesley. [Google Scholar]
- Schill, K., E. Umkehrer, S. Beinlich, G. Krieger, and C. Zetzsche. 2001. Scene analysis with saccadic eye movements: top-down and bottom-up modeling. Journal of Electronic Imaging 10: 152–160. [Google Scholar] [CrossRef]
- Shah, A. K., and D. M. Oppenheimer. 2008. Heuristics made easy: An effort-reduction framework. Psycho-logical Bulletin 134: 207–222. [Google Scholar] [CrossRef] [PubMed]
- Stark, L. W., and S. R. Ellis. 1981. Scanpaths revisited: Cognitive models direct active looking. In Eye move-ments: Cognition and visual perception. Edited by D. F. Fisher, R. A. Monty and J. W. Senders. New Jersey: Lawrence Erlbaum Associates: pp. 193–226. [Google Scholar]
- Stark, L. W., C. M. Privitera, H. Yang, M. Azzariti, Y. F. Ho, T. Blackmon, and D. Chernyak. 2001. Repre-sentation of human vision in the brain: How does hu-man perception recognize images? Journal of Elec-tronic Imaging 10: 123–151. [Google Scholar] [CrossRef]
- Tauscher, L., and S. Greenberg. 1997. How people revisit web pages: Empirical findings and implications for the design of history systems. International Journal of Human-Computer Studies 47: 97–137. [Google Scholar] [CrossRef]
- Tobii. 2006. User manual Tobii eye tracker and Clear-View analysis software. Tobii Technology AB: Danderyd, Sweden. [Google Scholar]
- Ullman, S. 1996. High-level vision. Cambridge, USA: MIT Press. [Google Scholar]
- Unz, D. C., B. Werner, R. Mangold, and M. Burmester. 2005. Information seeking in the WWW: Detecting T-patterns in eye movements and navigational behav-iour. Proc. Measuring Behavior: Conference on Methods and Techniques in Behavioral Research, Wageningen, The Netherlands. [Google Scholar]
- Wagner, R., and M. Fischer. 1974. The string-to-string correction problem. Journal of the Association for Computing Machinery 21: 168–173. [Google Scholar] [CrossRef]
- Walker-Smith, G. J., A. G. Gale, and J. M. Findlay. 1977. Eye movement strategies involved in face perception. Perception 6: 313–326. [Google Scholar] [CrossRef]
- Wedel, M., and R. Pieters. 2006. Eye tracking for visual marketing. In Foundations and trends in marketing. Edited by J. Eliashberg, T. H. Ho and M. F. Luce. Delft, NL: now Publishers, Vol. 1, Issue 4. [Google Scholar]
- Yarbus, A. L. 1967. Eye movements and vision. New York: Plenum Press. [Google Scholar]
- Zangemeister, W. H., K. Sherman, and L. Stark. 1995. Evidence for a global scanpath strategy in viewing abstract compared to realistic images. Neuropsychologia 33: 1009–1025. [Google Scholar] [CrossRef]


 |
Copyright © 2010. This article is licensed under a Creative Commons Attribution 4.0 International License.
Share and Cite
Burmester, M.; Mast, M. Repeated Web Page Visits and the Scanpath Theory: A Recurrent Pattern Detection Approach. J. Eye Mov. Res. 2009, 3, 1-20. https://doi.org/10.16910/jemr.3.4.5
Burmester M, Mast M. Repeated Web Page Visits and the Scanpath Theory: A Recurrent Pattern Detection Approach. Journal of Eye Movement Research. 2009; 3(4):1-20. https://doi.org/10.16910/jemr.3.4.5
Chicago/Turabian StyleBurmester, Michael, and Marcus Mast. 2009. "Repeated Web Page Visits and the Scanpath Theory: A Recurrent Pattern Detection Approach" Journal of Eye Movement Research 3, no. 4: 1-20. https://doi.org/10.16910/jemr.3.4.5
APA StyleBurmester, M., & Mast, M. (2009). Repeated Web Page Visits and the Scanpath Theory: A Recurrent Pattern Detection Approach. Journal of Eye Movement Research, 3(4), 1-20. https://doi.org/10.16910/jemr.3.4.5