Interpretable Quantification of Scene-Induced Driver Visual Load: Linking Eye-Tracking Behavior to Road Scene Features via SHAP Analysis
Highlights
- In this research, we constructed a driving load classification model based on visual indicators.
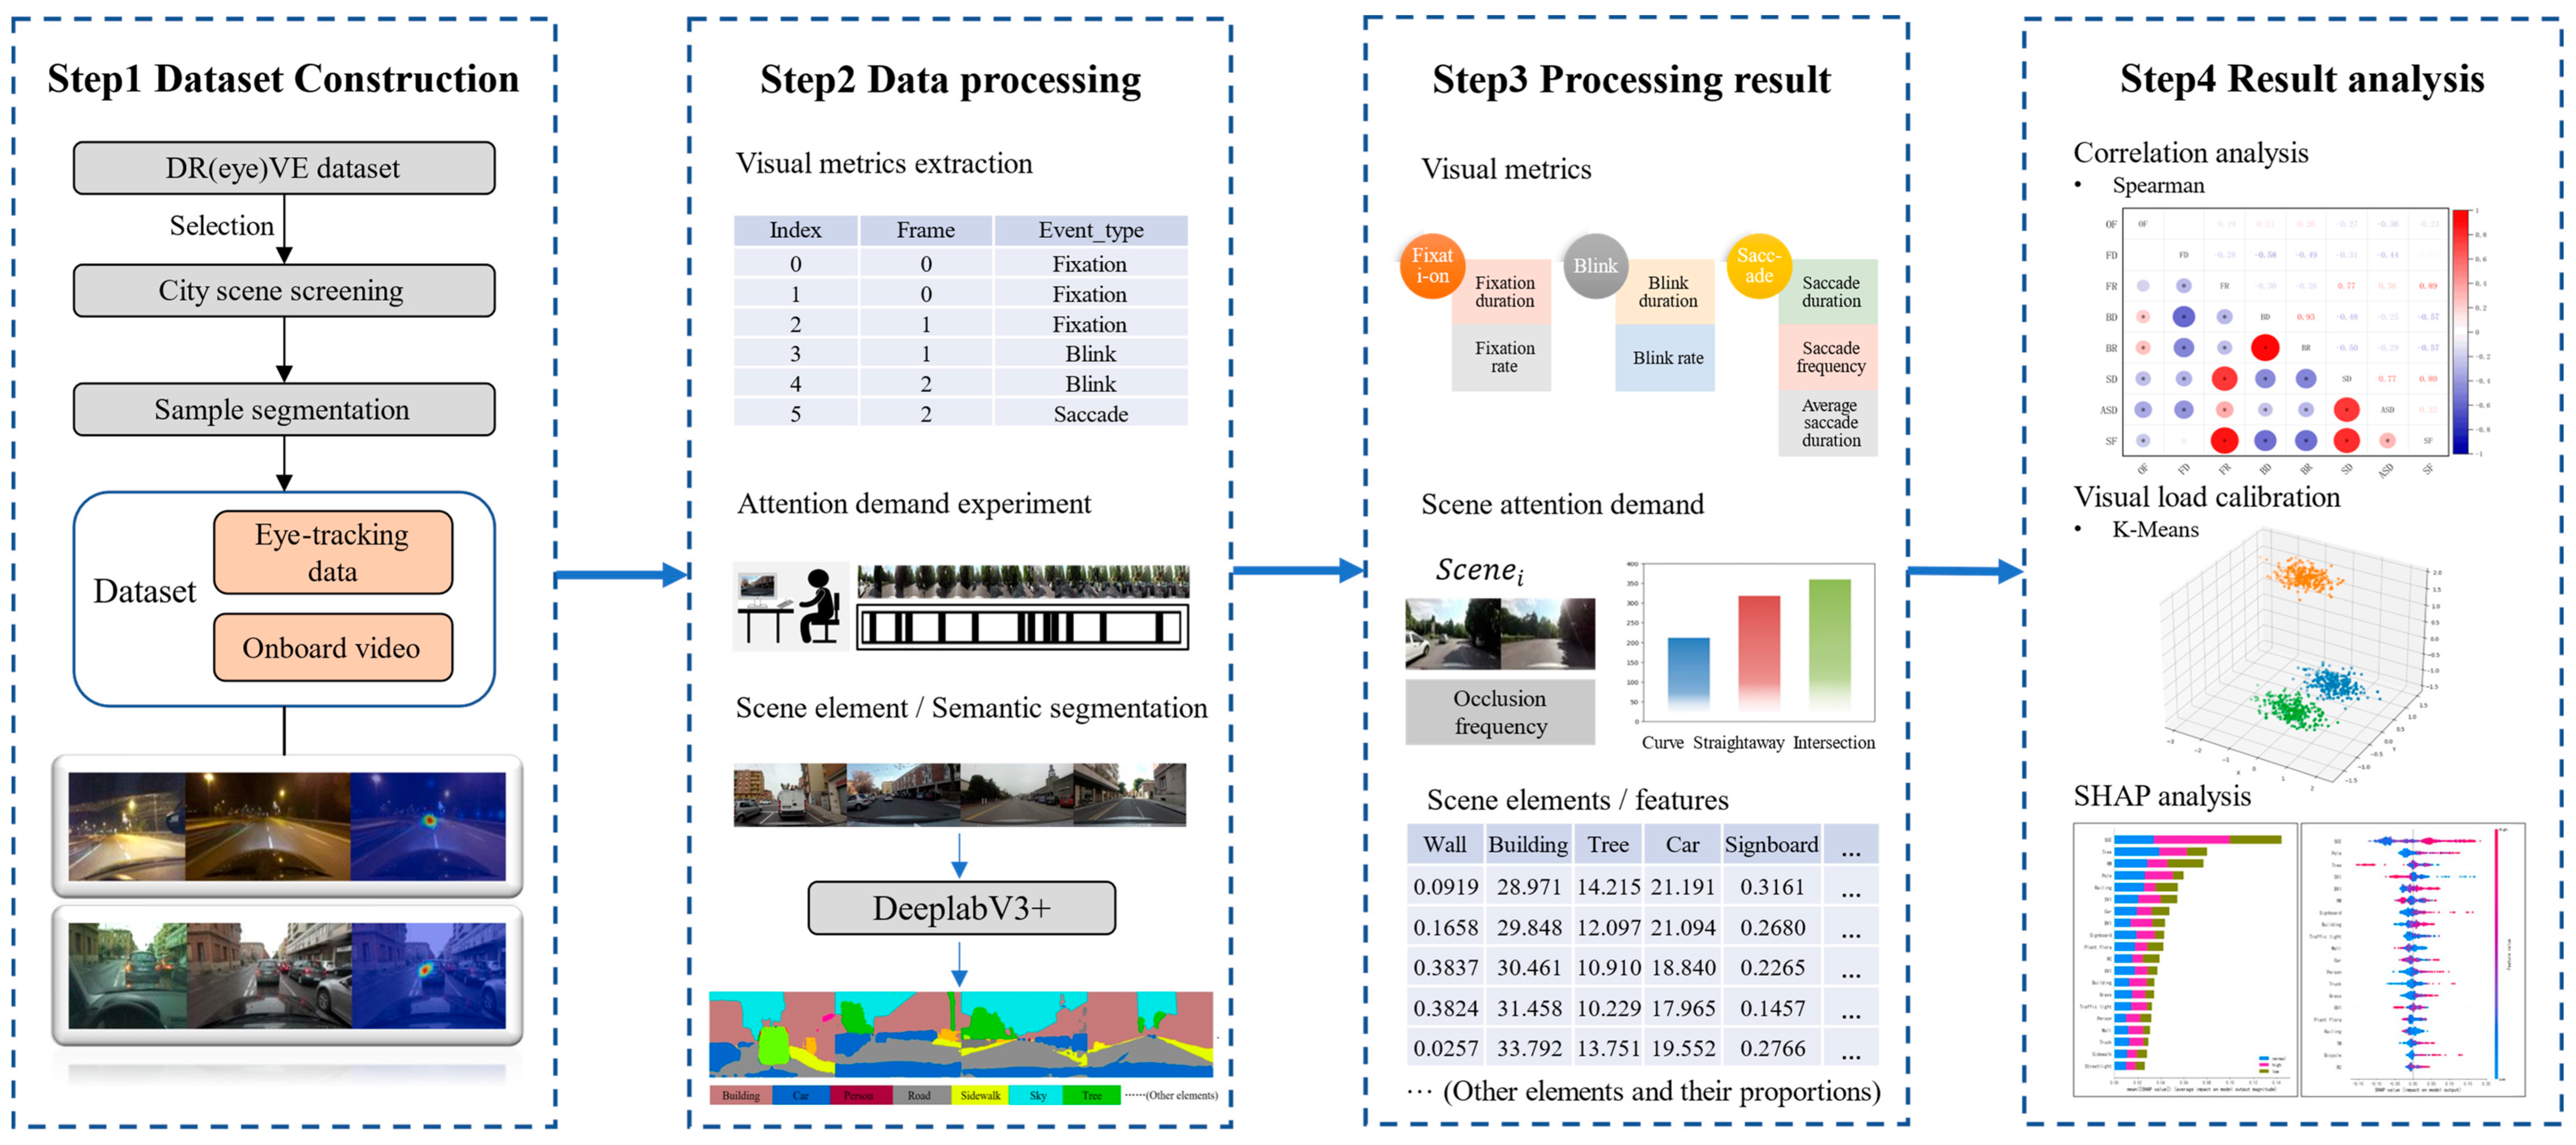
- The machine learning model combined with the SHAP analysis method revealed the influence of urban scene characteristics on driving load and eye movement behavior.
- The research results provide insights for urban design and driver assistance systems, and offer a basis for optimizing the road environment to enhance traffic safety.
Abstract
1. Introduction
2. Literature Review
2.1. Review of the Impact of Urban Landscape and Built Environment on Traffic Safety
2.2. Review of Scenarios and Driving Visual Load
2.3. Review of Driver Attention Studies
3. Methodology
3.1. Methodological Framework
3.2. Data Source
3.3. Attention Demand Experiment
- (1)
- Participant selection: All participants held a valid People’s Republic of China motor vehicle driver’s license and possessed extensive driving experience, ensuring sufficient familiarity with and responsiveness to urban traffic environments.
- (2)
- Visual environment simulation: A laboratory display of appropriate size was carefully selected for the driving video presentation, with the aim of reproducing drivers’ natural visual environment as realistically as possible.
- (3)
- Driving state induction: Prior to the formal experiment, a non-experimental urban driving video was shown to help participants gradually adapt to the simulated driving environment. During the experiment, the laboratory was kept quiet and lighting was dimmed to facilitate immersion in the driving task.
- (4)
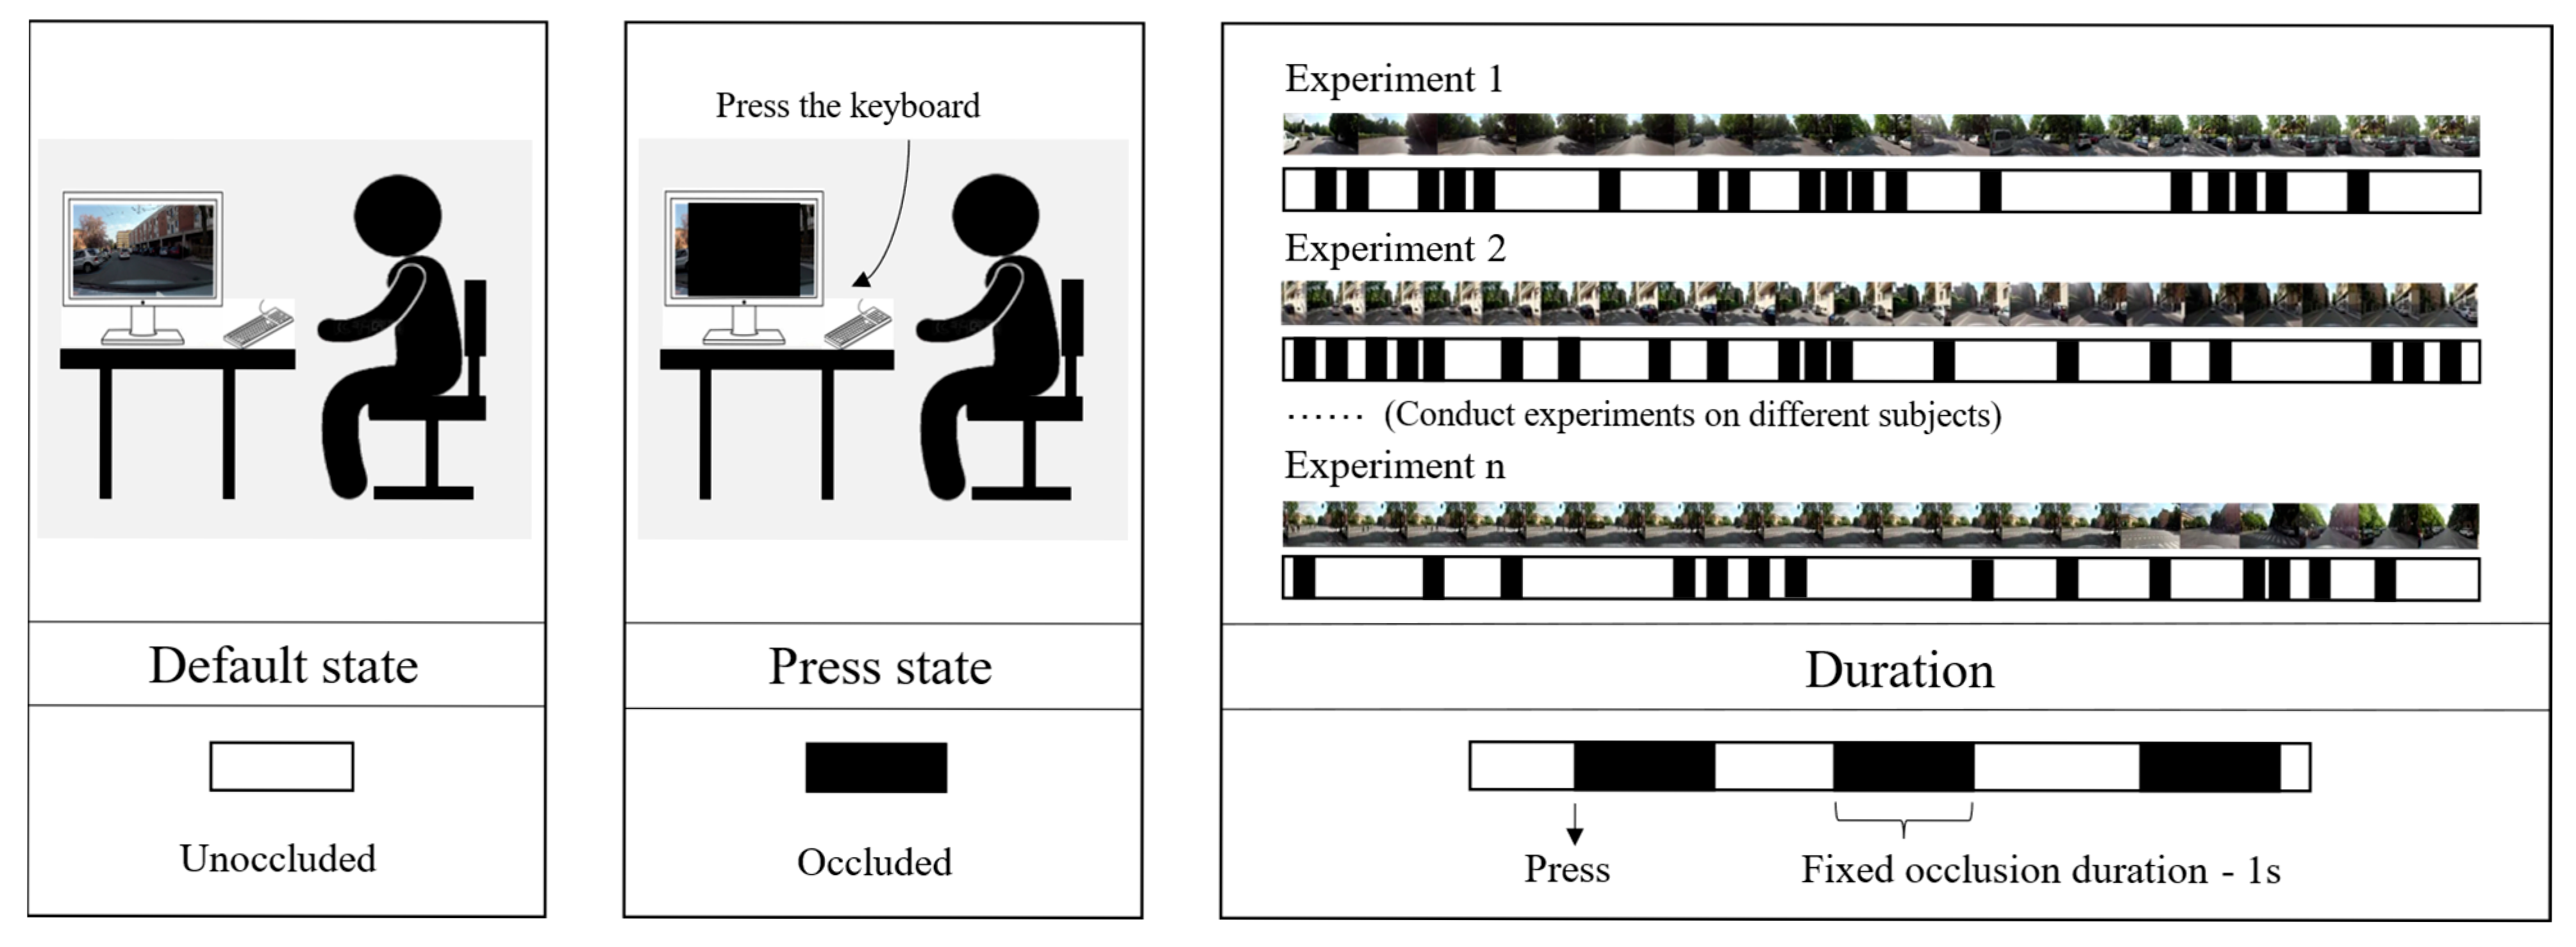
- Task logic aligned with reality: The occlusion task was designed to be actively triggered by participants, thereby simulating the self-initiated gaze shifts that occur in real driving and better reflecting the natural mechanisms of attentional allocation.
- (5)
- Although certain differences between laboratory conditions and real-world driving are unavoidable, the above design measures ensured that, under controlled conditions, the visual task characteristics and decision-making processes of urban driving were reproduced to the greatest extent possible. This provided a solid experimental foundation for the quantification of attentional demands.
3.4. Visual Metrics Extraction
3.5. Scene Features Extraction
3.5.1. Semantic Segmentation Model
3.5.2. Element Characteristics Extraction
3.6. Machine Learning Methods
3.6.1. Clustering Algorithm for Driving Visual Load Calibration
3.6.2. Predictive Modeling for Visual Load and Eye Movement Metrics
3.6.3. SHAP-Based Interpretability Analysis
4. Results
4.1. Attention Demand and Visual Metrics
4.1.1. Correlation Analysis
4.1.2. K-Means Clustering Based on Visual Metrics
4.2. Driving Visual Load and Scene Features
4.2.1. Construction and Evaluation of the Visual Load Detection Model
4.2.2. Effect Analysis of Scene Features on Drivers’ Visual Load
- (1)
- Among static elements, as shown in Figure 6a, when the proportion of poles exceeds 0.08%, the probability of the driver being in a high-load state increase. In urban environments, elements such as traffic sign poles, traffic signal poles, and utility poles are categorized as pole elements. The increase in pole elements signifies a rise in environmental complexity. More poles may indicate additional traffic signs or indicative boards, which draw the driver’s attention and elevate attention demand, thereby increasing visual load. As shown in Figure 6b,j, tree elements have different effects on the driver’s high-load and low-load states. When the proportion of trees exceeds 35%, the probability of the driver being in a high-load state significantly decreases. This may be because trees create a more relaxing environment and simplify the visual field, thus reducing attention demand and alleviating visual load. In contrast, under low-load conditions, the impact of tree elements is more complex. When the proportion of trees is between 11% and 26%, the probability of a low-load state increases. However, when tree coverage exceeds 26%, the probability decreases, showing an initial rise followed by a decline. This suggests that a moderate proportion of trees reduces visual load, while proportions that are too low or too high increase complexity and raise attention demand. As shown in Figure 6c,d, when the proportion of signboard and building elements exceeds 0.55% and 14%, respectively, the probability of a high-load state increases. Signboard elements, which include signs and billboards, tend to distract drivers. Therefore, an excess of signboards in the scene heightens attention demand. Similarly, a high concentration of buildings suggests a more complex driving environment, thereby increasing driver attention demand and consequently raising visual load. As shown in Figure 6i,k, the increase in railing and plant flora elements both decrease the probability of the driver being in a low-load state. Railings are typically located in road repair areas, accident-prone zones, or places where boundaries need to be emphasized. These conditions require constant awareness, thereby increasing attention demand and visual load. When the proportion of plant flora exceeds 1.2%, it may cause additional distractions, thereby somewhat increasing the driving visual load.
- (2)
- Among dynamic elements, car and person have the most significant impact on the driving visual load, which is an evident result. As shown in Figure 6e,l, as the proportion of cars increases, the probability of a high-load state initially decreases. However, when the proportion reaches 24%, the probability of a high-load state rises sharply, with SHAP values turning positive. This indicates that an excessive number of cars in the scene increases the driver’s attention demand, leading to a rise in driving load. This is also confirmed under the low-load condition: when the proportion of cars exceeds 13%, the probability of the driver being in a low-load state drops suddenly, triggering an increase in driving load. As the most unpredictable factor in the traffic system, person has an even more pronounced impact on driver load. When pedestrians appear in the scene, the probability of a high-load state rises, while the probability of a low-load state decreases. This shows that pedestrians add instability to the environment. Drivers must monitor not only the road ahead but also the behavior of roadside pedestrians to prevent accidents. Such demands increase attention and raise driving visual load. As dynamic elements in urban driving environments, car and person significantly influence the driver’s distraction and attention. Ensuring traffic safety thus requires effective management of vehicles and pedestrians within the traffic system.
- (3)
- Among comprehensive scene indicators, as shown in Figure 6g,n, SCE has the most significant impact on both high-load and low-load visual states. When the SCE exceeds 39%, the probability of a high-load state increases, and when it exceeds 36%, the probability of a low-load state decrease. A higher SCE indicates a more spatially enclosed environment, which narrows the driver’s field of view and raises environmental complexity. This adds distracting elements, makes it harder for drivers to perceive their surroundings, and increases attention demand, thereby raising visual load. As shown in Figure 6h, under high-load conditions, when SVI reaches 16%, the probability of the driver being in a high-load state decreases. A higher SVI suggests a wider field of view with fewer elements in the forward vision, reducing complexity and lowering attention demand. This helps relieve the driver’s high-load state. As shown in Figure 6o, when RW reaches 38%, the probability of a low-load state suddenly increases. An increase in RW implies a higher proportion of road elements, which means fewer attention-demanding elements such as vehicles and pedestrians. It also provides a broader field of view, reducing environmental complexity and thus lowering the driver’s load. Additionally, RC is another important factor affecting driver load. As shown in Figure 6p, when RC reaches 40%, the probability of a low-load state decrease. A higher RC reflects more vehicles on the road. An excessive number of dynamic elements increases cognitive load, raises attention demands, and consequently elevates driving visual load.
4.3. Visual Metrics and Scene Features
4.3.1. Model Construction for Analysis
4.3.2. Effect Analysis of Scene Features on Driver’s Eye Movement Behavior
5. Discussion
5.1. Comparison with Existing Studies
5.2. Response to Research Objectives
5.3. Practical Implications
5.4. Limitations and Future Directions
- (1)
- The quantification of scene features primarily relied on pixel-based measures, which did not fully capture geometric attributes such as line structures and shapes, dynamic motion information, or semantic elements such as road markings, thus limiting the richness of feature representation.
- (2)
- Assessment of drivers’ visual workload was primarily based on eye-movement indicators, lacking integration with multimodal physiological data (e.g., EEG, ECG), which constrains the comprehensive reflection of drivers’ cognitive and physiological states.
- (3)
- This study focused on urban driving environments from the DR(eye)VE dataset, covering typical routes in several European cities. The homogeneity in road types, traffic culture, and climatic conditions limits the generalizability of the model to rural, highway, or other regional contexts, and the model’s applicability in non-urban environments (e.g., highways, rural roads, or extreme weather conditions) remains unverified.
6. Conclusions
Author Contributions
Funding
Institutional Review Board Statement
Informed Consent Statement
Data Availability Statement
Conflicts of Interest
References
- Liu, L.; Gao, Z.; Luo, P.; Duan, W.; Hu, M.; Mohd Arif Zainol, M.R.R.; Zawawi, M.H. The influence of visual landscapes on road traffic safety: An assessment using remote sensing and deep learning. Remote Sens. 2023, 15, 4437. [Google Scholar] [CrossRef]
- Iamtrakul, P.; Chayphong, S.; Mateo-Babiano, D. The Transition of Land Use and Road Safety Studies: A Systematic Literature Review (2000–2021). Sustainability 2023, 15, 8894. [Google Scholar] [CrossRef]
- Kaygisiz, Ö.; Senbil, M.; Yildiz, A. Influence of urban built environment on traffic accidents: The case of Eskisehir (Turkey). Case Stud. Transp. Policy 2017, 5, 306–313. [Google Scholar] [CrossRef]
- Asadi, M.; Ulak, M.B.; Geurs, K.T.; Weijermars, W.; Schepers, P. A comprehensive analysis of the relationships between the built environment and traffic safety in the Dutch urban areas. Accid. Anal. Prev. 2022, 172, 106683. [Google Scholar] [CrossRef]
- Sun, H.; Xu, H.; He, H.; Wei, Q.; Yan, Y.; Chen, Z.; Li, X.; Zheng, J.; Li, T. A Spatial Analysis of Urban Streets under Deep Learning Based on Street View Imagery: Quantifying Perceptual and Elemental Perceptual Relationships. Sustainability 2023, 15, 14798. [Google Scholar] [CrossRef]
- Cai, Q.; Abdel-Aty, M.; Zheng, O.; Wu, Y. Applying machine learning and google street view to explore effects of drivers’ visual environment on traffic safety. Transp. Res. Part C Emerg. Technol. 2022, 135, 103541. [Google Scholar] [CrossRef]
- Yu, X.; Ma, J.; Tang, Y.; Yang, T.; Jiang, F. Can we trust our eyes? Interpreting the misperception of road safety from street view images and deep learning. Accid. Anal. Prev. 2024, 197, 107455. [Google Scholar] [CrossRef] [PubMed]
- Rita, L.; Peliteiro, M.; Bostan, T.C.; Tamagusko, T.; Ferreira, A. Using deep learning and Google Street View imagery to assess and improve cyclist safety in London. Sustainability 2023, 15, 10270. [Google Scholar] [CrossRef]
- Von Stülpnagel, R.; Binnig, N. How safe do you feel?–A large-scale survey concerning the subjective safety associated with different kinds of cycling lanes. Accid. Anal. Prev. 2022, 167, 106577. [Google Scholar] [CrossRef] [PubMed]
- Hu, Z.; Zhou, J.; Zhang, E. Improving traffic safety through traffic accident risk assessment. Sustainability 2023, 15, 3748. [Google Scholar] [CrossRef]
- Parsa, A.B.; Movahedi, A.; Taghipour, H.; Derrible, S.; Mohammadian, A.K. Toward safer highways, application of XGBoost and SHAP for real-time accident detection and feature analysis. Accid. Anal. Prev. 2020, 136, 105405. [Google Scholar] [CrossRef] [PubMed]
- Intini, P.; Berloco, N.; Fonzone, A.; Fountas, G.; Ranieri, V. The influence of traffic, geometric and context variables on urban crash types: A grouped random parameter multinomial logit approach. Anal. Methods Accid. Res. 2020, 28, 100141. [Google Scholar] [CrossRef]
- Liu, Z.; Zhao, X.; Wu, F. Influencing Factors of Driving Attention Demand in Urban Road Scenario. J. Transp. Syst. Eng. Inf. Technol. 2021, 21, 132. [Google Scholar]
- Gershon, P.; Sita, K.R.; Zhu, C.; Ehsani, J.P.; Klauer, S.G.; Dingus, T.A.; Simons-Morton, B.G. Distracted driving, visual inattention, and crash risk among teenage drivers. Am. J. Prev. Med. 2019, 56, 494–500. [Google Scholar] [CrossRef] [PubMed]
- Useche, S.A.; Gómez Ortiz, V.; Cendales, B.E. Stress-related psychosocial factors at work, fatigue, and risky driving behavior in bus rapid transport (BRT) drivers. Accid. Anal. Prev. 2017, 104, 106–114. [Google Scholar] [CrossRef]
- Zokaei, M.; Jafari, M.J.; Khosrowabadi, R.; Nahvi, A.; Khodakarim, S.; Pouyakian, M. Tracing the physiological response and behavioral performance of drivers at different levels of mental workload using driving simulators. J. Saf. Res. 2020, 72, 213–223. [Google Scholar] [CrossRef]
- Paschalidis, E.; Choudhury, C.F.; Hess, S. Combining driving simulator and physiological sensor data in a latent variable model to incorporate the effect of stress in car-following behaviour. Anal. Methods Accid. Res. 2019, 22, 100089. [Google Scholar] [CrossRef]
- Ni, J.; Chen, J.; Xie, W.; Shao, Y. The impacts of the traffic situation, road conditions, and driving environment on driver stress: A systematic review. Transp. Res. Part F Traffic Psychol. Behav. 2024, 103, 141–162. [Google Scholar] [CrossRef]
- Mou, L.; Zhou, C.; Zhao, P.; Nakisa, B.; Rastgoo, M.N.; Jain, R.; Gao, W. Driver stress detection via multimodal fusion using attention-based CNN-LSTM. Expert Syst. Appl. 2021, 173, 114693. [Google Scholar] [CrossRef]
- Siam, A.I.; Gamel, S.A.; Talaat, F.M. Automatic stress detection in car drivers based on non-invasive physiological signals using machine learning techniques. Neural Comput. Appl. 2023, 35, 12891–12904. [Google Scholar] [CrossRef]
- Hu, S.; Gao, Q.; Xie, K.; Wen, C.; Zhang, W.; He, J. Efficient detection of driver fatigue state based on all-weather illumination scenarios. Sci. Rep. 2024, 14, 17075. [Google Scholar] [CrossRef]
- González, C.; Ayobi, N.; Escallón, F.; Baldovino-Chiquillo, L.; Wilches-Mogollón, M.; Pasos, D.; Ramírez, N.; Pinzón, J.; Sarmiento, O.; Quistberg, D.A.; et al. STRIDE: Street View-based Environmental Feature Detection and Pedestrian Collision Prediction. In Proceedings of the 2023 IEEE/CVF International Conference on Computer Vision Workshops (ICCVW), Paris, France, 2–6 October 2023; IEEE: New York, NY, USA, 2023; pp. 3222–3234. [Google Scholar]
- Bustos, C.; Rhoads, D.; Solé-Ribalta, A.; Masip, D.; Arenas, A.; Lapedriza, A.; Borge-Holthoefer, J. Explainable, automated urban interventions to improve pedestrian and vehicle safety. Transp. Res. Part C Emerg. Technol. 2021, 125, 103018. [Google Scholar] [CrossRef]
- Tanprasert, T.; Siripanpornchana, C.; Surasvadi, N.; Thajchayapong, S. Recognizing traffic black spots from street view images using environment-aware image processing and neural network. IEEE Access 2020, 8, 121469–121478. [Google Scholar] [CrossRef]
- Qin, K.; Xu, Y.; Kang, C.; Kwan, M.P. A graph convolutional network model for evaluating potential congestion spots based on local urban built environments. Trans. GIS 2020, 24, 1382–1401. [Google Scholar] [CrossRef]
- Foy, H.J.; Chapman, P. Mental workload is reflected in driver behaviour, physiology, eye movements and prefrontal cortex activation. Appl. Ergon. 2018, 73, 90–99. [Google Scholar] [CrossRef]
- Liu, B.; Sun, L.; Jian, R. Driver’s visual cognition behaviors of traffic signs based on eye movement parameters. J. Transp. Syst. Eng. Inf. Technol. 2011, 11, 22–27. [Google Scholar] [CrossRef]
- He, S.; Liang, B.; Pan, G.; Wang, F.; Cui, L. Influence of dynamic highway tunnel lighting environment on driving safety based on eye movement parameters of the driver. Tunn. Undergr. Space Technol. 2017, 67, 52–60. [Google Scholar] [CrossRef]
- Ahlström, C.; Anund, A.; Fors, C.; Åkerstedt, T. Effects of the road environment on the development of driver sleepiness in young male drivers. Accid. Anal. Prev. 2018, 112, 127–134. [Google Scholar] [CrossRef] [PubMed]
- Fiolić, M.; Babić, D.; Babić, D.; Tomasović, S. Effect of road markings and road signs quality on driving behaviour, driver’s gaze patterns and driver’s cognitive load at night-time. Transp. Res. Part F Traffic Psychol. Behav. 2023, 99, 306–318. [Google Scholar] [CrossRef]
- Cvahte Ojsteršek, T.; Topolšek, D. Influence of drivers’ visual and cognitive attention on their perception of changes in the traffic environment. Eur. Transp. Res. Rev. 2019, 11, 45. [Google Scholar] [CrossRef]
- Kircher, K.; Kujala, T.; Ahlström, C. On the difference between necessary and unnecessary glances away from the forward roadway: An occlusion study on the motorway. Hum. Factors 2020, 62, 1117–1131. [Google Scholar] [CrossRef] [PubMed]
- Zeng, Q.; Chen, Y.; Zheng, X.; Zhang, M.; Li, D.; Hu, Q. Exploring the visual attention mechanism of long-distance driving in an underground construction cavern: Eye-tracking and simulated driving. Sustainability 2023, 15, 9140. [Google Scholar] [CrossRef]
- Aminosharieh Najafi, T.; Affanni, A.; Rinaldo, R.; Zontone, P. Driver attention assessment using physiological measures from EEG, ECG, and EDA signals. Sensors 2023, 23, 2039. [Google Scholar] [CrossRef]
- Liu, R.; Qi, S.; Hao, S.; Lian, G.; Luo, Y. Using electroencephalography to analyse drivers’ different cognitive workload characteristics based on on-road experiment. Front. Psychol. 2023, 14, 1107176. [Google Scholar] [CrossRef]
- Palazzi, A.; Abati, D.; Calderara, S.; Solera, F.; Cucchiara, R. Predicting the driver’s focus of attention: The DR(eye)VE project. IEEE Trans. Pattern Anal. Mach. Intell. 2019, 40, 2891–2904. [Google Scholar] [CrossRef]
- Kujala, T.; Mäkelä, J.; Kotilainen, I.; Tokkonen, T. The attentional demand of automobile driving revisited: Occlusion distance as a function of task-relevant event density in realistic driving scenarios. Hum. Factors 2016, 58, 163–180. [Google Scholar] [CrossRef]
- Saffarian, M.; de Winter, J.C.F.; Senders, J.W. Measuring drivers’ visual information needs during braking: A simulator study using a screen-occlusion method. Transp. Res. Part F Traffic Psychol. Behav. 2015, 33, 48–65. [Google Scholar] [CrossRef]
- Kircher, K.; Ahlstrom, C. Evaluation of methods for the assessment of attention while driving. Accid. Anal. Prev. 2018, 114, 40–47. [Google Scholar] [CrossRef]
- Liu, Z.; Ahlström, C.; Forsman, Å.; Kircher, K. Attentional demand as a function of contextual factors in different traffic scenarios. Hum. Factors 2020, 62, 1171–1189. [Google Scholar] [CrossRef] [PubMed]
- Liu, Z.; Yuan, W.; Ma, Y. Drivers’ attention strategies before eyes-off-road in different traffic scenarios: Adaptation and anticipation. Int. J. Environ. Res. Public Health 2021, 18, 3716. [Google Scholar] [CrossRef] [PubMed]
- Recarte, M.A.; Nunes, L.M. Mental workload while driving: Effects on visual search, discrimination, and decision making. J. Exp. Psychol. Appl. 2003, 9, 119–137. [Google Scholar] [CrossRef]
- Victor, T.W.; Harbluk, J.L.; Engström, J.A. Sensitivity of eye-movement measures to in-vehicle task difficulty. Transp. Res. Part F Traffic Psychol. Behav. 2005, 8, 167–190. [Google Scholar] [CrossRef]
- Di Stasi, L.L.; Antolí, A.; Cañas, J.J. Main sequence: An index for detecting mental workload variation in complex tasks. Appl. Ergon. 2011, 42, 807–813. [Google Scholar] [CrossRef]
- Underwood, G.; Chapman, P.; Bowden, K.; Crundall, D. Visual search while driving: Skill and awareness during inspection of the scene. Transp. Res. Part F Traffic Psychol. Behav. 2002, 5, 87–97. [Google Scholar] [CrossRef]
- Schleicher, R.; Galley, N.; Briest, S.; Galley, L. Blinks and saccades as indicators of fatigue in sleepiness warnings: Looking tired? Ergonomics 2008, 51, 982–1010. [Google Scholar] [CrossRef] [PubMed]
- Stern, J.A.; Boyer, D.; Schroeder, D. Blink rate: A possible measure of fatigue. Hum. Factors 1994, 36, 285–297. [Google Scholar] [CrossRef]
- Wickens, C.D.; Helton, W.S.; Hollands, J.G.; Banbury, S. Engineering Psychology and Human Performance; Routledge: London, UK, 2021. [Google Scholar]
- Wood, J.M. Vision impairment and on-road driving. Annu. Rev. Vis. Sci. 2022, 8, 195–216. [Google Scholar] [CrossRef]
- MMSegmentation Contributors. MMSegmentation: OpenMMLab Semantic Segmentation Toolbox and Benchmark. GitHub. 2020. Available online: https://github.com/open-mmlab/mmsegmentation (accessed on 24 April 2024).
- Breiman, L. Random forests. Mach. Learn. 2001, 45, 5–32. [Google Scholar] [CrossRef]
- Freund, Y.; Schapire, R.E. A decision-theoretic generalization of on-line learning and an application to boosting. J. Comput. Syst. Sci. 1997, 55, 119–139. [Google Scholar] [CrossRef]
- Chen, T.; Guestrin, C. Xgboost: A scalable tree boosting system. In Proceedings of the 22nd ACM SIGKDD International Conference on Knowledge Discovery and Data Mining, San Francisco, CA, USA, 13–17 August 2016; pp. 785–794. [Google Scholar]
- Lundberg, S.M.; Lee, S.-I. A unified approach to interpreting model predictions. Adv. Neural Inf. Process. Syst 2017, 30, 4765–4774. [Google Scholar]
- Liang, Y.; Lee, J.D. Combining cognitive and visual distraction: Less than the sum of its parts. Accid. Anal. Prev. 2010, 42, 881–890. [Google Scholar] [CrossRef]
- Recarte, M.A.; Nunes, L.M. Effects of verbal and spatial-imagery tasks on eye fixations while driving. J. Exp. Psychol. Appl. 2000, 6, 31–43. [Google Scholar] [CrossRef]
- Cardona, G.; Quevedo, N. Blinking and driving: The influence of saccades and cognitive workload. Curr. Eye Res. 2014, 39, 239–244. [Google Scholar] [CrossRef]
- Wickens, C. Processing resources and attention. In Varieties of Attention; Parasuraman, R., Davis, D., Eds.; Academic Press: Cambridge, MA, USA, 1984. [Google Scholar]
- Huang, J.; Zhang, Q.; Zhang, T.; Wang, T.; Tao, D. Assessment of drivers’ mental workload by multimodal measures during auditory-based dual-task driving scenarios. Sensors 2024, 24, 1041. [Google Scholar] [CrossRef]
- White, H.; Shah, P. Attention in urban and natural environments. Yale J. Biol. Med. 2019, 92, 115. [Google Scholar]
- Edquist, J.; Rudin-Brown, C.M.; Lenné, M.G. The effects of on-street parking and road environment visual complexity on travel speed and reaction time. Accid. Anal. Prev. 2012, 45, 759–765. [Google Scholar] [CrossRef]
- Lee, S.C.; Kim, Y.W.; Ji, Y.G. Effects of visual complexity of in-vehicle information display: Age-related differences in visual search task in the driving context. Appl. Ergon. 2019, 81, 102888. [Google Scholar] [CrossRef] [PubMed]
- Qin, Z. Eye Movement Analysis on Driving Behavior for Urban Road Environment. In Proceedings of the International Conference on Mechatronics and Intelligent Robotics, Kunming, China, 20–21 May 2017; Springer International Publishing: Cham, Switzerland, 2017; pp. 486–491. [Google Scholar]
- Liang, Y.; Reyes, M.L.; Lee, J.D. Real-time detection of driver cognitive distraction using support vector machines. IEEE Trans. Intell. Transp. Syst. 2007, 8, 340–350. [Google Scholar] [CrossRef]
- Stapel, J.; El Hassnaoui, M.; Happee, R. Measuring driver perception: Combining eye-tracking and auto-mated road scene perception. Hum. Factors 2022, 64, 714–731. [Google Scholar] [CrossRef]


| Index | Implication |
|---|---|
| Green Visibility Index (GVI) | The ratio of the number of vegetation pixels to the total number of pixels in the image |
| Sky Visibility Index (SVI) | The ratio of the number of sky pixels to the total number of pixels in the image |
| Road Width (RW) | The ratio of the number of road pixels to the total number of pixels in the image |
| Street Canyon Enclosure (SCE) | The ratio of the number of pixels of buildings, vegetation, traffic signs, fences, walls, and poles to the total number of pixels in the image |
| Building View Index (BVI) | The ratio of the number of building pixels to the total number of pixels in the image |
| Road Congestion (RC) | The ratio of the number of vehicle pixels to the number of road pixels |
| Traffic Mix (TM) | The ratio of the number of non-motor vehicle and pedestrian pixels to the number of motor vehicle pixels |
| Visual Index | Fixation Duration (s) | Fixation Rate (Times/s) | Blink Duration (s) | Blink Rate (Times/s) | Saccade Duration (s) | Average Saccade Duration (ms) | Saccade Frequency (Times/s) |
|---|---|---|---|---|---|---|---|
| Correlation coefficient (p-value) | −0.019 (0.849) | −0.186 (0.064) | 0.239 (0.017 *) | 0.262 (0.008 **) | −0.272 (0.006 **) | −0.357 (0.000 **) | −0.234 (0.019 *) |
| Centroid of Each Group | Blink Duration (↓) | Blink Rate (↓) | Saccade Duration (↑) | Average Saccade Duration (↑) | Saccade Frequency (↑) | Tentative Load Status |
|---|---|---|---|---|---|---|
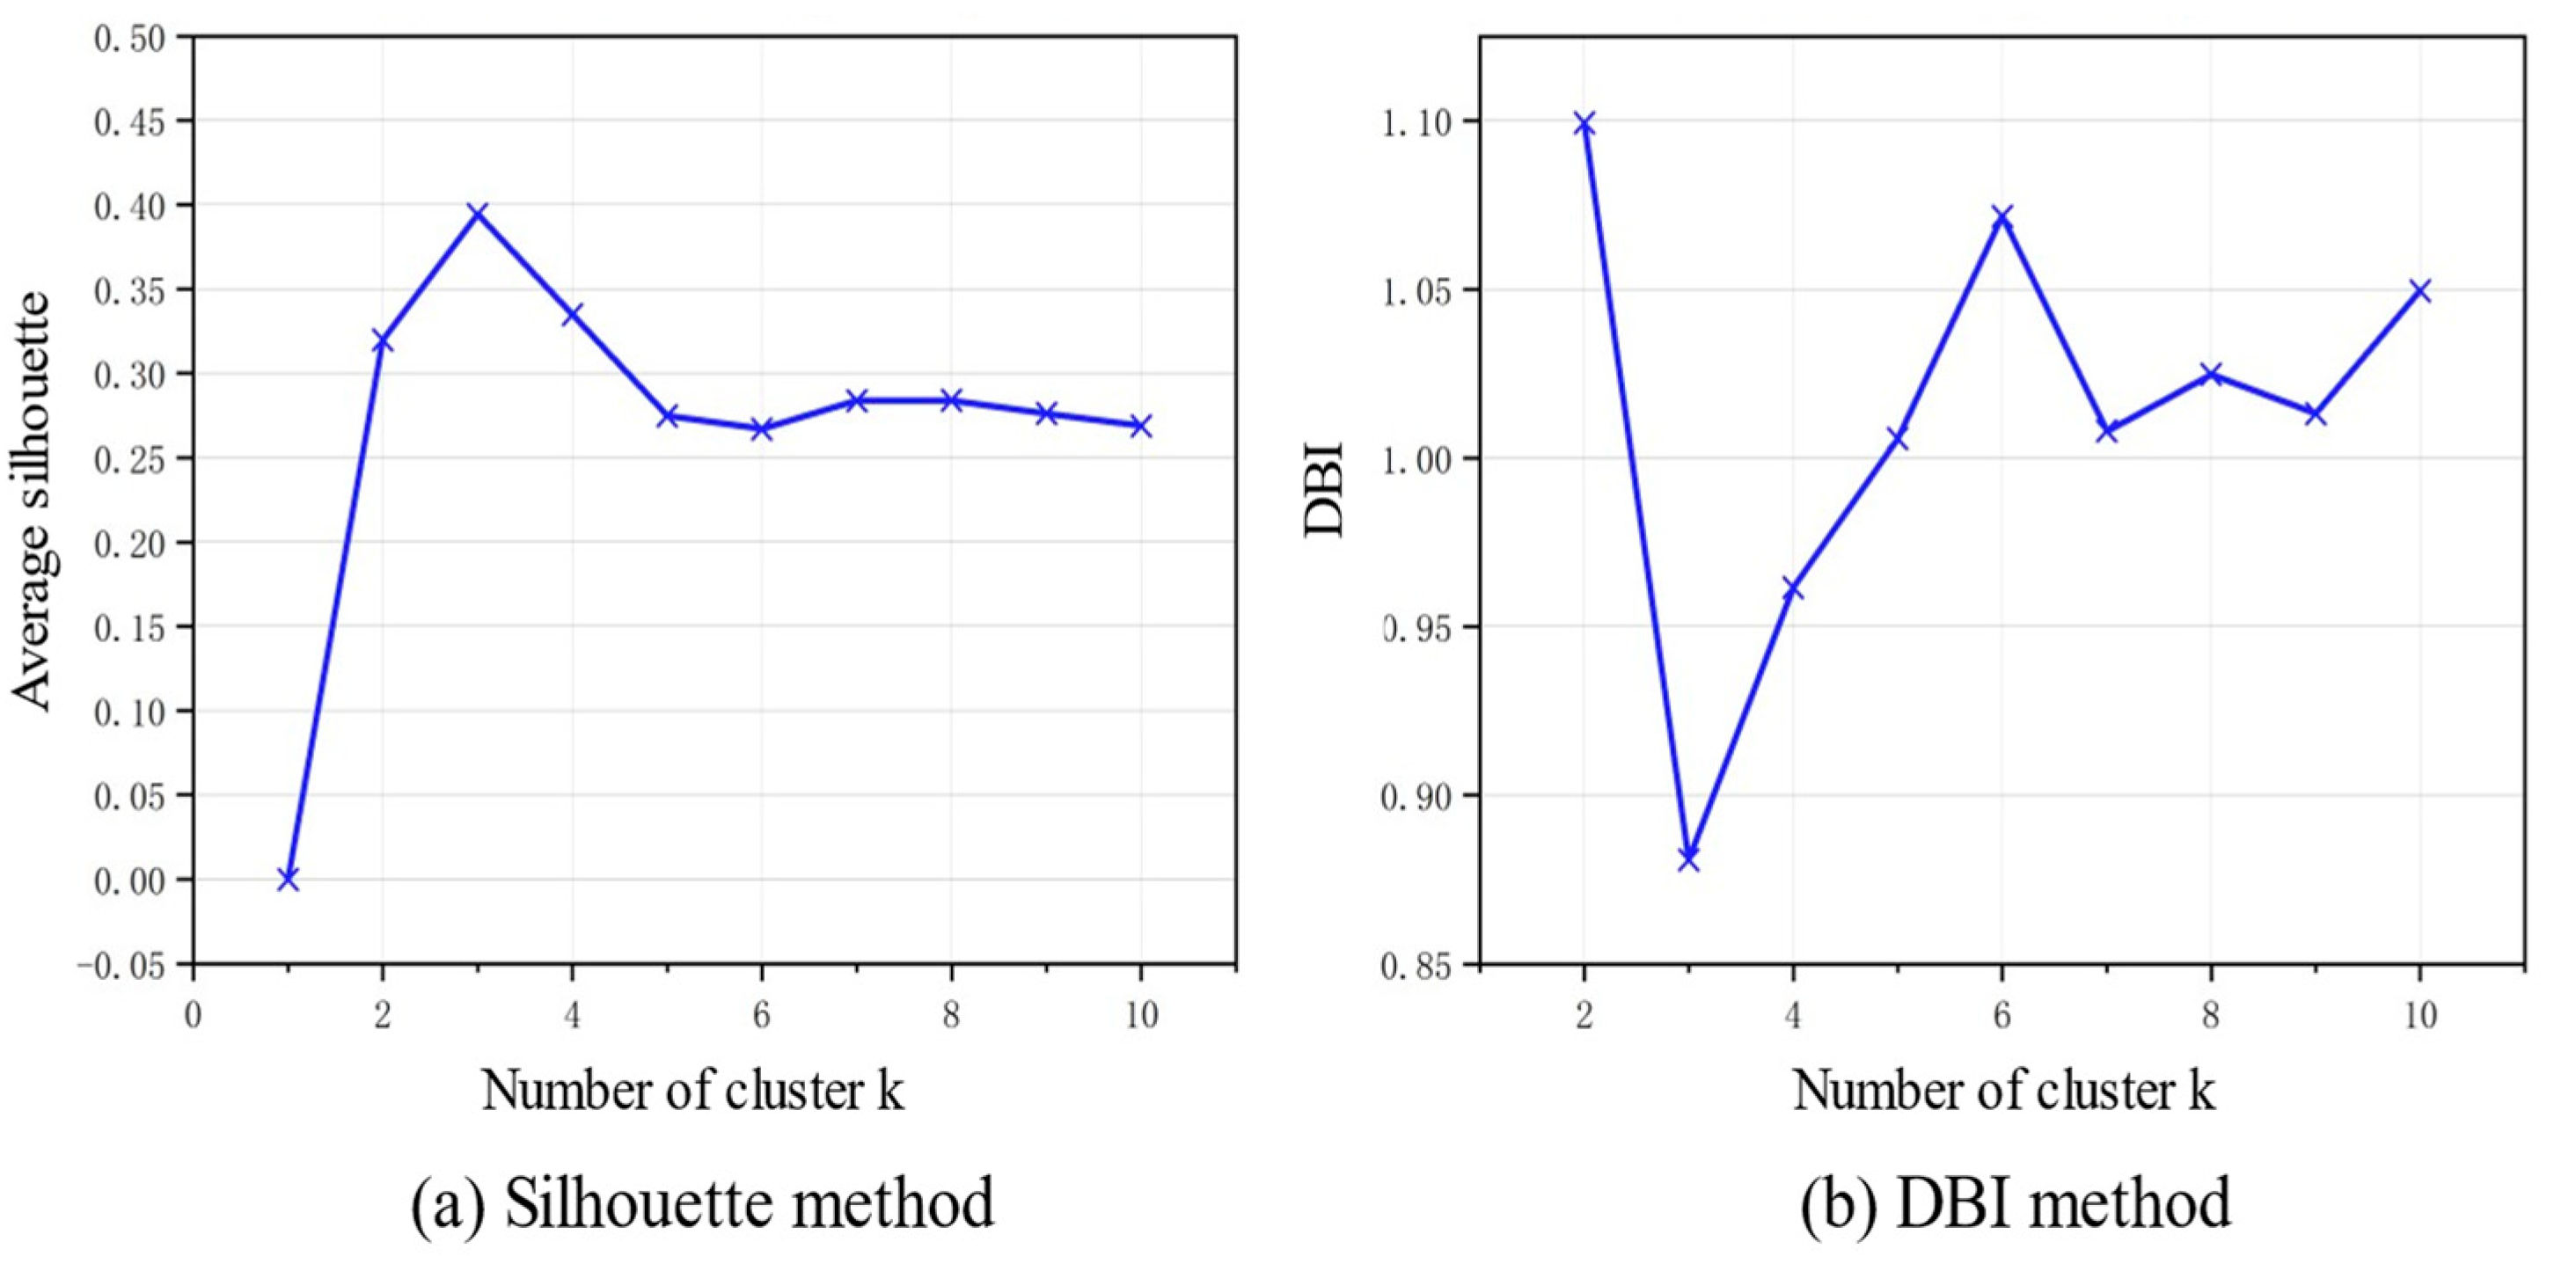
| Group 1 | 1.4853 | 1.5881 | −0.9653 | −0.1188 | −1.2978 | Low-load |
| Group 2 | −0.3322 | −0.3350 | −0.3318 | −0.4998 | 0.0354 | Medium-load |
| Group 3 | −0.3406 | −0.3998 | 1.1687 | 0.9378 | 0.7384 | High-load |
| Group | Load Condition | Sample Size | Proportion |
|---|---|---|---|
| Group 1 | Low-load | 148 | 18.50% |
| Group 2 | Medium-load | 438 | 54.75% |
| Group 3 | High-load | 214 | 26.75% |
| Index | Original Dataset | Balanced Dataset | |||||||
|---|---|---|---|---|---|---|---|---|---|
| RF | XGB | Ada | SVM | RF | XGB | Ada | SVM | ||
| Precision | Low-load | 86.41 | 79.82 | 78.50 | 81.25 | 93.60 | 95.69 | 94.04 | 93.77 |
| Medium-load | 91.98 | 88.62 | 90.00 | 84.48 | 92.13 | 94.69 | 92.96 | 91.64 | |
| High-load | 86.40 | 87.09 | 83.65 | 87.57 | 87.15 | 88.86 | 82.46 | 88.44 | |
| Macro average | 88.26 | 85.18 | 84.05 | 84.43 | 90.96 | 93.08 | 89.82 | 91.28 | |
| Weighted average | 87.99 | 86.27 | 84.57 | 85.61 | 90.93 | 93.06 | 89.90 | 91.25 | |
| Recall | Low-load | 80.91 | 79.09 | 76.36 | 82.73 | 93.03 | 94.24 | 90.91 | 95.76 |
| Medium-load | 81.87 | 81.32 | 79.12 | 80.77 | 90.11 | 93.13 | 87.09 | 90.38 | |
| High-load | 93.10 | 91.09 | 89.66 | 89.08 | 89.66 | 91.67 | 90.52 | 87.93 | |
| Macro average | 85.29 | 83.83 | 81.71 | 84.19 | 90.93 | 93.01 | 89.50 | 91.36 | |
| Weighted average | 87.81 | 86.25 | 84.38 | 85.63 | 90.88 | 92.99 | 89.44 | 91.27 | |
| F1-Score | Low-load | 83.57 | 79.45 | 77.42 | 81.98 | 93.31 | 94.96 | 92.45 | 88.44 |
| Medium-load | 86.63 | 84.81 | 84.21 | 82.58 | 91.11 | 93.91 | 89.93 | 91.01 | |
| High-load | 89.63 | 89.04 | 86.55 | 88.32 | 88.39 | 90.24 | 86.30 | 88.18 | |
| Macro average | 86.61 | 84.44 | 82.73 | 84.30 | 90.94 | 93.04 | 89.56 | 91.32 | |
| Weighted average | 87.73 | 86.19 | 84.31 | 85.60 | 90.90 | 93.02 | 89.52 | 91.25 | |
Disclaimer/Publisher’s Note: The statements, opinions and data contained in all publications are solely those of the individual author(s) and contributor(s) and not of MDPI and/or the editor(s). MDPI and/or the editor(s) disclaim responsibility for any injury to people or property resulting from any ideas, methods, instructions or products referred to in the content. |
© 2025 by the authors. Licensee MDPI, Basel, Switzerland. This article is an open access article distributed under the terms and conditions of the Creative Commons Attribution (CC BY) license (https://creativecommons.org/licenses/by/4.0/).
Share and Cite
Ni, J.; Shao, Y.; Guo, Y.; Gu, Y. Interpretable Quantification of Scene-Induced Driver Visual Load: Linking Eye-Tracking Behavior to Road Scene Features via SHAP Analysis. J. Eye Mov. Res. 2025, 18, 40. https://doi.org/10.3390/jemr18050040
Ni J, Shao Y, Guo Y, Gu Y. Interpretable Quantification of Scene-Induced Driver Visual Load: Linking Eye-Tracking Behavior to Road Scene Features via SHAP Analysis. Journal of Eye Movement Research. 2025; 18(5):40. https://doi.org/10.3390/jemr18050040
Chicago/Turabian StyleNi, Jie, Yifu Shao, Yiwen Guo, and Yongqi Gu. 2025. "Interpretable Quantification of Scene-Induced Driver Visual Load: Linking Eye-Tracking Behavior to Road Scene Features via SHAP Analysis" Journal of Eye Movement Research 18, no. 5: 40. https://doi.org/10.3390/jemr18050040
APA StyleNi, J., Shao, Y., Guo, Y., & Gu, Y. (2025). Interpretable Quantification of Scene-Induced Driver Visual Load: Linking Eye-Tracking Behavior to Road Scene Features via SHAP Analysis. Journal of Eye Movement Research, 18(5), 40. https://doi.org/10.3390/jemr18050040


