2.1. Manual Correction
This study utilizes manual correction data from Al Madi et al. [
30], and we review the relevant details about the data in this section. Refer to the original study for a more comprehensive presentation of the experiment and its details.
The data from Al Madi et al. [
30] comes from 14 participants who were adult college students. Five are female and nine are male, and they participated voluntarily and were awarded a
$20 gift card after completing the experiment. Participants were given real and synthetic eye tracking trials to correct. Eighteen synthetic trials included varying degrees of noise, slope, shift, and offset distortions, along with trials containing within-line and between-line regressions. For consistency, we use the same names and implementation presented by [
13] in this paper.
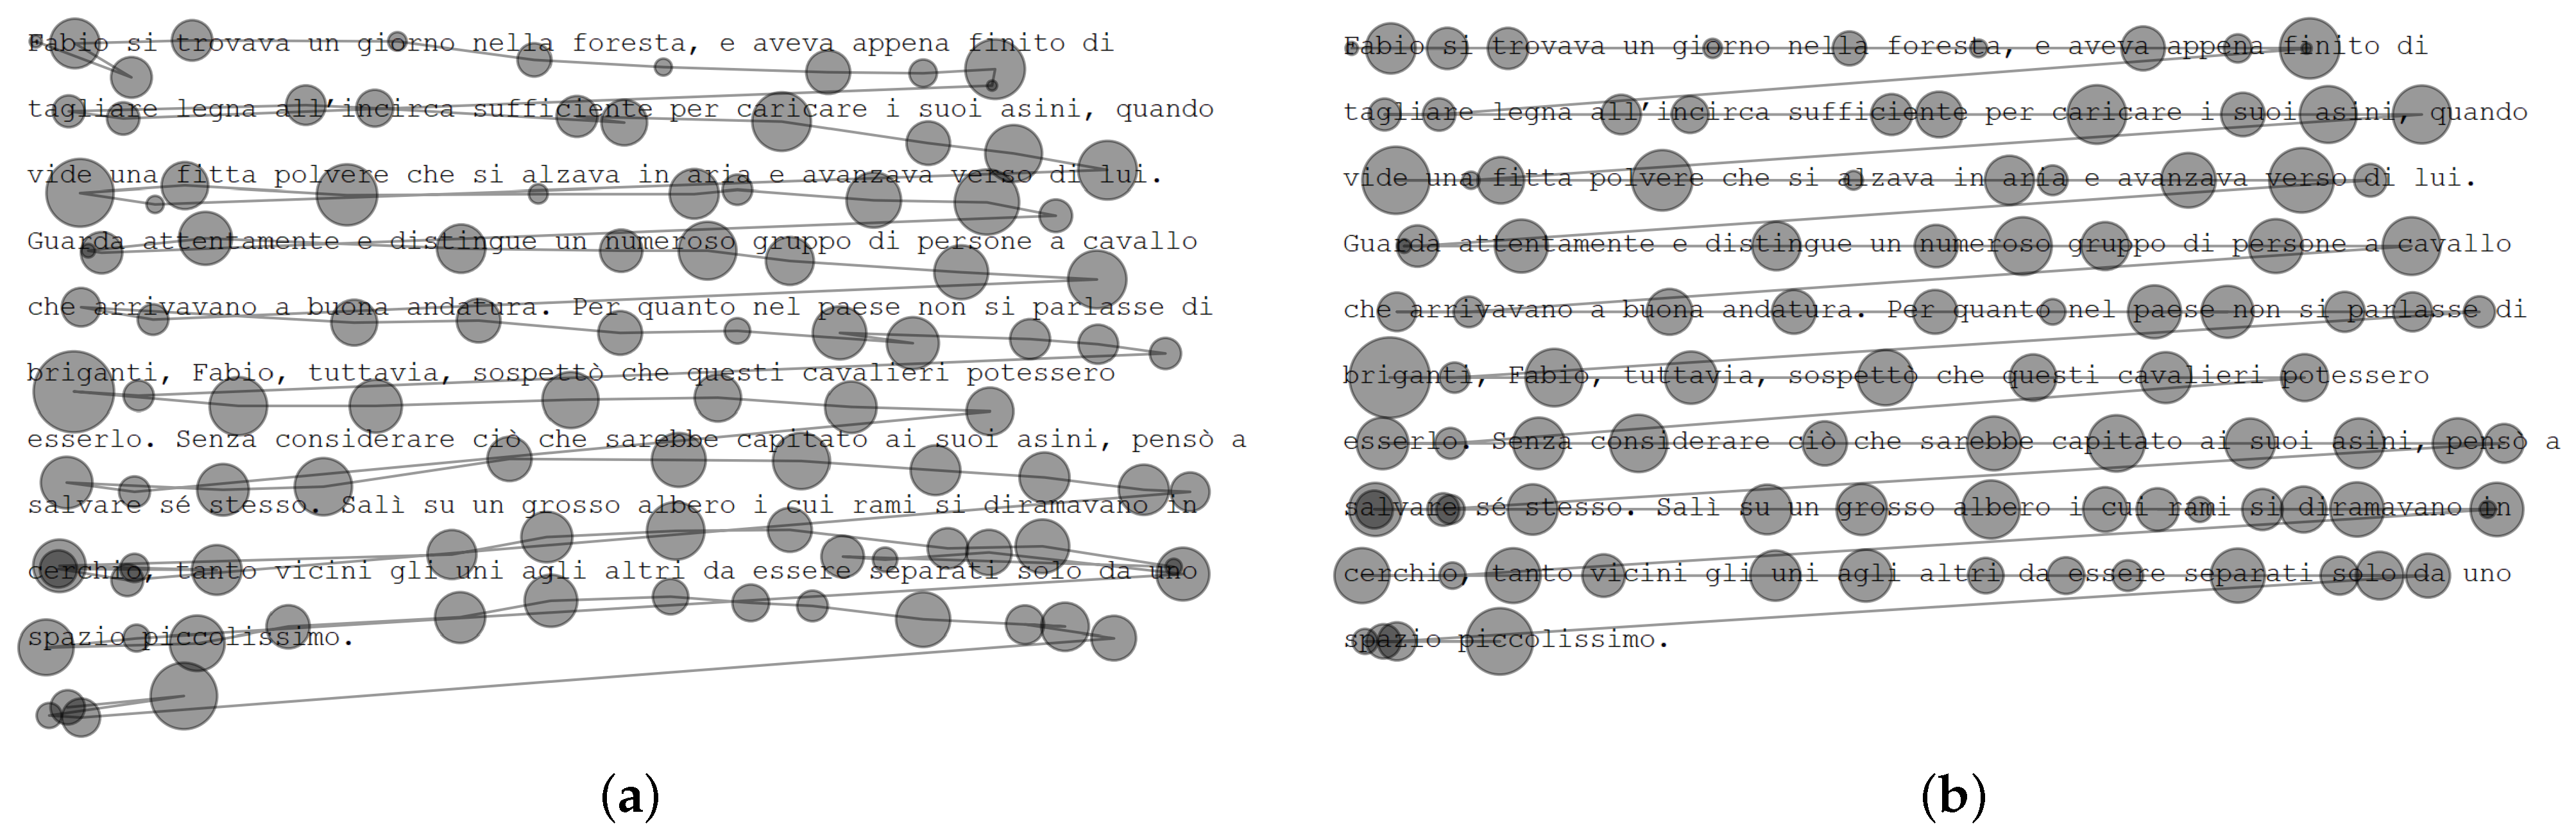
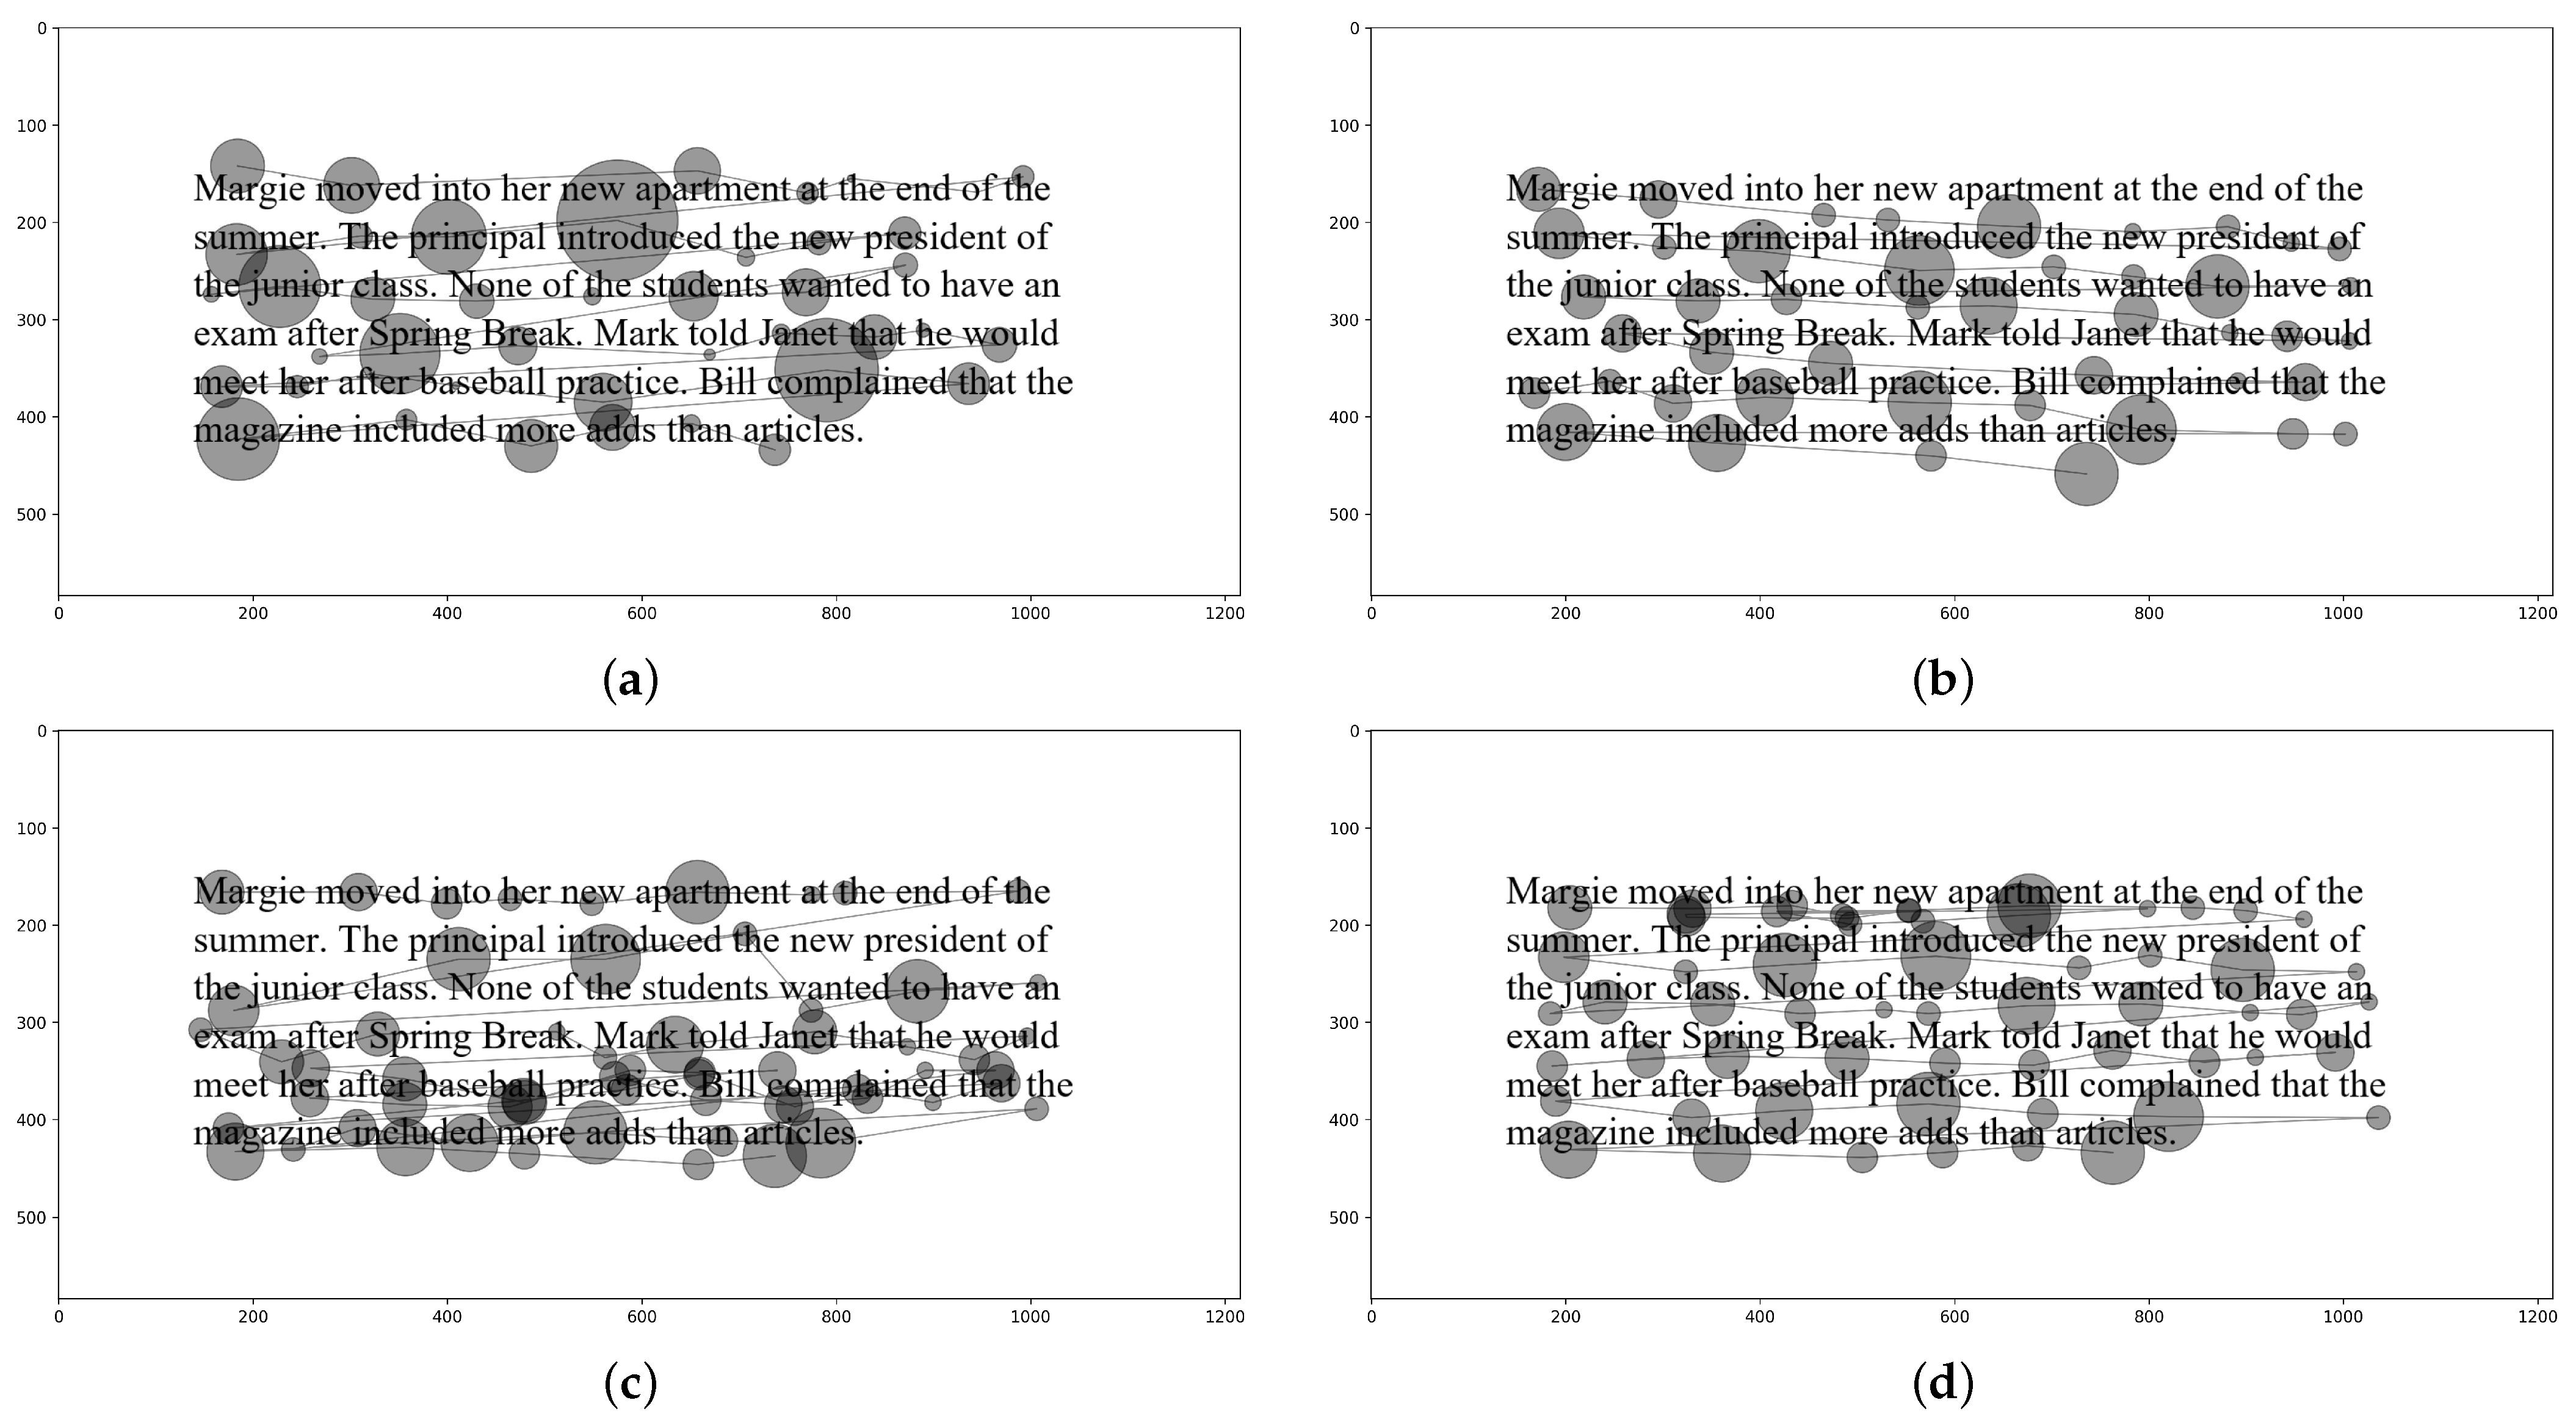
Figure 2 shows four sample trials.
According to [
13,
18], noise describes a situation where a subset of fixations experience a distortion on the y-axis, resulting in some fixations drifting above the text and some below the text. Slope describes a situation where fixations experience drift on one side of the screen due to calibration error, leaving fixations on one side intact while fixations on the other side drift below (or above) the text. Shift describes the same phenomenon on the vertical axis, where the first line might be intact and other lines progressively experience drift with the maximum drift at the last line. Offset describes a consistent drift affecting all fixations in the same proportion. Within-line regressions describes a reading behavior, where the eyes make a jump to a previous word on the same line, and similarly, between-line regressions describe jumps to a previous line.
Initially, the synthetic trials were generated without distortions, then distortions and regressions were introduced. This allows us to compare the human-corrected trial to the original trial (before distortions) to assess correction accuracy. Using these synthetic data allows for a unique and accurate way of objectively assessing the accuracy of manual correction.
As described by Al Madi et al. [
30], the synthetic data are generated with a level of realism in terms of fixation durations and typical reading phenomena such as word skipping. Fixation duration is proportional to word length in terms of character spaces, and short words are more likely to be skipped. Each distortion and regression type is captured at varying magnitudes, resulting in trials with low, medium, and high levels of distortion.
The
ErrorNoise generator in Algorithm 1 introduces vertical noise to a list of eye-tracking fixation points to simulate measurement inaccuracies or distortions. Each fixation is represented as a triplet containing the
x-coordinate,
y-coordinate, and fixation duration. The algorithm iterates over each fixation and perturbs the
y-coordinate by adding a random value (positive or negative) drawn from a Gaussian distribution with a mean of 0 and standard deviation equal to a user-specified parameter
. The
x-coordinate and duration remain unchanged. The modified fixation is then stored in a result list, which is returned at the end.
| Algorithm 1 ErrorNoise: Add vertical Gaussian noise to fixations |
Require: : standard deviation of vertical noise
Require: : list of fixation triplets
Ensure: : list of distorted fixations
- 1:
empty list - 2:
for
to
do - 3:
- 4:
- 5:
- 6:
- 7:
Append to - 8:
end for - 9:
return
|
The ErrorSlope generator in Algorithm 2 simulates a distortion in eye-tracking data by altering the vertical (y) coordinate of each fixation according to its horizontal (x) displacement from the first fixation. It takes as input a list of fixation triplets and a slope factor that controls the degree of vertical drift across the horizontal axis. The algorithm begins by storing the x-position of the first fixation, which serves as a reference. For each fixation, it calculates the horizontal offset from this reference and uses it to compute a vertical adjustment proportional to the given slope factor. This modified y-coordinate is combined with the original x-coordinate and duration, and the adjusted fixation is stored. The result is a list of fixations with a consistent vertical trend applied across their x-positions.
The
ErrorShift generator in Algorithm 3 introduces a vertical distortion to the eye-tracking fixation coordinates by shifting each fixation’s
y-value based on its vertical distance from a reference line (typically the top line). It accepts as input a list of fixation triplets
, a list of line y-coordinates, and a shift factor that determines the magnitude of distortion. The algorithm begins by computing the line height as the vertical distance between the first two lines. Then, for each fixation, it calculates how far the fixation’s
y-value is from the first line and applies a scaled distortion proportional to that distance and the shift factor. This adjusted
y-value is combined with the original
x-value and duration, and the distorted fixation is stored. The resulting output is a list of fixations with a smooth vertical shift that increases with distance from the top of the screen.
| Algorithm 2 ErrorSlope: Apply linear vertical distortion based on the x-position |
Require: : vertical slope distortion factor
Require: : list of fixation triplets
Ensure: : list of slope-distorted fixations
- 1:
empty list - 2:
- 3:
for
to
do - 4:
- 5:
- 6:
- 7:
- 8:
Append to - 9:
end for - 10:
return
|
| Algorithm 3 ErrorShift: Apply vertical shift distortion relative to the line positions |
Require: : vertical shift distortion factor
Require: : list of line y-coordinates
Require: : list of fixation triplets
Ensure: : list of vertically shifted fixations
- 1:
empty list - 2:
- 3:
for
to
do - 4:
- 5:
- 6:
- 7:
- 8:
- 9:
Append to - 10:
end for - 11:
return
|
The ErrorOffset generator in Algorithm 4 introduces a uniform distortion to the eye-tracking fixation coordinates by applying fixed horizontal and vertical offsets to each fixation. It accepts a list of fixations represented as triplets , along with scalar values and , indicating how much to shift each fixation in the x- and y-directions, respectively. The algorithm iterates through each fixation, adds the offsets to the x- and y-values, and preserves the original duration. The result is a list of systematically displaced fixations that simulate a consistent calibration error or systematic drift in recorded eye-tracking data.
The
BetweenLineRegression generator in Algorithm 5 generates synthetic fixations based on the layout of words (AOIs) in a reading stimulus. For each word, it computes a fixation slightly to the left of the word’s center (at roughly one-third width) and vertically centered on the line, with added jitter to simulate natural variability around the optimal viewing position. Fixation durations are scaled proportionally to the word width. Additionally, the algorithm introduces between-line regressive fixations that jump backward to earlier words on previous lines based on a user-defined probability. Candidate indexes for regressions are randomly selected, and the algorithm ensures that at least one regression occurs if the regression probability is non-zero. When a regression is triggered, the algorithm attempts to select a valid target on a different line by retrying up to ten times. This simulates more realistic regressions in reading patterns while maintaining the spatial and temporal plausibility of the fixation data.
| Algorithm 4 ErrorOffset: Apply fixed x/y offset to the fixation coordinates |
Require: : horizontal offset
Require: : vertical offset
Require: : list of fixation triplets
Ensure: : list of offset fixations
- 1:
empty list - 2:
for
to
do - 3:
- 4:
- 5:
- 6:
- 7:
- 8:
Append to - 9:
end for - 10:
return
|
| Algorithm 5 BetweenLineRegression: Generate fixations with between-line regressions |
Require: : list of Areas-Of-Interest (AOIs)
Require:
Ensure: : list of synthetic fixations
- 1:
Select probabilistically from indices - 2:
if no and then - 3:
Add one random regression index from valid range - 4:
end if - 5:
- 6:
while
do - 7:
Extract from - 8:
, - 9:
- 10:
Append to - 11:
if then - 12:
Try up to 10 times to select a prior index on a different line - 13:
If successful, set and continue - 14:
end if - 15:
- 16:
end while - 17:
return
|
The WithinLineRegression generator in Algorithm 6 simulates eye fixations along lines of text, introducing within-line regressions with a specified probability. This generator is mostly identical to the BetweenLineRegression generator; the only difference is that it guarantees a regression within the same line of text instead of a previous line. When a regression index is reached, the algorithm attempts to jump back to a previous word on the same line, simulating a within-line regression. This process continues returning a list of generated fixations that emulate realistic reading behavior with occasional regressive eye movements confined to the same line.
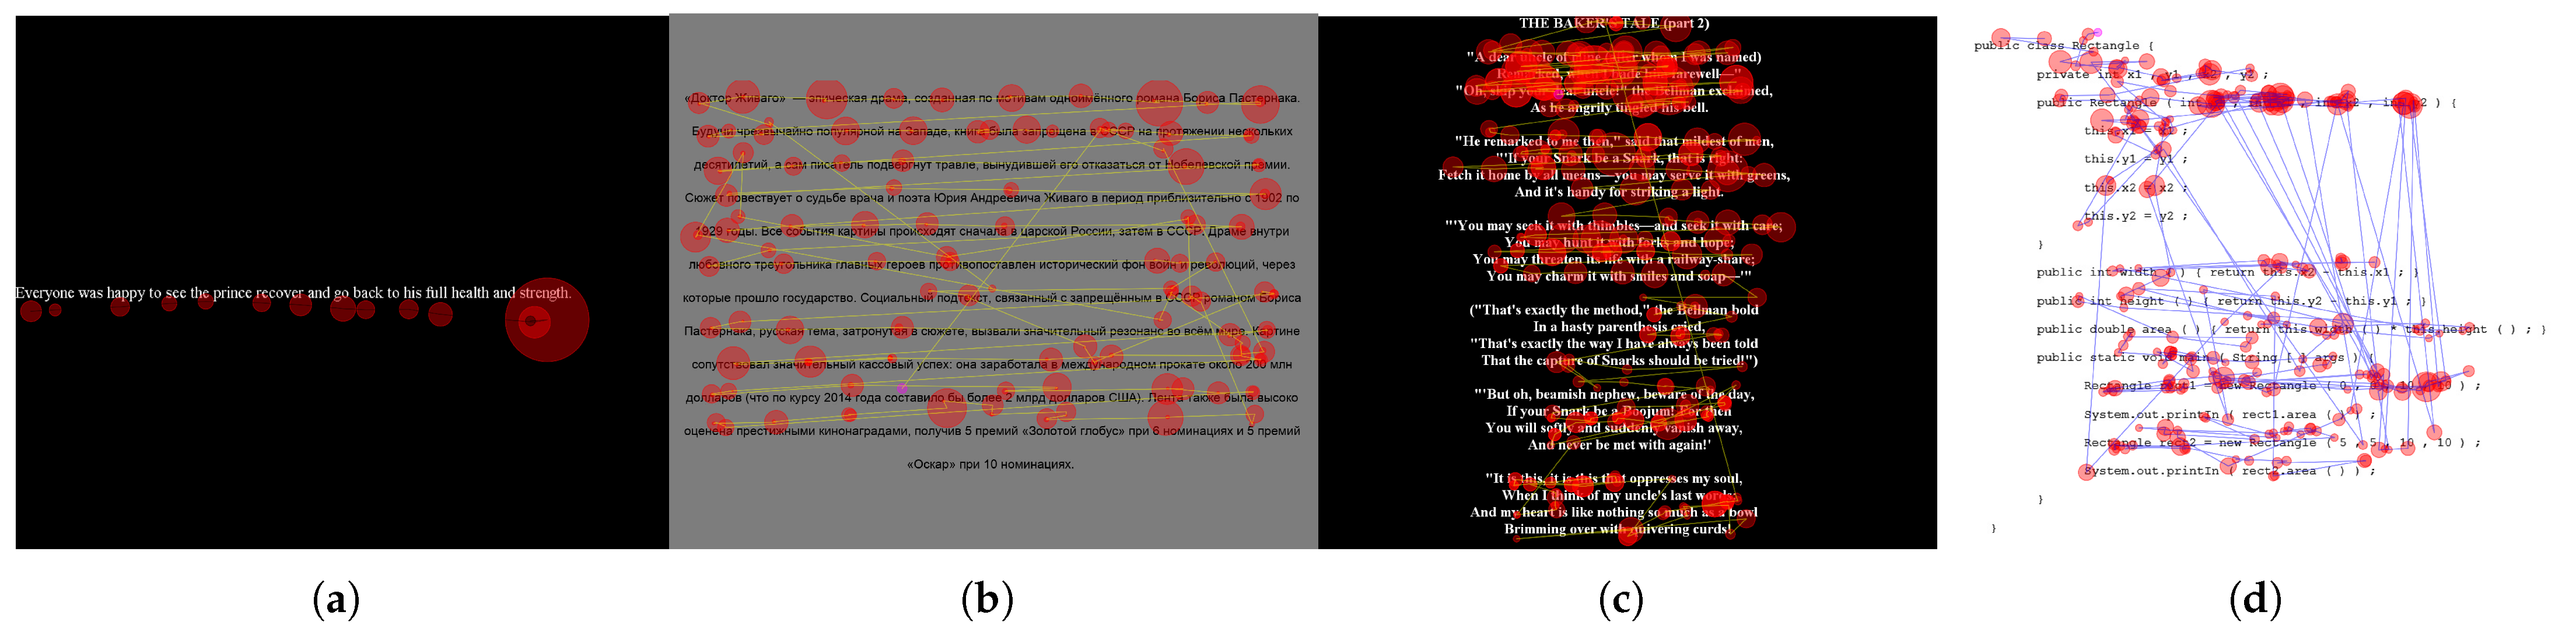
In addition to the synthetic data, 18 real-data trials come from four datasets, five trials from Al Madi and Khan [
31], five from the Multilingual Eye Tracking (MET) dataset [
32], four from GazeBase [
33], and four from the Eye Movement In Programming (EMIP) dataset [
34].
Figure 3 shows sample trials from each dataset, which represent diverse reading experiments reflecting differences in language, number of lines of text, font height, spacing, and eye tracking frequency. The set of real-data trials is used in measuring subjectivity with highly realistic and representative data.
| Algorithm 6 WithinLineRegression: Generate fixations with within-line regressions |
Require: : list of Areas-Of-Interest (AOIs)
Require:
Ensure: : list of generated fixations
- 1:
Select probabilistically from indices - 2:
if is empty and then - 3:
Add one random regression index to ensure coverage - 4:
end if - 5:
- 6:
while
do - 7:
Extract from - 8:
Compute fixation location with small horizontal/vertical jitter - 9:
- 10:
Append to - 11:
if then - 12:
Try up to 10 times to pick prior index on the same line - 13:
if successful then - 14:
chosen prior index - 15:
continue - 16:
end if - 17:
end if - 18:
- 19:
end while - 20:
return
|
In the original study by Al Madi et al. [
30], participants corrected half of the trials manually and half using the assisted approach presented in the article. For the purpose of this study, we focus only on trials that were corrected manually, excluding trials that were corrected using the assisted technique. In addition, the original study relied on self-reporting for experience, while here, we rely on the overall performance of each participant. There was a clear gap in the performance of participants, resulting in labeling ten participants as novices and four as experts. More specifically, we took the mean accuracy of each participant in addition to their self-reported experience to label participants as either experts or novices. When the overall accuracy of a participant exceeded 90%, they were entered into the advanced group. All but one person in the experienced group reported being experienced in eye tracking data correction. In other words, participant performance matched self-reported experience with 12 out of 14 participants (one novice and one expert).
2.2. Automated Correction
For comparison with manual correction, the same synthetic trials containing distortion are given to nine automated correction algorithms. The accuracy of each algorithm is assessed by comparing the corrected trial to the original synthetic trial before distortion was introduced.
The automated correction algorithms fall into various categories based on the heuristic strategy that guides their correction. As described by Carr et al. [
13], positional algorithms include the
Attach algorithm, which assigns each fixation to its closest text line, and the
Chain algorithm, which groups consecutive fixations and assigns them to the line closest to the mean of their y-values [
13,
35]. Relative positional approaches such as
Cluster use k-means clustering to group fixations with similar y-values, while
Merge progressively combines fixation sequences until they match the number of text lines [
35,
36]. The
Regress algorithm treats fixations as a cloud of points and fits regression lines [
37], whereas
Stretch minimizes the alignment error between fixation points and text lines through adjustments in offsets and scaling factors [
20]. Sequential algorithms like
Segment divide fixation sequences into discrete subsequences mapped linearly from top to bottom [
21], while
Warp employs Dynamic-Time Warp to minimize Euclidean distances between fixation positions and word centers [
13].
The Attach algorithm, as implemented by Carr et al. [
13], takes as input a list of 2D fixation coordinates (fixation_XY) and a list of y-values corresponding to horizontal text lines (line_Y). Its purpose is to align each fixation vertically with the nearest line, effectively “snapping” the eye movement data to the most probable reading line. For each fixation point, it computes the vertical (y-axis) distance to all lines in line_Y, identifies the line with the minimum absolute difference, and it replaces the fixation’s y-coordinate with that of the closest line. This process ensures that all fixations are vertically aligned to the most likely text line.
Here, we present a more optimized version of the Attach algorithm (Algorithm 7), which improves efficiency by using binary search to find the nearest text line for each fixation. Assuming the array of line positions (
line_Y) is sorted, the algorithm iterates through each fixation in
fixation_XY, retrieves its y-coordinate, and uses binary search to find the index of the closest value in
line_Y. It then replaces the fixation’s y-value with that of the nearest line. Because binary search reduces the search from linear time
to logarithmic time
, the overall time complexity improves from
to
, where
n is the number of fixations and
m is the number of lines of text. This optimization improves runtime, especially for large datasets.
| Algorithm 7 Optimized Attach fixations to the closest line (optimized with binary search) |
Require: , array of fixation coordinates
Require: , sorted array of y-coordinates of lines
Ensure: Modified with updated y-values
- 1:
length of - 2:
for
to
do - 3:
- 4:
Index of value in closest to y (using binary search) - 5:
- 6:
end for - 7:
return
|
The
Chain algorithm [
35], as implemented by Carr et al. [
13], groups sequences of temporally and spatially close eye fixations into chains and aligns them to the nearest text line. It begins by computing the horizontal and vertical distances between consecutive fixations. A new chain is initiated whenever the distance between fixations exceeds either a horizontal threshold (
) or a vertical threshold (
), which indicates a transition between reading units such as words or lines. For each chain of fixations, the algorithm calculates the average y-coordinate and finds the closest line in
line_Y to that average. It then aligns all y-values within the chain to the y-coordinate of that line, effectively snapping entire chains rather than individual fixations to their most likely text line.
The optimized version of the
Chain algorithm, presented here in Algorithm 8, improves performance by using binary search to find the closest line for each chain of fixations. First, the algorithm calculates the pairwise distances between consecutive fixations in both x- and y-dimensions. It identifies the boundaries of fixation chains based on whether these distances exceed predefined thresholds (
and
), which typically signal line or word transitions. For each resulting chain, it computes the mean y-coordinate and uses binary search on the sorted array of line positions (
) to efficiently find the nearest line. All fixations in the chain are then aligned to that line’s y-coordinate. By replacing a linear search with binary search, the algorithm reduces the complexity of line assignment from
to
, where
k is the number of chains.
n is the number of fixations and
m is the number of lines of text.
| Algorithm 8 Optimized Chain fixations to the nearest line |
Require: , array of fixation coordinates
Require: , sorted array of line y-positions
Require: – spatial thresholds for chaining
Ensure: Modified with grouped y-values aligned to lines
- 1:
length of - 2:
- 3:
- 4:
indices where or - 5:
Increment all by 1 and append n - 6:
- 7:
for all do - 8:
- 9:
- 10:
- 11:
- 12:
end for - 13:
return
|
The
Cluster algorithm, which is based on Ref. [
35] and implemented by the authors in [
13], groups fixations into
m vertical clusters, where
m is the number of expected text lines (i.e., the length of
). The algorithm applies KMeans clustering to the y-values of the fixations, resulting in
m clusters corresponding to groups of fixations that likely fall on the same line of text. Each cluster’s mean y-coordinate is then computed, and the clusters are sorted by vertical position from top to bottom. After sorting, the algorithm matches the topmost cluster to the topmost line in
, the second-highest cluster to the second line, and so on. Each fixation is then reassigned the y-coordinate of the matched line. This approach depends on the quality of clustering and the assumption that the number of lines is known in advance. The algorithm runs in approximately
time, where
t is the number of KMeans iterations.
The
Merge algorithm, based on [
36] and implemented by [
13], is a multi-phase heuristic designed to align eye fixation sequences to specific text lines. The algorithm begins by identifying natural breaks between fixations, using horizontal (X) backtracking regressions or large vertical (Y) jumps to split the sequence into initial candidate groups. These groups, called “sequences”, are then iteratively merged across four phases with increasingly relaxed constraints. In each phase, pairs of sequences are evaluated for potential merging based on their linear fit—the slope (gradient) and residual error of a regression line through their combined fixation coordinates. A merge is accepted if the pair satisfies the gradient and error thresholds, except in the final phase where these constraints are ignored. The goal of merging is to reduce the number of fixation sequences to match the number of text lines. Once enough merges have occurred, the algorithm computes the mean y-position of each sequence, sorts them, and aligns each group to the closest corresponding line. In practice, the algorithm runs in approximately
time (average time complexity).
The
Regress algorithm is a probabilistic approach to aligning eye fixations to lines of text by estimating the most likely mapping using a fitted regression model [
37]. The core idea is that fixations may be misaligned vertically due to systematic distortions, such as screen-viewing angles or calibration errors. To correct this, the algorithm searches for the optimal parameters of a simple linear transformation—a slope, an offset, and a noise spread—which are constrained to fall within user-specified bounds. These parameters are searched using a gradient-based optimization routine (
minimize) that aims to maximize the likelihood (or minimize the negative log-likelihood) that the observed vertical fixation positions were drawn from Gaussian distributions centered on the predicted positions for each line. Each fixation’s predicted y-coordinate is calculated from its x-position and the current slope estimate, plus an offset relative to each candidate line. For every line, the algorithm evaluates the log-probability of each fixation coming from that line and assigns each fixation to the line with the highest probability. Once the best-fit parameters are found, the y-positions of fixations are snapped to their most likely lines, producing an alignment that accounts for both linear distortion and reading noise. The algorithm runs in approximately
time, where
t is the number of iterations or function evaluations performed by the optimizer.
The
Segment algorithm is a heuristic method designed to assign eye fixation coordinates to specific lines of text based on patterns of horizontal eye movement, which are characteristic during reading [
21]. It assumes that the most significant horizontal saccades typically correspond to transitions between lines—for example, when a reader reaches the end of one line and moves to the start of the next. The algorithm begins by measuring the horizontal distances between consecutive fixations and ranks the saccades by length. From this ranking, it identifies the
smallest saccades as probable indicators of line changes, where
m is the total number of text lines. The algorithm then iterates through the sequence of fixations, assigning each one to a line by adjusting its vertical coordinate to match the corresponding line position. When a fixation index corresponds to one of the identified line change positions, the algorithm increments the current line index to move to the next line. This effectively segments the sequence of fixations across the text lines, assuming that line transitions are marked by smaller horizontal movements relative to within-line reading behavior. The algorithm runs in approximately
time.
The
split algorithm is designed to correct vertical drift in eye-tracking data by segmenting sequences of fixations into individual reading lines using horizontal movement patterns [
13]. It begins by calculating the horizontal distances (saccades) between consecutive fixations. These saccades are clustered into two groups using KMeans clustering, which assumes that one group represents short intra-line fixations and the other represents long sweep saccades that typically occur at line boundaries. By identifying which cluster corresponds to these longer sweep saccades (determined by the cluster with the lower mean), the algorithm determines the indices at which a line transition occurs. Using these indices, the algorithm splits the fixation sequence into line segments. For each segment, it computes the mean vertical position of fixations and aligns all fixations within that segment to the closest line in the provided set of reference line positions (
line_Y). This approach enables the adaptive correction of drift by leveraging natural horizontal eye movement patterns during reading. The most computationally intensive operation is KMeans clustering on
saccades, leading to an overall time complexity of
for preprocessing and segmentation, assuming KMeans converges in constant time due to the fixed number of clusters.
The
stretch algorithm corrects vertical drift in eye-tracking data by globally adjusting the vertical positions of fixations through a linear transformation involving both scaling and offset. It assumes that vertical drift can be approximated by a uniform stretch and shift of fixation y-coordinates [
13]. To achieve this, the algorithm defines an objective function that computes transformed y-values using a given scale and offset, and ot aligns each transformed fixation to the nearest line in the reference array
line_Y. The cost is calculated as the sum of absolute differences between the transformed y-values and their corresponding aligned lines. Using bounded optimization, the algorithm finds the parameters that minimize this cost, constrained within user-defined bounds. Once the optimal scale and offset are determined, the final corrected y-positions are generated by aligning the transformed coordinates to the closest lines. Since each evaluation of the objective function involves all
n fixations and the number of parameters is constant, the time complexity of the algorithm is
, where
t is the number of optimizer iterations.
The
warp algorithm corrects vertical drift in eye-tracking data by aligning each fixation to the most likely line of text based on its proximity to corresponding words [
13]. It employs Dynamic Time Warping (DTW) to establish an optimal alignment between the sequence of fixations and the sequence of word positions (
word_XY). DTW constructs a cost matrix using pairwise Euclidean distances between fixations and words and finds a minimum-cost path that allows for non-linear alignment to accommodate variations in reading pace. Once this path is obtained, each fixation is associated with one or more words, and its y-coordinate is updated to the mode of the y-values of those associated words, effectively snapping it to the most probable reading line. This approach ensures a robust correction that is tolerant to noise while maintaining alignment with the structure of the text. The overall time complexity of the algorithm is
, where
n is the number of fixations and
m is the number of words.
2.3. Analyses
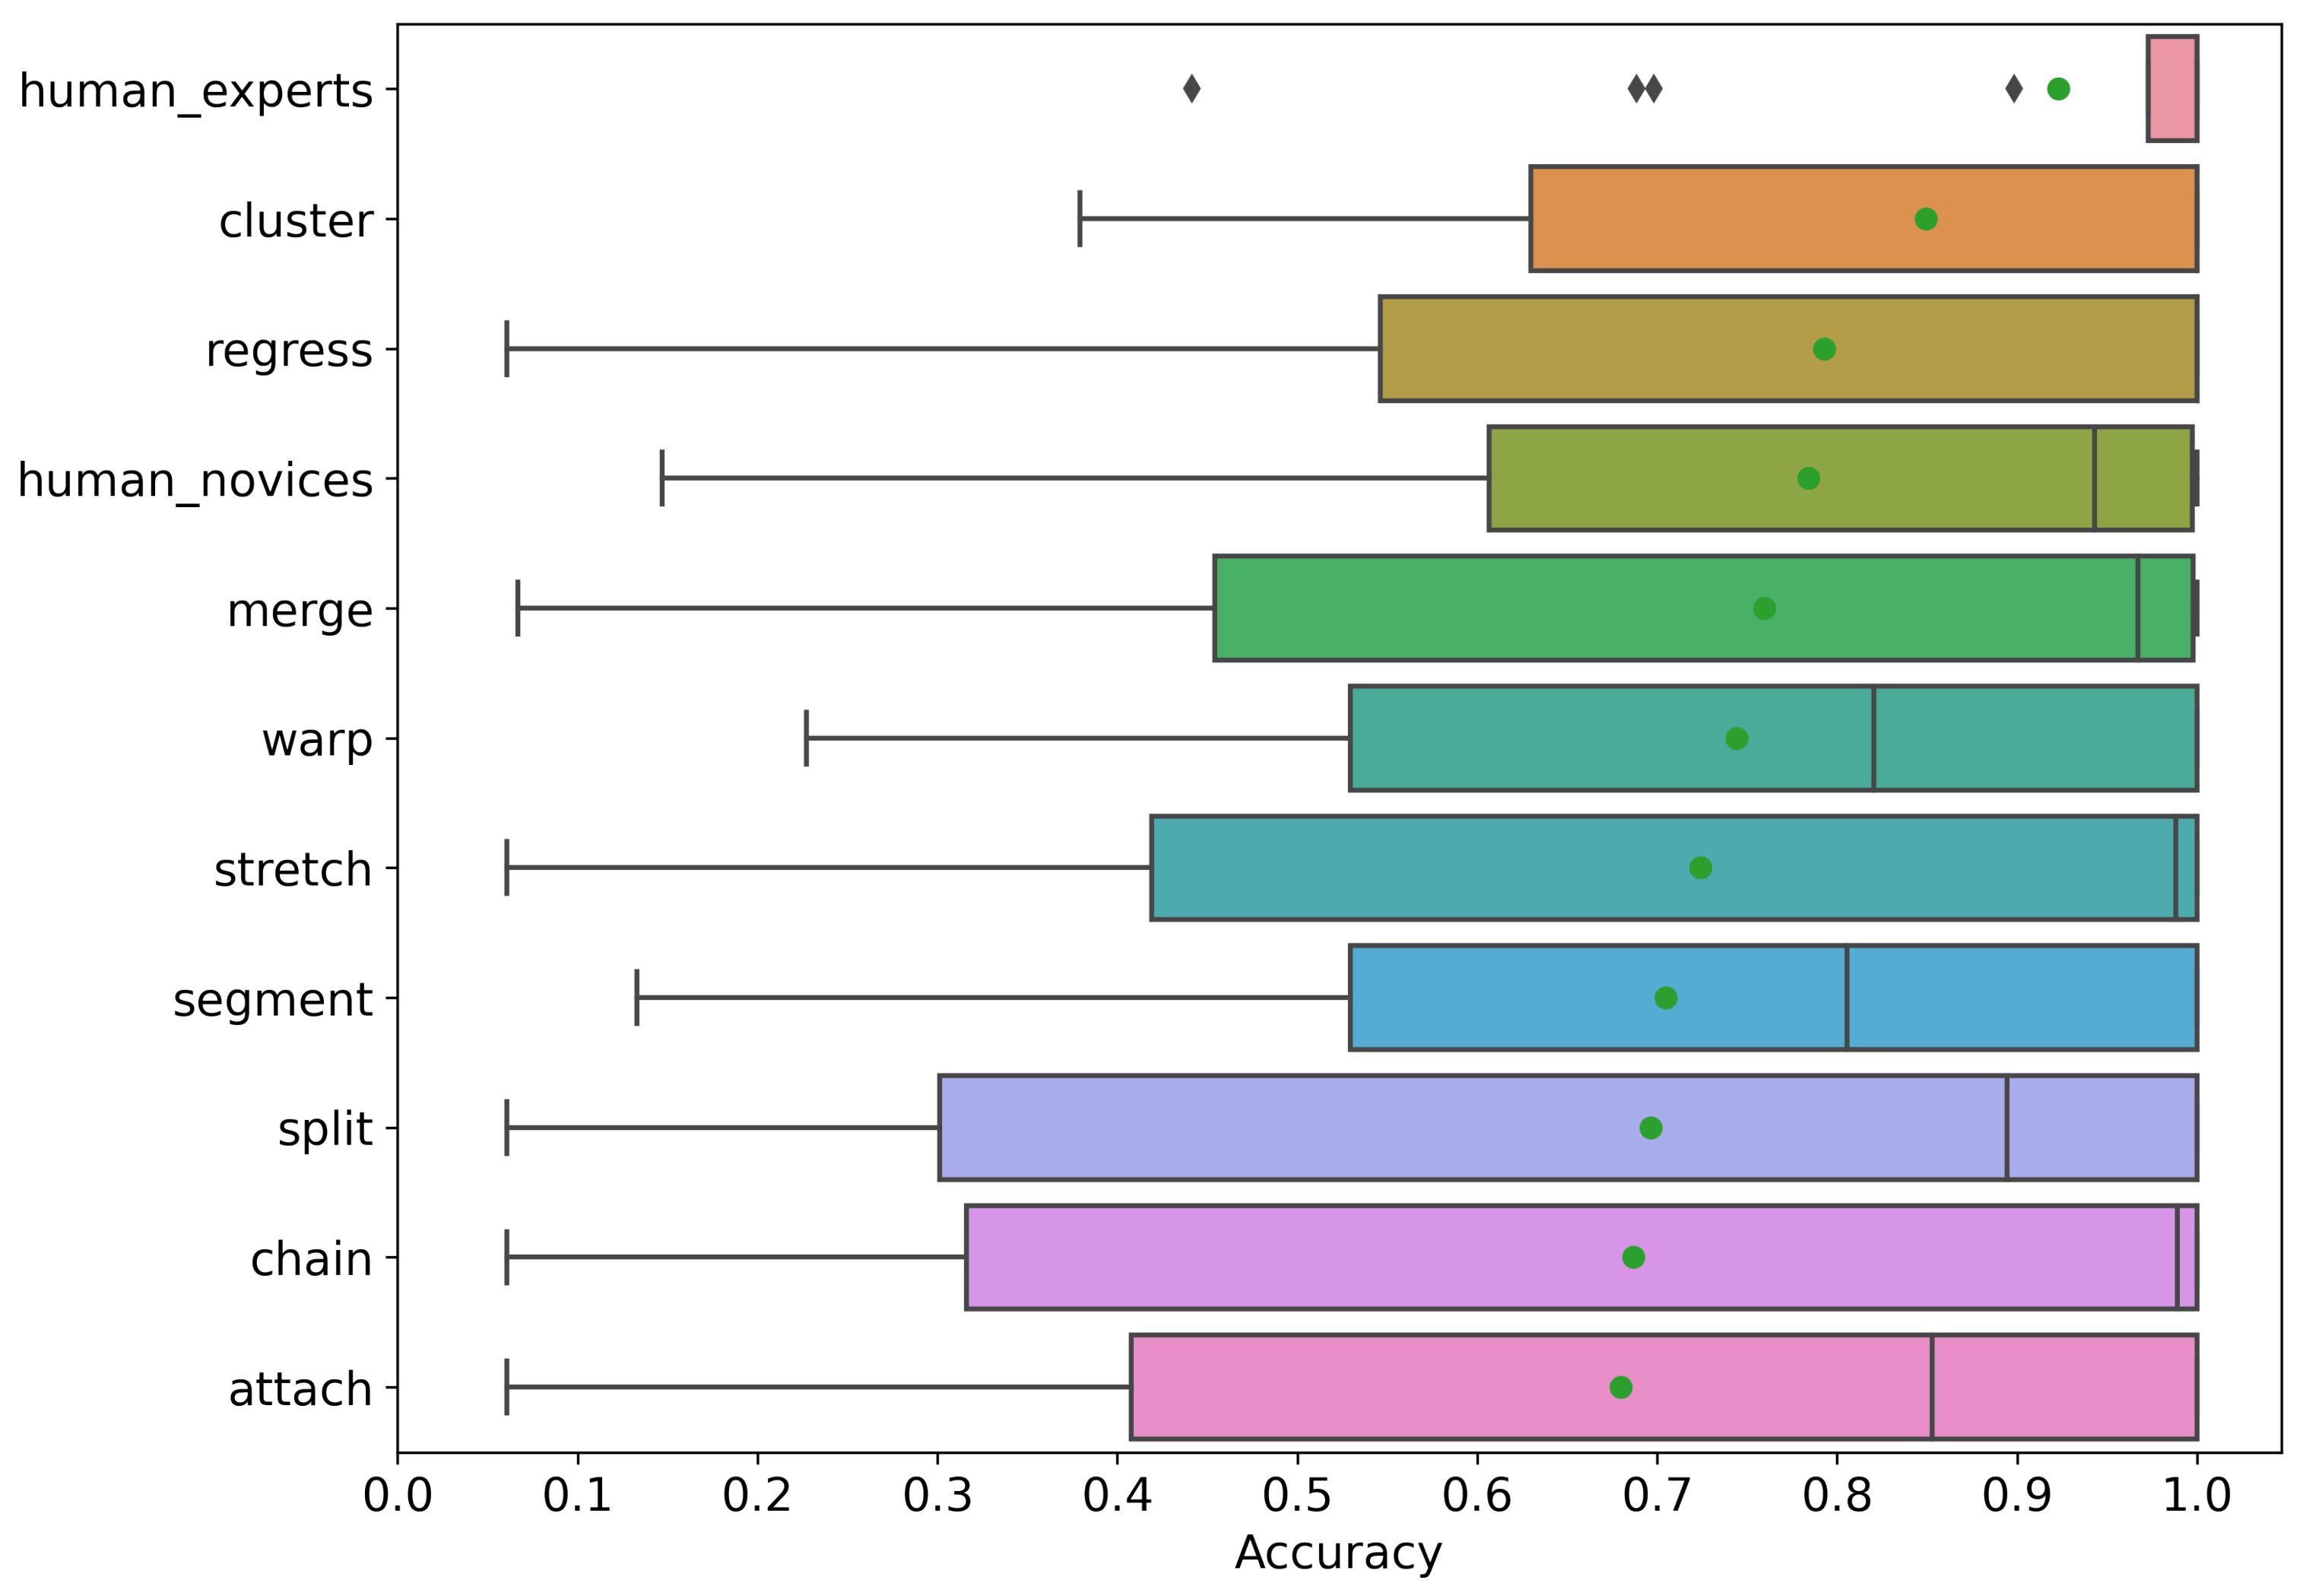
Our first research question compares the accuracy of manual correction with automated algorithms on the synthetic data. Here, we focus on the synthetic data exclusively, to avoid relying on human correction as the ground truth leading to circular bias. We compare manual and automated corrections to the original trials before distortion was introduced. This way, the comparison is objective and the ground truth data are completely reliable.
Accuracy in the context of correcting eye tracking data in reading tasks is measured as the percentage of fixations that are returned to the same line they were on before distortion was introduced. In other words, if fixation_n was on line 1, then after distortion was introduced, it was moved to another line or an empty space between the line, and a valid correction should return that fixation to line 1. The correction accuracy for a given trial is calculated by counting the number of fixations that were returned to their original lines over the total number of fixations in the trial.
The second research question is concerned with subjectivity in manual correction. Subjectivity between human correctors would be reflected in applying different corrections to the same fixation, and therefore, it is the opposite of agreement. In other words, high subjectivity would result in low agreement between correctors and vice versa. Therefore, we measure agreement between correctors as the percentage of fixations where correctors assigned a given fixation to the same line.
Considering that human correctors corrected the same set of trials, we can give each fixation in each trial a unique ID. Then, we can examine the corrected trials from each participant, and for each fixation, we can record the line number it was assigned to in that trial. When all corrected trials from all correctors are processed, we can go over fixations one at a time and measure how often correctors assigned the fixation to the same line. For example, if three out of four correctors assigned a given fixation to the same line, then the agreement for that fixation is 75%. The overall agreement between correctors is the mean of the agreements on all fixations.
For the agreement, we focus on the corrected trials from human correctors without being concerned with accuracy. The goal is to measure how often correctors agree, not if correctors made the right correction or not. Therefore, we measure agreement over the real data for generalization.
Furthermore, we approach the agreement question statistically. Studies often use Cohen’s Kappa [
38] to assess the agreement between two raters, while in our study, we had 14 raters and therefore we rely on intra-class correlation to assess agreement. The Intra-Class Correlation Coefficient (ICC3) is a statistical measure used to assess the consistency or agreement of measurements made by multiple raters or instruments on the same subjects when a fixed set of raters is used for all observations [
29]. ICC3 is particularly sensitive to both systematic and random errors, as it treats differences between raters as part of the measurement error rather than a random factor. Its value ranges from −1 to 1, where higher values indicate stronger agreement. Typically, ICC3 is interpreted as follows: values above 0.75 indicate excellent reliability, values between 0.50 and 0.75 suggest moderate reliability, and values below 0.50 reflect poor reliability.


