Introduction
The study of cognitive processes at stake in reading tasks is a major field of investigations in cognitive psychology and educational sciences (
Rayner, 1998,
2009). To achieve this goal, eye tracking is a particularly useful and powerful source of information (
Clifton et al., 2007). Eye trackers provide almost straightforward access to the time sequence of read syllables and thus, words, sentences and full texts. On the one hand, this becomes fundamental material to explore and test hypotheses on mechanisms underlying processes at stake in semantic integration [occurring in reading tasks]. On the other hand, all data and knowledge accumulated has allowed the development of models describing the control of eye movements during reading. The most popular models are EZ Reader (
Reichle et al., 1999, 2003,
2006), SWIFT (
Engbert et al., 2005;
Nuthmann & Engbert, 2009) and Glenmore (Reilly & Radach, 2002, 2006). These models provide theoretical frameworks to understand word identification, i.e. the lexical processing of words by the allocation of attention with the eye movements. Such models can predict when (fixation duration) and where (fixate or skip the next word) to move eyes. One major difference among them is the early stage of attention allocation assuming a serial lexical process for EZ-reader or a parallel one for consecutive words for SWIFT and Glenmore. But in all cases, these models assume a normal reading strategy called "rauding" (combination of reading and auding involving language comprehension) in the classification proposed by (
Carver, 1977,
1992), who introduced the terminology.
Until recently, experiments in eye tracking during reading tasks were restricted to carefully controlled experimental designs, particularly regarding textual materials. A possible reason for this is the heterogeneous nature of the reading process. It has been shown (
Carver, 1997; Simola et al., 2008;
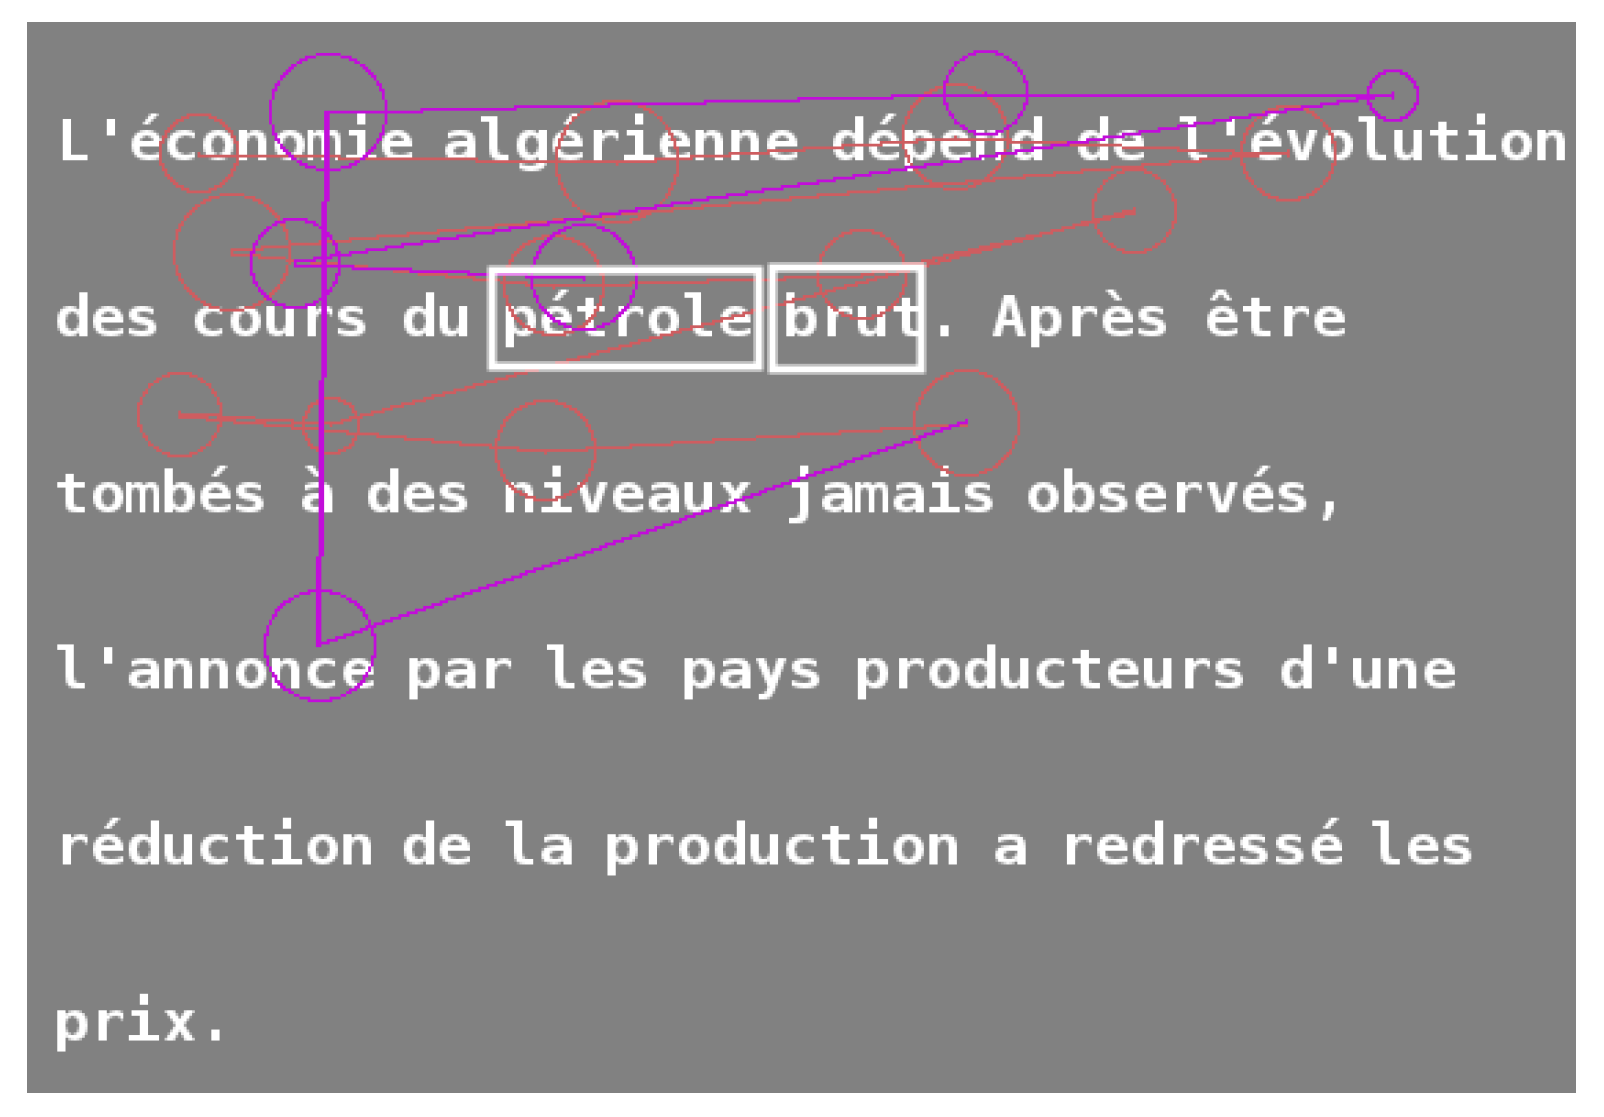
Salmerón et al., 2017) that depending on the reader’s current focus and intention, this process goes through different phases, such as text scanning or careful reading. In the case of multimedia documents, phases may also consist in making a connection between a text and an image or a video. The assumption of readers using personal and various strategies can be formulated from the observation of two scan paths from a same text read by two subjects, such as the ones in Figures S1 and S2 in Supplementary file. In Figure S1, fixations from 1 to 29 are on each word successively or nearly so, while each fixation after the 30th returns backward in the text, suggesting a change in the reading strategy. Every significant word but three of them were fixed. In Figure S2, fixations from 1 to 11 are on each word successively or nearly so, while fixations after the 12th alternate between long progressions (thus skipping some words) and backward fixations, suggesting once again a change in the reading strategy, but now using a different strategy for both readers after the first change. Six significant words were not fixed. Such heterogeneity precludes any straightforward statistical analysis based on global indicators computed at the whole scanpath scale (mean reading speed, saccade amplitude, fixation duration…), since this would mask the specific distributions associated to each phase. The ability to detect such phases to identify which one is currently carried out and what their dynamics are, is thus of significant importance to explain and analyse eye movements. The aim of our study is to propose a model to infer phases in scanpaths with similar statistical properties, where phase changes correspond to using a different reading strategy. Each phase is defined by a label, so that phases with a same label should be the expression of a same cognitive step reached during text processing. What is at stake is not only to infer underlying cognitive processes that explain the phases, but also to align or resynchronise parts of scanpaths from different readers or reading experiments, so as to obtain robust estimations of within-phase statistical properties.
Phase identification would offer new possibilities for analysing more complex reading scenarios, which are closer from real tasks of everyday’s life. Among those are for example, journal reading and web browsing for information search, in which readers have the possibility at every moment to decide to continue, to quit reading, or to change their focus of interest, etc. In this perspective, the ZuCo database consists of several datasets on natural reading of sentences from Wikipedia with different tasks such as reading or reading and evaluating semantic relation (
Hollenstein et al., 2018).
As a further consequence of reading phases, the topic of interest for researchers does not only focus on the reading processes, but also on the intertwined process of associated decisions on what to read next and how, closely linked to semantic integration and reader’s aims (
Frey et al., 2013,
2018). In this work, our hypothesis is that such phase changes exist in poorly constrained experimental reading situations, are latent and can be deciphered by appropriate statistical analysis of eye-movement data. Phases can be obtained using segmentation methods, such as hidden Markov models (HMMs). Segmentation consists in splitting scan paths into homogeneous portions (referred to as segments), in terms of eye-movement statistical properties.
HMMs are generally dedicated to modelling processes subject to regime switchings that separate successive phases, by associating one or several states to each possible phase. Not only do they provide signal segmentations but they also offer the possibility to model state dynamics, since in contrast to instantaneous (so called change-point) detection, probabilistic properties of segment durations and transitions to previously-visited states are included into the model. They have been used successfully to model the dynamics of eye movements, both in reading tasks as previously mentioned and in exploration of images. Functions of underlying Markovian cognitive states were introduced in (
Groner & Groner, 1982) in a conceptual context of sequential problem solving. HMMs were then used in (Salvucci & Goldberg, 2000) to segment scanpaths into sequences of fixations and saccades. Two states represent fixations and saccades, identified from observed velocities in eye movements. Chuk and collaborators (2014) developed a Matlab
® toolbox (
http://visal.cs.cityu.edu.hk/research/emhmm/) for eyemovement analysis with HMM. This time series model was first applied to face exploration in order to represent the evolution of eye positions into different regions of interest in the face (the hidden states). The classification of each individual HMM showed a dichotomy between holistic and analytic strategies of exploration. In (
Coutrot et al., 2018), HMMs were used for task classification from scanpaths with a comparable setting as in (Chuk et al., 2014), except that the HMM has a third state associated to the centre bias. Considering more complex tasks involving intertwined cognitive processes, switching hidden Markov model was introduced to extract the cognitive states (the hidden states) from eye movements to analyse theirs transitions (
Chuk et al., 2020). Pairs of faces were shown to participants who had to indicate which face they preferred. An HMM-analysis of their eye movements aimed at capturing cognitive state transitions, highlighting an exploration period and a preference period, where the gaze is driven by the participant’s preference (which were the two model states) and providing predictions regarding times to decisions (
Chuk et al., 2020). In (
Liu et al., 2020), HMMs were used to summarize the amount of eye exploration, once again from the sequence of eye positions on the image but using up to 14 states, which do not have any definite interpretation (the number of states was determined statistically using some information criterion).
HMMs were introduced in the context of reading tasks characterized by eye movements by (Simola et al., 2008). Three states (interpreted as scanning, reading and decision) were identified from sequences of saccade directions. In Simola’s study, HMMs mainly aimed at providing a probabilistic model for whole time series to perform their supervised classification, where the states accounted for regime switching over time.
In the context of analysing reading experiments, different classes of reading behaviours were defined and studied by (Carver, 1990). These classes were defined a priori in terms of tasks, mostly characterized by associated reading speeds of participants performing tasks. The comparison with emerging states inferred from eye tracking in free reading experiments is still an open question. Here, we address the problem with HMMs, which are relevant to identify phases in scanpaths in an unsupervised way, with homogeneous eye-movement dynamics within a phase and heterogeneous dynamics from a segment to another. HMMs simultaneously allow the clustering of similar segments into a labelled phase. Our approach, although based on the same statistical models, is different from the one by (Simola et al., 2008) since they used discriminative HMMs. As a consequence, their inferred reading states were defined so as to maximise discrepancies between models associated with three pre-defined tasks (word search, answering a question and search for the most interesting title within a collection).
In our study, we propose to use hidden semi-Markov chains (HSMCs) to infer states that optimize predictions of eye movements in less constrained experimental conditions. The Markovian assumption is relaxed in favour of a semi-Markov assumption to precisely model the number of steps (fixations in the case of this study) spent within each phase. Our estimation method simply maximises the fit between model and data. Our states are primarily defined by reading dynamics characterized by the number of words crossed in outgoing saccades, interpreted in terms of progression, regression, refixation, etc. This number of words is a signed value: positive in the case of progressions, negative in the case of regressions and null in case on refixations. This is also a difference with the approach proposed by Simola and collaborators (2008), who based their HMMs on several variables that depend on text layout, such as saccade directions and amplitudes. An unwanted consequence of this choice is that the states do not only reflect changes in the reading process but also changes in the text layout. In contrast, our approach is based on a single layout-independent variable. Moreover, after estimating the states from this variable only, we fully characterised them using saccade durations, directions and fixation durations, which integrate oculomotor features.
Methods
Participants, textual material and the experimental procedure were the same as in (
Frey et al., 2013). For the data sets, we used only in this study the eye tracking datasets but not the EEG datasets in the original files.
Participants
Twenty-one healthy adults participated in the experiment, all French native speakers. Data of six participants were discarded because they did not follow the rules of the experiment thoroughly, misunderstood the task, or because data was too noisy or subjected to experimental errors during the acquisition with the eye tracker. The fifteen remaining participants (6 women and 9 men aged from 20 to 32 years, 25 years 9 months ± 7 years 6 months, mean plus or minus standard deviation, sd) had normal or corrected-to-normal vision. There were free of any medical treatment or any neurological or psychiatric disorder, past or present. None of them had prior experience with the experimental task. All gave their written and informed consent prior to the experiment and were paid 20€ for their participation. The whole experiment was reviewed and approved by the ethics committee of Grenoble CHU (“Centre Hospitalier Universitaire”) (RCB: n° 2011-A00845-36).
Materials
180 short texts were extracted from the French newspaper Le Monde, edition 1999. Texts were given a topic and were constructed around three types, those which were highly related “HR” to the topic, or moderately related “MR” to the topic, or unrelated “UR” to the topic. There were 60 texts of each type, hence 180 in total. The semantic relatedness of the text to the topic was controlled by Latent Semantic Analysis (LSA) (
Deerwester et al., 1990). To do so, LSA was trained on a French corpus of 24 million words composed of all articles published in the newspaper Le Monde in 1999 and a word or set of words (sentence, text, etc.) was represented by a vector in this 300dimension semantic space. The number of dimensions
k = 300 was determined in an empirical way by different tests (
Martin & Berry, 2007). A very small number of dimensions results in an information loss and a very high number of dimensions does not allow one to make emerge the semantic relationships between the words (
Steyvers et al., 2005). A cosine function was used to compute the similarity between vectors composed for the topic in the one hand and for the text in the other hand. The higher the cosine value, the more related the topic and the text are. For all highly related topics, semantic similarity with the text was above 0.2, while for all unrelated topics, semantic similarity was below 0.06. The moderately related texts were inbetween. In the original study (
Frey et al., 2013) from which the data for this article were derived, participants’ text classification rates were as expected, namely a high acceptance rate for HR texts (92.9%), a chance-level acceptance rate for MR texts (47.2%), and a high rejection rate for UR texts (94.8%). The three text types HR, UR and MR reflect how texts were built but for a more detailed analysis of scan paths, some further distinction between HR text is introduced a posteriori in Subsection “Statistical Analysis”.
All the texts were composed of an average of 5.18 ± 0.7 (mean plus or minus standard deviation) sentences and 30.1 ± 2.9 words. The average number of characters of words was 5.34 ± 3.24. For the screen layout, the average number of lines was 5.18 ± 0.68, and the text was displayed with 40.1 ± 5.4 characters per line.
Procedure
The goal of the experiment was to assess as soon as possible during reading whether the text was or not related to a given topic (so called target topic).
First the topic was presented to participants and then they clicked to start the trial. Then a fixation cross was presented on the left of the first character at the first line, to stabilize the eyes’ locations at the beginning of the text. The duration of this step was set at random between 700 and 900 ms to avoid anticipation of the reading start. Participants also did not know whether the text was HR/MR/UR so that they could not plan on a search strategy in advance. The texts were randomly ordered for each participant. When the text was displayed, participants read and had to mouse-click as fast as possible to stop reading and then had to decide during another screen if the text was related or not to the topic. Trials were repeated for the 180 texts with two breaks in-between.
Apparatus
Each text was displayed at the centre of a 24-inch screen with a resolution of 1 024 by 768 pixels. Participants were seated 68 cm in front of the screen. Thus, texts covered in average 21° × 11° of visual angle and each character covered 0.52°of horizontal visual angle, corresponding to about 3.8 characters in fovea. Positions for both eyes on screen were recorded using a remote binocular infrared eye tracker EyeLink 1000 (SR Research) with a sampling rate of 1000Hz. Only positions of the guiding eye were analysed. Saccades and fixations were automatically detected by EyeLink software, based on three different thresholds: a minimum distance of 0.1° from the previous eye position, a minimum velocity of 30 °/s, and a minimum acceleration of 8 000 °/s2. A 9-point calibration was done every sixty trials. A drift correction was performed before each trial. Extra calibrations were performed if the participant was not able to stabilize the eye positions of the fixation cross or if the drift error was too large.
From Eye Fixation to Words and to Reading Strategies
During trials, the eye tracker gave the position of each fixation on the screen, and the fixation duration. The minimum (respectively maximum) fixation duration threshold was set to be 80 ms (respectively 1000 ms). All fixations outside these limits (4.8% in the population of 15 participants) were removed for all analyses. Fixations between lines or outside the text zone were also removed, leading to a removal rate of 0.3% from the initial set of fixations. Finally as each fixation was associated to its outgoing saccade, systematically the last fixation of each trial was not considered (5.4%).
A posteriori it was necessary to know which word was being processed by the participant. First, the word identification span was defined as the necessary area from which a word can be identified. This span varies according to the direction of the reading, the alphabet, or the language, but can also be micro-context related as it was for several reading models such as EZ-Reader (Reichle et al., 2003) or the SWIFT model (
Engbert et al., 2005). For simplicity, we used a fixed span that is considered for most of Latin languages (
Rayner, 1998): an asymmetrical window of 4 characters left and 8 characters right to the fixation, with a 35-pixel height. Moreover, a word may not entirely be located in the word identification span. Based on
Farid and Grainger (
1996), we considered a word to be processed if at least 1/3 of its beginning or 2/3 of its end was inside the window. This result was obviously language sensitive, only valid in French, and considers that the important root of the word necessary to its understanding is located at the beginning of the word. Finally, another hypothesis had to be made on the processed word within the window since several words might be captured. For this, we assumed that only one word could be processed during a given fixation and that this word was chosen as the closest to fixation centre, excluding stop words. Consequently, one word per fixation was selected. Thanks to this data enrichment, features characterizing the reading strategy were defined.
From now throughout the article, the term “saccade” will be referred to the outgoing saccade of a given fixation. Thus finally, data associated with each fixation were the fixation duration, the fixed word, the saccade amplitude expressed in visual degree, the number of crossed words between two saccades and the saccade duration. We use “crossed” instead of “skipped” in this article since in some cases, words were not actually fixed by readers since they could infer these words without fixing them, while “skipped” would rather mean they intentionally ignored the semantic contents of a whole set of words. The saccade as a marker of the reading strategy was characterized by this number of crossed words, which would be negative for a backward progression, null for a refixation or positive for a forward progression.
At a whole text scale, the reading speed is known to be a global marker of the reading (Carver, 1990). At that scale, it was simply measured by how far (in words) a reader can go in a text in how much time. Since our aim was to segment text according the reading strategy, reading speed had to be computed at a finer scale. At the saccade scale, reading speed was computed as the number of crossed words during the saccade plus one (the fixed word during the current fixation) divided by the current fixation duration and the saccade duration. A shortcoming of computing instantaneous speeds at the saccade scale is it large variability, since means are more variable when computed on smaller samples. Thus, computing instantaneous speeds at the scale of one fixation/saccade and averaging them along the whole scanpath is expected to be less robust than dividing the total number of words fixed in a scanpath by its total duration. As a consequence from our hypothesis of various existing reading strategies, we had to compute reading speeds at an intermediate level. Within a given text segment, reading speed was evaluated as the number of crossed words plus the number of not yet fixed words divided by the sum of the fixation durations and saccade durations. For a text, composed of the different segments with different sizes (number of fixations) but with the same reading strategy, reading speed was computed by the ratio of the number of words (fixed and crossed during saccades) summed over all segments divided by the sum of fixation durations and saccade durations over all segments with the same reading strategy. If some word was crossed several times during the same scanpath, it was counted only once in the total number of words.
Statistical Analysis
General Overview
As a preliminary analysis, the effects of text type on different reading characteristics were assessed using regression models. These models included Gaussian subject random effects to assess variability between subjects. Depending on the nature of the dependent variable (continuous, binary, categorical), we used either linear mixed models (LMMs), binomial generalized linear mixed models (BGLMMs) or multinomial generalized linear mixed models (MGLMMs), respectively. Normality of residuals in LMMs was assessed using Shapiro-Wilk normality tests complemented with histograms of empirical residuals. We investigated on the following effects: effects of text type (HR/MR/UR) on number of fixations per scanpath, on fixation durations, on saccade amplitude in degrees, on reading speed and on the number of crossed words (after categorization, leading to a so called
Read mode variable defined hereafter). Significance of fixed effects within a given model was determined by ANOVAs. Model selection regarding fixed effects was achieved by computing BIC for each possible model built from a subset of covariates and their interactions. Model selection regarding fixed effects was achieved by computing BIC for each possible model built from a subset of covariates and their interactions. BIC (
Kass & Raftery, 1995) is composed by the difference between a model complexity term on the one hand, involving the number of model parameters, and on the other hand, some loglikelihood term quantifying the fit between the model and the data. The complexity term can be understood by considering that any model obtained as a generalization of another model necessarily fits any data set at least as well, even if it includes non-relevant effects. Thus, low BIC for a given model indicates a good fit of the data while keeping just relevant effects. We kept the set of covariates and interaction minimising BIC, meaning that the effects of covariates and interactions absent from that model could be ignored, from a statistical point of view. BIC for mixed models was defined as in (
Delattre et al., 2014). Confidence intervals on the standard deviation of random effects were obtained using profile likelihood as described in (
Bates et al., 2014). In the case of MGLMMs, we used DIC instead of BIC (
see Hadfield, 2010).
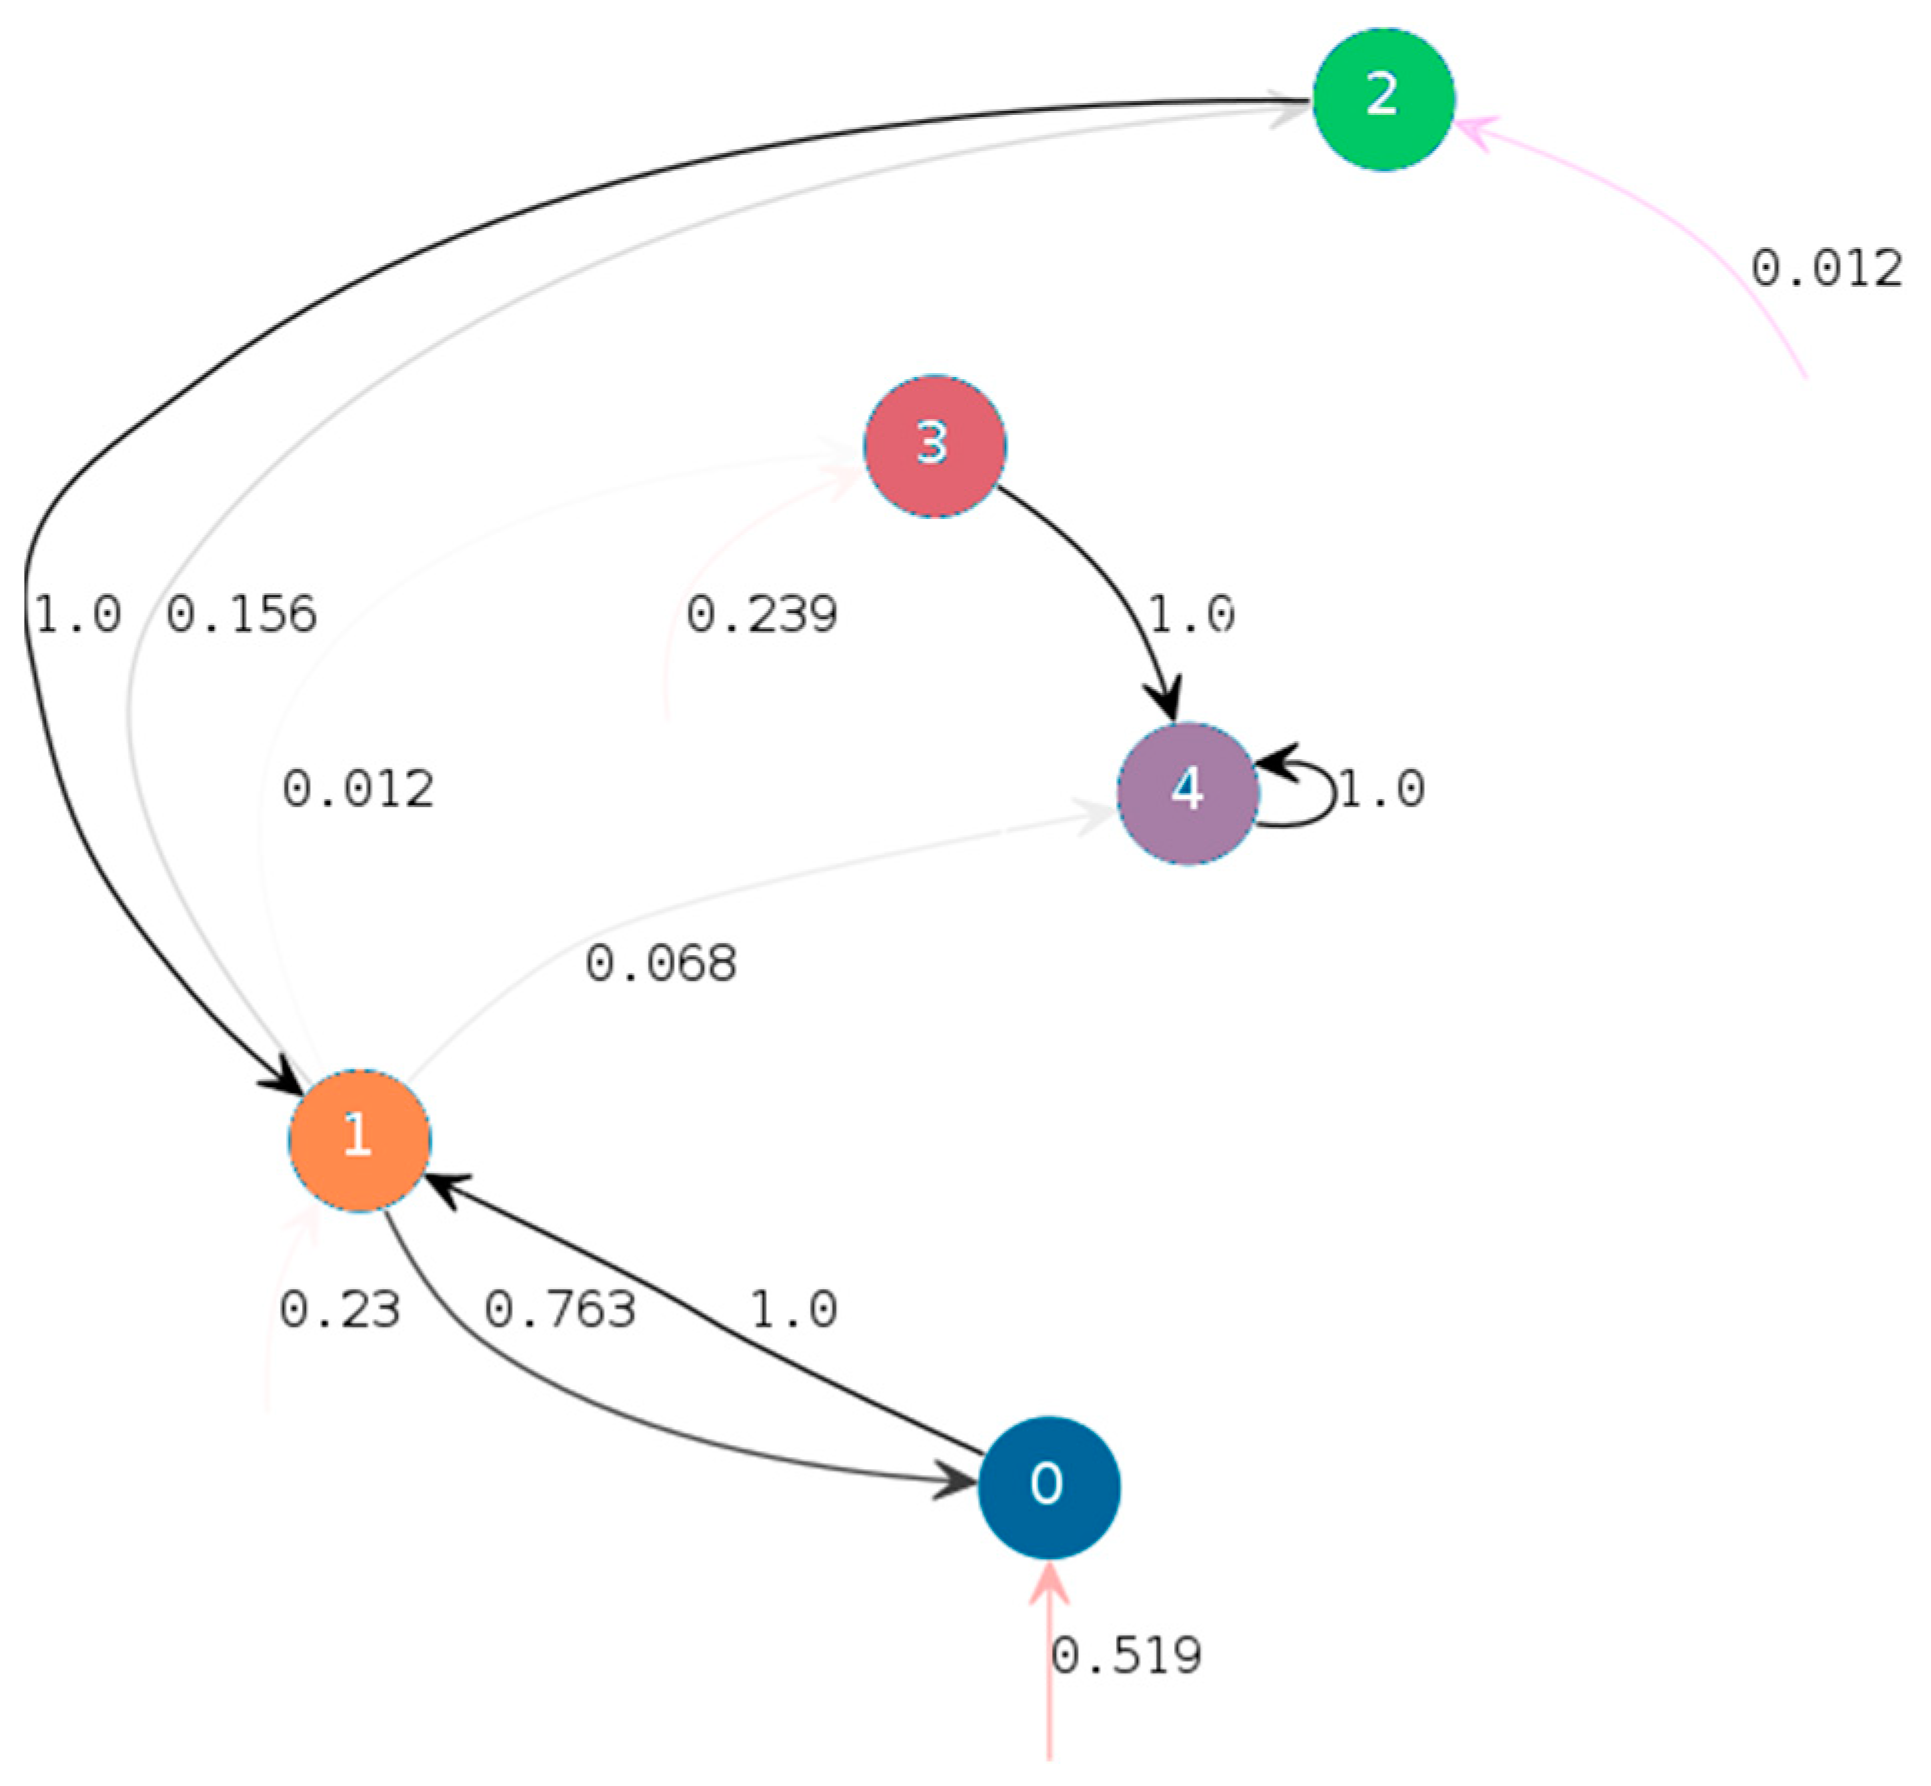
To test the assumption of several reading strategies, we used an approach inspired by (Simola et al., 2008). The principle is to assume that at each time step t (each fixation), a reader follows some reading strategy represented by a state defined by the categorical variable St. We do not observe the strategy explicitly; however switches in strategies can be deduced indirectly from observing the proportions of different types of eye movements that characterize strategies. To achieve this, we considered the number of words crossed in each outgoing saccade and categorised it into five different progression types, yielding a new variable denoted by Xt and referred to as Read mode. Using the number of words crossed in each outgoing saccade makes Xt invariant to changes in text layout, as opposed to saccade amplitudes and directions. Let us define and denote the five categories of Xt as: “Fwd+” if the readers progress to more than one word forward, “Fwd” if they fix the word placed just after the previous word, “Rfx” if they fix the same word again, “Bwd” if they fix the word placed just before the previous word and “Bwd-” if they regress more than one word backward. Using the same strategies along successive fixations leads to statistically homogeneous zones regarding Xt, referred to as segments (constant successive values of states St, St+1, …). The model depends on parameters estimated by maximum likelihood: the proportions of Fwd+, Fwd, Rfx, Bwd and Bwdin each state, the probabilities to switch from current state to each possible state at next fixation (transition matrix) and the distributions of the number of fixations spent in each state (sojourn duration distribution). Interpreting the states as reading strategies relies on these parameters as well as external covariates (related to eye movements or to semantic contents). Segmentation of scanpaths, i.e., identifying successions of a same state, was performed to allow some statistical characterisation of states based on subjects or on external covariates.
The main steps of the HSMC analysis and their goals are summarized hereafter. The first two steps are related to modelling sequences of Read Modes, while the three last steps focus on the connexion between HSMC phases and other variables.
In some cases, we identified that states actually were a fine-scale decomposition of some more macroscopic state, defined as a pattern involving short cycles between the fine-scale states. In this case, states within these cycles were merged into a macroscopic state referred to as “phase” for the sake of interpretability. These phases were related to different reading strategies depending on their interpretation.
To highlight between-participant variability in scanpaths, correspondence analysis (CA) (
Greenacre, 1984) and an independence test were performed on the contingency table defined by the number of fixations in each phase for each subject. CA highlights associations between participants and phases in a graphical way.
The effect of phase on reading speed was assessed using regression models, using the methodology presented at the beginning of Subsection “Statistical Analysis”. We also investigated the effect of text type on phase frequencies and the effect of text semantics on phase transitions (details provided hereafter).
The software used for statistical analysis was VPlants, which is part of the OpenAlea platform (
Pradal et al., 2015), regarding HSMC analyses; the
lmer package of the R software (Venables & Ripley, 2002) regarding LMMs, the
glmer package in R regarding BGLMMs and the
MCMCGlmm package in R (
Hadfield, 2010) regarding MGLMMs.
Effects of Semantics on Transitions Between Phases
To ensure that phases have an interpretation as reading strategies and to investigate their relations with the semantic contents of texts, we assessed the effects of some words on phase transition probabilities. Our assumption was that participants took their decisions by detecting semantically related words to target topics (in HR texts) or incongruent words (in UR texts). This was highlighted by (
Frey et al., 2013) on the same data set, showing that specific patterns arose in electroencephalograms, which could be interpreted as early markers for a positive decision in HR texts and a negative decision in UR texts. It was thus expected that such words triggered phase changes. This was addressed in our work by first detecting these words called “trigger words” and then, assessing the effect of distance to trigger words and of text types, on the probability of phase transitions. Due to the assumption of trigger words, the HR text type was refined, depending if at least one word of the target topic appeared or not in the text. In the positive case, the words that were both in the text and target topic were referred to as “target words” and such texts were referred to as “HR+”. In that case, trigger words necessarily include “target words”. In the negative case, the text did not contain “target words” and its type remained HR. The categorization including HR+ texts was referred to as “extended text type” hereafter.
Trigger words were detected using a FastText representation of words (
Joulin et al., 2017). This consists in embedding words into Euclidean spaces, allowing for computing semantic proximities between words using Euclidean metrics. Trigger words were the two closest words to target topic in HR/HR+ texts. In HR+ texts by definition, at least one word had cosine similarity 1. It was required in HR+ texts that the second closest word had minimal cosine similarity 0.3, otherwise only one “trigger word” was defined. It was required in HR texts that both closest words had minimal cosine similarity 0.3. Indeed, HR texts could have a very progressive semantic progression towards target topic, without clear trigger word. A threshold of 0.3 allowed to exclude these situations: HR scanpaths where all fixed words had cosine similarity less than 0.3 were ignored. In UR texts, trigger words corresponded to the two furthest words to target topic. Finally in MR texts, the two trigger words corresponded to the closest word and to the furthest word to target topic (no required bounds on cosine similarity).
Since HSMC states are random and hidden, the times of transitions are uncertain. Thus, instead of considering transition or not at trigger words, the effect of distance of transitions to trigger words was measured in number of fixations. For each state transition, the distance to closest “trigger word” was considered. Its effect of transition probabilities was assessed using regression models, with a linear assumption on the mapping between distance and frequencies, which was checked a posteriori.
Regarding statistical significance of the effect of distance, since texts were rather short by construction, yielding rather low total number of fixations per text, the effect of small distances increasing transition probabilities could be credited to distances being necessarily small, even if transitions were drawn at random and independently from the positions of “trigger” words. To assess this possible bias, randomized procedures based on permutation tests were used.
Detailed Model Description and Code
A more formal description of the statistical models, estimation or model selection procedures and alternative definitions of
Xt are provided in the Supplementary file. These details and also a discussion regarding the hidden Markov vs. hidden semi-Markov assumption were developed in (
Olivier et al., 2021).
Data and source code used for statistical analyses are available on Inria Gitlab
https://gitlab.inria.fr/statify_public/jemr-ema. The repository contains the analyses performed with Python and R packages in Jupyter notebook format and the Singularity/Docker images required to run them. The data set is also publicly available from Zenodo.org with doi
http://doi.org/10.5281/zenodo.4655840. The experiment was not pre-registered.
Discussion
Our methodology confirmed the importance of modelling phase changes for accurate interpretation of eye movements in loosely-controlled information search tasks. Phase interpretation was supported by contrasted characteristics in terms of sequencing during the task, Read mode frequencies, reading speeds and text semantics, summarized here with text types and trigger words.
Particularly, reading strategies were interpreted in terms of reading speeds using the Read mode variable, which was directly connected to HSMC parameters. It is however interesting to compare reading speeds obtained in each phase to those associated with Carver’s reading “gears” (1990): learning, rauding, scanning and skimming. The mean speed of 304 wpm in NR corresponded to rauding, the speed of 509 wpm in FR was intermediate between skimming and scanning, 263 wpm in SC was intermediate between rauding and learning, while the speeds of 183 wpm in IS was comparable with learning.
Although our study had somewhat different focuses and aims compared to the study by (Simola et al., 2008), the latter addressed related questions with related tools. In particular, the states they obtained could be compared with ours. Their study highlighted three states, which were stable in the three different tasks they considered. Three distinctive HMMs (one for each task, “word search”, “question-answer”, “true interest”) were embedded into a unique discriminative model in order to classify each observed trial, from eye-movement features, into one of the three classes, i.e. one of the three tasks. The model selection based on classification highlighted three hidden states for each model. Those states, called scanning, reading and decision were interpreted on the basis of the distribution of the input observed data, specifically on the fixation durations, saccade amplitudes and saccade directions. In our model, five states gathered into four phases were observed. When comparing the interpretations made by (Simola et al., 2008) and ours, there was a very simple matching between them: scanning could be assimilated with FR, decision with SC and reading with NR, while IS appeared to be more specific to our experiments.
Another significant output of this study was the predominant individual variability, which could be observed at every level of the analysis. Here again, HSMC models led to a precise characterization of this variability in terms of favoured use of contrasted reading strategies depending on each individual, leading to some clustering of the population (reader types): standard, fast and careful readers. Such a characterization of reader types is original, regarding other studies that summarize scan paths to global statistics, mainly: reading speed, saccade amplitude and fixation duration (
Gegenfurtner et al., 2011; Jarodzka et al., 2017;
Siegenthaler et al., 2012). Such studies may aim at using eye-tracking to assess the level of expertise of learners in different reading tasks. In this context, classical statistics do not account for intraor sometime event interscan path variability and a same reading speed could be obtained by using different reading strategies (for example, fast reading combined with slow reading, or just normal reading). Using the notions of phase and transitions could lead to a better characterization and classification of reader types.
In our study, the individual variability was so high that probably, it partially or totally masked the effects of other factors. This is the case regarding the effect of text type on
Read mode. This effect could not be confirmed statistically, which was somehow counter-intuitive given the significance of all individual parameters at level 0.001, particularly regarding overrepresentation of Fwd+ in UR texts. This did not seem either in accordance with empirical distributions depicted in Figure S11 in Supplementary file. Similarly, the effect of distances to trigger words on phase transitions was assessed as moderate by LMMs, while
Figure 6 suggested some strong effect. This could be due to individual variability partly masking this effect.
This suggests, on the one hand, that accounting for individual variability in modelling is of uttermost importance and on the other hand, that some additional participants may have to be involved in the experiment so as to confirm the effects of text type and distance to trigger words on transition probabilities.
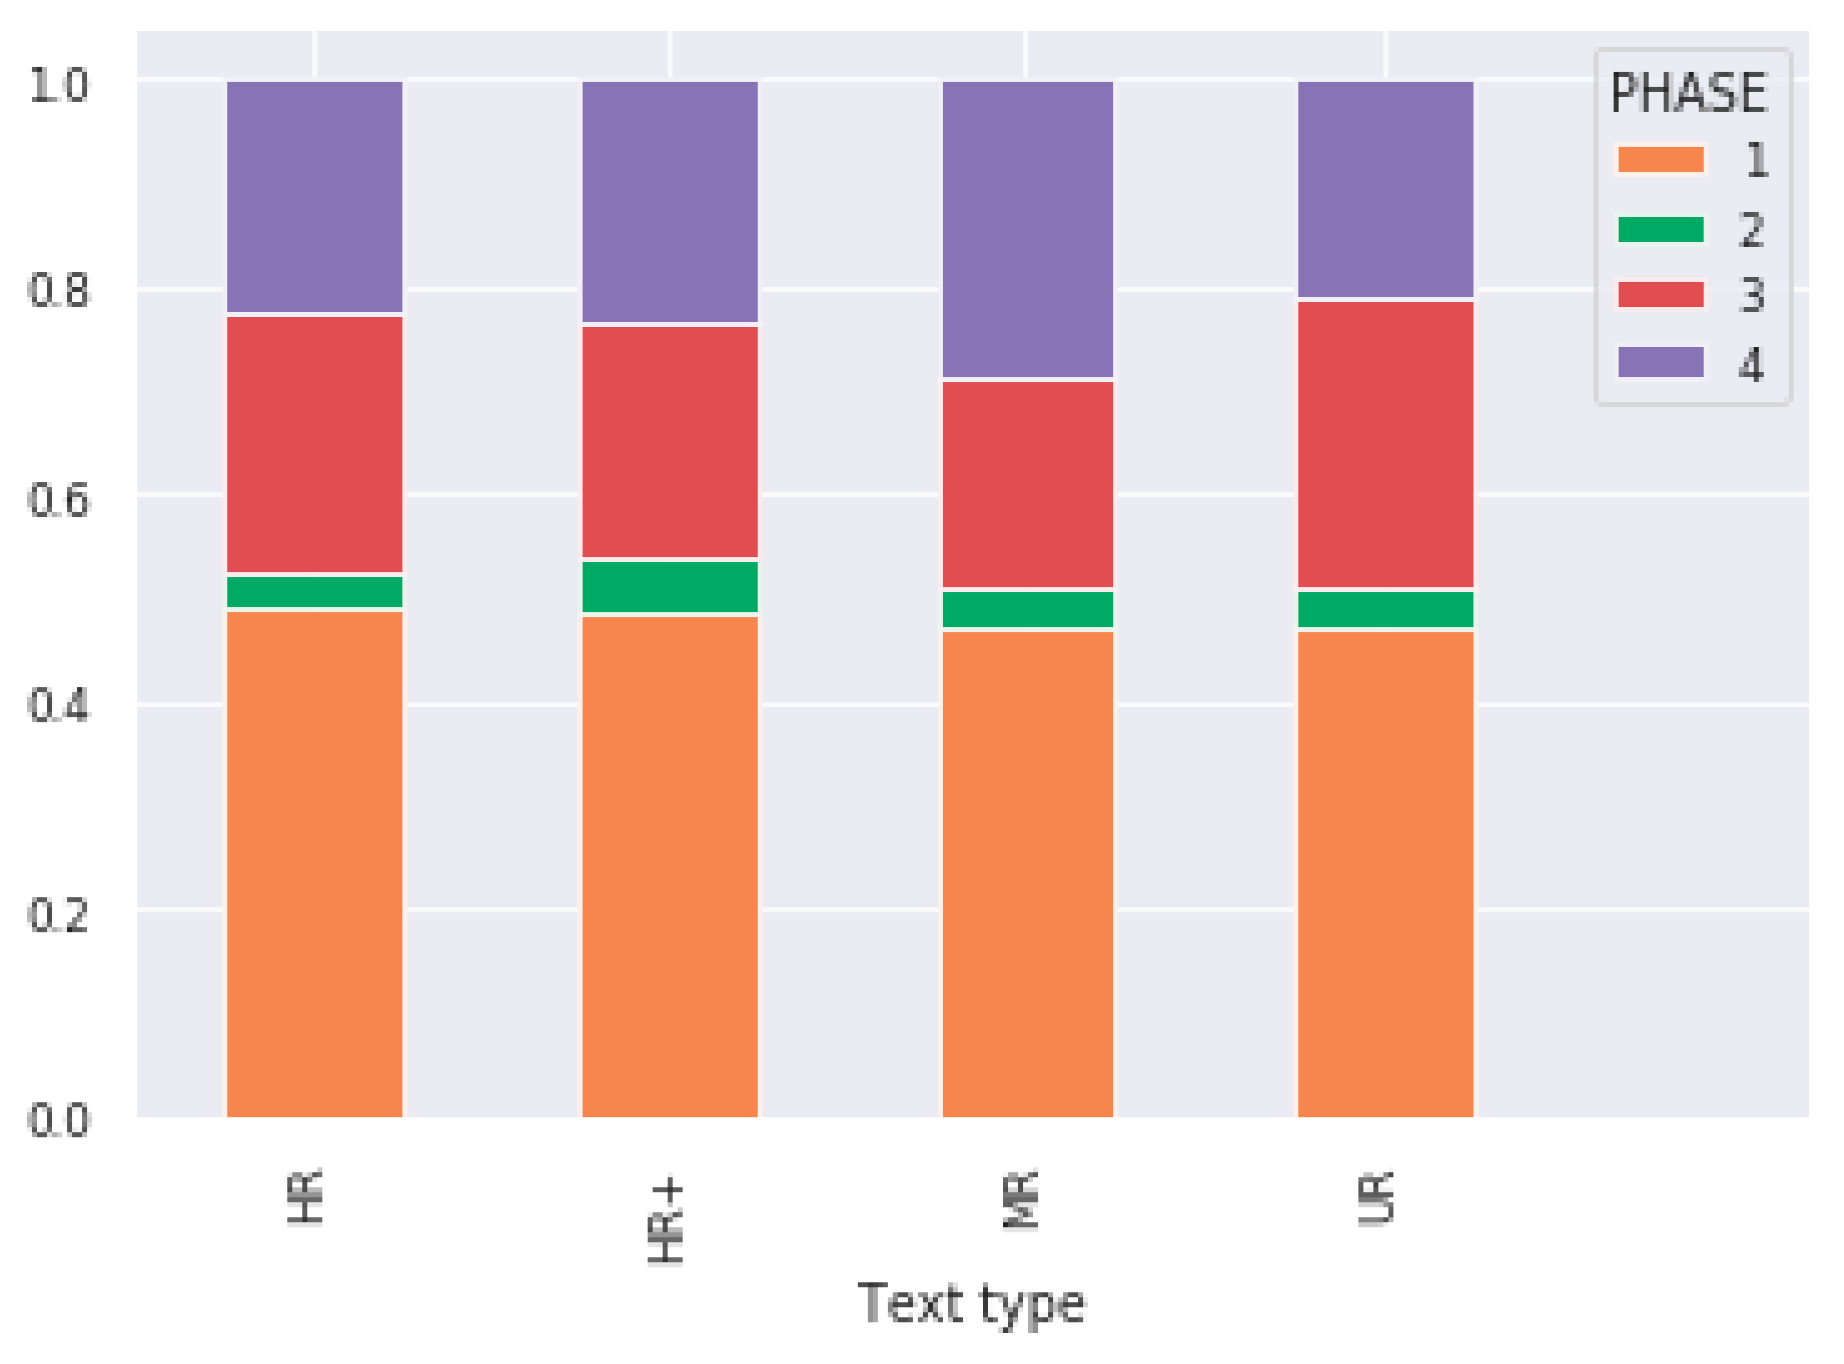
Comparisons between the three text types based on different indicators (reading speed, phase distribution and transitions, effect of trigger words, scanpath lengths) highlighted that UR (unrelated) texts were easy to process (more fast reading FR, less normal reading NR) whereas MR (moderately related) texts were more difficult, as expected (more slow confirmation SC, less FR). The difficulty of HR (highly related) texts was intermediate and no significant difference was found between HR and HR+ texts. In fact, for UR texts, it was less the semantic construction of the text as such that was relevant than the elaboration of the semantic similarity of the text with the displayed topic. This semantic similarity estimated in the LSA space was always very low whatever the scanpaths, because these texts contained words with low frequencies that were unrelated to their target topic. However, for MR texts the semantic construction had to contribute to their comprehension so as to be able to answer regarding the link with the topic. Finally, for HR texts, there was a strong variability in the construction of the semantic link between the topic and the read words, because this link depended on the presence or absence in the text of a word belonging to the topic. As a result, our study showed the possibility to obtain such characterization of the different text types by using just eye movements and a very rough description of the text semantic contents (summarized by distances to trigger words). It also showed that Read mode, despite its very straightforward definition, was sufficiently synthetic to reflect some major effects of interest in reading experiments.
The quantitative results of our study could be used to improve existing reading models such as EZ-Reader or SWIFT. Indeed, these models try to identify, through eye movements, the different phases in the reading process such as overall attention shifting and lexical decoding. Considering the EZ-reader model, there are two main assumptions. The first hypothesis states that attention is allocated serially on one word at a time and that attention is intrinsically linked to lexical processing. The second hypothesis states that eye-movement control and saccade control are decoupled. The model assumes that the lengths and the frequencies of words have a great importance for the lexical steps, from the earlier step, called “familiarity check” to the last step, called “completion of lexical access”. It is well known that the fixation duration on a word is a function of a range of linguistic factors and among these, word length and frequency are lexical variables with a large effect on fixation duration (
Rayner, 1998). For each word of the text, these two variables and the word predictability in the context of the text sentences are the core variables of the model (
Rayner et al., 2004). From these input data, the model will provide for each word, the probability to be fixed and the fixation duration. But to estimate all the parameters of the model from known scanpaths during reading, it is necessary to assume that they come from the same reading strategy in the sense of the Carver’s classification. Let us illustrate this idea for two configuration parameters of the EZ reader model, the minimum duration of the “familarity check” and the “systematic error”. The first one is the fixed part of the estimation of the duration of the “familarity check”. The variable part is indexed on the frequency and the predictibility of the words. It is expected that this minimal duration should depend on the level of comprehension depth induced by readers’ intentions, and also their linguistic expertise or their reading skills (
Blythe & Joseph, 2011). This is also the case for the systematic error parameters determining the probability for eye movements to undershoot or overshoot their intended targets. Therefore, the scanpath segmentations obtained by our approach could be used to calibrate specific parameters in EZ-reader because these segmentations provided homogeneous statistical properties. Both models could then by coupled, so that the HMSC model could trigger parameter switches in EZ-reader when changing reading strategy.
Our approach considered mixed models to characterize the effect of eye-movementor semantic-related covariates on phases. This in an improvement compared to (Simola et al., 2008), whose study, contrarily to ours, did not account for individual variability nor for the effects of semantic covariates. However from a methodological point of view, a possible weakness of our work remained in the separate use of HMSC models on the one hand, and GLMM modelling of the effect of phases including individual effects on the other hand. Indeed, individual variability was highlighted in state dynamics and emission distributions, so ideally, this would have to be accounted for in parameter estimation by maximum likelihood. Inference of state-based parameters based on MAP restoration was likely to cause biases since uncertainty on the state values was not accounted for in post-hoc analyses. In the same spirit, including effects of covariates (e.g., distance to trigger words or type of text in transition probabilities) could be integrated in HMSC models directly, by using GLMMs instead of plain distributions in the transition matrix, state sojourn duration and emission distributions. Inference in such models was studied in particular cases by (
Altman, 2007). Another possibility to account for individual heterogeneity would be to resort to mixtures of HSMMs, but this would lead to some significant increase in the number of model parameters, whereas mixed effect models had tied parameters.
Although we developed some methodology to connect reading phases or strategies to text semantics, the latter was here summarized to two trigger words. The effect of their distance to phase transitions was assessed with LMMs, showing that lines had more negative slopes in UR texts. This suggests that incongruent words appeared to induce immediate changes in reading strategies. They would probably have a strong effect on the decision to stop reading and proceed to the answer, although this has not been assessed here. The slopes in MR texts had intermediate values between those of UR and HR/HR+ texts, suggesting that even the concept of trigger words in MR texts is ill-defined (the notion of MR text being even vague itself): Participants may base their decisions on either incongruent words or words that are related to target topic, to decide how to explore texts. The slopes in HR and HR+ were also negative and could be assessed as different, showing that reading words from the target topic has no stronger effect on strategy changes than reading words only close to the target topic.
Moreover, our analyses did not account for inhomogeneity of the semantic progression within different texts. In some of them, relevant information with respect to target topic was brought linearly while in some others, it was brought abruptly in one or two major steps. Some text clustering could reveal helpful to investigate connections between the dynamics of accumulated information, as quantified by FastText and the use of particular strategies.
Lastly, our approach opens new avenues to jointly analysing eye movements and electroencephalograms (EEGs). This would allow some characterisation of the brain connections that are activated or not in each reading strategy, thus confirming that the phases inferred from the HSMC model have an interpretation in terms of cognitive steps to solve the reading task. From a general point of view, performing analyses based on EEGs only is particularly difficult in free reading tasks. This is partly due to the high level of noise, related to both interand intra-individual variability. Another source of difficulty is the lack of synchronization of different individuals reading the same text using different strategies. Here, eye-movement based segmentation acts as a medium to resynchronize portions of scan paths coming from different individuals and trials. The reason for this is that segments of the same nature, with definite dates of beginning and ending, associated with synchronized EEG signals, may be assumed to have common features due to inherent homogeneity in a given phase. Performing within-segment analyses is thus expected to reduce heterogeneity and to facilitate identification of specific EEG patterns characterizing cognitive steps leading to decisions.


