Fixation Duration and the Learning Process: An Eye Tracking Study with Subtitled Videos
Abstract
:Introduction
Role of average fixation duration in learning process research
Classification of fixation types

Research Questions
- RQ1: Is there empirical evidence to justify the use of average fixation duration for research on learning processes?
- RQ2: Is average fixation duration a necessary and sufficient measure to study learning processes?
- RQ3: Is there an alternative model for the representation of learning processes with fixation durations?
Methods
Participants
Materials
Procedure
Results
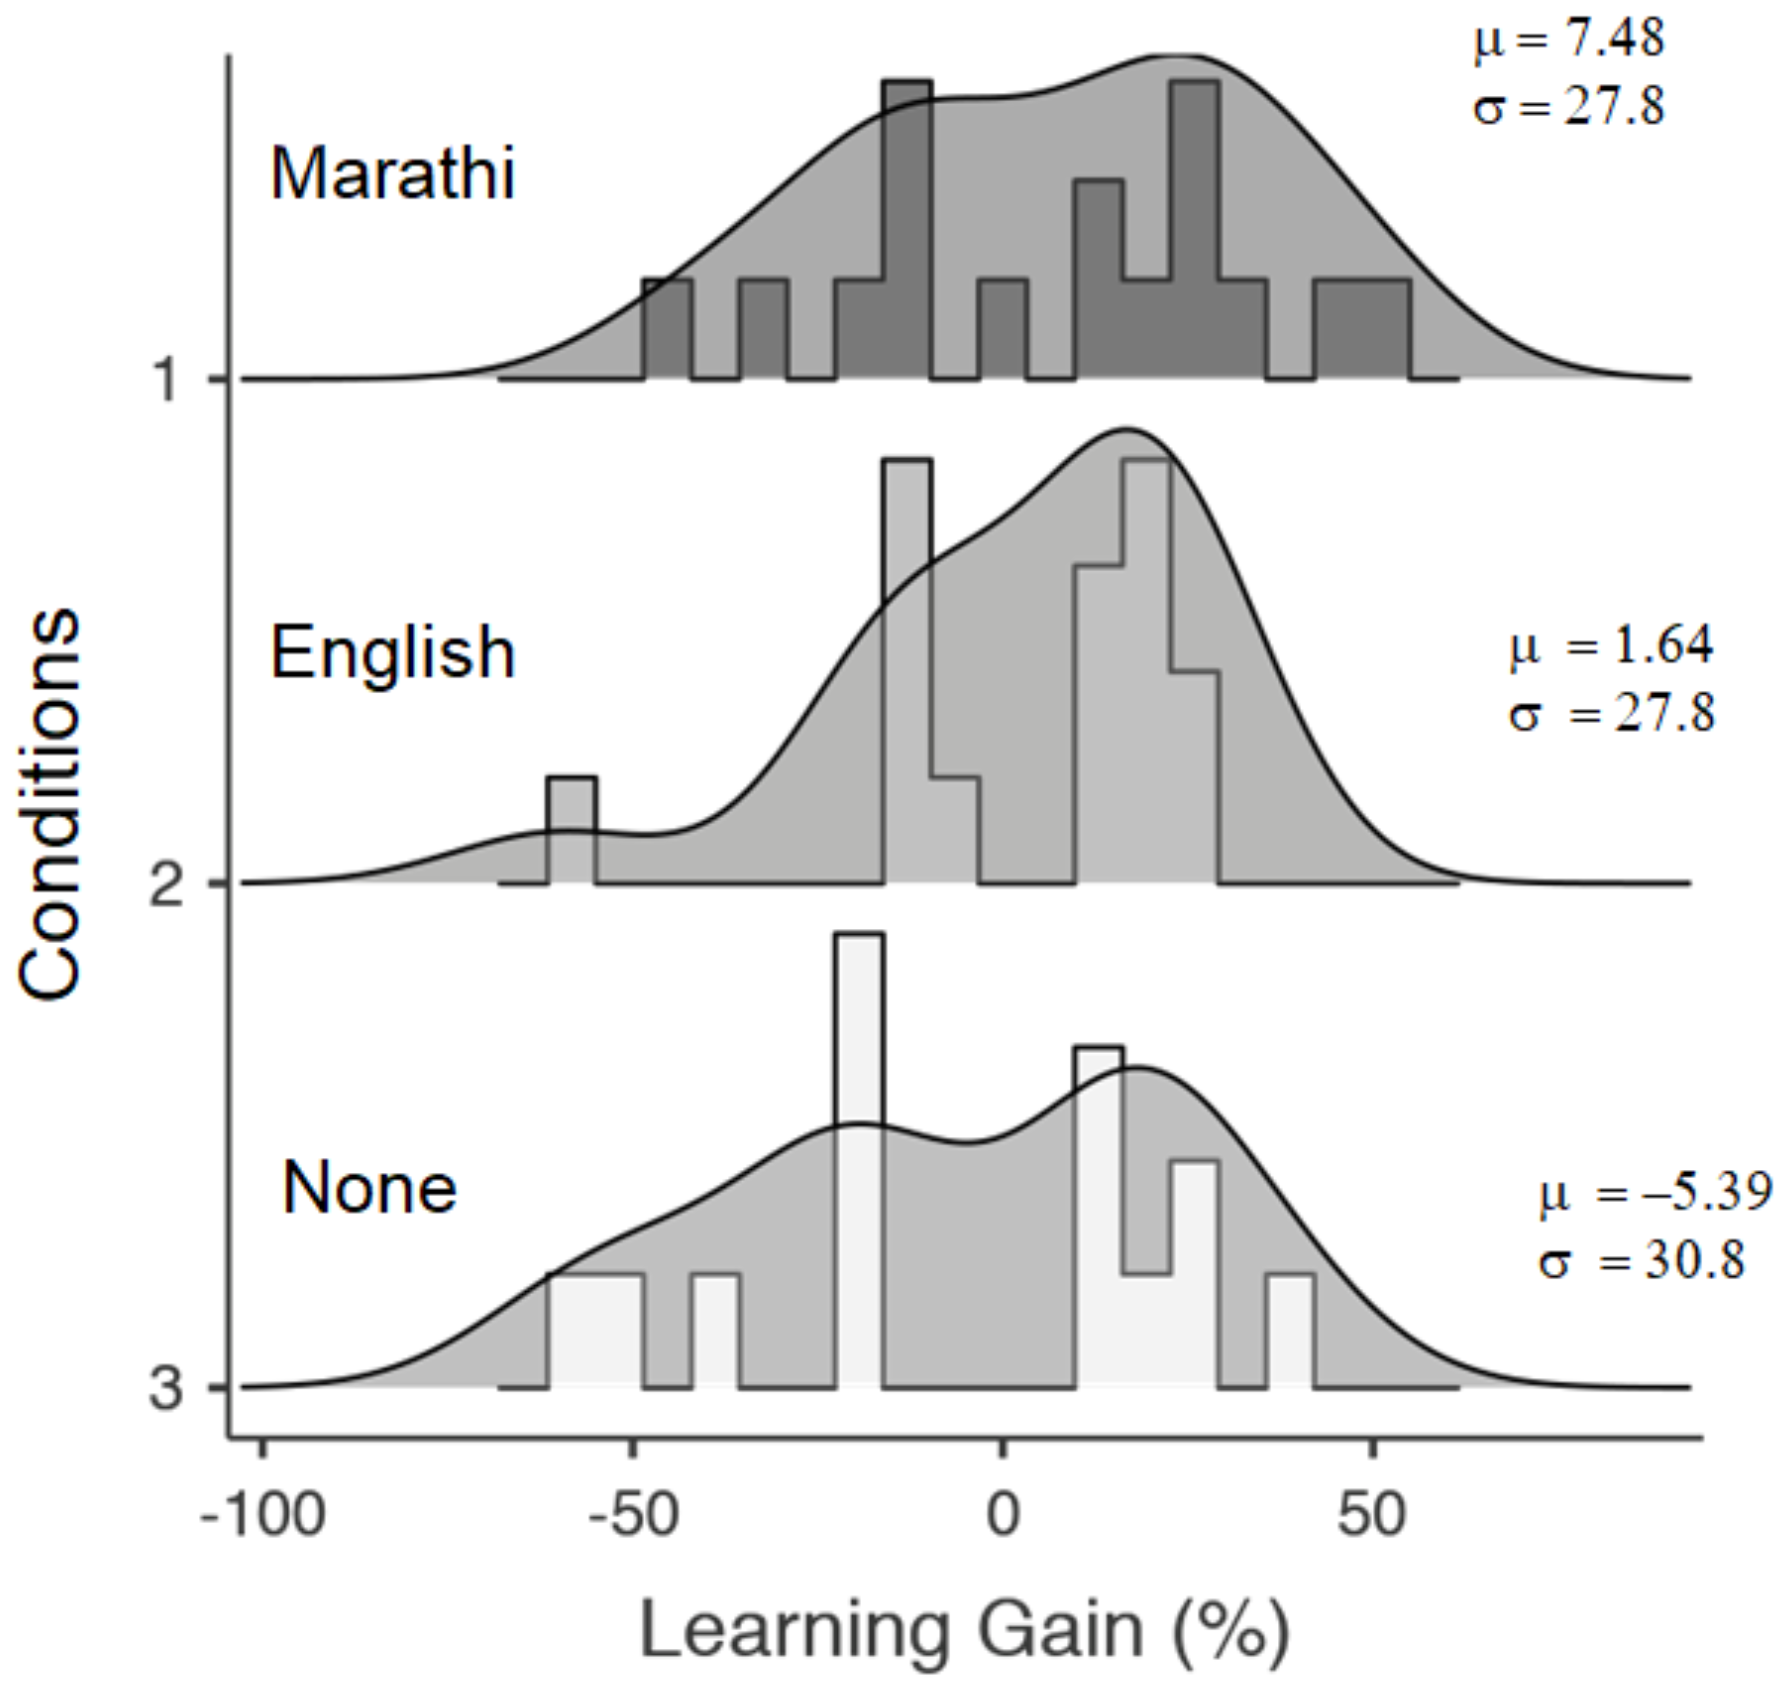
Learning gain
Eye Movement Analysis
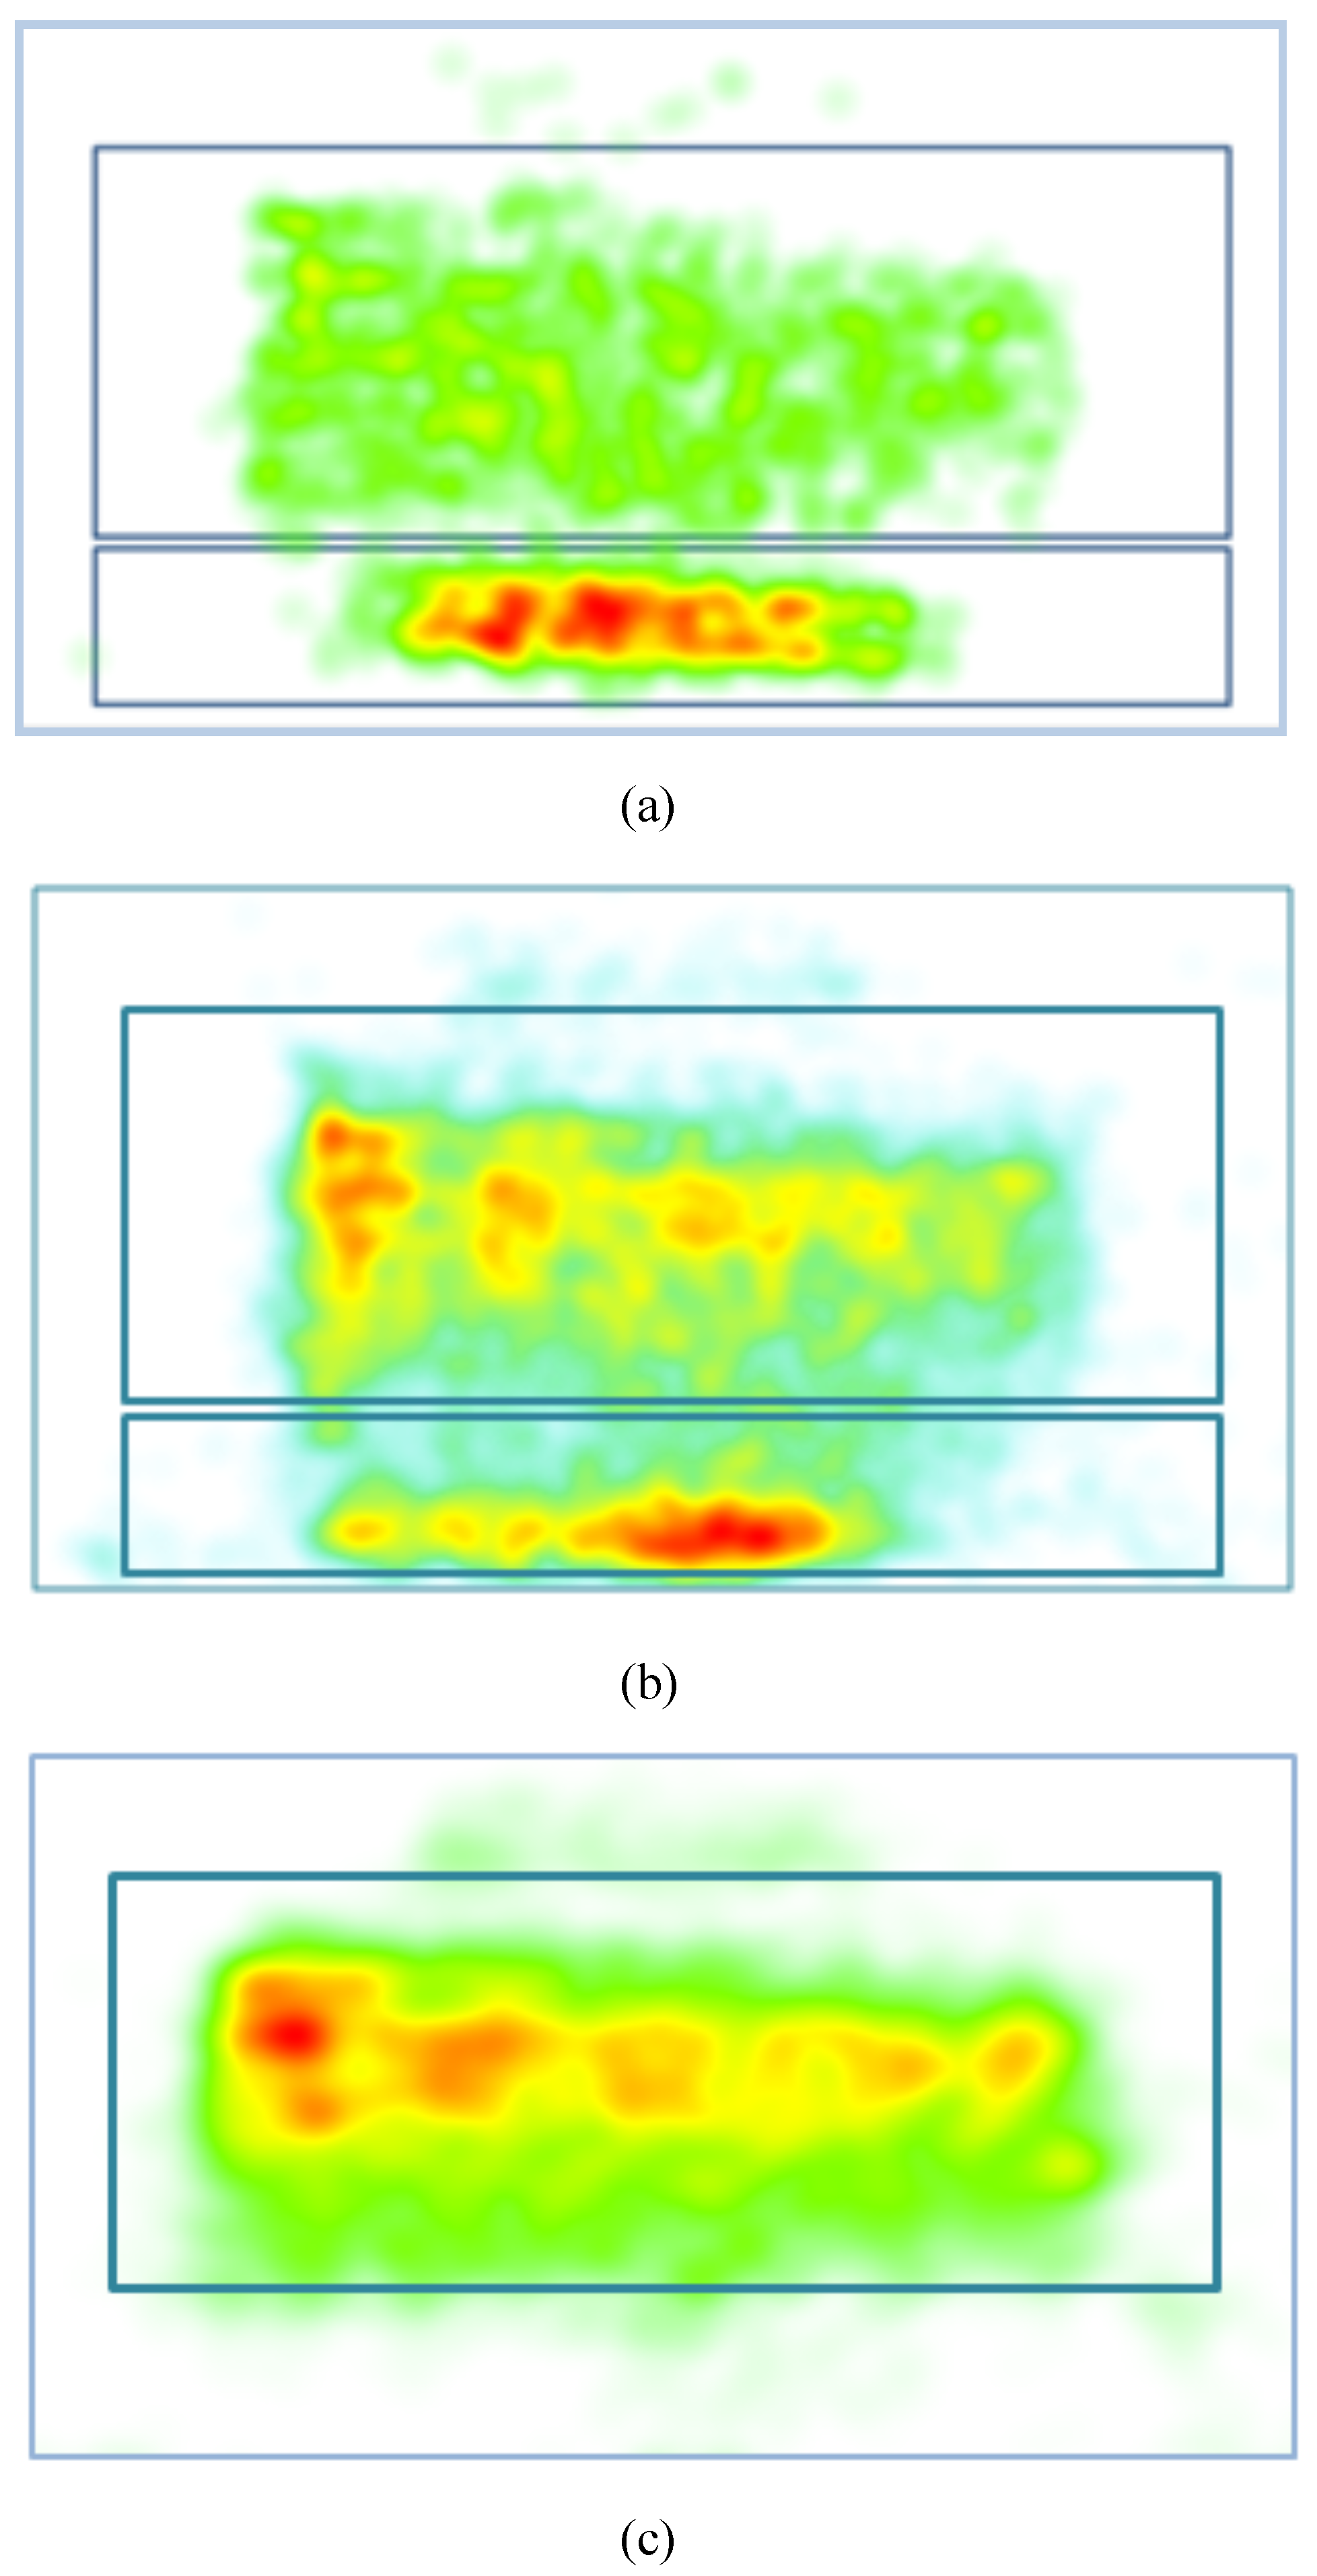
Subtitle
Content

Discussion
- RQ1: Is there empirical evidence to justify the use of fixation durations for research on learning processes?
- RQ2: Is the mean fixation duration a necessary and sufficient measure to study learning processes?
- RQ3: Is there an alternative model for the representation of learning processes with fixation durations?
Limitations
- 1)
- This study only explores a specific learning context. If we attach too much significance to this study alone, we risk making the same mistakes as the studies that do not take into consideration task and domain differences. More studies with a variety of contexts are required to generalize the proposed model.
- 2)
- The boundaries of fixation durations were drawn loosely from literature and based on fixations alone. However, we do not make any claim for the specific numbers to be invariable. Instead, the goal of the article was to suggest a plausible affect-based fixation duration model that can explain variation in test scores.
- 3)
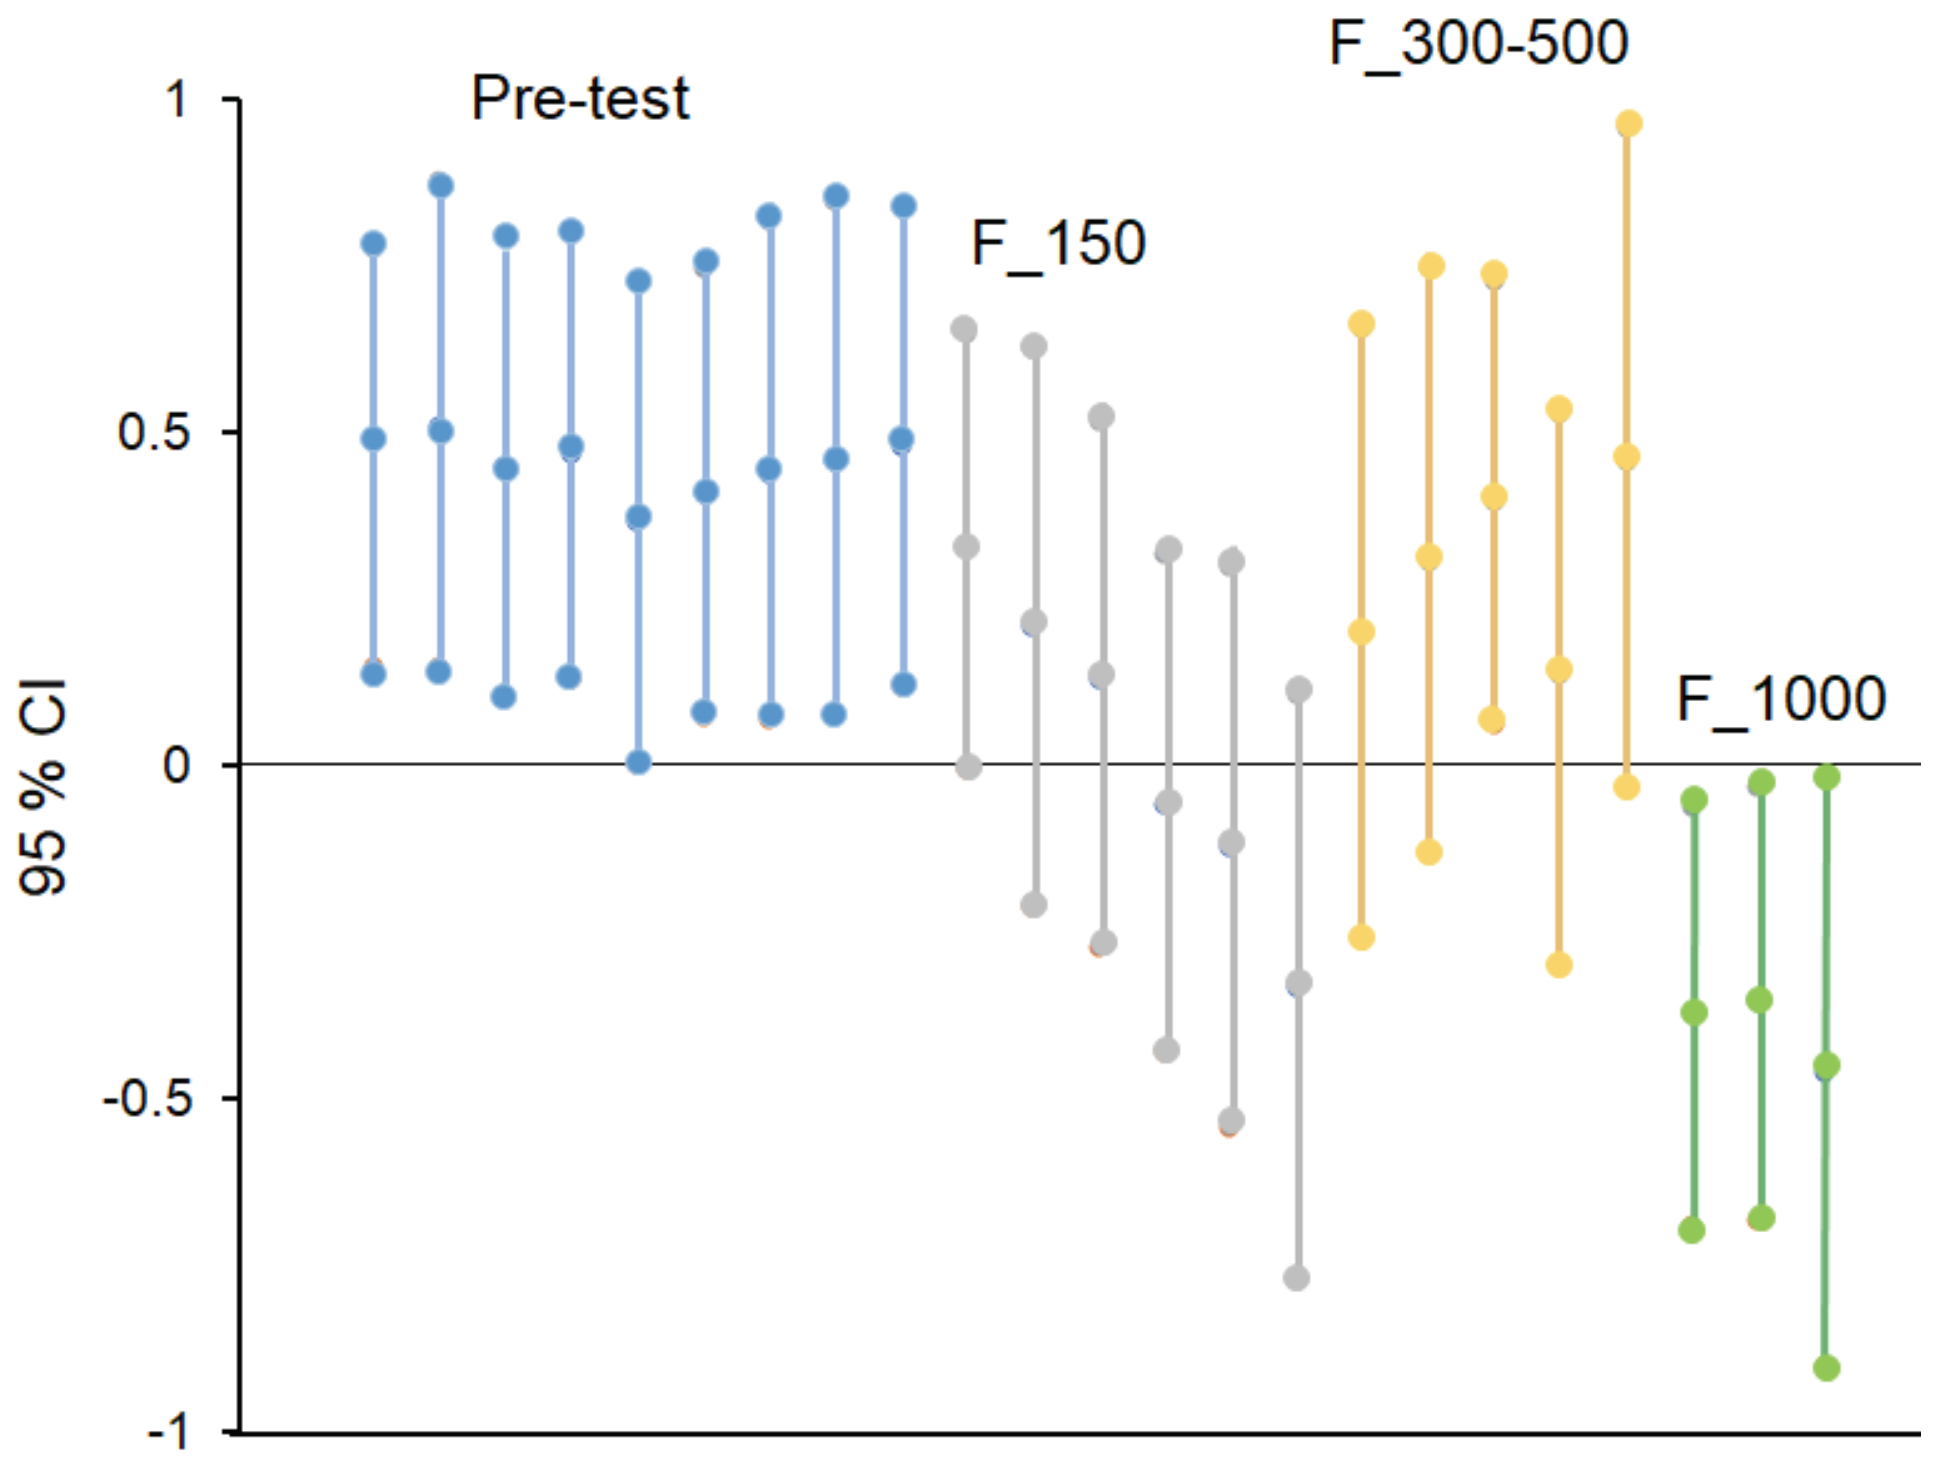
- Finally, we lacked evidence to suggest a truly tripartite model and the boundary at the lower end (between F_150 and F_300-500) seemed to be fuzzy. However, from this one study we cannot also be sure whether the boundary at the upper end (between F_300-500 and F_1000) is as clear-cut as it seems, especially because, in some learning contexts, distraction and interest are likely to be two contrasting affect that can influence such long fixation durations.
- 4)
- The analysis solely employs fixation duration ranges. As outlined in the Introduction, both saccade and fixation have been used to classify fixations into ambient and focal types. Therefore, it is quite conceivable that classifying fixation with information from saccadic eye movement would improve the model results.
Conclusion
Ethics and Conflict of Interest
Acknowledgments
References
- Azevedo, R., M. Taub, and N. V. Mudrick. 2017. Under-standing and reasoning about real-time cognitive, affective, and metacognitive processes to foster self-regulation with advanced learning technologies. [Google Scholar]
- Bahreini, K., R. Nadolski, and W. Westera. 2016. Towards multimodal emotion recognition in e-learning environments. Interactive Learning Environments 24, 3: 590–605. [Google Scholar] [CrossRef]
- Berka, C., D. J. Levendowski, M. N. Lumicao, A. Yau, G. Davis, V. T. Zivkovic, and P. L. Craven. 2007. EEG correlates of task engagement and mental work-load in vigilance, learning, and memory tasks. Aviation, Space, and Environmental Medicine 78, 5: B231–B244. [Google Scholar]
- Bertram, R., L. Helle, J. K. Kaakinen, and E. Svedström. 2013. The effect of expertise on eye movement behaviour in medical image perception. PloS one 8, 6. [Google Scholar] [CrossRef]
- Buswell, G. T. 1935. How people look at pictures: a study of the psychology and perception in art. [Google Scholar]
- Bylinskii, Z., M. A. Borkin, N. W. Kim, H. Pfister, and A. Oliva. 2015. Eye fixation metrics for large scale evaluation and comparison of information visualizations. In Workshop on Eye Tracking and Visualization. Springer, Cham, October, pp. 235–255. [Google Scholar]
- Byrne, M. D., J. R. Anderson, S. Douglass, and M. Matessa. 1999. Eye tracking the visual search of click-down menus. Proceedings of the SIGCHI Conference on Human Factors in Computing Systems; ACM, pp. 402–409. [Google Scholar]
- Chien, K. P., C. Y. Tsai, H. L. Chen, W. H. Chang, and S. Chen. 2015. Learning differences and eye fixation patterns in virtual and physical science laboratories. Computers & Education 82: 191–201. [Google Scholar]
- Ehmke, C., and S. Wilson. 2007. Identifying web usability problems from eye-tracking data. Proceedings of the 21st British HCI Group Annual Conference on People and Computers: HCI…… but Not as We Know It; British Computer Society, Volume 1, pp. 119–128. [Google Scholar]
- Follet, B., O. Le Meur, and T. Baccino. 2011. New In-sights into Ambient and Focal Visual Fixations using an Automatic Classification Algorithm. I-Perception 2, 6: 592–610. [Google Scholar] [CrossRef]
- Gegenfurtner, A., E. Lehtinen, and R. Säljö. 2011. Expertise differences in the comprehension of visualizations: A meta-analysis of eye-tracking research in professional domains. Educational Psychology Review 23, 4: 523–552. [Google Scholar] [CrossRef]
- Glöckner, A., and A. K. Herbold. 2011. An eye-tracking study on information processing in risky decisions: Evidence for compensatory strategies based on automatic processes. Journal of Behavioral Decision Making 24, 1: 71–98. [Google Scholar] [CrossRef]
- Goh, K. N., Y. Y. Chen, F. W. Lai, S. C. Daud, A. Sivaji, and S.-T. Soo. 2013. A comparison of usability testing methods for an e-commerce website: A case study on a Malaysia online gift shop. 2013 10th International Conference on Information Technology: New Generations; IEEE, pp. 143–150. [Google Scholar]
- Goldberg, J. H., and J. I. Helfman. 2010. Comparing information graphics: A critical look at eye tracking. Proceedings of the 3rd BELIV’10 Workshop: BEyond Time and Errors: Novel EvaLuation Methods for Information Visualization; ACM, pp. 71–78. [Google Scholar]
- Granka, L., M. Feusner, and L. Lorigo. 2008. Eye monitoring in online search. In Passive eye monitoring. Springer: pp. 347–372. [Google Scholar]
- Hake, R. R. 1998. Interactive-engagement versus traditional methods: A six-thousand-student survey of mechanics test data for introductory physics courses. American Journal of Physics 66, 1: 64–74. [Google Scholar] [CrossRef]
- Harteis, C., E. M. Kok, and H. Jarodzka. 2018. The journey to proficiency: Exploring new objective methodologies to capture the process of learning and professional development. [Google Scholar]
- Hegarty, M., R. E. Mayer, and C. A. Monk. 1995. Comprehension of arithmetic word problems: A comparison of successful and unsuccessful problem solvers. Journal of Educational Psychology 87, 1: 18. [Google Scholar] [CrossRef]
- Helmert, J. R., M. Joos, S. Pannasch, and B. M. Velichkovsky. 2005. Two visual systems and their eye movements: Evidence from static and dynamic scene perception. In Proceedings of the Annual Meeting of the Cognitive Science Society. Vol. 27, No. 27. [Google Scholar]
- Helo, A., S. Pannasch, L. Sirri, and P. Rämä. 2014. The maturation of eye movement behavior: Scene viewing characteristics in children and adults. Vision research 103: 83–91. [Google Scholar] [CrossRef]
- Holmqvist, K., M. Nyström, R. Andersson, R. Dewhurst, H. Jarodzka, and J. Van de Weijer. 2011. Eye tracking: A comprehensive guide to methods and measures. OUP Oxford. [Google Scholar]
- Just, M. A., and P. A. Carpenter. 1980. A theory of reading: From eye fixations to comprehension. Psychological Review 87, 4: 329. [Google Scholar] [CrossRef]
- Kardan, S., and C. Conati. 2012. Exploring gaze data for determining user learning with an interactive simulation. International Conference on User Modeling, Adaptation, and Personalization; Springer, pp. 126–138. [Google Scholar]
- Kimario, N. D., and E. Kamioka. 2017. Scan Path Based Approach to Detect Learner’s Concentration in Distance Learning System. [Google Scholar]
- Krejtz, I., A. Szarkowska, K. Krejtz, A. Walczak, and A. Du-chowski. 2012. Audio description as an aural guide of children's visual attention: evidence from an eye-tracking study. In Proceedings of the symposium on eye tracking research and applications. March. pp. 99–106. [Google Scholar]
- Krejtz, K., A. Duchowski, I. Krejtz, A. Szarkowska, and A. Kopacz. 2016. Discerning ambient/focal attention with coefficient K. ACM Transactions on Applied Perception (TAP) 13, 3: 1–20. [Google Scholar] [CrossRef]
- Krishna, O., T. Yamasaki, A. Helo, R. Pia, and K. Aizawa. 2017. Developmental changes in ambient and focal visual processing strategies. Electronic Imaging 2017, 14: 224–229. [Google Scholar] [CrossRef]
- Kruger, J. L., E. Hefer, and G. Matthew. 2013. Measuring the impact of subtitles on cognitive load: Eye tracking and dynamic audiovisual texts. In Proceedings of the 2013 Conference on Eye Tracking South Africa. August. pp. 62–66. [Google Scholar]
- Kruger, J.-L., E. Hefer, and G. Matthew. 2014. Attention distribution and cognitive load in a subtitled academic lecture: L1 vs. L2. Journal of Eye Movement Research 7, 5. [Google Scholar] [CrossRef]
- Kutner, M. H., C. J. Nachtsheim, J. Neter, and W. Li. 2005. Applied linear statistical models. New York: McGraw-Hill Irwin: Vol. 5. [Google Scholar]
- Liu, P.-L. 2014. Using eye tracking to understand learners’ reading process through the concept-mapping learning strategy. Computers & Education 78: 237–249. [Google Scholar]
- Love, J., D. Dropmann, and R. J. Selker. 2018. Jamovi (Version 0.9). Jamovi: Amsterdam, Netherlands: Jamovi Project. [Google Scholar]
- McNeal, K. S., J. M. Spry, R. Mitra, and J. L. Tipton. 2014. Measuring student engagement, knowledge, and perceptions of climate change in an introductory environmental geology course. Journal of Geoscience Education 62, 4: 655–667. [Google Scholar] [CrossRef]
- Mitra, R., K. S. McNeal, and H. D. Bondell. 2017. Pupillary response to complex interdependent tasks: A cognitive-load theory perspective. Behavior Research Methods 49, 5: 1905–1919. [Google Scholar] [CrossRef]
- Ozcelik, E., T. Karakus, E. Kursun, and K. Cagiltay. 2009. An eye-tracking study of how color coding affects multimedia learning. Computers & Education 53, 2: 445–453. [Google Scholar]
- Pannasch, S., J. Schulz, and B. M. Velichkovsky. 2011. On the control of visual fixation durations in free viewing of complex images. Attention, Perception, & Psychophysics 73, 4: 1120–1132. [Google Scholar]
- Rayner, K. 1998. Eye movements in reading and information processing: 20 years of research. Psychological Bulletin 124, 3: 372. [Google Scholar] [CrossRef]
- Rayner, K., K. H. Chace, T. J. Slattery, and J. Ashby. 2006. Eye movements as reflections of comprehension processes in reading. Scientific Studies of Reading 10, 3: 241–255. [Google Scholar] [CrossRef]
- Salminen, J., B. J. Jansen, J. An, S.-G. Jung, L. Nielsen, and H. Kwak. 2018. Fixation and Confusion: Investigating Eye-tracking Participants’ Exposure to Information in Personas. Proceedings of the 2018 Conference on Human Information Interaction & Retrieval; ACM, pp. 110–119. [Google Scholar]
- She, H. C., and Y. Z. Chen. 2009. The impact of multimedia effect on science learning: Evidence from eye movements. Computers & Education 53, 4: 1297–1307. [Google Scholar]
- Tsai, M. J., H. T. Hou, M. L. Lai, W. Y. Liu, and F. Y. Yang. 2012. Visual attention for solving multiple-choice science problem: An eye-tracking analysis. Computers & Education 58, 1: 375–385. [Google Scholar]
- Underwood, G., A. Hubbard, and H. Wilkinson. 1990. Eye fixations predict reading comprehension: The relationships between reading skill, reading speed, and visual inspection. Language and Speech 33, 1: 69–81. [Google Scholar] [CrossRef]
- Unema, P. J., S. Pannasch, M. Joos, and B. M. Velichkovsky. 2005. Time course of information processing during scene perception: The relationship between saccade amplitude and fixation duration. Visual cognition 12, 3: 473–494. [Google Scholar] [CrossRef]
- van Asselen, M., J. Sampaio, A. Pina, and M. Castelo-Branco. 2011. Object based implicit contextual learning: A study of eye movements. Attention, Perception, & Psychophysics 73, 2: 297–302. [Google Scholar]
- Velichkovsky, B. M. 1999. From levels of processing to stratification of cognition Converging evidence from three domains of research. Stratification in cognition and consciousness 15: 203. [Google Scholar]
- Velichkovsky, B. M., A. Rothert, M. Kopf, S. M. Dornhöfer, and M. Joos. 2002. Towards an express-diagnostics for level of processing and hazard perception. Transportation Research Part F: Traffic Psychology and Behaviour 5, 2: 145–156. [Google Scholar] [CrossRef]
- Velichkovsky, B. B., M. A. Rumyantsev, and M. A. Morozov. 2014. New Solution to the Midas Touch Problem: Identification of Visual Commands Via Extraction of Focal Fixations. In IHCI. December. pp. 75–82. [Google Scholar]
- Velichkovsky, B. B., N. Khromov, A. Korotin, E. Burnaev, and A. Somov. 2019. Visual Fixations Duration as an Indicator of Skill Level in eSports. In IFIP Conference on Human-Computer Interaction. Springer, Cham, September, pp. 397–405. [Google Scholar]

| Classification Scheme | Context | Ambient | Focal | Reference | Comments |
|---|---|---|---|---|---|
| Fixation duration and saccade amplitude | Static and dynamic scene perception | 90 - 260 ms with Saccade amplitude >5o, Actual range <180 ms | Above 260 -280 ms Saccade amplitude < 5o, Actual range >180 ms | Helmert et al., 2005 | Only 20 - 600 ms range was analyzed. |
| Visual perceptual processing-Dynamic road traffic scenario | 90-300 ms (large scale ambient fixation), long-range saccade amplitude | Above 280-300 ms with short-range saccades amplitude, Attentive processing | Velichkovsky et al., 2002 | Fixations around 200 ms were categorized as ambient and around 400 ms as focal. Fixations <90 ms discarded. | |
| Visual perceptual processing - Complex picture | Relatively long-range saccades, >5o., Short fixations | Relatively short-range saccades, <5o , Long fixations | Pannasch et al., 2011 | ||
| Scene viewing-initial and late viewing phase | <180 ms followed by saccade amplitudes larger than average subsequent saccade | >180 ms followed by saccade amplitudes smaller than average subsequent saccade | Unema et al., 2005 | Only less than 600 ms range was analyzed. | |
| Scene viewing-different age groups | <180 ms followed by large saccades (> 5o) | >180 ms followed by short saccades (< 5o) | Helo et al., 2014 | Fixations less than 90 ms were discarded. | |
| Gaze-controlled interface | 100 - 250 ms z-transformed saccade amplitude <0 | Individual mean fixation duration.(270 - 380 ms) | Velichkovsky et al., 2014 | ||
| Developmental changes in focalambient visual processing | <180 ms followed by large saccades (> 5o) | >180 ms followed by short saccades (< 5o) | Krishna et al., 2017 | Only 20 - 400 ms range was analyzed. | |
| Free scene viewing | Saccade amplitude (Mean = 2.5o) | Saccade amplitude (Mean = 11o ) | Follet et al., 2011 | Only saccade amplitude was used. | |
| Fixation duration | eSports-Pro and immature players | 50 - 150 ms | 300 - 500 ms | Velichkovsky et al., 2019 | |
| Information processing in risky decisions | <250 ms | >500 ms | Glockner et al., 2011 | Also reported 251-500 ms fixations but those were not used to test hypothesis. | |
| Language processing | Mean = 225 ms | Mean = 400 ms, more effortful processing | Rayner, 1998 | Focal range implies more effortful processing. | |
| Information visualization | <200 ms, involuntary processing | 300 - 500 ms | Bylinskii et al., 2015 | Focal processing is referred to as deeper exploration of visual elements. Study also stated that fixations < 300 ms are not encoded in memory. | |
| Memory performance, levels of performance | 120 - 250 msShallow perceptual processing | 250 - 450 msSemantic encodingAlso mentioned 300 -450 ms range | Velichkovsky, 1999 |
| Groups | FDMean | FDMedian | Std Dev | Skewness | Kurtosis | FC(66-150) | FC(300-500) | FC( >1000) |
| ContentAOI | ||||||||
| MS | 330 | 241 | 395.5 | 0.67 | 61.9 | 101682 | 128551 | 11866 |
| ES | 321 | 242 | 345.9 | 0.72 | 92.9 | 112722 | 112915 | 13764 |
| NS | 274 | 208 | 288.4 | 0.80 | 73.9 | 132946 | 63267 | 8984 |
| SubtitleAOI | ||||||||
| MS | 240 | 208 | 158 | 0.61 | 9.0 | 36065 | 79254 | 816 |
| ES | 272 | 183 | 333 | 0.89 | 26.5 | 29605 | 46392 | 1852 |
© 2020 by the authors. This article is licensed under a Creative Commons Attribution 4.0 International License.
Share and Cite
Negi, S.; Mitra, R. Fixation Duration and the Learning Process: An Eye Tracking Study with Subtitled Videos. J. Eye Mov. Res. 2020, 13, 1-15. https://doi.org/10.16910/jemr.13.6.1
Negi S, Mitra R. Fixation Duration and the Learning Process: An Eye Tracking Study with Subtitled Videos. Journal of Eye Movement Research. 2020; 13(6):1-15. https://doi.org/10.16910/jemr.13.6.1
Chicago/Turabian StyleNegi, Shivsevak, and Ritayan Mitra. 2020. "Fixation Duration and the Learning Process: An Eye Tracking Study with Subtitled Videos" Journal of Eye Movement Research 13, no. 6: 1-15. https://doi.org/10.16910/jemr.13.6.1
APA StyleNegi, S., & Mitra, R. (2020). Fixation Duration and the Learning Process: An Eye Tracking Study with Subtitled Videos. Journal of Eye Movement Research, 13(6), 1-15. https://doi.org/10.16910/jemr.13.6.1