Introduction
In an empirical way, Caen memorial-museum
officials noted that, among the artifacts displayed throughout the exhibition
space, the visitors looked at much more images and objects, especially animated
images, than texts. They also confirmed
that the recorded testimonies attract a
lot of attention. However, even though these fixed or animated images could be
emotional attraction materials, it is clear that the visitor, especially when
students, tend to read historical
commentaries more as a means of verifying or confirming and completing what
they learn in class.
In order to understand and evaluate
memorial-museums as vectors of new
learning and/or reinforcements of prior knowledge (Falk
& Dierking, 2000; Falk & Dierking, 2013; Holmes, 2011;
Hooper-Greenhill, 2007; Roschelle, 1995), several methods were used to
quantify the visitor experience. In this context, Packer et al., (2018)
designed and developed an instrument to capture multiple facets of the visitor
experience using a simple and unobtrusive adjective checklist. More precisely,
for the dark tourism, that involves a visit to real or recreated places associated with death, suffering,
misfortune, or the seemingly macabre, Nawijn et al., (2015, 2016, 2018) tried
to capture emotional feelings generated during visit to a concentration camp
memorial site Whereas, other researchers (Biran et
al., 2011; Isaac et al., 2017) worked on the motivation to visit these
dark destinations.
Research based on walk-along method,
focuses on spatial practice, personal biographies and social architecture among
visitors were performed to understand the visitor experience (Skov et al. 2019). The walk-long method
was described as a hybrid between
participant observation and individual interviews (Kusenbach, 2003). Another way to describe the
visitor experience is the focus group (Adams, 1983;
Geissler et al., 2006; Loomis, 1987). This qualitative method takes the
form of in-depth discussions with groups of about eight to twelve participants,
lasting from one to two hours. Focus groups are led by a welltrained discussion
moderator who follows a guideline with topics, questions, probes, and target
timings. Participants are encouraged to stick to the discussion topic but to express whatever is on their minds.
This loosely structured format allows identifying the range of audience
reactions, attitudes, issues, expectations, and perceptions related to the
topic.
These tools provide quantitative or
qualitative understanding of the visit meaning, but they do not provide an
understanding of what exactly happens
when the visitor
is looking at the work or image in the dialectical interaction between
visitor and objects or images seen during the visit.
In fact, when facing an object, eye
movements can be of different types: fixations (when the eyes are relatively
motionless), pursuits (when the eyes follow a moving target) or saccades (rapid
movements between fixations). Some studies suggest that fixations and saccades
indicate how people acquire information (Henderson et
al., 2016; Martinez-Conde et al., 2004). Specifically, saccades may
indicate the emotional state of the participants when they evocated emotional
autobiographical memories, (El Haj et al. 2017).
Furthermore, participants of Nummenmaa et al., (2009) study, performed vertical
reflexive saccades that were orthogonal to the emotional-neutral picture
locations. Saccade endpoints and trajectories deviated away from the visual
field in which the emotional scenes were presented.
To quantify these visual interactions, some
studies have focused on the observation of visitors and the calculus of Viewing
Time (VT). Smith and Smith (2001) manually
timed this VT on six paintings in the permanent collection of the Metropolitan
Museum of Art in New York, which contains more than a million objects.
The introduction of the eye-tracking in the museum
studies (Batcha, et al, 2012; Brieber et al., 2014; Filippini-Fantoni,
et al., 2013; Buquet et al., 1988; Heidenreich & Turano's, 2011; Milekic,
2003; Mayr, et al., 2009; Milekic, 2010; Rainoldi et al. 2018; Santini et al.
2018; Schwan et al. 2019) made the calculus of VT and saccades much more
precise.
However, despite all the clarifications
that eye-tracking can provide a verbalization of visitors' thoughts, called
also a retrospective (Eghbal-Azar & Widlok, 2012), could shed light on the true behavior of
these visitors and avoid over-interpretation of these eye movements.
To perform our study, we used a hybrid method that
combines eye-tracking and focus groups.
The aim of our work is to evaluate the potential of the
mobile eye-tracking to quantify the visitors experience and behaviors of student’s group through their
visit of the "Genocide and mass violence" area of the Caen memorial-museum. In addition, focus groups
were held before and after the visit to provide additional keys to analyze eye tracking data. Precisely, the
correspondence between the typical behaviors
detected by eye-tracking and the two forms of
learning: assimilation and accommodation. Our approach will provide answers to
some of the major questions raised by the visit to memorials, such as the time
actually spent on the different
items, what is actually
looked at in the item in question, possible typical behaviors that therefore go beyond the visitor's individuality, and the preferred itineraries in the routes at different scales.
Methods
Participants
Seventeen students (age range = 17-18
years; Males/Females = 4/13) were recruited. Thirteen participants were senior high school literary
students and 4 were
senior high school science students. Participants came from two different
schools, one located in the city centre of Caen (Lycée Victor Hugo), the other
in Honfleur (Lycée Albert-Sorel). In French high school, the Second World War
is studied during the second to penultimate year («Première») in an
a-chronological order that has long surprised historians and will be questioned
in the new curricula. Indeed, the two World Wars are taught first, then is totalitarianism (Nazism and Stalinism), while it was not until the end of the school year that France
in the dark years, especially the collaborating French state based in Vichy,
was treated. The 17 participants in our panel were in their final year of high
school, where the beginning of the year is devoted to the study of the memory
of Vichy. To prepare for the visit to the memorial-museum, the teachers presented
extracts from television
news reports on the commemorations of the Velodrome d'Hiver Rafle in 1992 and
1995, in the presence for the first
time of the President of the Republic, François Mitterrand in 1992, and of his successor Jacques Chirac in 1995. In a speech that
had a great impact, Jacques Chirac insisted on the responsibility of France at
a State level and not only of a sum of individual collaborators in the
deportation of Jews. It was the first time this was said at the level of a
President of the Republic.
Thevisit scenario
andRegions of Interest.
Since its opening, the Caen memorial
(400,000 visitors per year on average) is mainly dedicated
to the history of the Second World War since its opening (1988). It is
the most visited museum about Second World
War in France, and is regularly updated to take account of advances in
historiography.
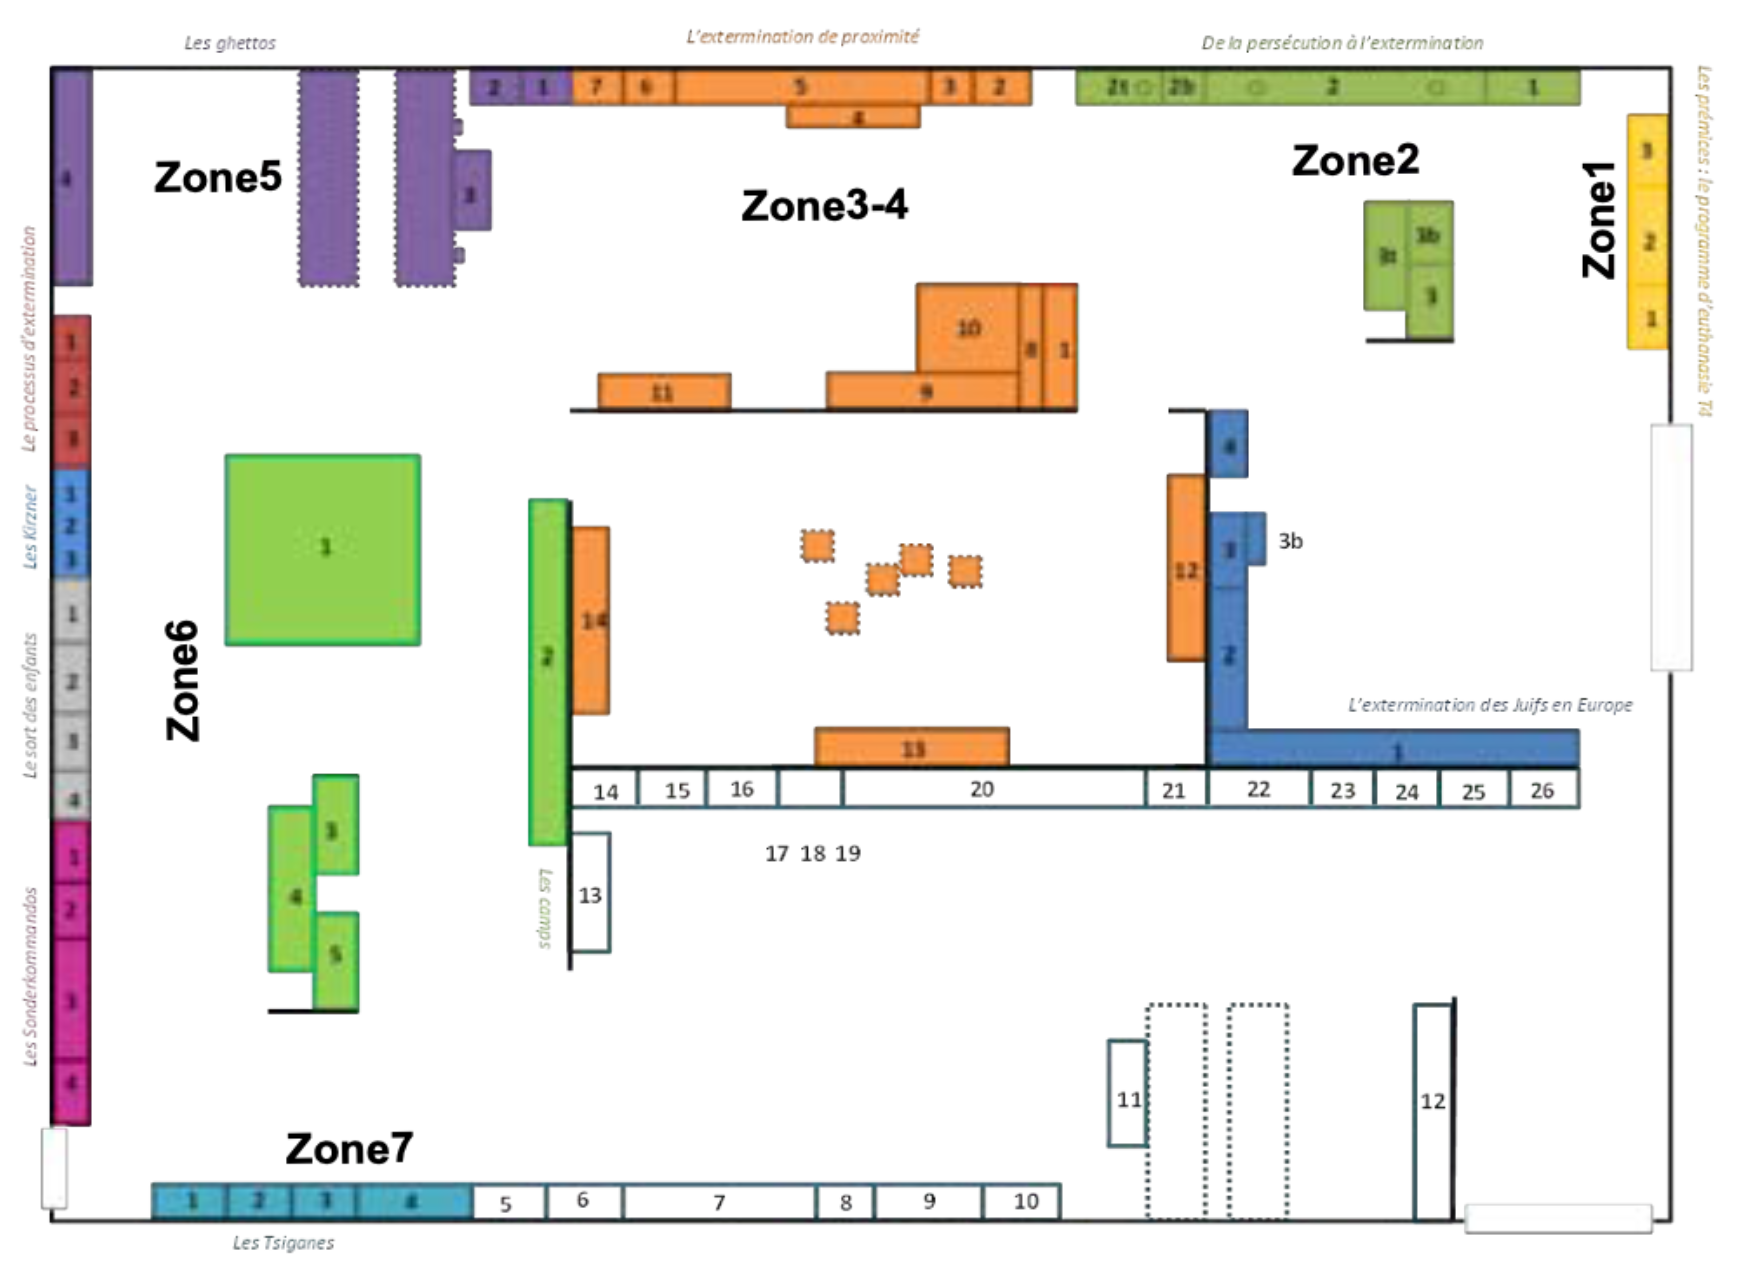
The room devoted
to "Genocide and mass violence" is the most important in
the "World War, Total War" area. Covering some 400 m2 in
total, the room evokes the massacres
that took place between 1937 and 1945 in Europe and Asia.
The reference route begins after the
introductory sequence called "The extermination of the Jews in
Europe" on the map. The sequence mainly shows
Hitler's speech of January 30, 1939, where he announces that in the event of a new world war, the
Jews would be exterminated. The space is divided into 7
thematic areas (see details of the objects
and pictures exhibited
in Supplementary Material
"SM1").
- -
Zone 1: "The first steps: the T4 euthanasia program" for the mentally ill. In yellow on the map, there is an introductory text that provides the historical content, as well as a photograph and a poster.
- -
Zone 2: "From persecution to extermination". Dark green on the map is devoted to the various forms of humiliation, stigmatization and exclusion of Jews before their deportation and extermination.
- -
Zones 3-4: "The extermination of proximity" is devoted to the so-called "Holocaust by bullets" in the territories of Eastern Europe, accompanying the German offensive against the Soviet Union. It is a very specific space of the memorial: images, objects and testimonies provided by Father Patrick Desbois and his association Yahad-in-Unum present at length a policy of extermination that the general public is not familiar with.
- -
Zone 5: In purple on the map, the area concerning “ghettos” is located in a corner of the exhibition. Two videos are proposed to the eye, they are accompanied by a short cartel.
- -
Zone 6: "Killing centers". Of different colors on the map, it has been divided into 5 sub-zones. 1. The extermination process. 2. The Kirzners. 3. The fate of the children. 4. The Sonderkommandos. 5. The camps
- -
Zone 7: "Gypsies". In emerald green on the map, it shows the fate of the Gypsies in the Reich. Again, this is a subject that is hardly ever found in the museums of Europe devoted to the Second World War or in school curricula.
The designers conceived the exhibition so
that, even without visible limits in space, the visitors go from one area to
another in the order presented here.
An introductory panel is positioned at the
beginning of each area, placed
against the wall. The white writing on
a black background singularizes it and thus indicates, each time, a historical
presentation of the subject. The exhibits objects, or images, are accompanied
by cartels that are generally located below or to their side. The written
testimonies are presented in white letters on a red background. Finally, it
should be noted that the space is uniform, with free circulation, without
constraints, with no steps or ascents or descents that could mark a break
between the zones.
Design
In this study, three primary data were
provided. We extracted fixations’ coordinates as well as their start and end time from the eye tracking data. We
consider the third primary data to be
the verbatim extracted from focus groups that were held before and after the
visit.
The first variable that we presented was
the viewing time (VT). In the Figure 2 we
presented averages with standard deviations.
From the fixations' coordinates and their
order, we reconstructed local trajectories in one "ROI", then we mapped:
- -
all the gaze path of participants for the drawing image of "oven"
- -
an example of the gaze path of one participant named (E11), over the letter of a Waffen SS.
For global trajectory through several
"ROIs", we presented two examples, the wall of photographs (second
zone) and the photographs of the Mizosz massacre. From the first example, we
provided also the denser paths and saccades.
Finally,
with the extracted
verbatim, we calculated the number of occurrences of each term from the transcripts of
the focus groups.
Materials
Eye-tracking.
The 17 students all wore double-focus
glasses of the ASL brand (version 2.02), from Imotions company (Human Behavior
Research). We choose this device because it is non-intrusive. It does not
require electronic sensors to be
placed in the paths at the four corners of each item or, in the form of a bar,
underneath the series over two or three meters. The memorial-museum where our
study was carried out is very attached to the aesthetic constraint of the device.
Moreover, thanks to the ASL Results+ GM
program, we were able to get the coordinates of the fixing points and the
durations.
ASL detection of fixation and saccades
According to the ASL MANUAL VERSION 2.02 (2011), the fixation algorithm derives
from work done by Lambert et al., (1974), and further developed by Flagg (1977) and Karsh
& Breitenbach (1983). It has been further developed at ASL over the years. The method falls
in the category that Duchowski (2003)
labels “dwell-time fixation detection”.
Based on the minimum time needed by the
nervous system to process visual information meaningfully, and therefore the shortest sensible
“snapshot”, the first studies
range the shortest latencies between 100 ms
and 300 ms (Alpern, 1969; Yarbus, 1967; Young, 1970). Looking
at more recent data, saccadic
latencies seem rarely
to be less than 150 ms
under most conditions, and are more typically
over 200 ms, but “express
saccades” can have latencies
as short as 90 to 120 ms when the
old fixation target disappears before the new target appears, or if the new
targets are predictable (Darrien et al., 2011;
Fischer & Ramsperger, 1984).
The default “minimum” in the ASL fixation
program is 100ms. Note that if the data is collected at 60 fields per second,
it corresponds to 7 samples. The 1-degree minimum change in gaze position
required to define a new fixation is based, loosely, on the fact that miniature
eye movements (tremor, drift, and micro-saccades) are generally smaller than 1
degree.
Visual
angle computations
To retrieve the eye-tracking results
in the form of fixation times and coordinates on a
fixation plane, we therefore used ASL Results Plus GM analysis software.
According to the ASL Manual, all fixation
criteria are defined in degrees of visual angle, i.e. how much eye turns
between measured points of gaze. Therefore, we needed to translate point of
gaze data expressed in eye tracker units (remote optics) or real distance units
on a surface (head-mounted optics with EyeHead Integration) to degrees.
If we assume that lines of gaze are more or
less perpendicular to the surface (within about 20 degrees), visual angle A
between two points is defined by the equation:
where D is the distance between the points,
and S is the distance from the eye to the scene plane.
In order to avoid time consuming
calculation of tan -1 we use the
fact that for fixation analysis we are only interested in small eye movements
and we use the small angle approximation:
where A is expressed in radians.
There are 180/pi (=57.2958)
radians per degree. Combining the two equations and translating radians to
degrees we get the equation that the analysis program uses to calculate visual
angles:
where A is the visual angle in degrees, between two points separated by distance D, at a distance S from the eye.
The analysis program takes the difference between points of gaze coordinates and divides by the user specified constant labeled “Eye tracker units/degree”. The default value is 10, which is roughly typical for a table-mounted up.
Focus groups:
The aim of the focus group was to highlight the way these young people consider the Holocaust: their appropriation of ideas, the negotiations to develop them, their points of agreement or disagreement, the sometimes mutual incomprehension, which leads group members to accept or refuse such or such argument.
The project did not seek to verify the academic knowledge of the young people, but rather their capacity to understand debate and invest the subject with their own values and emotions.
During the focus groups (before and after the visit), the questions asked dealt with the following themes:
the study of the variety of opinions and feelings of the actors on a given subject,
- -
highlighting differences in perspective between groups of individuals,
- -
understanding of the results of school learning and possibly how students viewed the course on the Holocaust the appropriation of historical knowledge in a museum.
The sessions lasted from 55 to 70 minutes maximum. Both groups were interviewed in their respective schools before the visit and then in a room provided by the Memorial at the end of the visit.
The focus groups took place without the presence of teachers from the school. The sessions were recorded and transcribed manually afterwards.
Statistical strategy
As already mentioned, the software that comes with the ASL eye-tracking glasses allows to obtain, upstream of the heatmaps and graphs built by the tool itself, the coordinates of the fixations and the fixing time of each coordinate. For the sake of accuracy and verification and to complete the results, we have recalculated all the histograms and eye trajectories for each participant and for each region of interest (ROI).
From these calculations we were first able to obtain clusters from the fixations, so that we could calculate the exact gaze duration on each element within a region of interest. We were then able to reconstruct trajectories that connect several regions of interest. This was extremely important in so far as it enabled us to follow the gaze as it travelled across a significantly large area.
All of the scientific calculations performed were developed using the R cran programming language (R Development Core Team (2005)).
Trajectory density detection algorithm:
To perform common sub part of gaze trajectories obtained from all 17 participants, we used a TRAjectory CLUStering algorithm TRACLUS (
Lee et al., 2007). This algorithm has two phases: partitioning and grouping. The first phase is based on the trajectory partitioning algorithm using the minimum description length (MDL) principle. The second phase of algorithm uses a density-based line-segment clustering algorithm. We used the pythonprogrammed version of this algorithm, which is deposited in github (
https://github.com/apolcyn).
Text-mining on focus groups:
In order to analyze more precisely the focus groups performed before and after the visit, and transcribed manually, we used the lexical extraction capabilities of the Natural Language Toolkit (NLTK) library in python ((Loper & Bird 2002). The NLTK is a suite of open source program modules, tutorials and program sets, which covers symbolic and statistical processing of natural language and is interfaced to annotated corpora.
Procedure
Our study, which took place in the "Genocide and mass violence" room of the Caen memorial-museum, was carried out in the following stages:
The students watched two extracts from television news reports on the commemorations of the Velodrome d'Hiver Rafle in 1992 and 1995, in the presence for the first time of the President of the Republic, François Mitterrand in 1992, and of his successor Jacques Chirac in 1995.
focus groups were held in the classrooms of the two schools of the participants, without the presence of their teachers.
the 17 participants wore the ASL glasses during a visit of the space under study.
At the end of the visit, focus groups were held in the memorial-museum, without the presence of the teachers.
The data were retrieved from the ASL computer and processed later in the laboratory.
Results
In this work, we relied mainly on eye tracking data. The verbatim of the focus groups provided clarification on the results obtained, but the main point of this article is to present the results of the eye tracking analysis.
From the eye-tracking data, we were able to obtain several types of results ranging from the global quantification of the time spent in each area of the visit space to the time spent in front of each Region of Interest (ROI) by each participant. The same data allowed us to reconstruct the trajectory of each participant's gaze in front of a region of interest and/or a set of regions of interest.
1. Viewing time (VT)
One of our first results is the average time spent in the space by our participants: namely 20'14''. Students spent on average 3'93 in the introductory part and moving around in the space between the zones. Our analysis focuses on the time spent on the different zones on the map. Eleven students spent less than 20'14 in our observation zone and 6 more than 20'14. The visit of four students lasted longer than 30 minutes. This average visiting time is higher than what the museum identifies as the « usual time » for adults in the observed space (15 minutes).
None of the students looked at all of the exhibits in each zone, and only "The Wall of Photographs" in Zone 2 was looked at by all 17 students.
1.1. Quantification of time spent in front of each region of interest
The region of interest (ROI) can be an image, an object or a text, which is not without consequence on the time spent in front of each one. One may imagine that a text calls for a longer time of attention than an object or an image. Yet, museum officials have long observed that visitors spend less time on the historical commentary than on the image, the object or the moving image – an attitude that could be linked to the fact visitors to memorials think they already know the content of the commentary.
As shown in
Figure 2, the average time spent in front of the ROI of each area varies between 0.2 and 29 seconds. The standard deviation is very large in such averages because some people spent more than a minute in front of a ROI and others much less than a second.
On the other hand, according to the same figure, we see that the ROI our group looked at the longest is the letter written by the Waffen SS officer to his wife, located in zone 3. The other ROI where the participants spent the most time are either texts or captions of the pictures.
Another equally interesting result in our work is the number of visitors who stop to read the texts or image titles, from 11 to 16 participants which corresponds to 65% 94% of our sample.
Of course, it is not possible to compare zones of varying length. It is however important to note that only the wall of photographs illustrating the mechanisms of humiliation and exclusion, "From Persecution to Extermination", was viewed by all participants. Secondly, we note that zone 7 dedicated to "Gypsies" is both the one that was seen by the greatest number and the one where the time spent is the shortest.
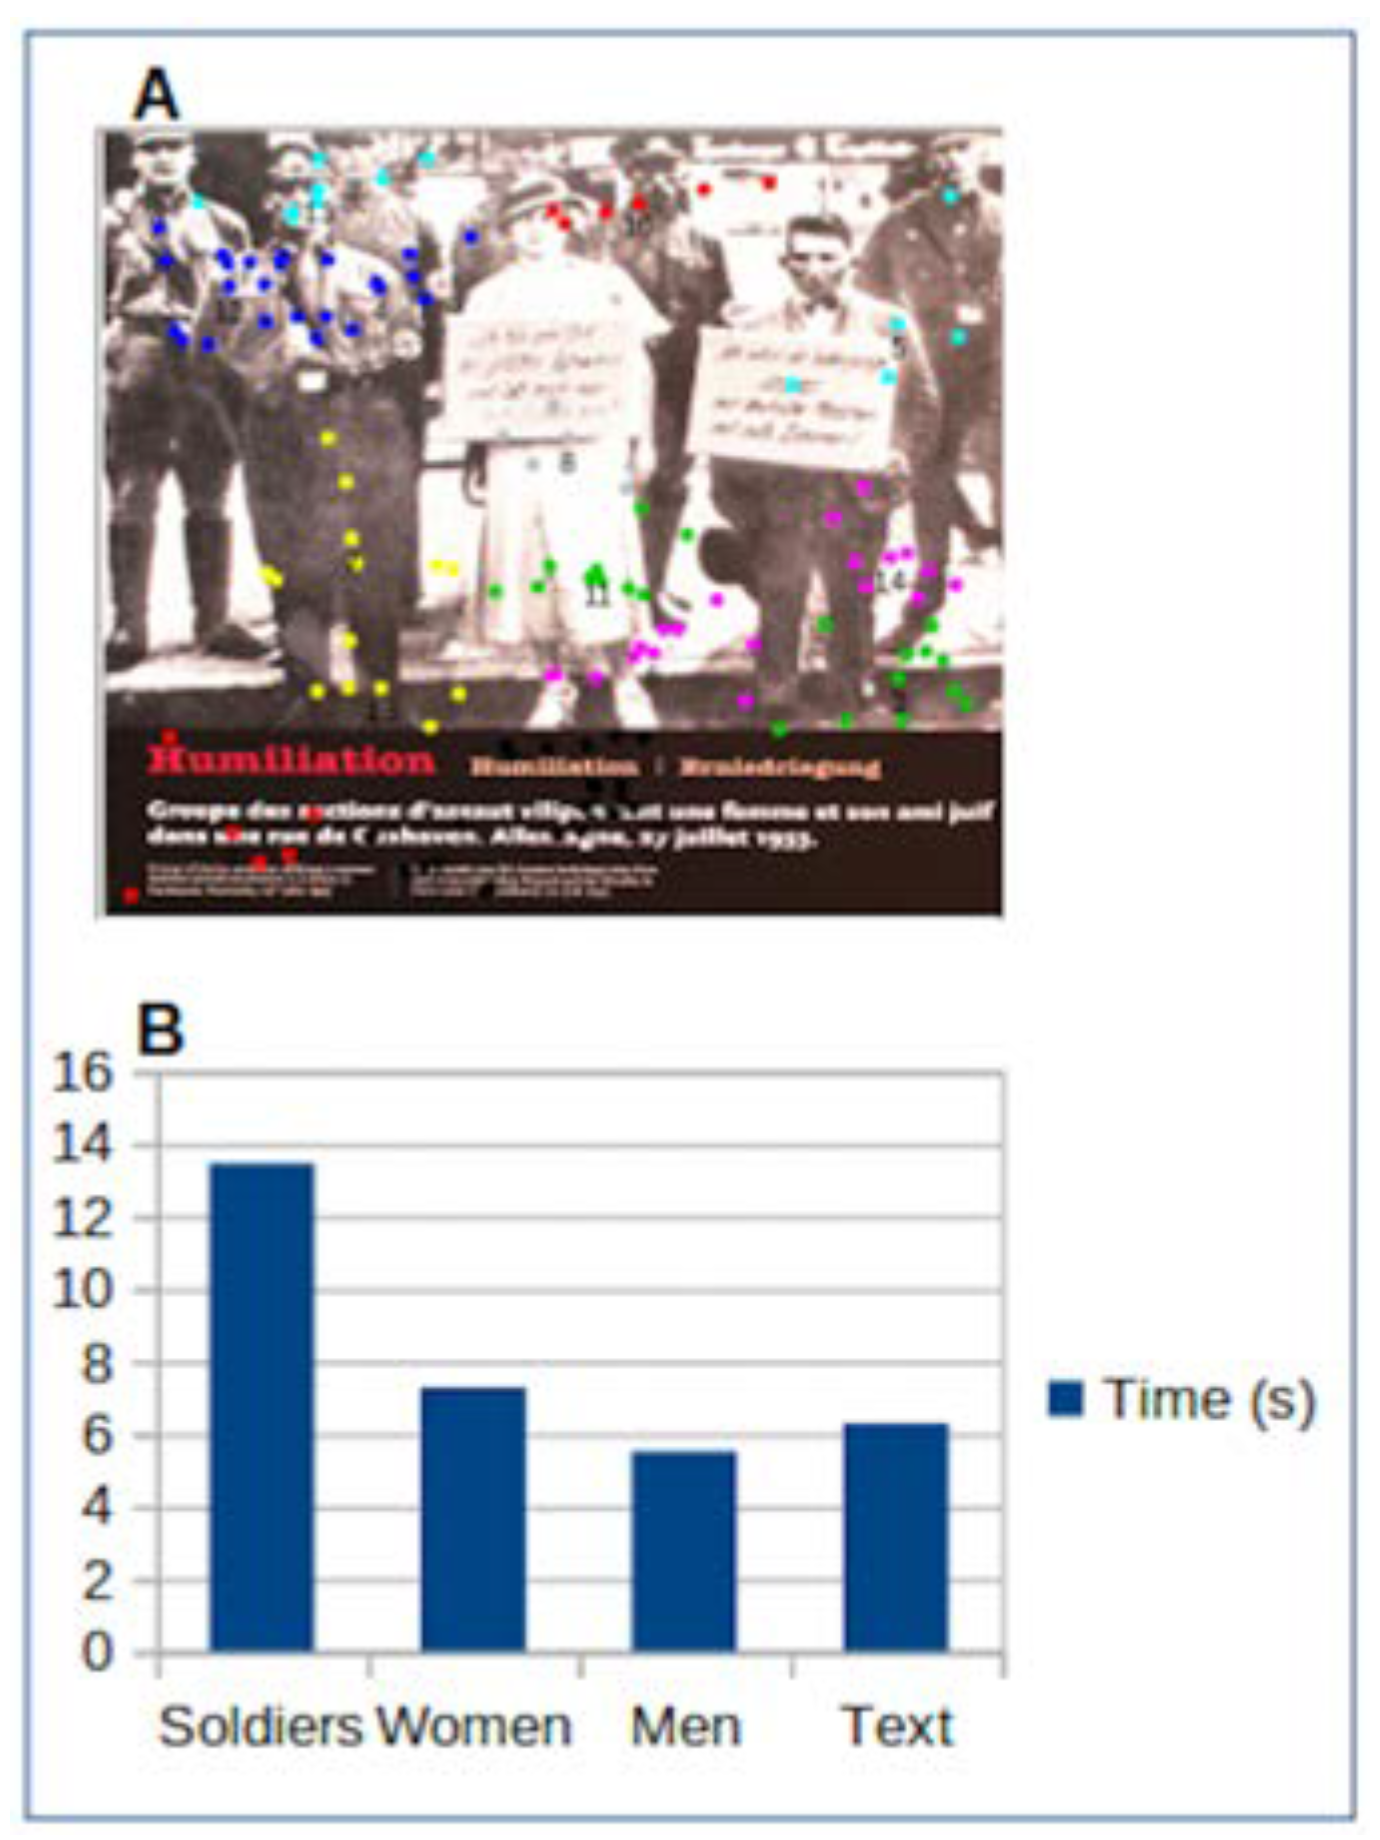
Figure 2.
A. Graph of average time spent in each region of interest (ROI) in seconds with standard deviation (table of values is in supplementary material SM2). B. The average time in minutes spent by participants in each area. C. The maximum number of visitors in front of an item in each zone.
Figure 2.
A. Graph of average time spent in each region of interest (ROI) in seconds with standard deviation (table of values is in supplementary material SM2). B. The average time in minutes spent by participants in each area. C. The maximum number of visitors in front of an item in each zone.
As an example, we will focus on the most striking exhibits:
Written testimonies: two letters on extermination one on the extermination of proximity, the other on the crematorium of Auschwitz 2.
Photographs: the very peculiar wall on the persecution before deportation, about fifteen photographs considered as a single depot, and period photographs of the Mizocz massacre.
1.2. Quantification of the amount of time each participant spent looking at each part of an area of interest.
We were able to project the coordinates of the fixations of all participants on the image looked at (ROI), thanks to our clustering algorithm. We then identified clusters of fixations; each group is represented by a different color (see
Figure 3). From these clusters, we identified the position of each point; we then calculated the duration of the fixation associated to this point.
From the graph in
Figure 3B, we could deduce that the SA (Sturmabteilung) was the most "looked at" by the participants. The figure that comes next is the woman whilst the man on the picture is the less “looked at”. Some participants also tried to read the stigmatizing signs worn by the couple. Yet undoubtedly, the majority of the gaze focused on the SAs to the right of the woman. One possible observation is that the perpetrators are observed more than the victims.
Figure 3.
A. Projection of the fixation coordinates of the different participants who looked at this image, each cluster being identified by a color. B. Graph of the time of fixations in seconds for thematic clusters.
Figure 3.
A. Projection of the fixation coordinates of the different participants who looked at this image, each cluster being identified by a color. B. Graph of the time of fixations in seconds for thematic clusters.
2. Gaze trajectory
2.1. Gaze trajectory at the scale of a ROI
A gaze trajectory could be traced from the coordinates of the fixations and their order.
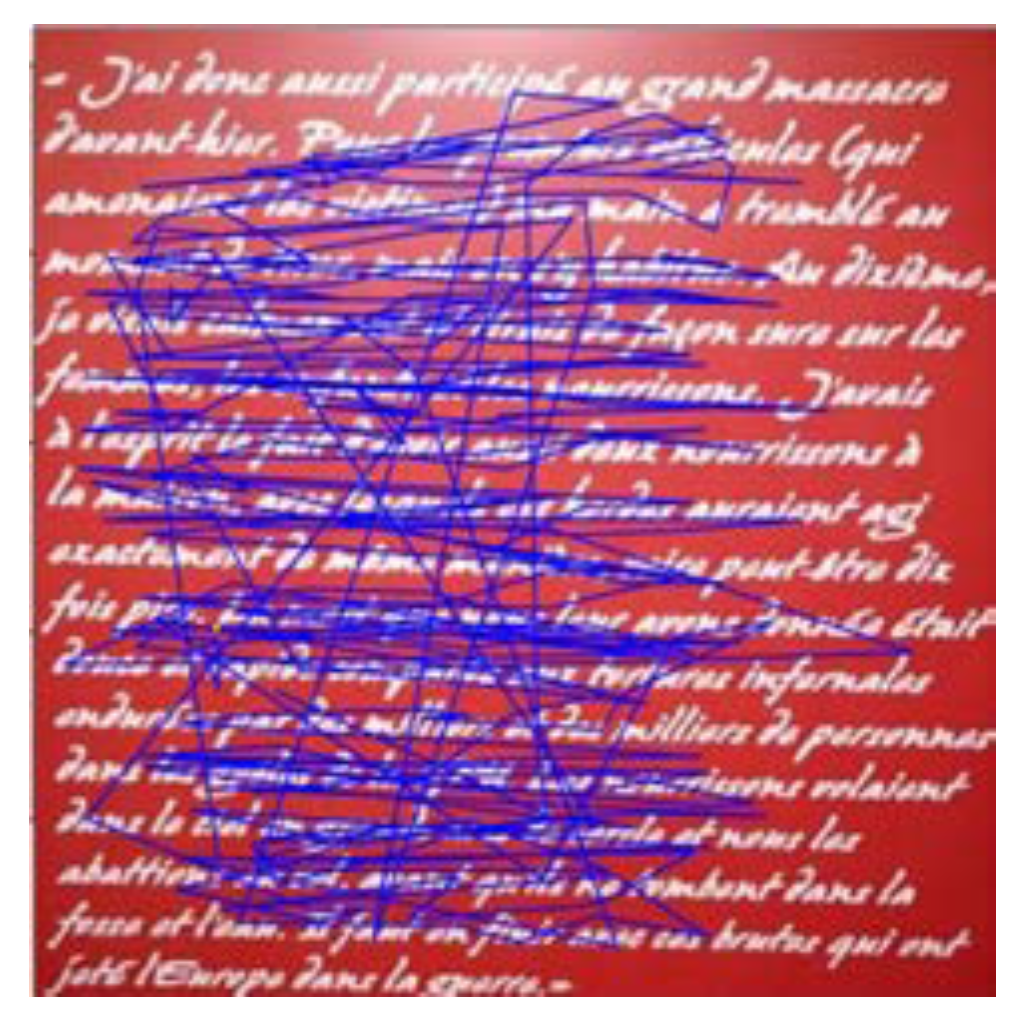
A. mapping of one gaze trajectory (participant E11) on/ a letter written by a Waffen SS officer:
This letter was written two days after the massacre of Jews in which the officer took part, often caught the attention of the students. The emotional charge is very important, which is not without consequence on the reading.
11 of the 17 participants looked at this letter with great attention (30 seconds on average).
In the reading example shown in
Figure 4, the participant reads the text twice, dedicating 1'47 min to it. The reader jumps from the caption to the beginning of the letter, hence the first vertical line that cuts through the text. Then the student’s gaze had been relatively focused on the words, line by line, it was from the reference to "infants" that everything became blurred, the reader's gaze proceeded in a succession of saccades. The student returned to what he had previously read and went back and forth in the text (vertical saccades).
In this testimony, the Waffen SS explains that he participated in a massacre in the context of what is now called "the Holocaust by bullets" (
Desbois, 2018). He further details that he was led to kill old people, women and children and that he shot infants thrown into the air by his comrades. Killing infants explained this SS was indispensable because, otherwise, they would come and kill more of their children and grandchildren in revenge.
The sentences that most appealed to the students are circled in yellow: "I was calmly aiming and safely shooting at women, children and infants," reads the first case. In the second, the gaze was fixed on "torture", "infants were flying in the sky".
All the participants who read this letter were marked by its content, as confirmed by the focus groups after the visit, but this is translated differently: there is the participant who reread the text in a linear way after having made many saccades during the first passage, the one who read quickly and looked for the end of the story from the sixth line. Only one participant apparently showed no emotion by normal horizontal reading.
Figure 4.
A participant's gaze trajectory from the fixation points on a letter sent by a Waffen SS to his wife.
Figure 4.
A participant's gaze trajectory from the fixation points on a letter sent by a Waffen SS to his wife.
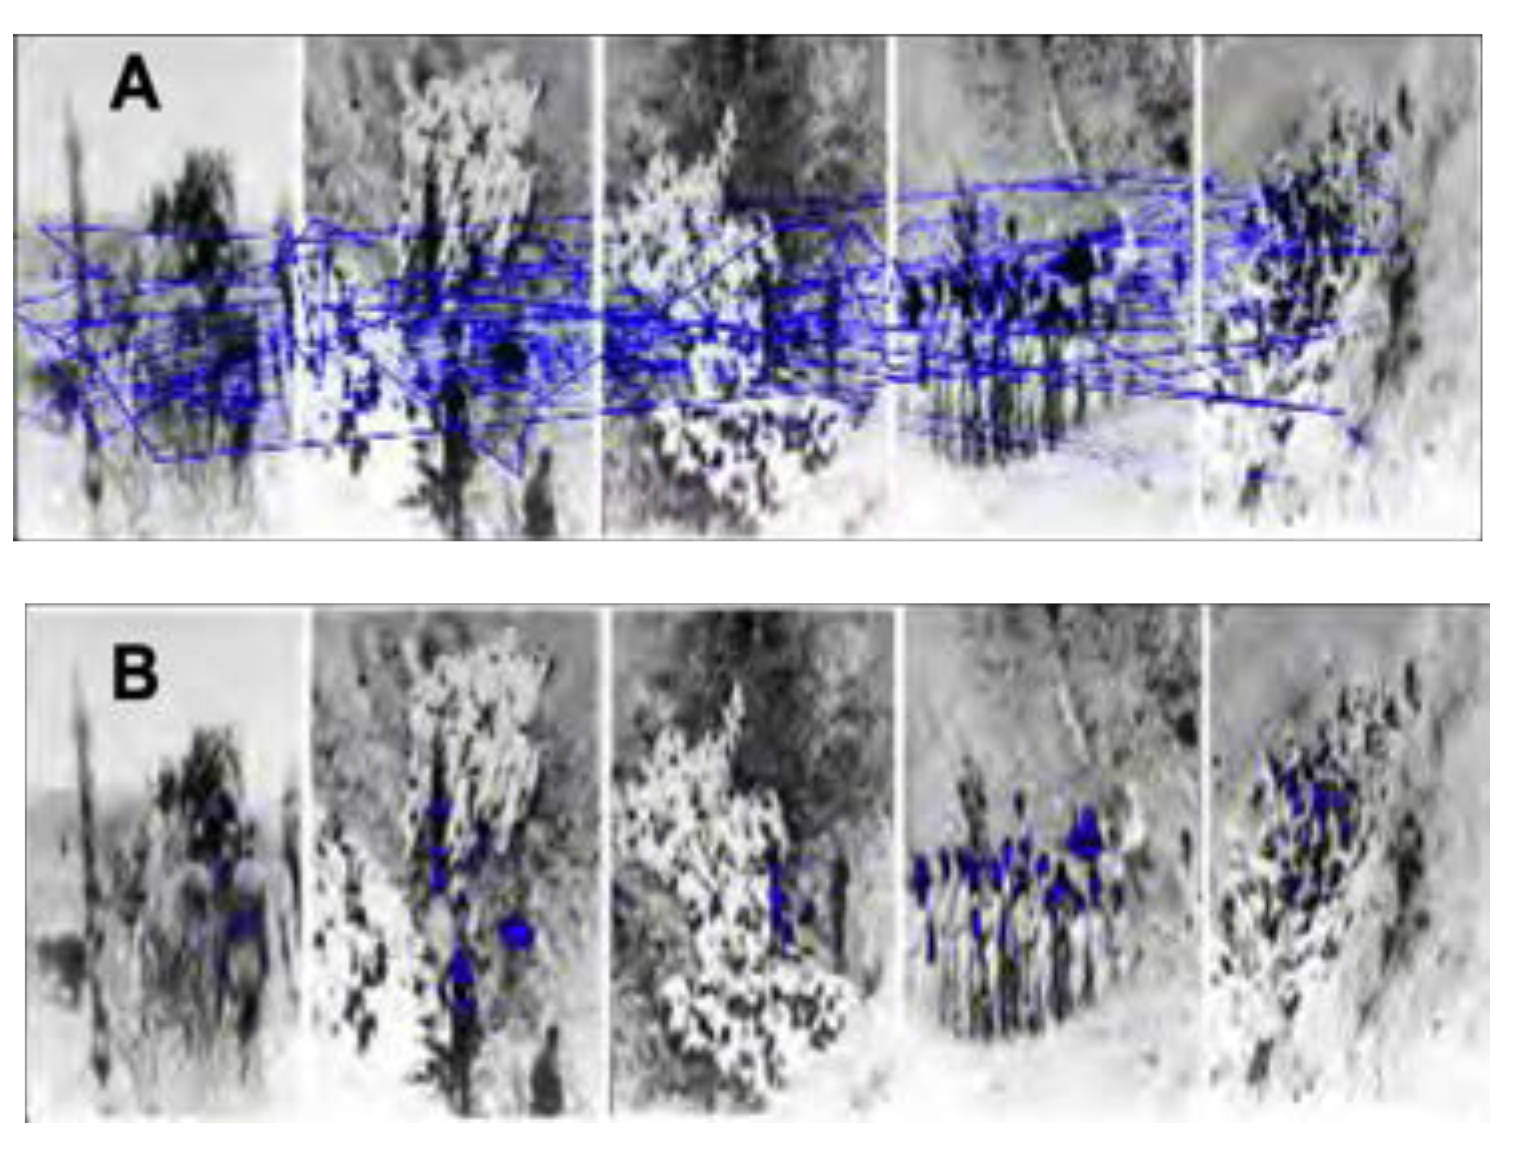
B. mapping of all participants’ gaze trajectories on the picture drawing by a survivor of the Sonderkommando, David Olère:
The drawing details the work to which he had been assigned in crematorium III at Auschwitz-Birkenau. In this process of extermination wanted by the Nazis, which combined the gas chamber and crematorium, secrecy was of major importance. The drawings from inside the crematoria were made with great precision by David Olère immediately after his release, in order to bear witness to the horror.
Figure 5.
Gaze trajectories of all the participants who looked at this image of a crematorium.
Figure 5.
Gaze trajectories of all the participants who looked at this image of a crematorium.
In this picture (see
Figure 5) we follow the eyes of the students. The paths have been reconstructed from the coordinates of each person's bindings.
It is noticeable that the gaze is focused on the ovens themselves and especially on the two members of the Sonderkommando who put a body in the oven, much more than on the pile of bodies at their feet or on the door at the back of the room, where a freight elevator brings its share of corpses from the gas chamber.
2.2 Gaze trajectory through a set of images or ROI and detection of saccades
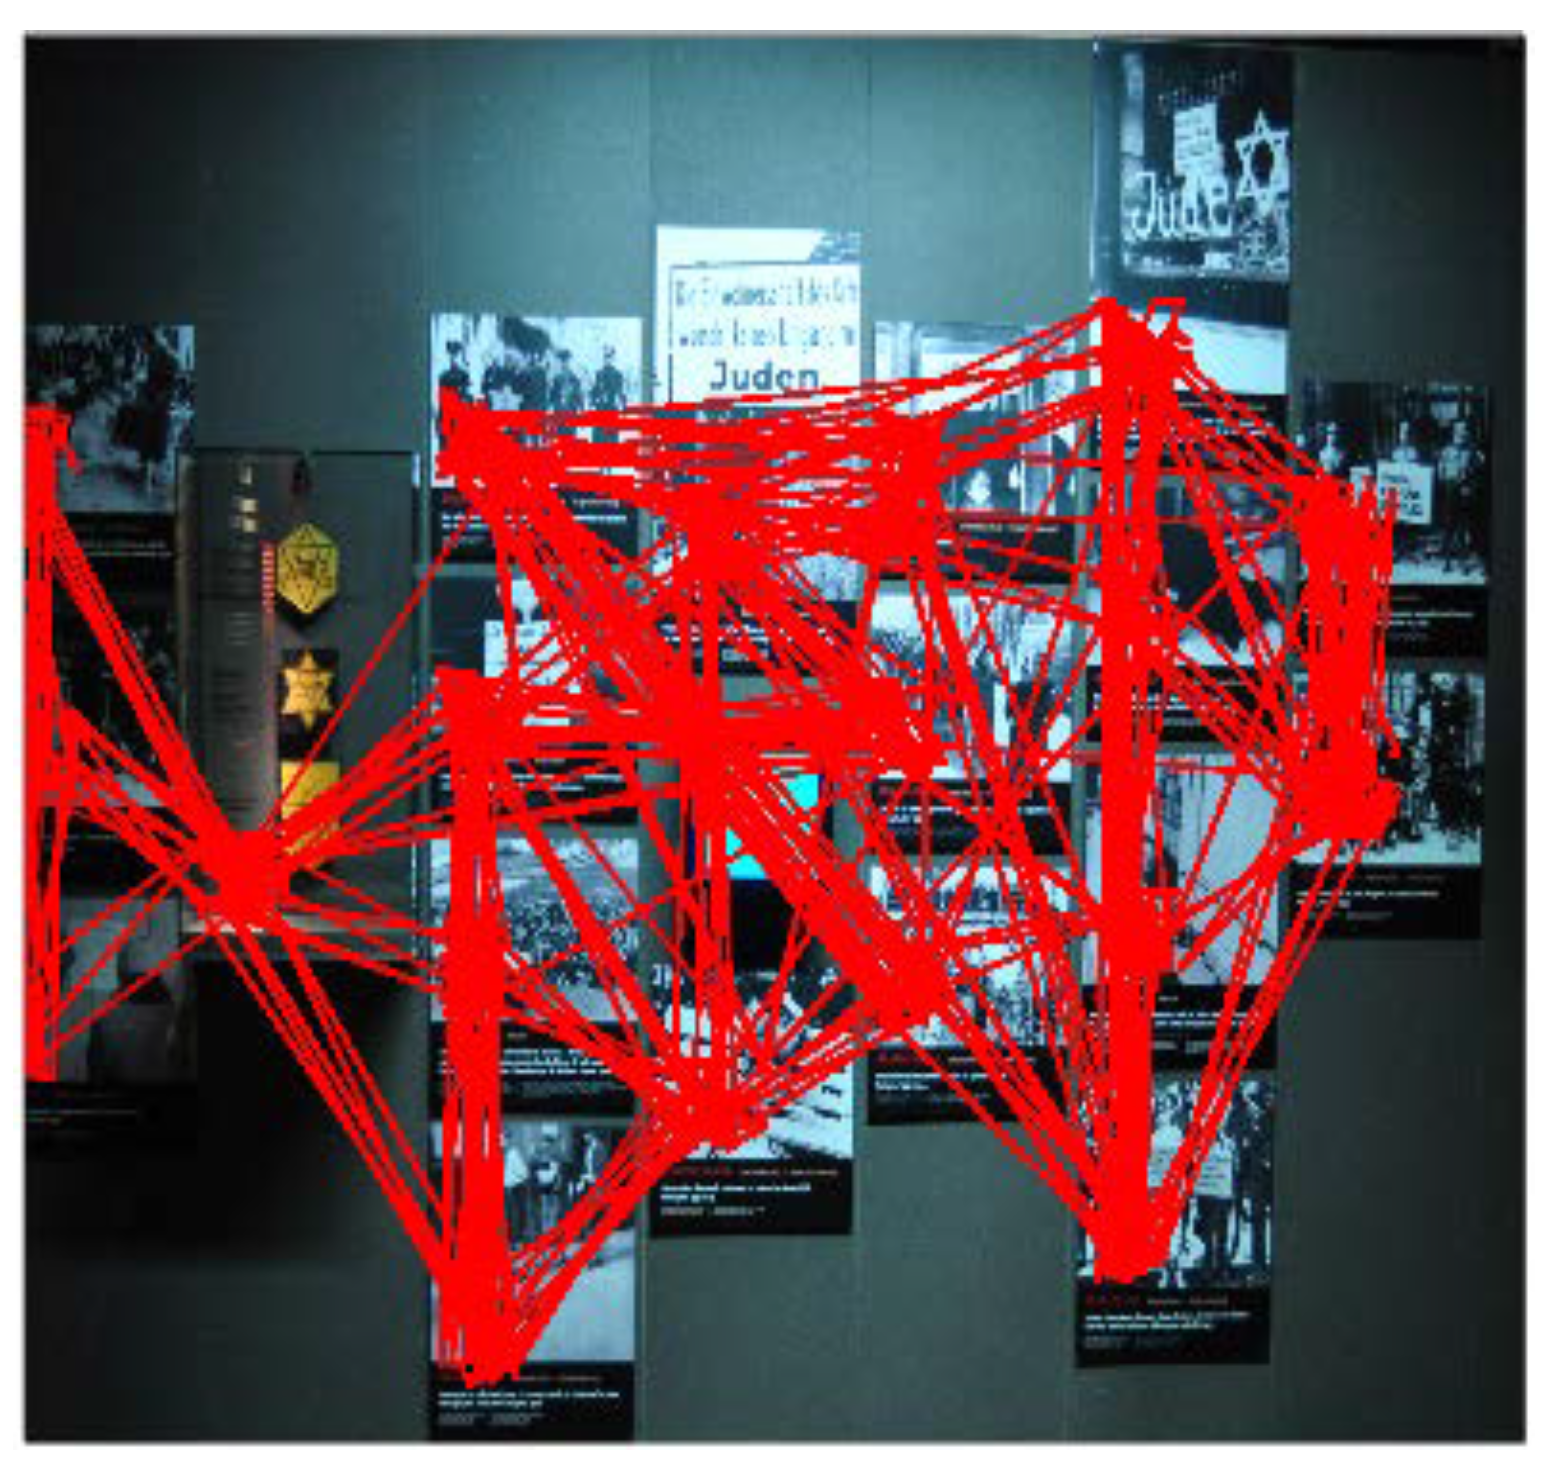
A. Analysis of the wall of photographs.
The area studied is located in zone 2, "From persecution to extermination" (see
Figure 1).
The students were confronted with this wall, which contains a set of photographs and three video screens. They spent a certain amount of time, with the average for the group being 4'22'', with significant variations ranging from 1'10'' to 12'. In
Figure 6, we are mapping all the gaze paths of the 17 participants.
Figure 6.
Mapping of all the trajectories of the 17 participants going through the wall of photographs in zone 2, made up of 19 ROI.
Figure 6.
Mapping of all the trajectories of the 17 participants going through the wall of photographs in zone 2, made up of 19 ROI.
The gaze explores the wall of pictures in sense of the visit, from the right. The gaze first goes through one of the pictures of the first column. Both are systematically seen.
After analyzing each gaze trajectory mapped in
Figure 6, we noticed that the students look at all the images. Only one student is an exception. He starts with the image of the old man dying on a ghetto pavement (2nd column) and then quickly leaves the right-hand columns.
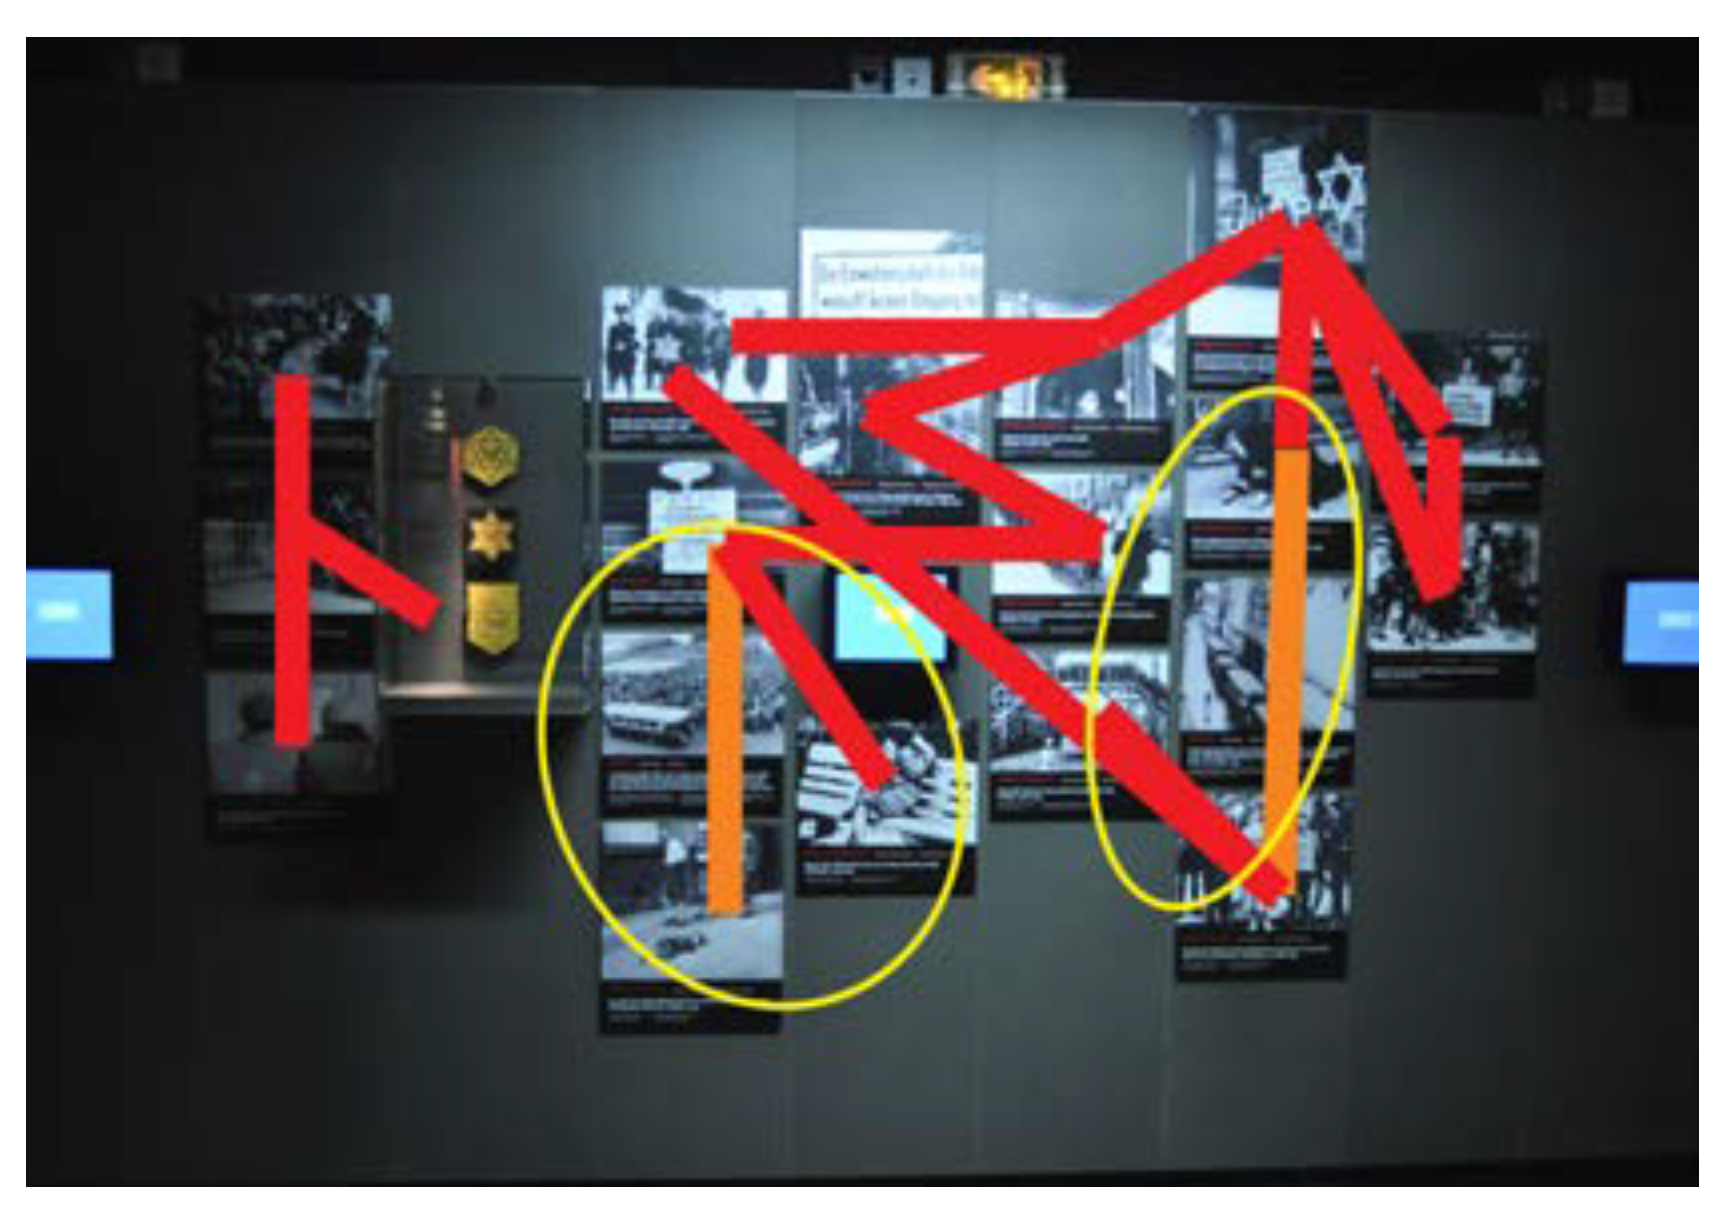
In order to detect automatically typical subtrajectories, we used the TRACLUS algorithm, which detects gaze densities from all participants’ fixations.
Figure 7.
Clustering result on the trajectories of all the participants. The segments show the densest parts of trajectories. In orange, we find the densest segments but which, in addition, experience strong saccades.
Figure 7.
Clustering result on the trajectories of all the participants. The segments show the densest parts of trajectories. In orange, we find the densest segments but which, in addition, experience strong saccades.
In
Figure 7, red and orange indicate the path segments with the highest density viewings.
In contrast to the red segments which materialize a one-way passage of the eye, the orange segments indicate saccades. The participants went back and forth vertically between these images.
We note that the students made the same associations between some of the images on the wall, such as the horizontal red bar at the top that groups together the pictures of stigmatization by the Jewish star. Other images are points of support that distribute the gaze. This is obvious for the two pictures on the right, the ones at the beginning, but it is also true for the one in the fifth column where a handwritten poster indicates, in German and French, "Juden unerwünscht" "Interdit aux Juifs". We can see that the participants return to this image to explore others.
A. Analysis of the photographs of the Mizosz massacre
It is this series of photographs taken by a German gendarme and showing the different stages of this massacre that is the most watched by the students.
They were seen by 14 of the 17 students with a VT of 20 to 30 seconds. The scenography of this part is important since the photographs are reduced in size and placed at a certain height in the wall which was dug out so that the pictures are distant from the eye of the visitor.
Figure 8.
A. The gaze trajectories of 14 participants over a photo of the massacre of Ukrainian Jews in Mizocz, USSR. B. The densest points of fixation.
Figure 8.
A. The gaze trajectories of 14 participants over a photo of the massacre of Ukrainian Jews in Mizocz, USSR. B. The densest points of fixation.
Figure 8.A shows the trajectories of these 14 students' gazes. From the fixations of participants mapped on the
Figure 8.B, we notice that these fixations are denser on the heads of the victims compared to the heads of the officers in charge of killing them.
3. Focus groups analysis by text-mining
After the museum visit, 9 students (out of 17) stated that the exhibition gave them more details, and that they acquired and/or were able to access new knowledge: "we learned more things we were able to improve our knowledge".
10 out of 17 participants expressed a questioning about the responsibility for the crime, but also about the capacity of man to commit such horrors.
A slightly more precise analysis of the verbatim allowed us to go further and question the relationship between teaching in the school setting and visiting memorials.
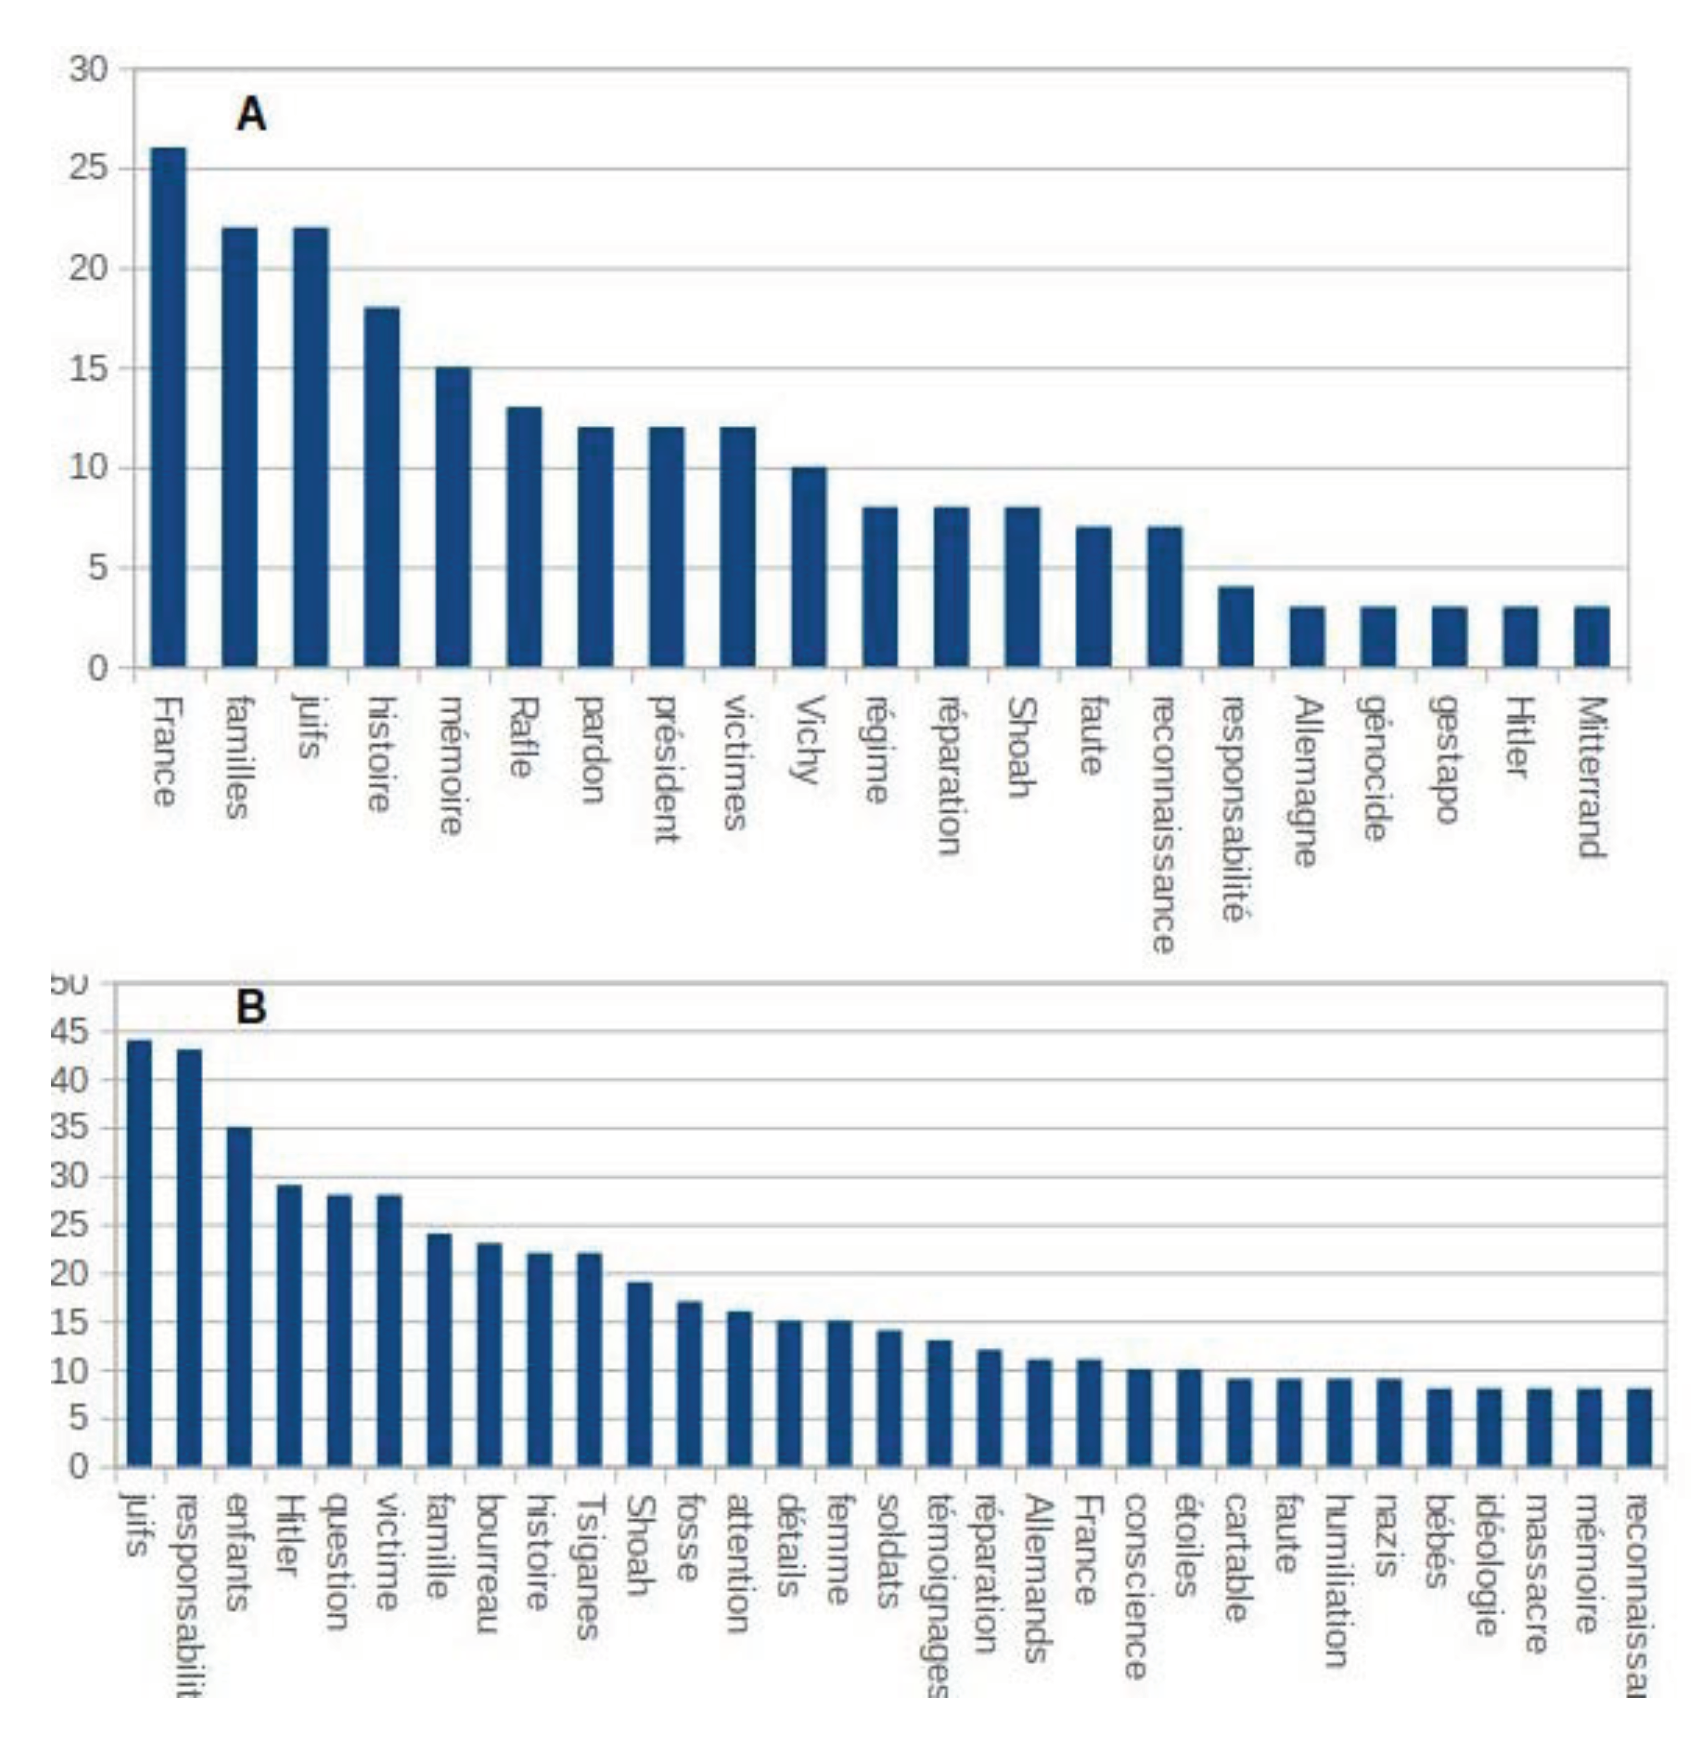
The first striking result is the comparative number of words used during focus groups: with 11985 before the visit against 22371 after the visit to the museum, the number has almost doubled.
But, more interestingly, the hierarchy of words has been profoundly modified, even though in both cases the students are supposed to refer to the same period of time.
Figure 9.A shows a polarity on the discourse on memory, on responsibility, on France, on the persecution of the Jews, and more precisely on the roundup of the
Velodrome d'Hiver, namely the first and most important roundup organized on the initiative of the Germans, with the help of the Vichy collaborating regime, on July 16 and 17, 1942.
Figure 9.
Graphs of the occurrences of the most used words in the participants' speech: A. during the class focus group. B. during the focus group at the end of the visit to the museum.
Figure 9.
Graphs of the occurrences of the most used words in the participants' speech: A. during the class focus group. B. during the focus group at the end of the visit to the museum.
After the visit to the memorial (
Figure 9.B), the persecution of the Jews is still central in the focus group's discourse, but at the heart of this process are the Germans, the Nazis, and Hitler. In addition, there is an overlapping of scales, from the main actors of history to the individual executioners and victims. For a complete list of the extracted words, see the supplementary material – SM3].
It is rare that the hierarchical list of occurrences alone is sufficient to distinguish so clearly between two discourses, and moreover between the same people on the same subject. It is not the purpose of this article to go into detail about the vocabulary used thanks to the classical tools of textometry. Such a blatant statement is enough, but what can it correspond to? We are in fact confronted with two different vectors of collective memory. The Caen memorial-museum is specifically intended to provide keys to understanding the Second World War. The space that was privileged for our study ("World War, Total War") shows the global dimension of the war, whereas the case of France is dealt with at length in the previous space. Drawing on the most recent historiographical advances, it focuses in particular, on the persecution of the Jews, on the mass massacres organized on the Eastern Marches by the Einsatzgruppen, the so-called "Holocaust by bullets". An important space is devoted to the other targets of Nazism, such as the Gypsies.
As explained in the section “Methods”, to prepare students for the visit to the memorial, the teachers presented extracts from François Mitterrand and Jacques Chirac speeches, to dig into the difficult sedimentation of education in schools from one year to the next.
Discussion
In this work we focused on 3 results, the VT, the reconstructed trajectories of the gazes and finally the analysis of the focus group transcriptions. The first result was to calculate the number of visits for each exposed item (ROI), as well as the average viewing time for each item. We discovered the items that were most viewed by our participants, such as the letter from the Waffen SS to his wife. Then, we calculated the time spent looking at the different parts that make up the same ROI. This type of calculation revealed for instance a VT discrepancy between the SA soldiers and the Jewish German couple.
Concerning the spatial data provided by eye-tracking, thanks to the coordinates of the fixations and their order provided by the Eye-trackers device, we were able to follow the gaze at several scales, that of the ROI taken in isolation or that of several successive ROIs. We observed how a single ROI could not be separated from the context in which an individual apprehends it and conversely how a singular ROI could influence an individual’s gaze on a group of ROI.
The different results showed: 1. an emotional charge in the eyes of the participants (“E11” gaze trajectory as an example in “Results” section) when reading the letter from the Waffen SS. 2. the gaze of all participants lingering on the ovens and Sonderkommandos depicted in the drawing whilst we note an almost complete absence of fixations on the piles of dead bodies drawn in front of the ovens or at the far end of room. 3. a high density of gazes on the heads of the victims in comparison with the heads of the officers in charge of killing them (see
Figure 8B).
4. In order to obtain conclusive observations of the way the participants’ gaze related to different ROIs, we reconstructed global trajectories on a wall of photographs containing several ROIs. The idea was to detect behaviors such as saccades and also to identify the main sub trajectories in the participants gaze paths.
Finally, we performed lexical analysis of the transcripts of the two focus groups that took place before and after the visit to the Caen memorial-museum. This analysis showed that the participants were more eloquent after the visit, they used new words, their knowledge was enriched (assimilation), and some of their patterns were modified to accept new knowledge (accommodation).
Comparison of the measured VT in our work and the literature:
From our results, we found that the duration of the VT varies among participants. This variability is a notion that has been very present in the literature related to art museum, since manual calculation (
Smith and Smith, 2001), and even after the use of eye-tracking, studies still reporting this variability (
Brieber et al., 2014;
Heidenreich & Turano, 2011).
Brieber et al. (
2014), noted that VT increased with appreciation and understanding of the work, or conditioned by certain properties of stimuli and subjective experiences (
Leckart & Faw, 1968). Also, certain characteristics such as larger size, complexity, and novelty of the item observed tend to increase VT, for abstract motifs, line drawings, and realistic images (
Berlyne, 1958; Brown & Farha 1966;
Leckart & Bakan, 1965;
Leckart, 1966) as well.
Although in our study, the VT values varied among participants, their average remained high in comparison with the literature. This shows that participants examined the different items with great attention. This result is consistent with those published by
Eghbal-Azar & Widlok (
2012).
In this work, we concluded that texts are the most viewed ROI (see
Figure 2). In fact, important number of visitors stops to read the texts or the titles of the pictures. This result is somewhat contradictory with the study by
Borun & Miller (
1980), which indicates that visitors read only 18% of the texts in an exhibition, and also the study by
Schwan et al. (
2019) on a similar theme. However, the specific "school" setting of this visit could explain this difference.
Another factor that can affect VT is museum fatigue (Bitgood 2009;
Brieber et al., 2014). Museum fatigue can be caused either by the time spent in the museum itself or the density of the objects on display (
Melton, 1935). This partly explains the lack of success of some sub-areas, such as the Ghetto sub-area or the speed of viewing in the Gypsy sub-area.
Gaze trajectories and avoidance.
Regarding the spatial data provided by eye-tracking, we studied how visitors looked at a letter written by a Waffen SS to his wife.
The importance of the saccades we noted could indicate a strong emotional charge, especially since the focus groups gathered after the visit seemed to confirm this observation. This remark is in line with that of
Smets (
1975) and
Falk & Dierking (
2013) who think that it is very important to create emotional, sensory, kinesthetic (which concerns the sensation of movement of body parts.), and intellectual experiences, which will be striking for the visitor, in order to allow a good memorization/learning experience.
However, studies by neuroscientists (Layton & Krikorian 2002) on the relationship between emotion and memory are more nuanced. Starting not from the case of museum visits but from that of PTSD (Post-Traumatic Stress Disorder), they show that if the seat of memory, the hippocampus, is favorably activated by amygdala excitation, the seat of emotions, the mobilization of the amygdala then results in an increasing inhibition of the hippocampus. The debate is important, because it is a question of knowing to what extent emotion can arise interest and therefore learning and if, by mobilizing it too much; the opposite effect is not obtained.
The other relevant result that we have been able to gather from this study is to identify some major mechanisms at work in the visit of history museums. The most striking is undoubtedly that of avoidance. This translates into two behaviors. 1. The refusal to go further in the face of an area of interest that is too violent (see
Figure 8.B).
2. Saccades that are characteristic of a strong emotional charge in the face of horror. In fact, according to the results of the fixations (Figure 3), on one of the ROI on this wall, which depicts a group of SA humiliating a woman and her Jewish friend on a street in Cuxhaven, participants read the title, and seem to have looked with more interest at the group of SA on the woman's right side. This result is a priori in contradiction with a more empirical observation which shows that visitors would be more attracted by the "unexpected" (
Soren, 2009), in this case the signs around the necks of the two victims, all the more so as the text is written in German and therefore calls for a translation that may be found in the caption, but which here does not exist.
In order to understand these fixations in our corpus, we examined the trajectories of the gazes of the different participants (
Figure 6). After applying the density detection algorithm (
Figure 7), we noticed that this image is in a very dense sub-path characterized by vertical saccades. Thus, the fixations were generated not by the interest of looking at the SAs but on the contrary by their avoidance. This avoidance is well reinforced by the speech held by all the participants after the visit of the museum, on the executioners (“bourreaux” in French) whose number of occurrences goes from 0 during the focus group before the visit to 23 occurrences after the visit of the memorialmuseum (see
Figure 9). The participants integrated the notion of the executioner very well from the beginning of the visit by quoting nurses and doctors who had experimented with the disabled, homosexuals, etc. (see
Figure 9). In addition, during the visit to the space on proximity extermination (Holocaust by bullets), eye-tracking reported that the participants only looked at the heads and upper bodies of the victims and during the focus group, they said that they consciously avoided looking at the killer soldiers at the mass graves.
This act of avoidance was directed against the soldiers recognized as executioners and not against the barbarity of the act. Indeed, in the photo of the crematory oven (see
Figure 5), the participants looked with astonishing precision at the other prisoners putting the dead in the ovens. They detailed all the ovens and described them as "machinery of death," without looking at the pile of dead next to it. For them there was no victim/killer dilemma, all were victims. Participants said that they avoided looking at the killers and only remembered the victims.
This connection between emotion and saccades has already been demonstrated in several studies (El Haj et al.2017; Kaspar et al. 2013). The results of these studies showed that positive and negative emotional memories Nummenmaa et al., (2009) or negative stimuli (e.g. images) triggered more saccades and reduced the duration of fixations.
The result of avoidance was only possible through the use of mobile eye-tracking, which enriches the debate on the comparative merits of mobile and fixed eye-tracking (
Kappoula & Lestocart, 2018). Both are important but they do not bring the same benefits. The fact that it is possible to work by matching without putting sensors in the track allows the tracking of the routes over a long distance and without impacting on the museum's collections.
Text-mining of focus groups transcripts:
Thanks to the results of eye tracking, we were able to interpret an avoidance on the other part of the wall of photographs (figures 6 and 7), which contains the photo of the child lying on the ground. This avoidance was detected by recording the vertical saccades. Indeed, the transcription reveals that, prior to the visit; the word child was mentioned when participants were talking about descendants and repairs and/or memory transmission.
After the visit, we note that the use of the word child increased significantly (from 1 to 35 occurrences). The verbatim tells us that the students were shocked by the involvement of children in war, and it was like the first time they were aware of this fact. According to their words, they found it very difficult to integrate this element into a scheme of the war that is predefined in their heads.
Perspectives and limits:
Our study allowed us to explore a hybrid methodology that combines the use of eye-trackers and focus groups. The particular treatment of spatial data for the reconstruction of gaze trajectories allowed us to detect typical behaviors such as avoidance. However, our approach suffers from two limitations.
The first limitation is the size of the sample. Indeed, it is difficult to generalize the behaviors we found based on such as small number of participants.
The second limitation is the fact that the consolidation of eye-tracking results is based solely on the focus group.
We are aware that both methods have limitations, since participants can be disturbed by the feeling of being observed (eye-tracking), or judged (focus group). In fact, the behavior of students could to become more elaborative than under normal visiting conditions (without eyetracking).
Also, the scales of some tools used in this study are different, since we used eye-tracking at individual level, and interviews at the group level.
As a perspective, we triggered a more systematic and representative study by recruiting a very large number of participants. In addition to eye-tracking, we are also thinking of introducing detectors for physiological parameters (such as sweating, body movements, etc.) in order to increase the objectivity of our results.