Variance Components Affecting the Repeatability of the Alternating Cover Test
Abstract
:Introduction
Methods
Participants
Design
Materials and procedure of the manual prism cover test
Materials for the automated alternating cover test
Procedure of the automated alternating cover test
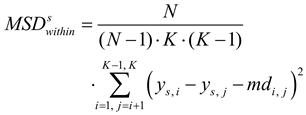
Statistics

Results
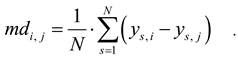
Systematic differences between manual and automated cover test
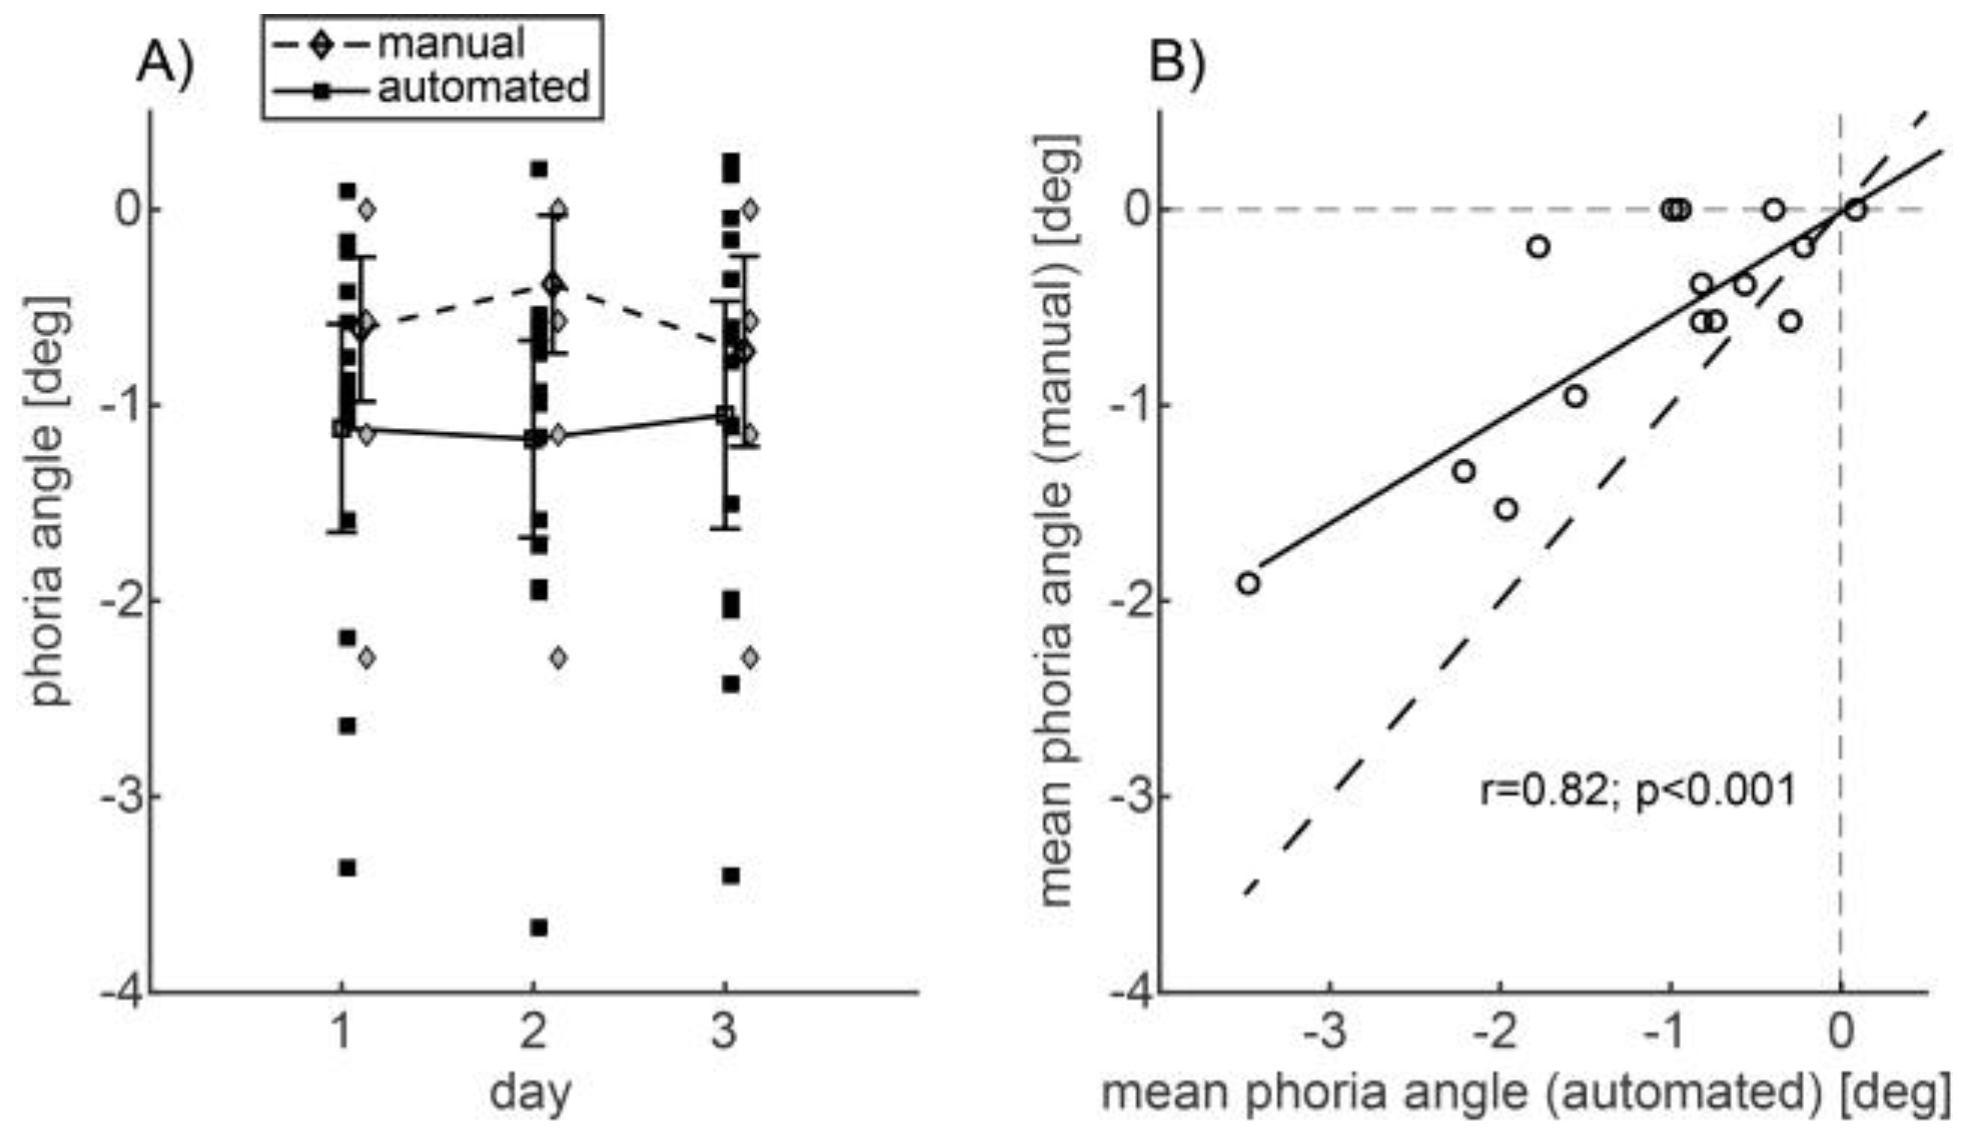
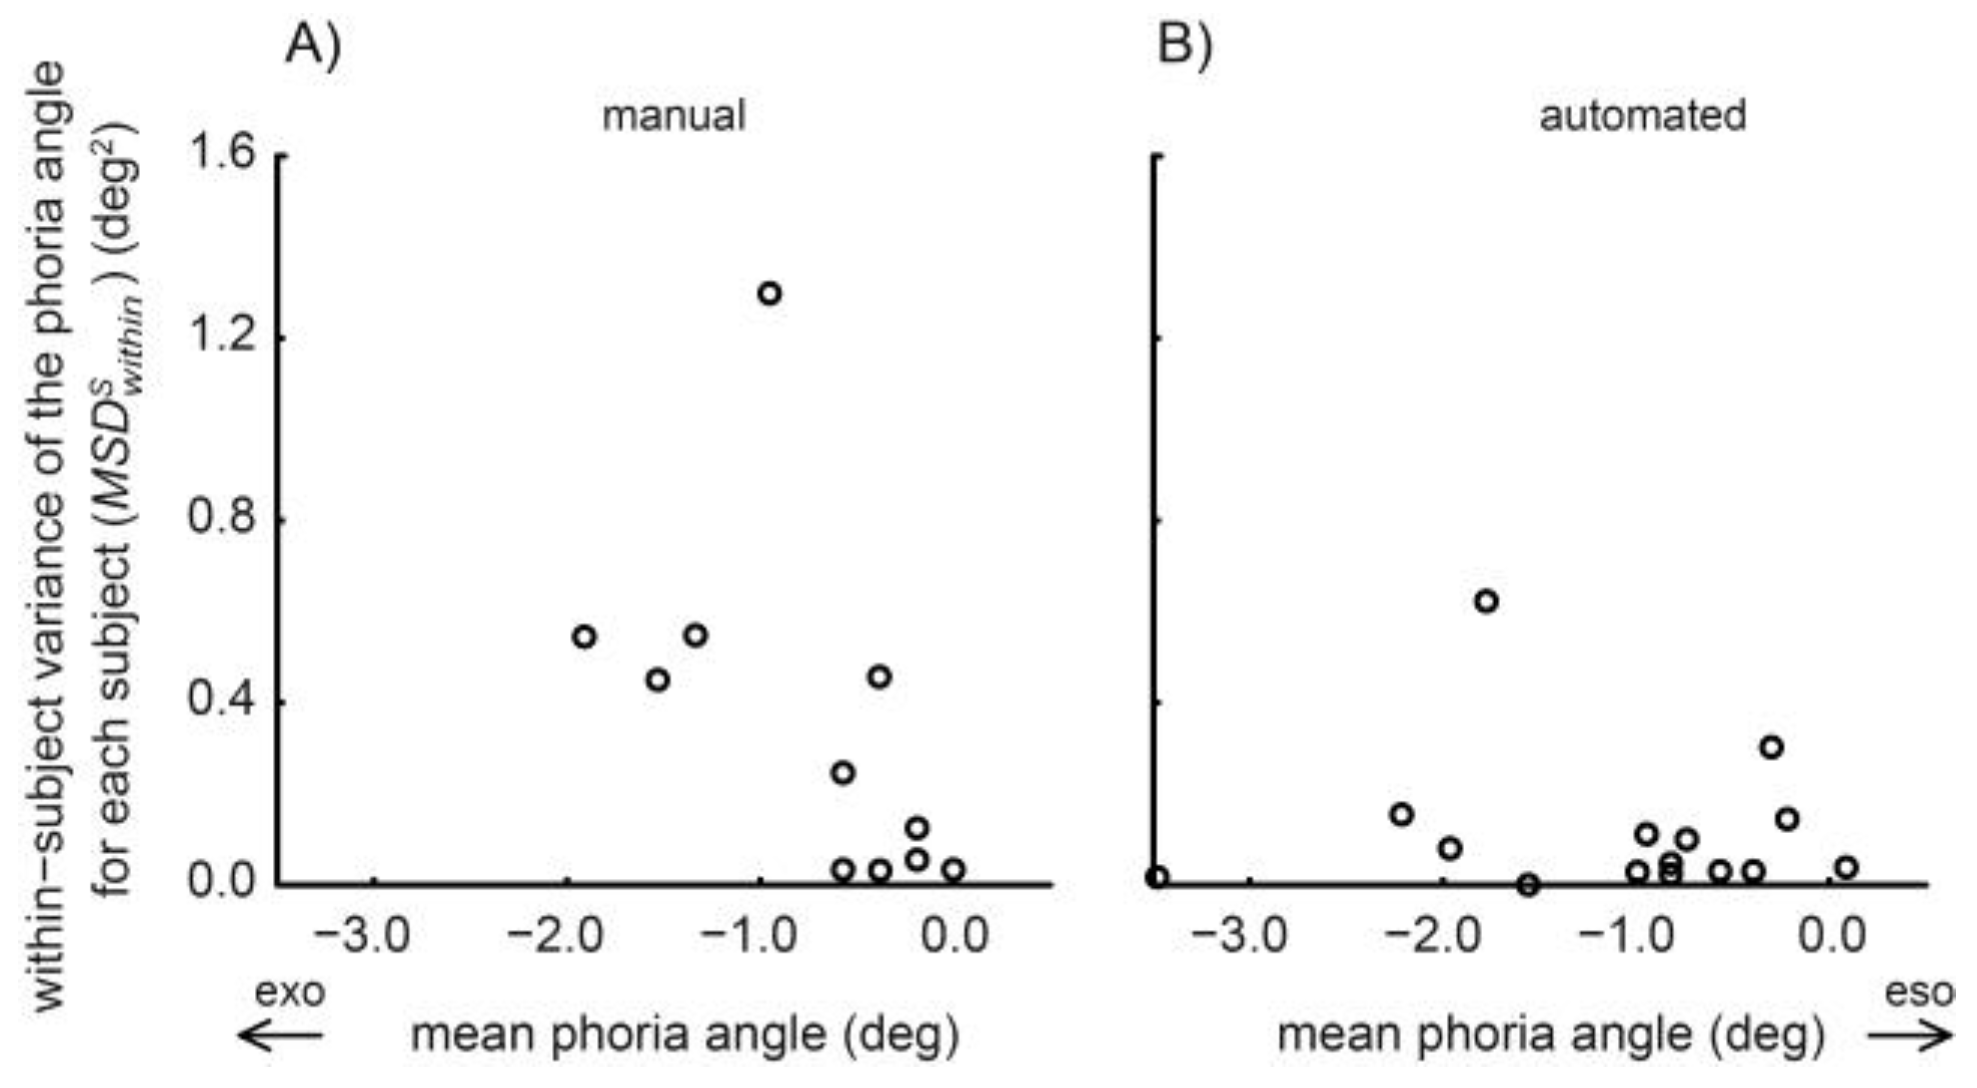
Repeatability across days and trials
The heterophoria noise across days or blocks was not reflected in the heterophoria noise across trials
Discussion
Limitations and comparability with previous studies
The relative contribution of different noise sources in the manual prism cover test
Systematic differences between manual and automated cover test
Conclusion
Acknowledgments
References
- Kommerell, G.; Gerling, J.; Ball, M.; de Paz, H.; Bach, M. Heterophoria and fixation disparity: A review. Strabismus 2000, 8, 127–134. [Google Scholar] [CrossRef] [PubMed]
- Evans, B.; Doshi, S.; Harvey, W. Chapter 2 - Heterophoria. In Binocular Vision; Butterworth-Heinemann: Edinburgh, 2005; pp. 15–40. [Google Scholar]
- Tait, E.F. Textbook of refraction; Saunders: Philadelphia, 1951. [Google Scholar]
- Scobee, R.; Green, E. Tests for heterophoria: Reliability of tests, comparisons between tests, and effect of changing testing conditions. American Journal of Ophthalmology 1947, 30, 436–451. [Google Scholar] [CrossRef] [PubMed]
- Schroeder, T.; Rainey, B.; Goss, D.; Grosvenor, T. Reliability of and comparisons among methods of measuring dissociated phoria. Optometry & Vision Science 1996, 73, 389–397. [Google Scholar]
- Rainey, B.; Schroeder, T.; Goss, D.; Grosvenor, T. Interexaminer repeatability of heterophoria tests. Optometry & Vision Science 1998, 75, 719–726. [Google Scholar]
- Hirsch, M.; Bing, L. The effect of testing method on values obtained for phoria at forty centimeters. Optometry & Vision Science 1948, 25, 407–416. [Google Scholar] [CrossRef]
- Morgan, M. The reliability of clinical measurements with special reference to distance heterophoira. Optometry & Vision Science 1955, 32, 167–179. [Google Scholar] [CrossRef]
- Johns, H.; Manny, R.; Fern, K.; Hu, Y. The intraexaminer and interexaminer repeatability of the alternate cover test using different prism neutralization endpoints. Optometry & Vision Science 2004, 81, 939–946. [Google Scholar]
- Kaufmann, H.; Steffen, H. Chapter 3.1 Untersuchung der Motorik. In Strabismus; Georg Thieme Verlag: Stuttgart, New York, 2012. [Google Scholar]
- Eggert, T. Eyex movement recordings: Methods. In Neuro-Ophthalmology; Straube, A., Büttner, U., Eds.; Developments in Ophthalmology. 40; Karger: Basel, 2007; pp. 15–34. [Google Scholar]
- Han, S.; Guo, Y.; Granger-Donetti, B.; Vicci, V.; Alvarez, T. Quantification of heterophoria and phoria adaptation using an automated objective system compared to clinical methods. Ophthalmic and Physiological Optics 2010, 30, 95–107. [Google Scholar] [CrossRef] [PubMed]
- Mestre, C.; Otero, C.; Díaz-Doutón, F.; Gautier, J.; Pujol, J. An automated and objective cover test to measure heterophoria. PLoS ONE 2018, 13. [Google Scholar] [CrossRef] [PubMed]
- Leigh, R.J.; Zee, D.S. The neurology of eye movements; Oxford University Press: New York, 2015. [Google Scholar]
- Peli, E.; McCormack, G. Dynamics of cover test eye movements. American journal of optometry and physiological optics 1983, 60, 712. [Google Scholar] [CrossRef] [PubMed]
- Barnard, N.; Thomson, W. A quantitative analysis of eye movements during the cover test–a preliminary report. Ophthalmic and Physiological Optics 1995, 15, 413–419. [Google Scholar] [CrossRef] [PubMed]
- Hrynchak, P.K.; Herriot, C.; Irving, E.L. Comparison of alternate cover test reliability at near in non-strabismus between experienced and novice examiners. Ophthalmic and Physiological Optics 2010, 30, 304–309. [Google Scholar] [CrossRef] [PubMed]
- Blum, B.M.; Kirchhoff, D.; Bickmann, A.; Ehrt, O.; Straube, A.; Eggert, T. Heterophoria: Vergence stability and visual acuity after asymmetric saccades. Journal of Eye Movement Research 2012, 5. [Google Scholar] [CrossRef]
- Schneider, E.; Villgrattner, T.; Vockeroth, J.; Bartl, K.; Kohlbecher, S.; Bardins, S.; et al. Eyeseecam: An eye movement–driven head camera for the examination of natural visual exploration. Annals of the New York Academy of Sciences 2009, 1164, 461–467. [Google Scholar] [CrossRef] [PubMed]
- Hebbard, F.W. Comparison of subjective and objective measurements of fixation disparity. JOSA 1962, 52, 706–712. [Google Scholar] [CrossRef]
- Becker, W.; Fuchs, A. Further properties of the human saccadic system: Eye movements and correction saccades with and without visual fixation points. Vision Research 1969, 9, 1247–1258. [Google Scholar] [CrossRef] [PubMed]
- Faul, F.; Erdfelder, E.; Lang, A.-G.; Buchner, A. G* Power 3: A flexible statistical power analysis program for the social, behavioral, and biomedical sciences. Behavior research methods 2007, 39, 175–191. [Google Scholar] [CrossRef] [PubMed]


| Source | d.f. | MS [deg2] | F | Prob>F | Type | MS denom [deg2] | d.f. denom |
|---|---|---|---|---|---|---|---|
| subj | 14 | 49.825 | 22.800 | <0.0001 | random | 2.1852 | 27.82 |
| day | 2 | 1.0835 | 0.494 | 0.615 | fixed | 2.1921 | 28 |
| trial | 18 | 0.0451 | 1.259 | 0.215 | fixed | 0.0358 | 252 |
| day*trial | 36 | 0.0304 | 0.712 | 0.895 | fixed | 0.0427 | 504 |
| subj*day | 28 | 2.1921 | 51.354 | <0.0001 | random | 0.0427 | 504 |
| subj*trial | 252 | 0.0358 | 0.840 | 0.942 | random | 0.0427 | 504 |
| subj*day*trial | 504 | 0.0427 | Inf | NaN | random | 0 | 0 |
| Source | d.f. | MS [deg2] | F | Prob>F | Type | MS denom [deg2] | d.f. denom |
|---|---|---|---|---|---|---|---|
| subj | 4 | 81.792 | 37.118 | <0.0001 | random | 2.2036 | 15.82 |
| block | 4 | 15.190 | 6.856 | 0.002 | fixed | 2.2155 | 16 |
| trial | 18 | 0.0908 | 1.244 | 0.252 | fixed | 0.0730 | 72 |
| block*trial | 72 | 0.0749 | 0.882 | 0.734 | fixed | 0.0849 | 288 |
| subj*block | 16 | 2.2155 | 26.094 | <0.0001 | random | 0.0849 | 288 |
| subj*trial | 72 | 0.0730 | 0.860 | 0.776 | random | 0.0849 | 288 |
| subj*block*trial | 288 | 0.0849 | Inf | NaN | random | 0 | 0 |
| Study | Measurement method | Viewing distance (cm) | Phoria angle (deg) mean±sd | Within-subject variance across days MSwithin (deg2) | Within-subject sd across days (deg) |
|---|---|---|---|---|---|
| Hirsch & Bing [7] | von Graefe prism- diplopia test | 40 | -2.66±2.97 | 1.14 | 1.07 |
| Morgan 1955 [8] | screen-Maddox rod test | 600 | -0.39±1.53 | 0.52 | 0.72 |
| Johns et al. [9] | manual prism cover test | 40 | -1.46±2.57 | 0.55 | 0.74 |
| Current study (manual) | manual prism cover test | 128 | -0.57±0.58 | 0.26 | 0.51 |
| Current study (auto) | automated alternating cover test | 128 | -1.11±0.93 | 0.12 | 0.34 |
| Mestre et al. [13] | automated monocular cover-uncover test | 40 | -0.63±1.87 | 0.17 | 0.41 |
Copyright © 2019. This article is licensed under a Creative Commons Attribution 4.0 International License.
Share and Cite
Paulus, M.M.; Straube, A.; Eggert, T. Variance Components Affecting the Repeatability of the Alternating Cover Test. J. Eye Mov. Res. 2019, 12, 1-13. https://doi.org/10.16910/jemr.12.4.3
Paulus MM, Straube A, Eggert T. Variance Components Affecting the Repeatability of the Alternating Cover Test. Journal of Eye Movement Research. 2019; 12(4):1-13. https://doi.org/10.16910/jemr.12.4.3
Chicago/Turabian StylePaulus, Marius M., Andreas Straube, and Thomas Eggert. 2019. "Variance Components Affecting the Repeatability of the Alternating Cover Test" Journal of Eye Movement Research 12, no. 4: 1-13. https://doi.org/10.16910/jemr.12.4.3
APA StylePaulus, M. M., Straube, A., & Eggert, T. (2019). Variance Components Affecting the Repeatability of the Alternating Cover Test. Journal of Eye Movement Research, 12(4), 1-13. https://doi.org/10.16910/jemr.12.4.3