A Quality-Centered Analysis of Eye Tracking Data in Foveated Rendering
Abstract
:Introduction
- An estimation of the tracking precision of an HMD-mounted eye tracking device, supported by the evaluation of eccentricity-based quality ratings.
- An analysis of fixation accuracy based on the data recorded during a quality-focused user study carried out for our foveated rendering system.
- An analysis of the connection between subjective perceived quality and fixation accuracy, providing possible evidence of the presence of visual tunneling effects and the magnitude of their influence on the user’s perception.
Methods
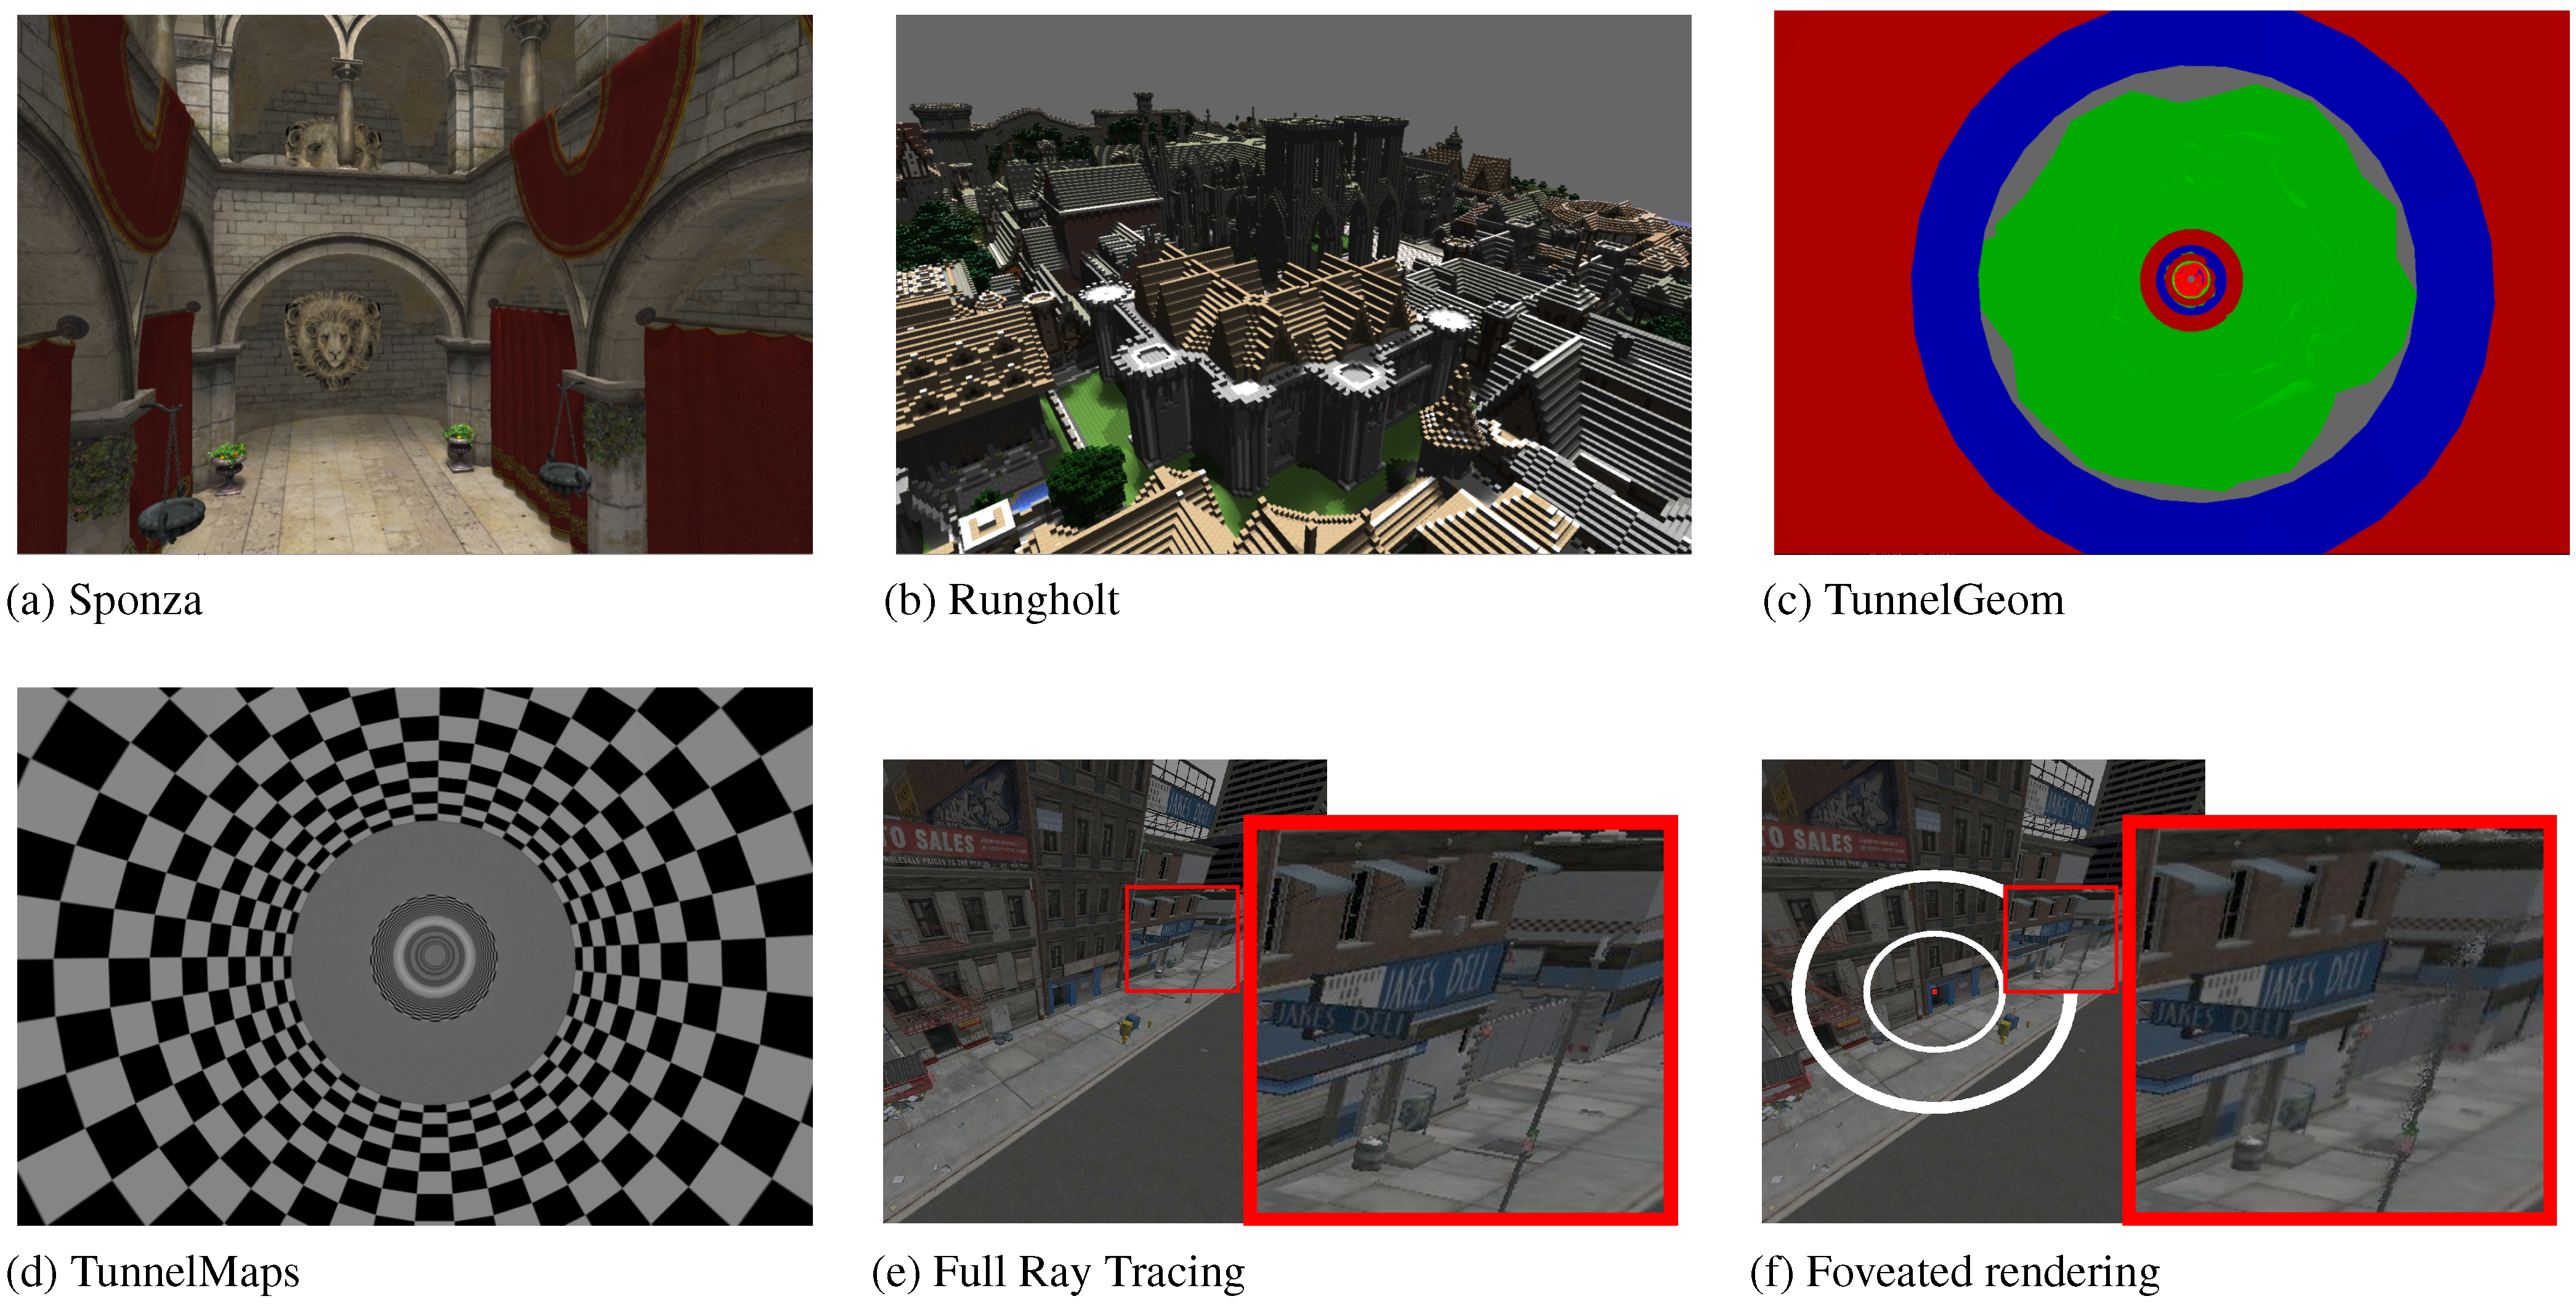
Rendering Process
Evaluation
- How well can users differentiate between foveated and non-foveated rendering?
- How do varying foveal region configurations influence the subjective quality perception?
- How do varying fixation modes affect the subjective quality perception?
- Four FRCs {small (5°, 10°, 0.01), medium (10°, 20°, 0.05), large (15°, 30°, 0.1), full (∞, ∞, 1)}
- Three fixation types {fixed, moving, free}.


Results
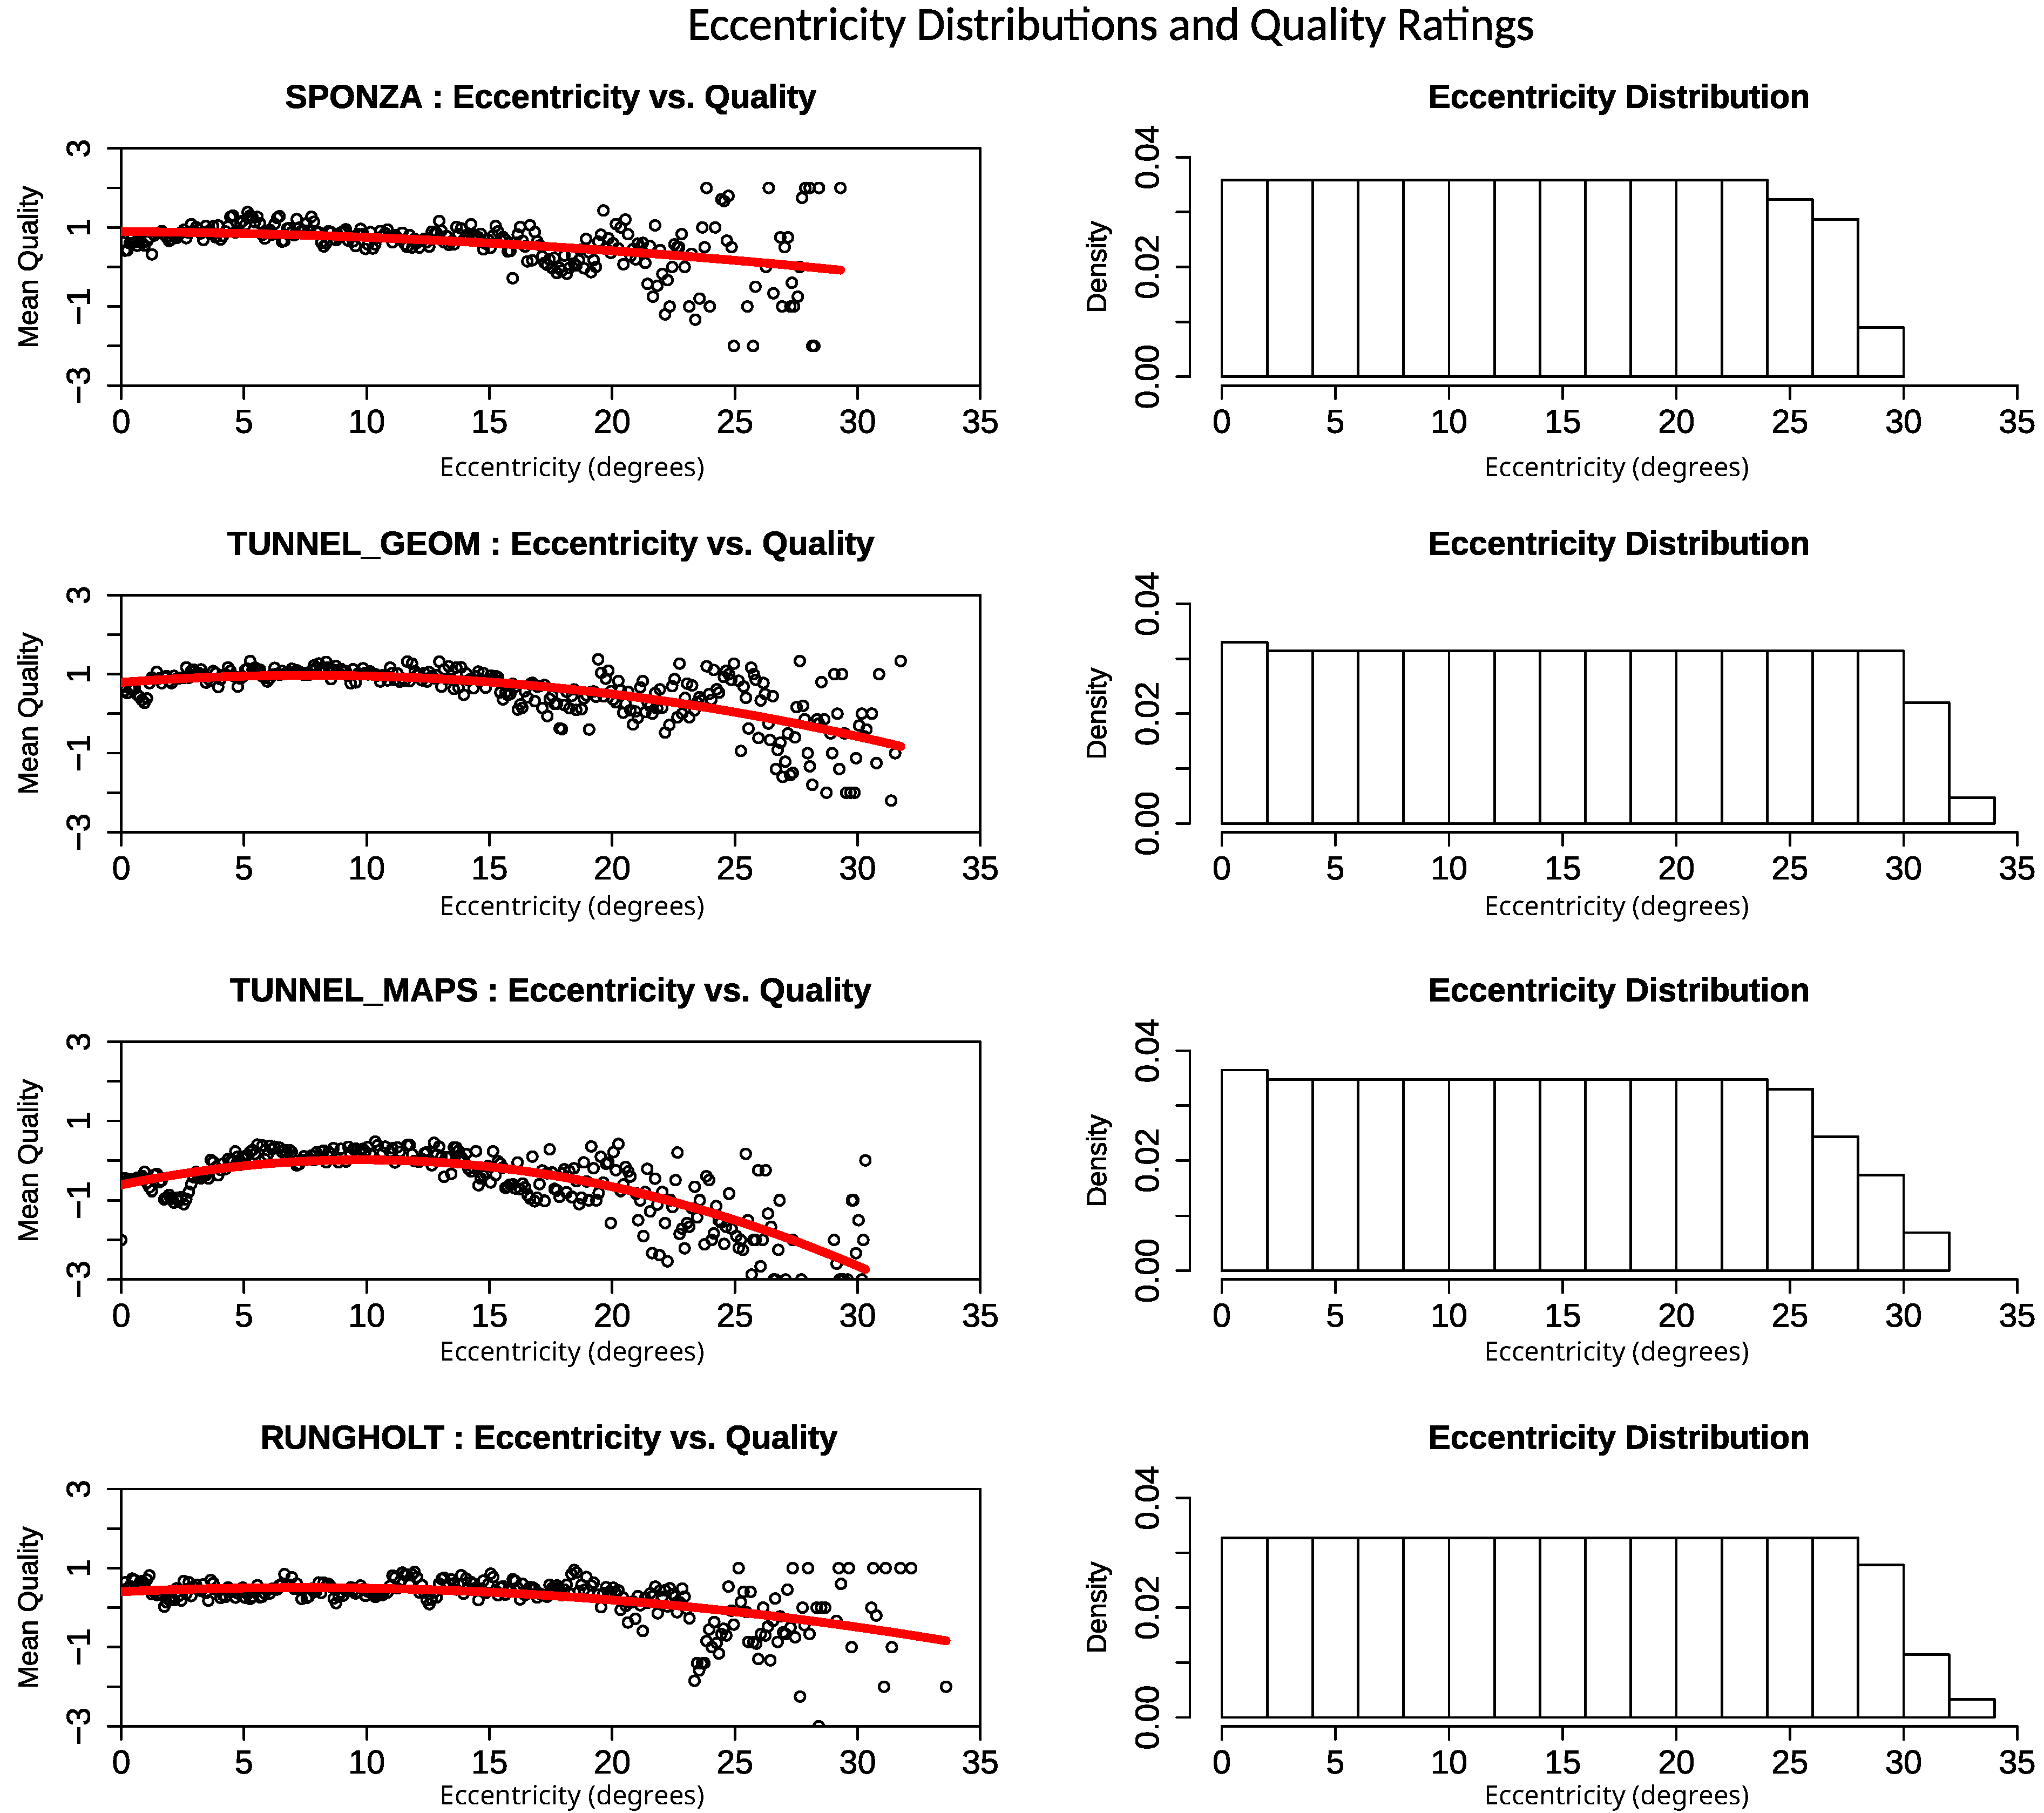
Tracking Precision
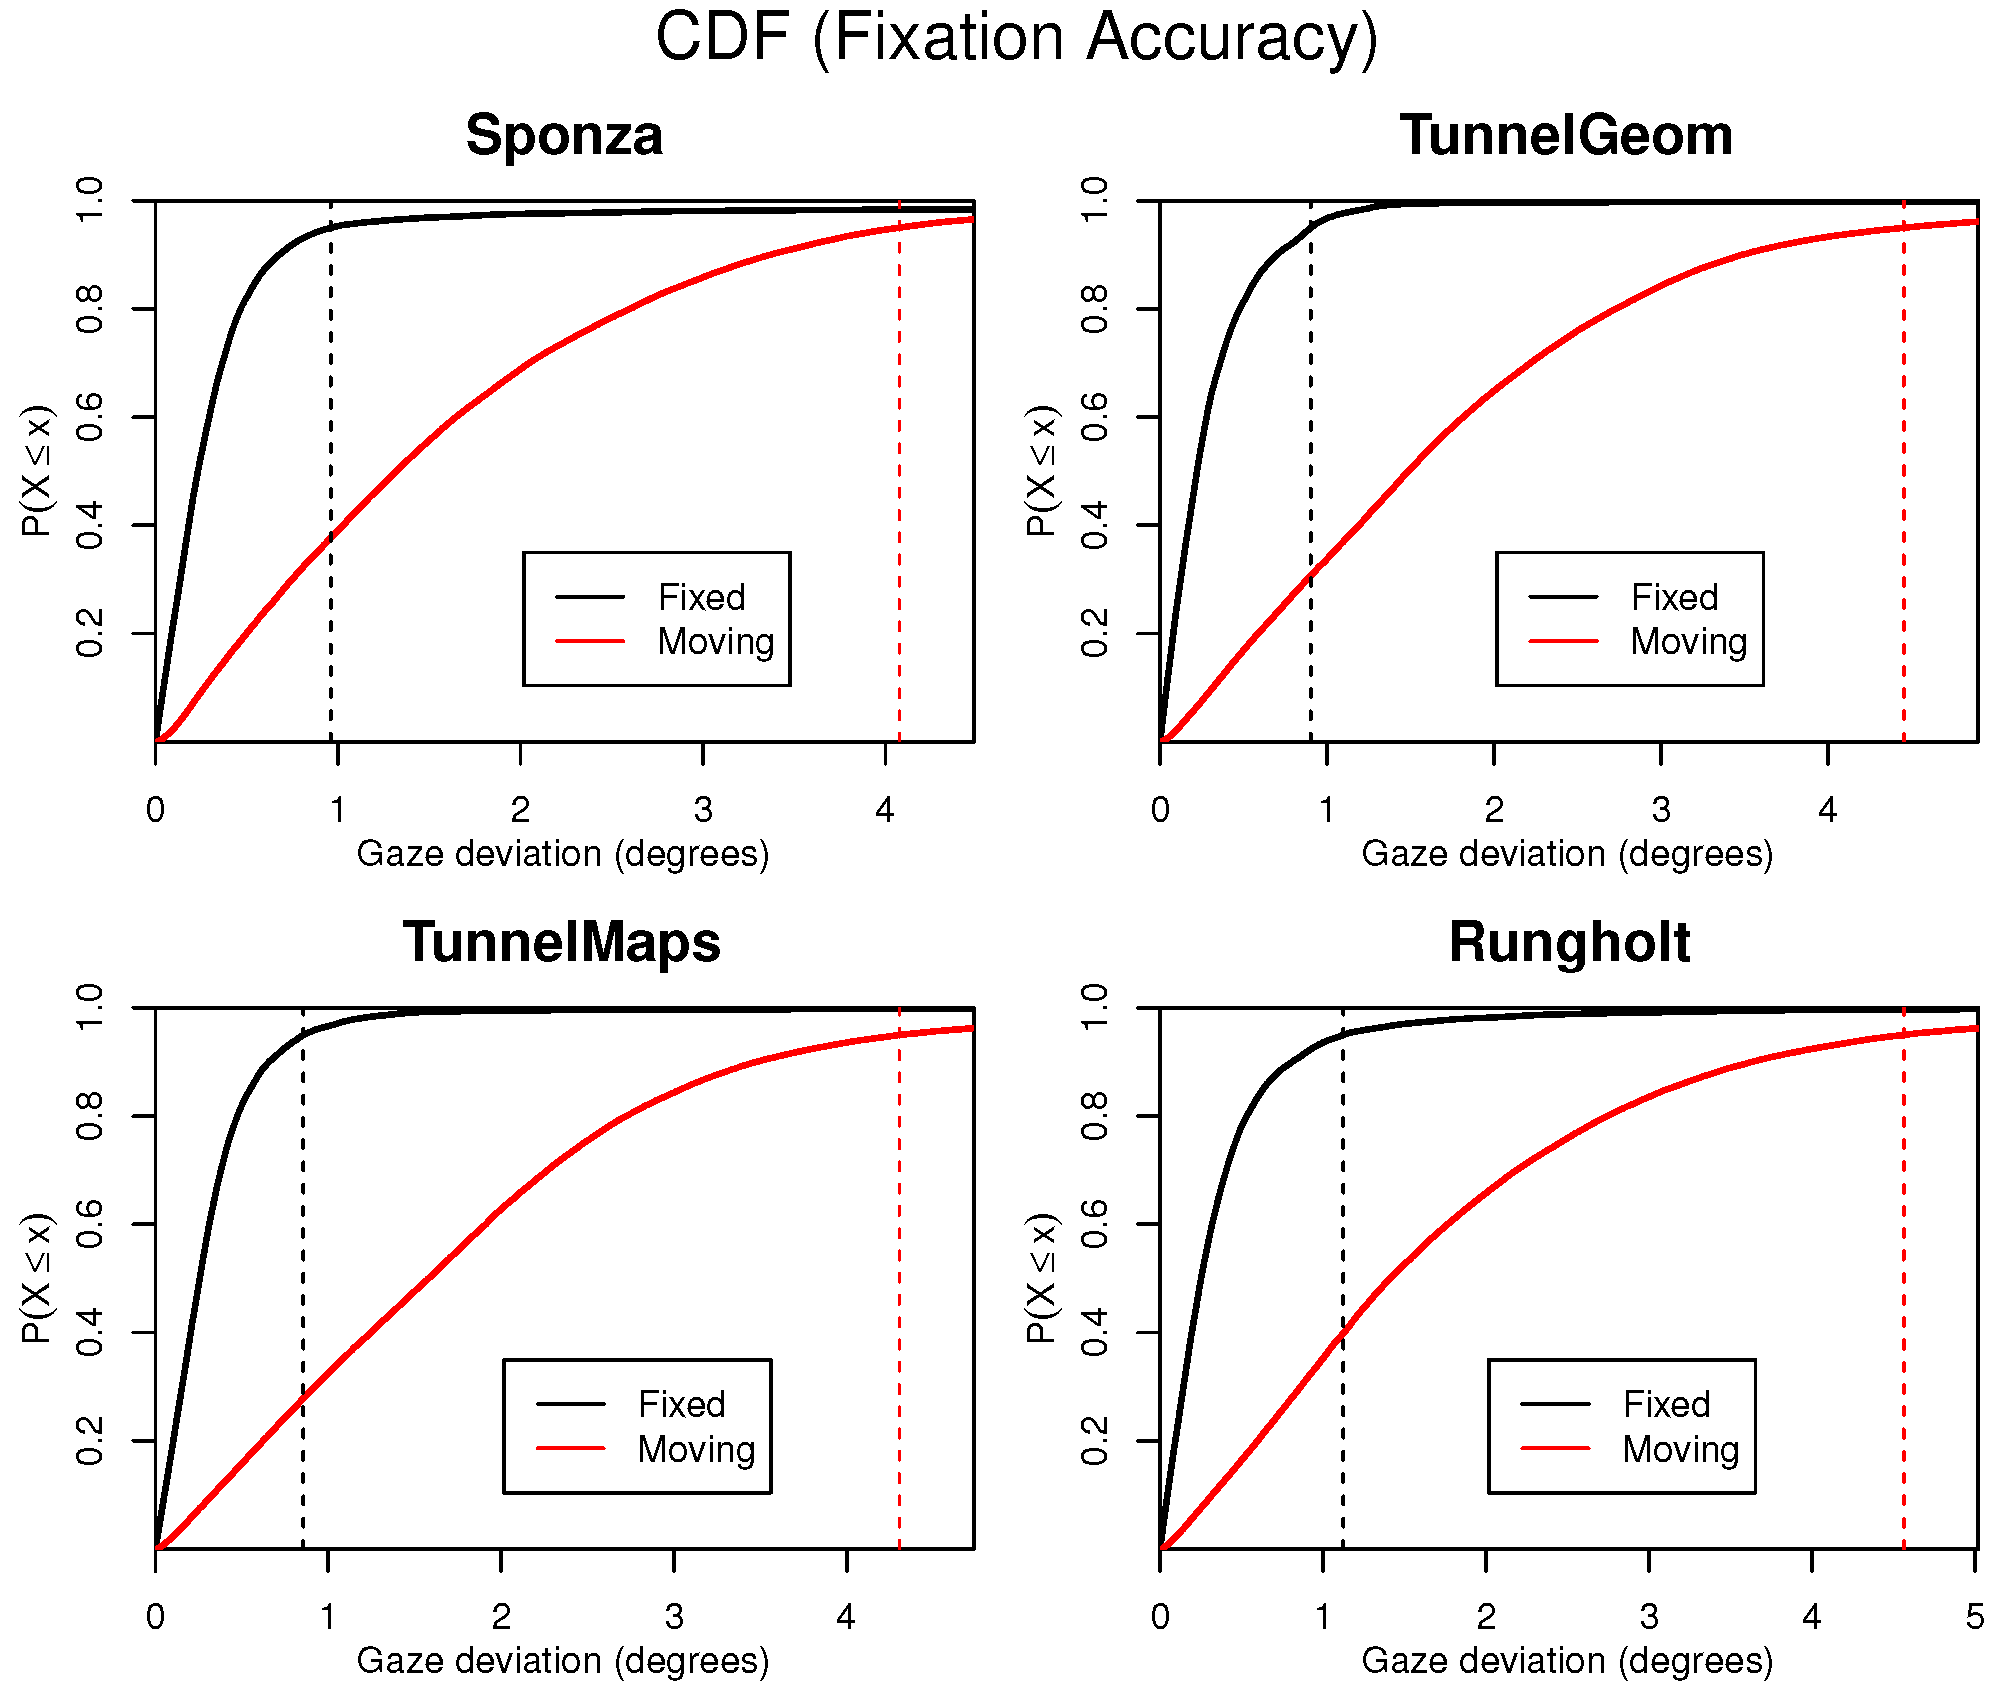
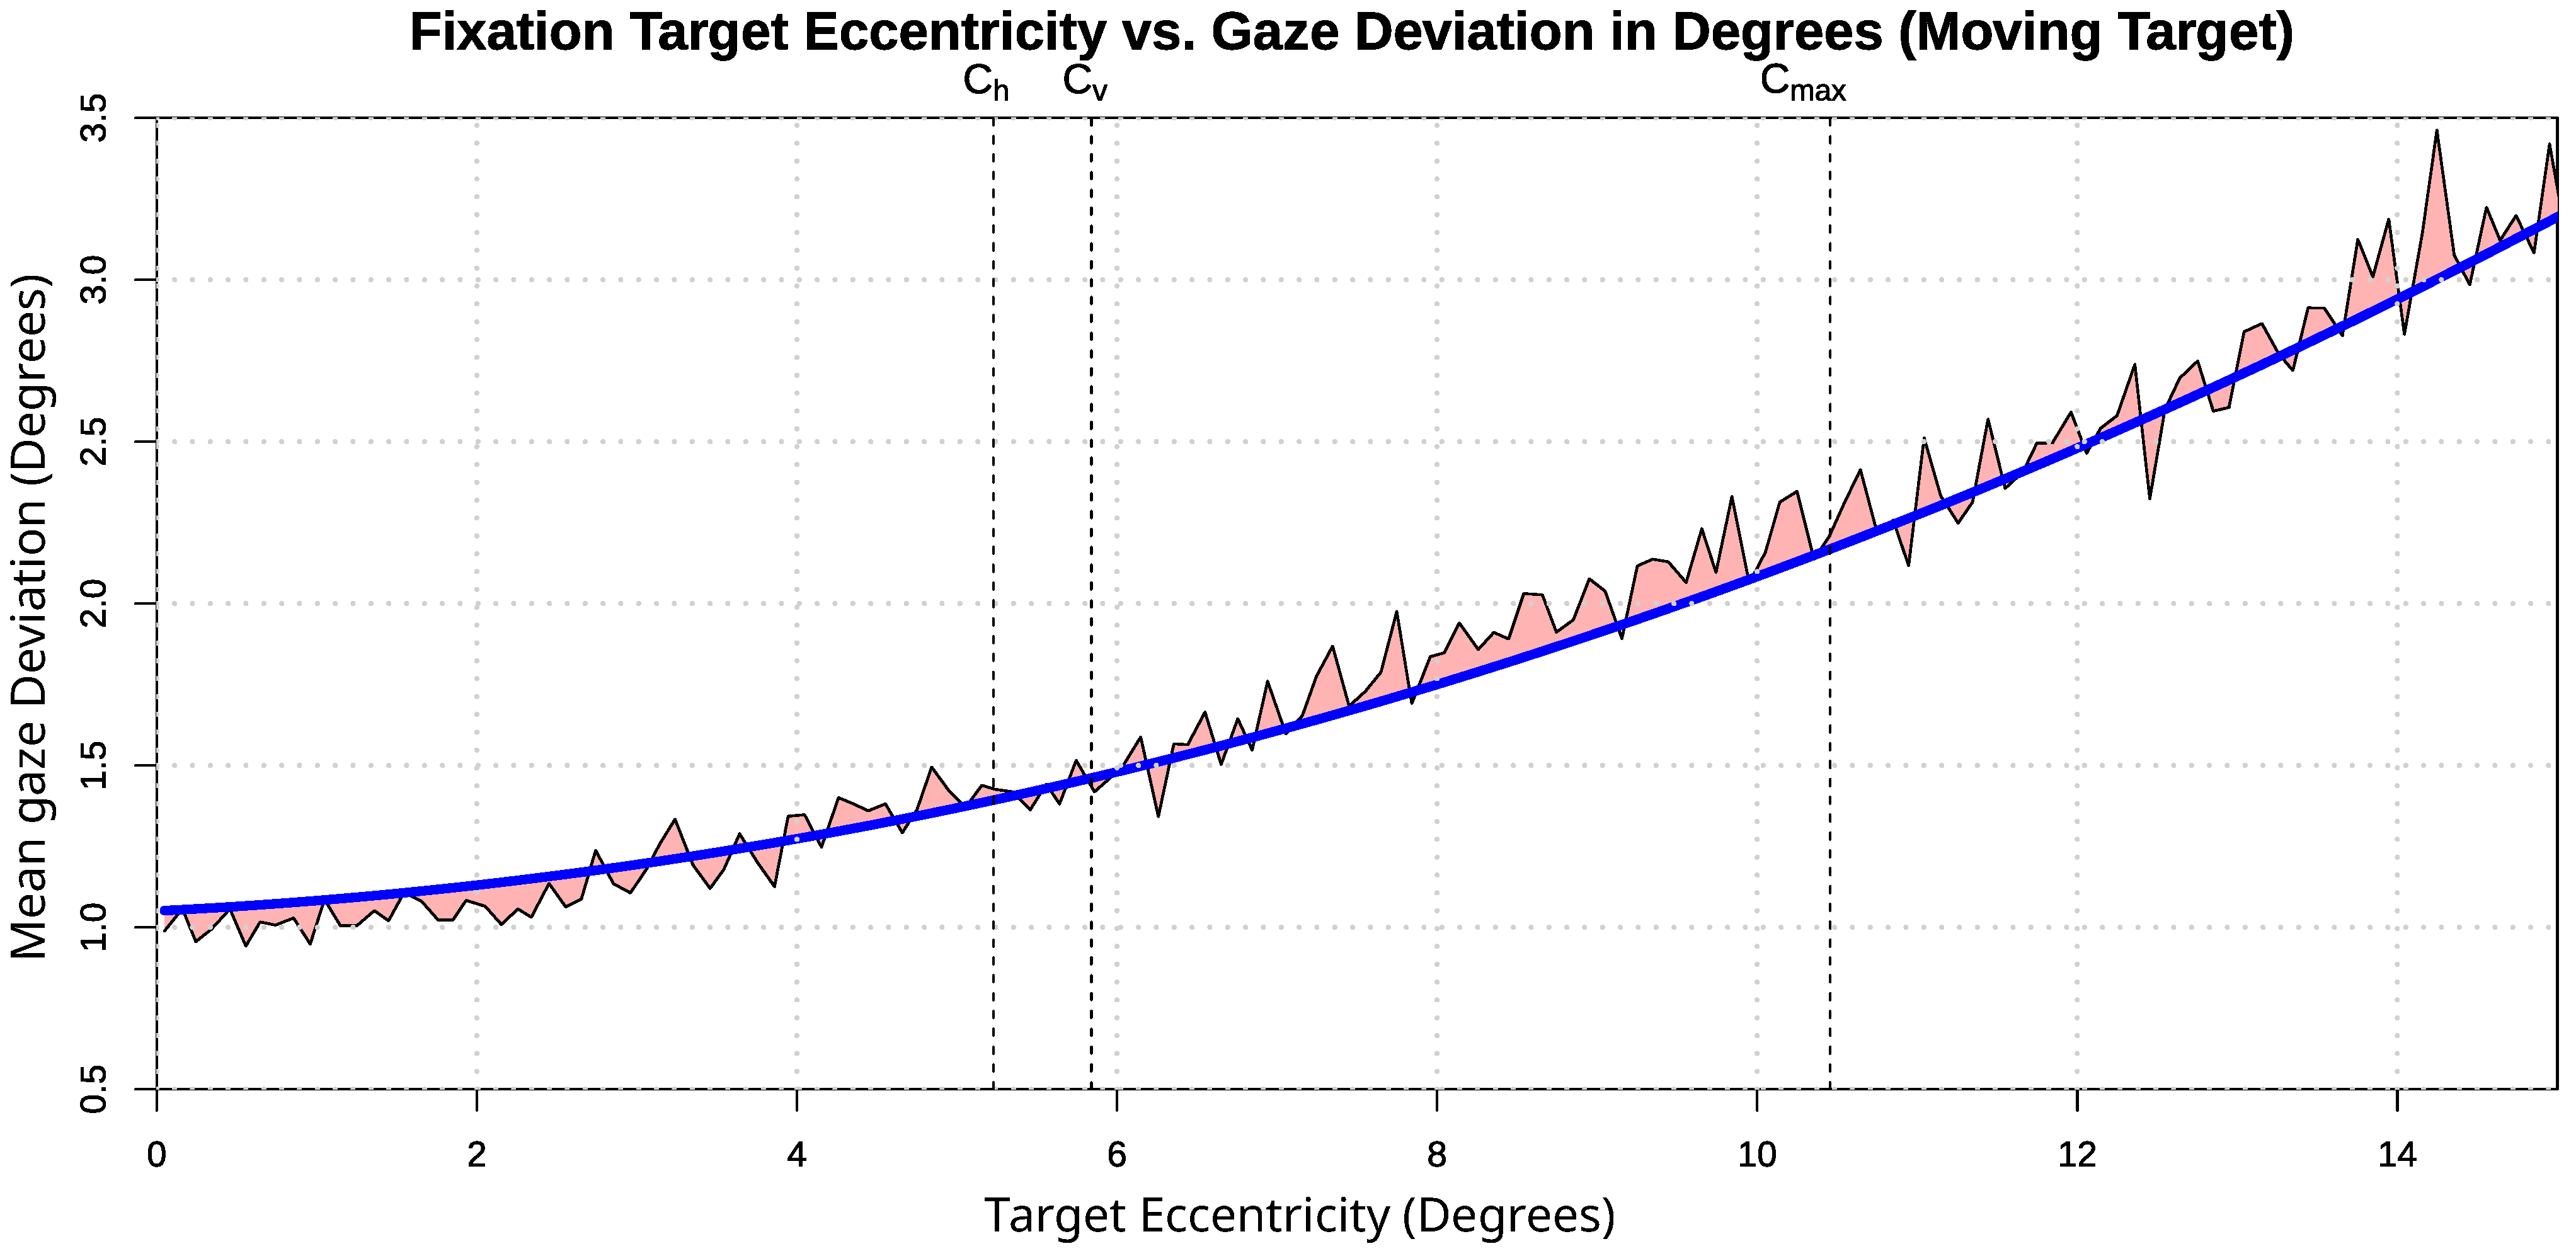
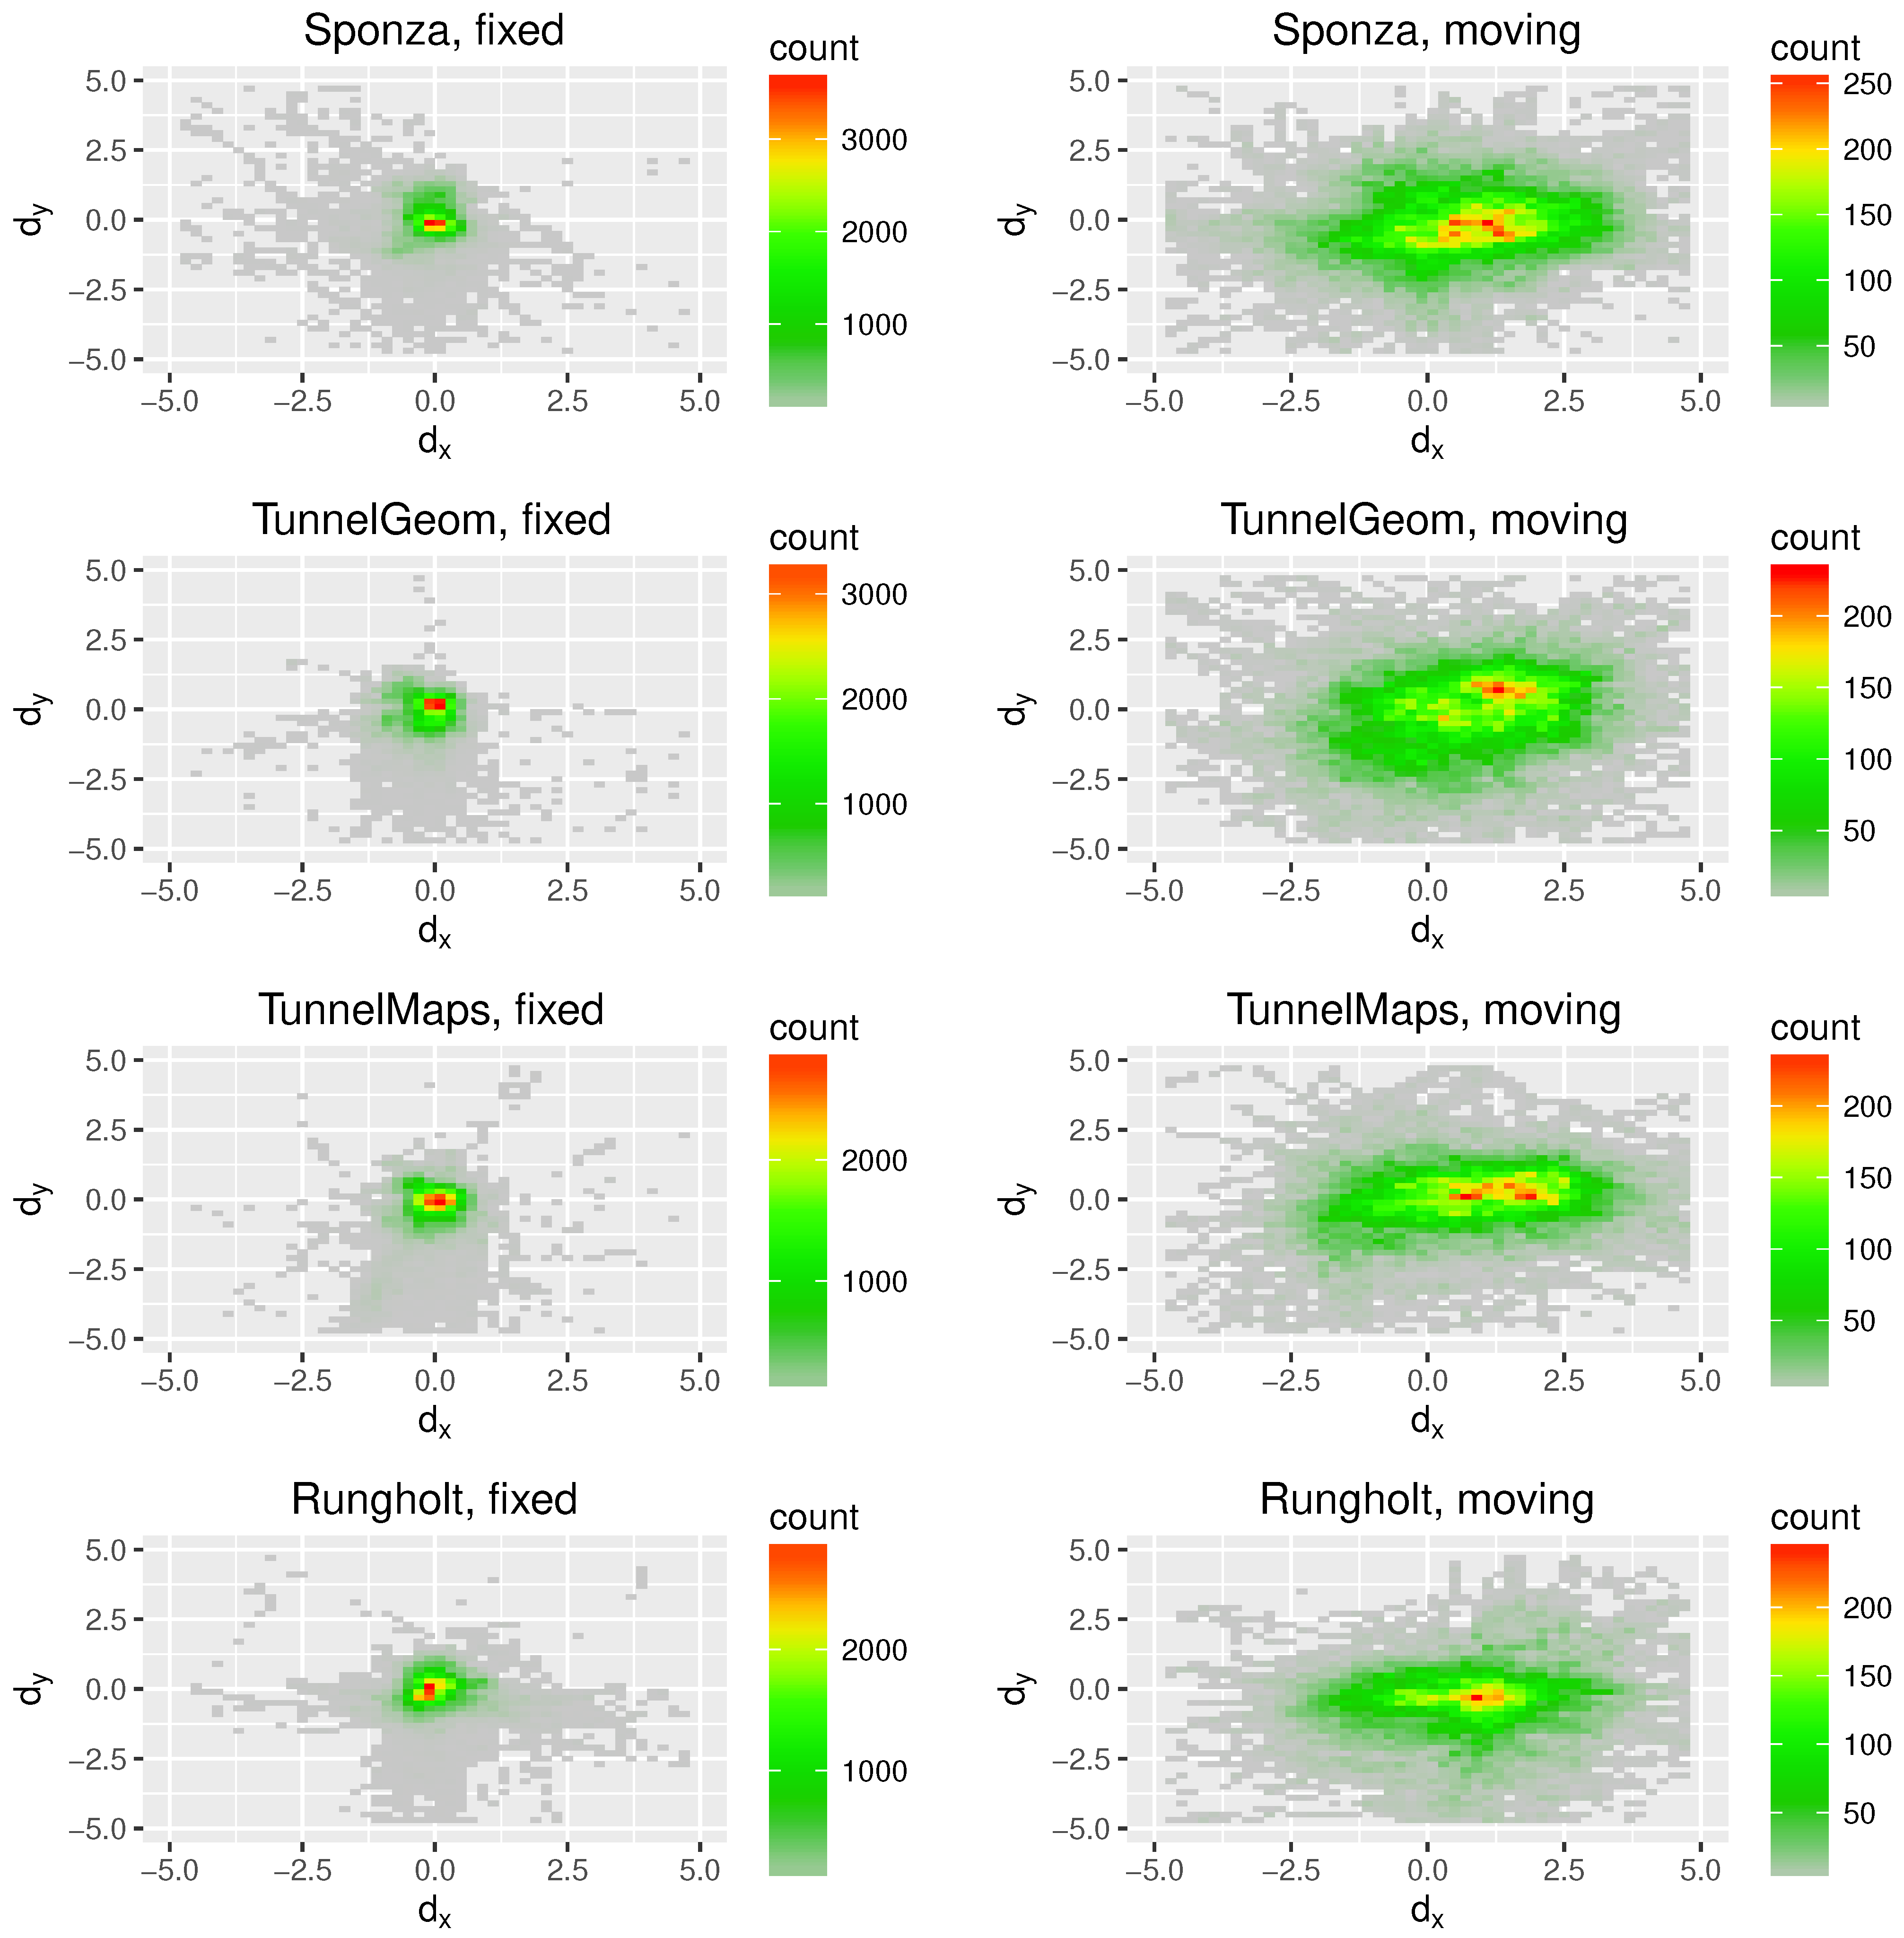
Fixation Accuracy
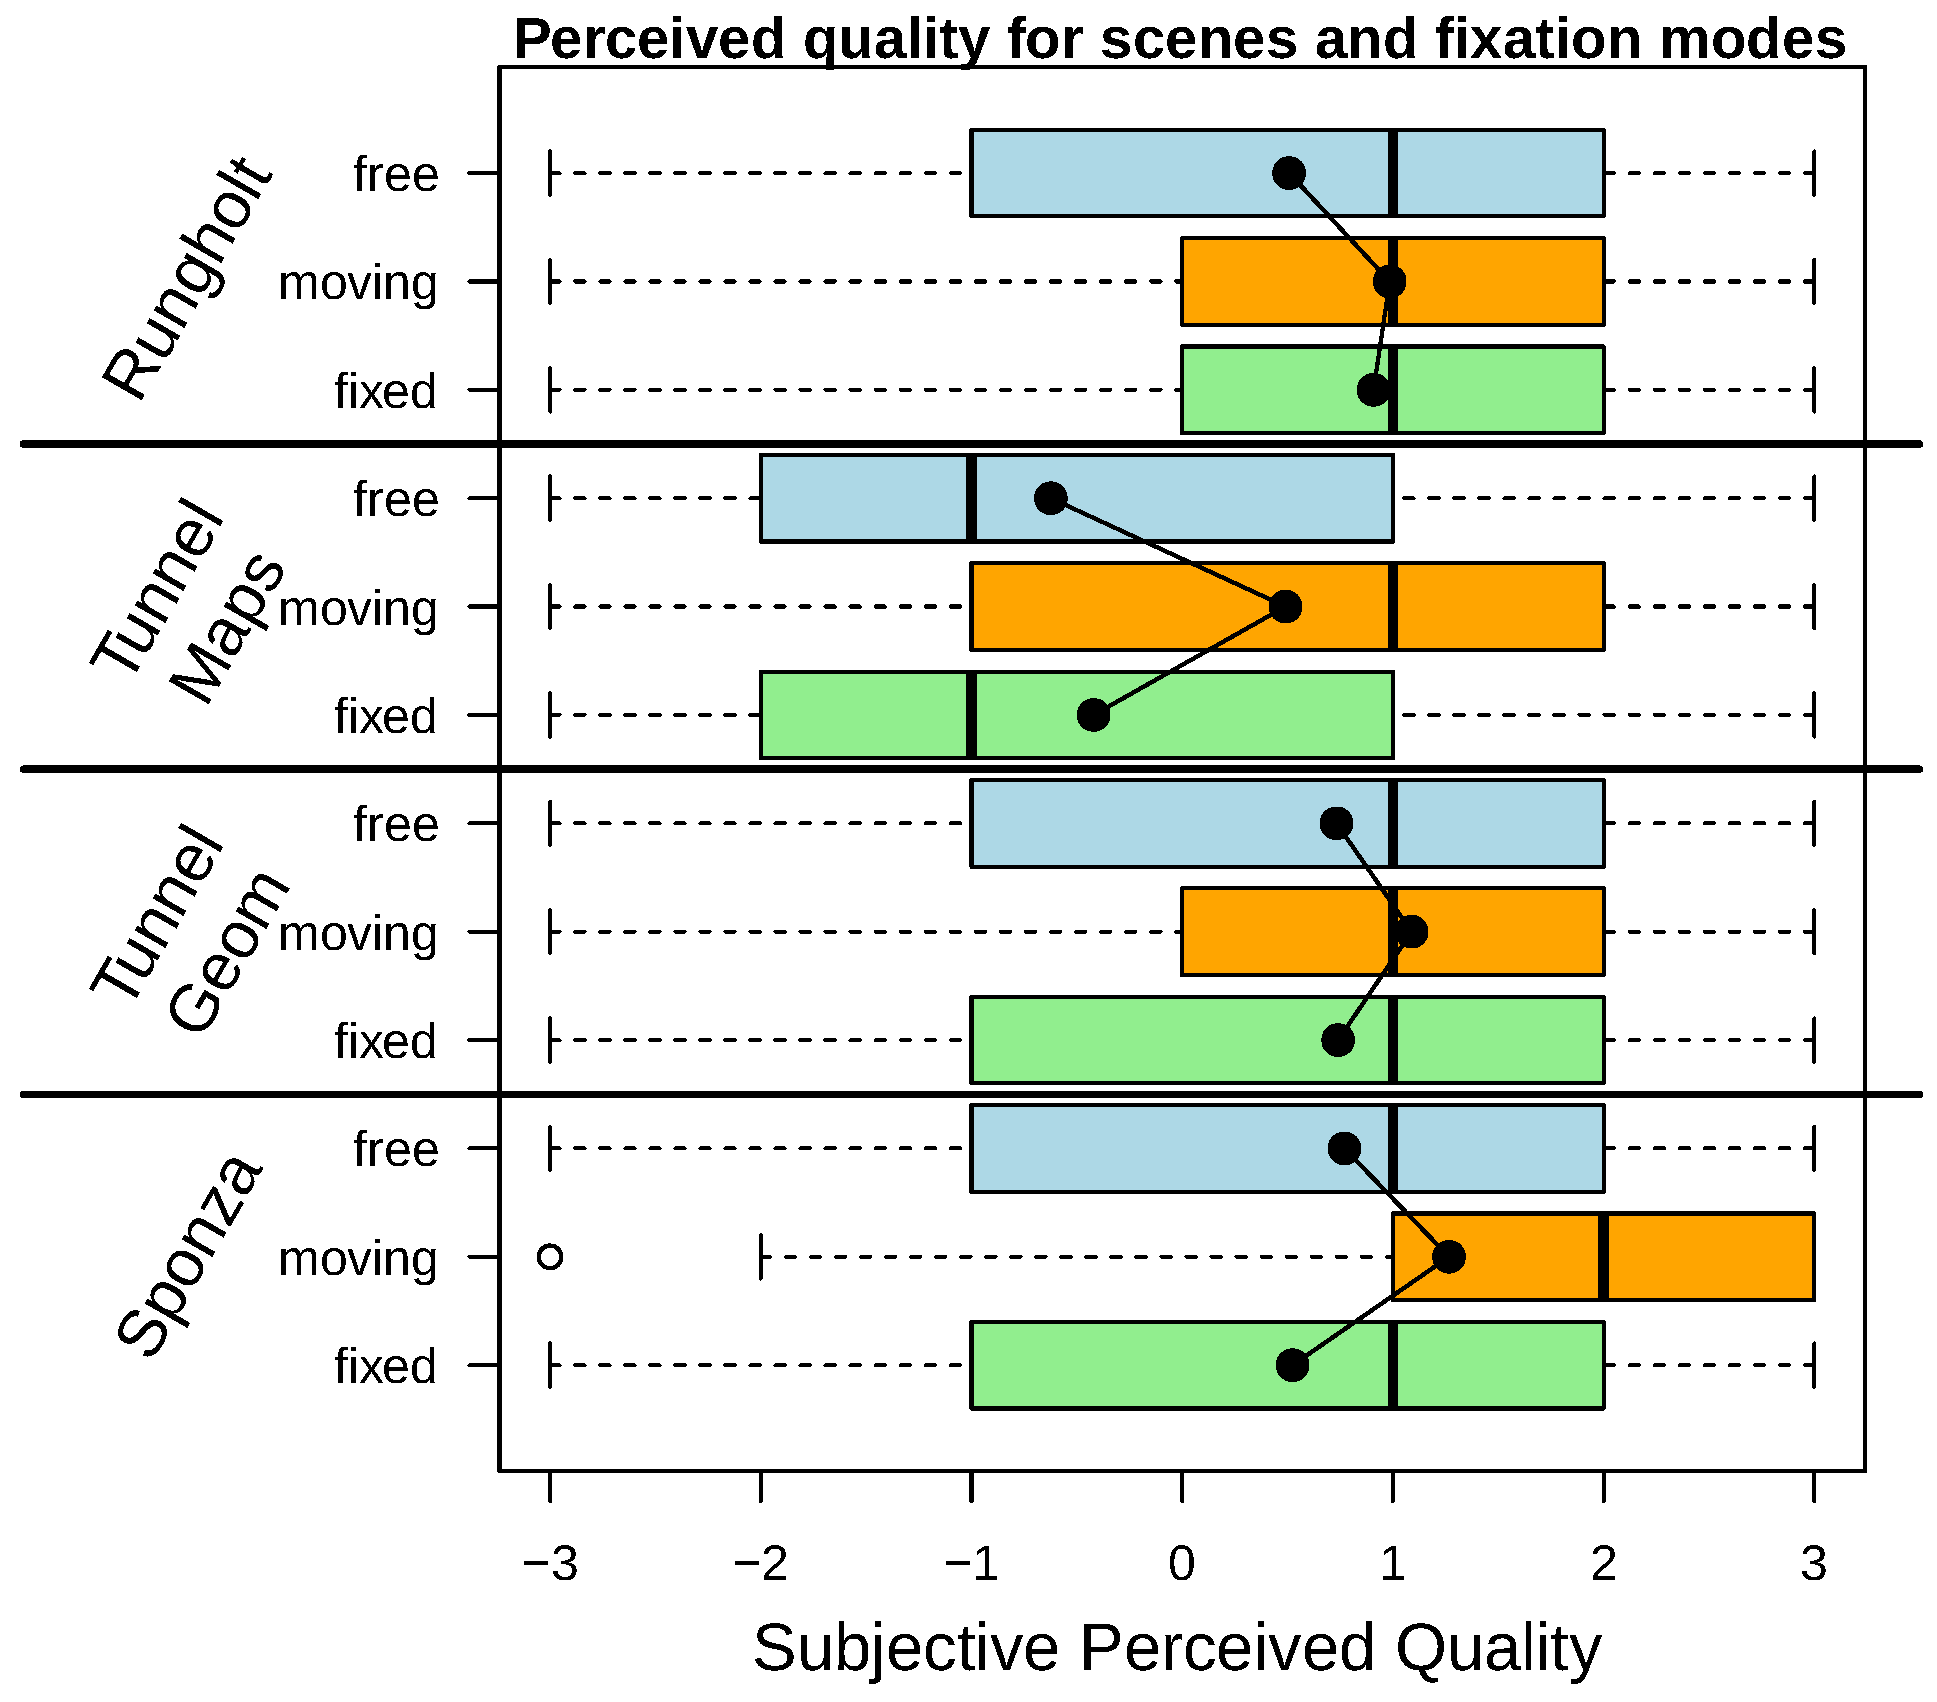
Subjective Perceived Quality: Fixed and Moving Target
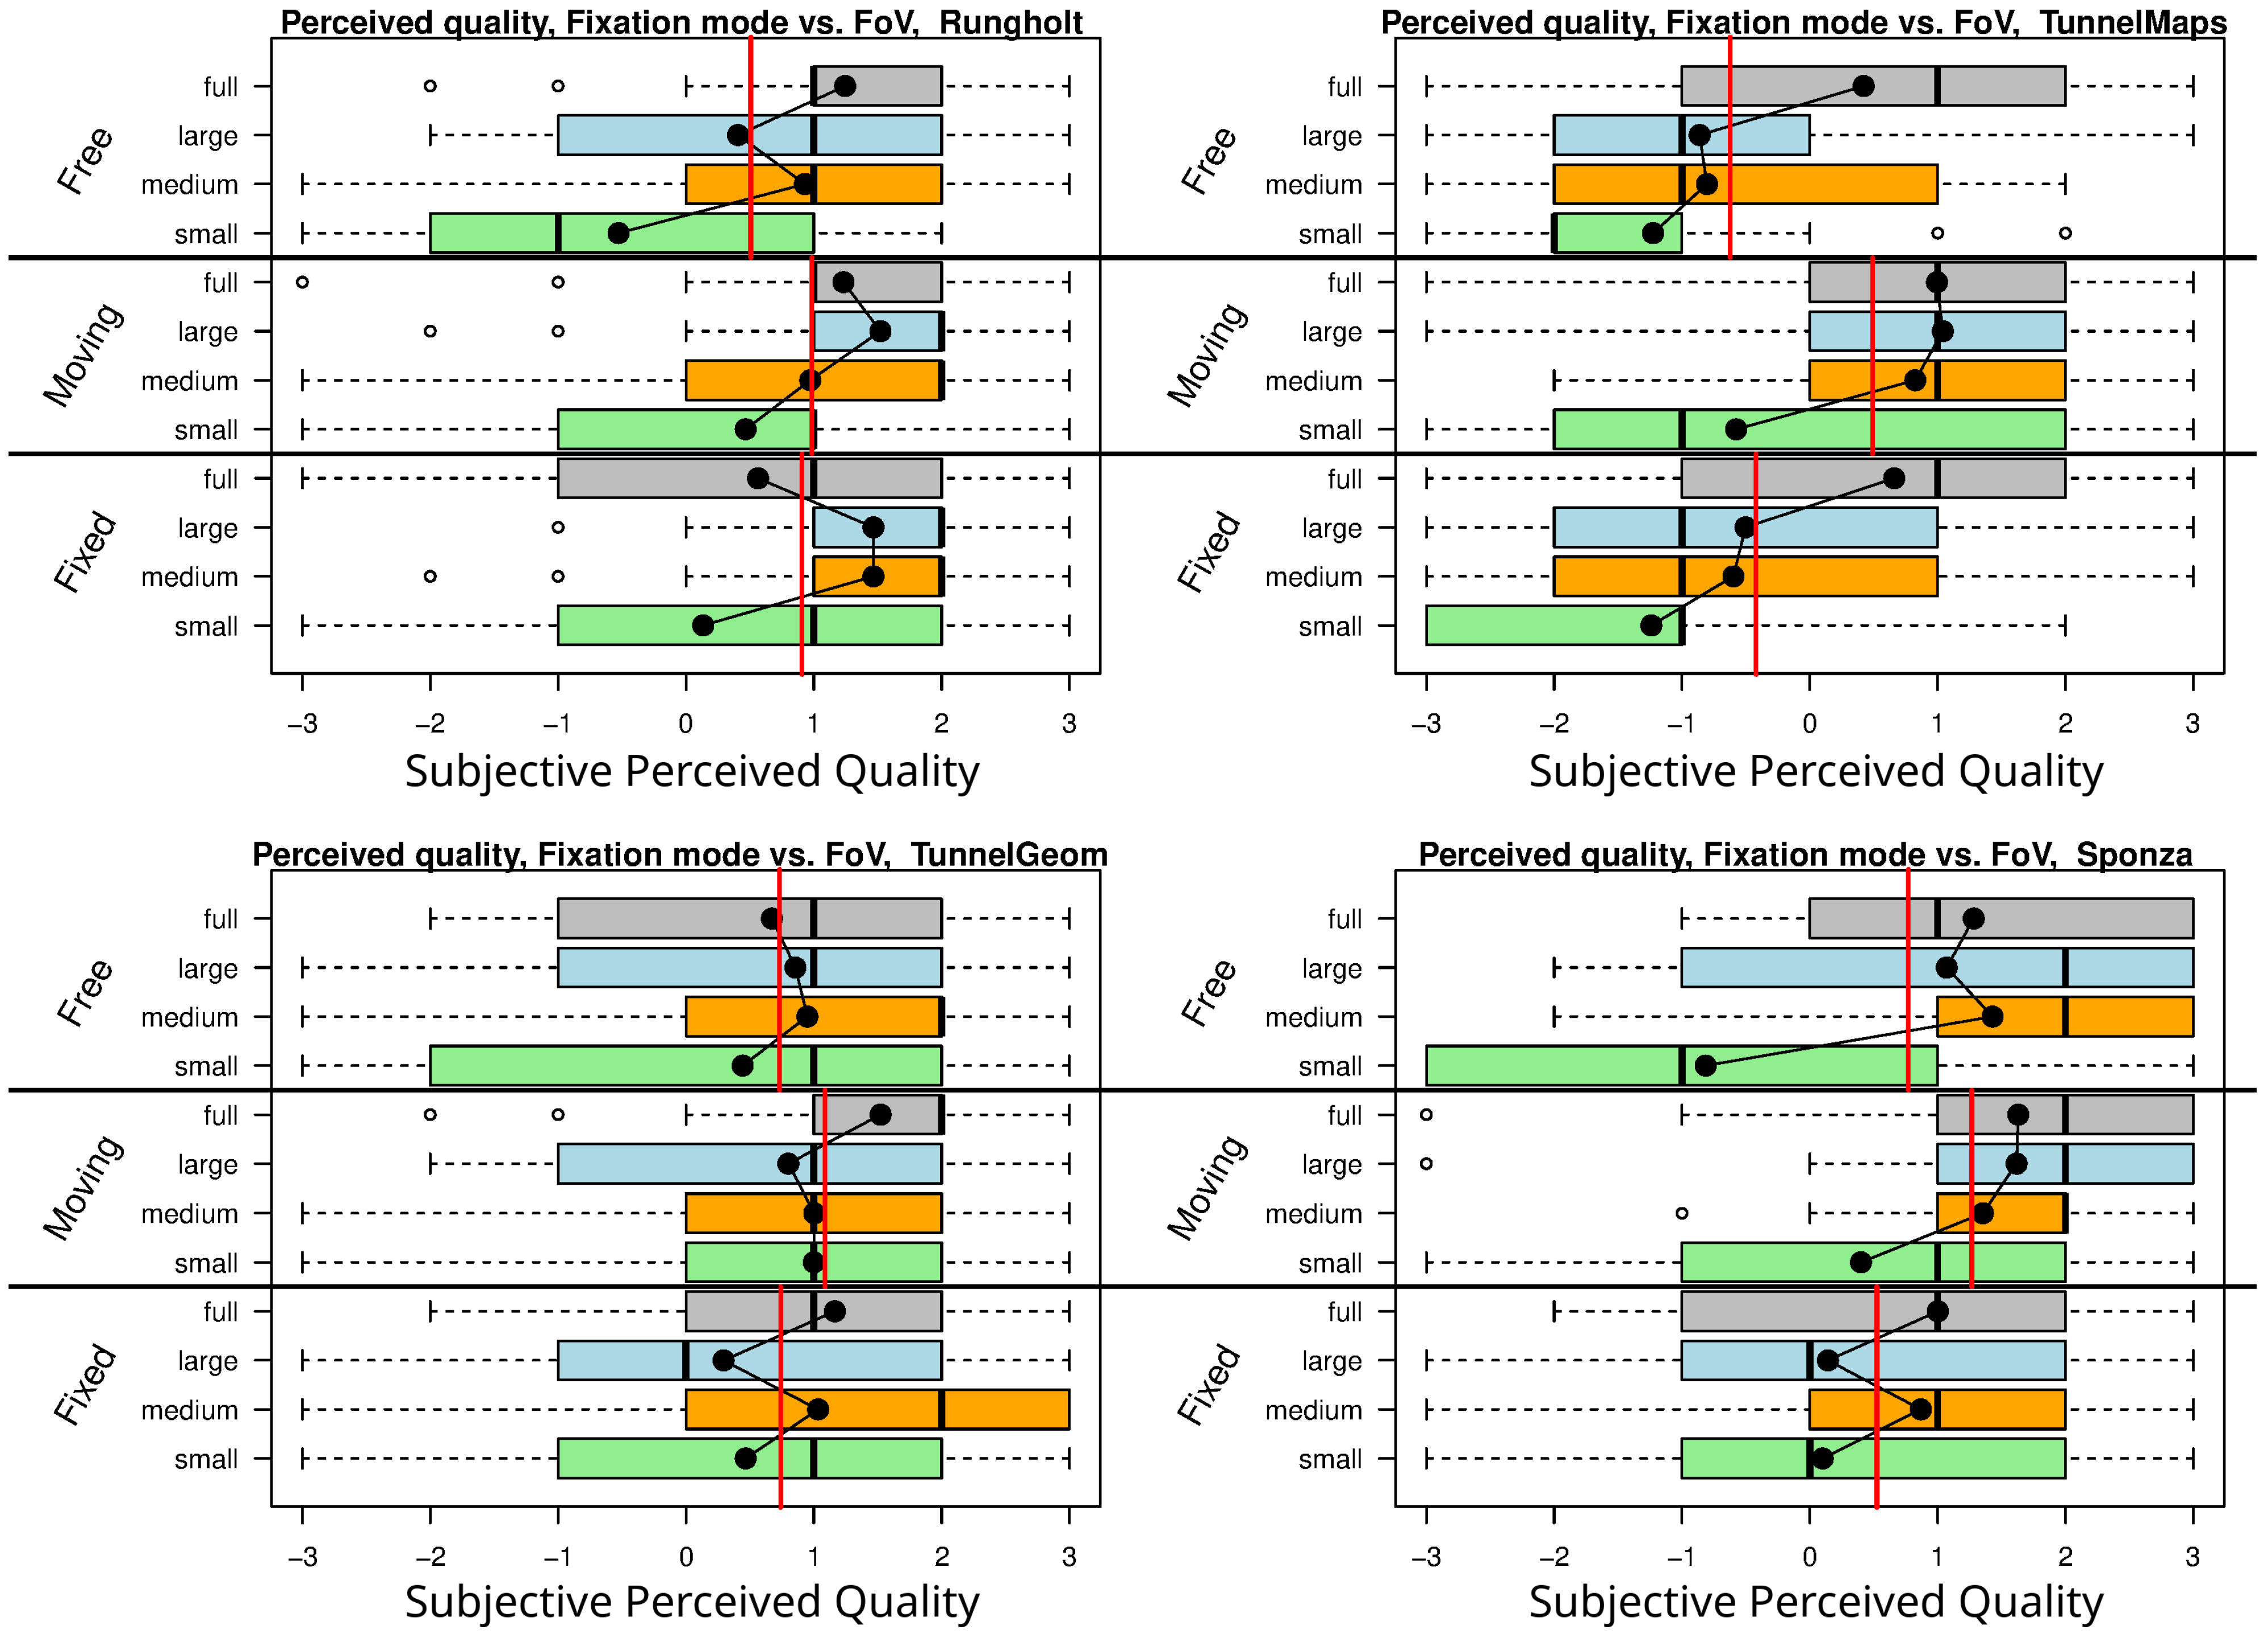
Subjective Perceived Quality: Free Focus
Discussion
Conclusion
Acknowledgments
Conflicts of Interest
References
- Adler, F. H., P. L. Kaufman, L. A. Levin, and A. Alm. 2011. Adler’s physiology of the eye. Elsevier Health Sciences. [Google Scholar]
- Corsini, M., M.-C. Larabi, G. Lavoué, O. Petrík, L. Váša, and K. Wang. 2013. Perceptual metrics for static and dynamic triangle meshes. ACM Eurographics ’12—STAR, Computer Graphics Forum 32, 1: 101–125. [Google Scholar] [CrossRef]
- Defense, D. 1999. Design criteria standard, human engineering, mil-std-1472f (Tech. Rep.). United States of America. [Google Scholar]
- Duchowski, A. T. 2007. Eye tracking methodology: Theory and practice. Springer-Verlag New York, Inc. [Google Scholar]
- Duchowski, A. T., D. Bate, P. Stringfellow, K. Thakur, B. J. Melloy, and A. K. Gramopadhye. 2009. On Spatiochromatic Visual Sensitivity and Peripheral Color LOD Management. ACM Transactions on Applied Perception (TAP) 6, 2: 9. [Google Scholar] [CrossRef]
- Funkhouser, T. A., and C. H. Séquin. 1993. Adaptive display algorithm for interactive frame rates during visualization of complex virtual environments. In 20th annual conference on Computer graphics and interactive techniques. ACM: pp. 247–254. [Google Scholar]
- Guenter, B., M. Finch, S. Drucker, D. Tan, and J. Snyder. 2012. Foveated 3D Graphics. ACM Transactions on Graphics 31, 6: 164. [Google Scholar]
- Hale, K. S., and K. M. Stanney. 2014. Handbook of virtual environments: Design, implementation, and applications, 2nd ed. CRC Press, Inc. [Google Scholar]
- Horvitz, E., and J. Lengyel. 1997. Perception, attention, and resources: A decision-theoretic approach to graphics rendering. In UAI. Morgan Kaufmann: pp. 238–249. [Google Scholar]
- Hunt, W. 2015. Virtual Reality: The Next Great Graphics Revolution. Keynote Talk HPG, August, Available online: http://www.highperformancegraphics.org/wp-content/uploads/2015/Keynote1/.
- Levoy, M., and R. Whitaker. 1990. Gaze-directed Volume Rendering. In Proceedings of the 1990 symposium on interactive 3d graphics. ACM: pp. 217–223. [Google Scholar]
- Loschky, L. C., and G. W. McConkie. 2000. User performance with gaze contingent multiresolutional displays. In Proceedings of the 2000 symposium on eye tracking research & applications. ACM: pp. 97–103. [Google Scholar]
- Loschky, L. C., and G. S. Wolverton. 2007. How late can you update gaze-contingent multiresolutional displays without detection? ACM Trans. Multimedia Comput. Commun. Appl. 3, 4: 7:1–7:10. [Google Scholar]
- Masia, B., G. Wetzstein, P. Didyk, and D. Gutierrez. 2013. A survey on computational displays: Pushing the boundaries of optics, computation, and perception. Computers & Graphics 37, 8: 1012–1038. [Google Scholar]
- McNamara, A., K. Mania, M. Banks, and C. Healey. 2010. Perceptually-motivated Graphics, Visualization and 3D Displays. In SIGGRAPH ’10, courses. ACM: pp. 7:1–7:159. [Google Scholar]
- Murphy, H., and A. T. Duchowski. 2001. Gaze-contingent level of detail rendering. In Eurographics 2001. [Google Scholar]
- Nehab, D., P. V. Sander, J. Lawrence, N. Tatarchuk, and J. R. Isidoro. 2007. Accelerating real-time shading with reverse reprojection caching. In Proceedings of the 22nd acm siggraph/eurographics symposium on graphics hardware. Eurographics Association: pp. 25–35. [Google Scholar]
- Ooms, K., L. Dupont, L. Lapon, and S. Popelka. 2015. Accuracy and precision of fixation locations recorded with the low-cost eye tribe tracker in different experimental set-ups. Journal of Eye Movement Research 8, 1. [Google Scholar] [CrossRef]
- Ringer, R. V., A. P. Johnson, J. G. Gaspar, M. B. Neider, J. Crowell, A. F. Kramer, and et al. 2014. Creating a new dynamic measure of the useful field of view using gaze-contingent displays. In Proceedings of the symposium on eye tracking research and applications. ACM: pp. 59–66. [Google Scholar]
- Roth, T., M. Weier, A. Hinkenjann, Y. Li, and P. Slusallek. 2016. An Analysis of Eye-tracking Data in Foveated Ray Tracing. In Second Workshop on Eye Tracking and Visualization (ETVIS 2016), Baltimore, USA. October. pp. 69–73. [Google Scholar]
- Saunders, D. R., and R. L. Woods. 2013. Direct measurement of the system latency of gaze-contingent displays. Behavior Research Methods 46, 2: 439–447. [Google Scholar] [CrossRef] [PubMed]
- Sharma, A., and P. Abrol. 2016. Direction estimation model for gaze controlled systems. Journal of Eye Movement Research 9, 6. [Google Scholar]
- Strasburger, H., I. Rentschler, and M. Jüttner. 2011. Peripheral vision and pattern recognition: A review. Journal of vision 11, 5: 1–82. [Google Scholar]
- Waldin, N., M. Waldner, and I. Viola. 2017. Flicker Observer Effect: Guiding Attention Through High Frequency Flicker in Images. In Computer Graphics Forum. [Google Scholar]
- Wandell, B. A. 1995. Foundations of Vision. Stanford University. [Google Scholar]
- Watson, B., N. Walker, L. F. Hodges, and A. Worden. 1997. Managing Level of Detail Through Peripheral Degradation: Effects on Search Performance with a Head-mounted Display. ACM Trans. Comput.-Hum. Interact. 4, 4: 323–346. [Google Scholar]
- Weier, M., T. Roth, E. Kruijff, A. Hinkenjann, A. Pérard-Gayot, P. Slusallek, and et al. 2016. Foveated real-time ray tracing for head-mounted displays. In Proceedings of the 24th pacific conference on computer graphics and applications. Eurographics Association: pp. 289–298. [Google Scholar] [CrossRef]
- Weier, M., M. Stengel, T. Roth, P. Didyk, E. Eisemann, M. Eisemann, and et al. 2017. Perception-driven Accelerated Rendering. In Computer Graphics Forum. [Google Scholar]
- Yang, L., D. F. Nehab, P. V. Sander, P. Sitthi-amorn, J. Lawrence, and H. Hoppe. 2009. Amortized super-sampling. ACM Trans. Graph. 28, 5: 135:1–135:12. [Google Scholar]
- Yee, H., S. Pattanaik, and D. P. Greenberg. 2001. Spatiotemporal Sensitivity and Visual Attention for Efficient Rendering of Dynamic Environments. ACM Trans. Graph. 20, 1: 39–65. [Google Scholar]
Copyright © 2017. This article is licensed under a Creative Commons Attribution 4.0 International License.
Share and Cite
Roth, T.; Weier, M.; Hinkenjann, A.; Li, Y.; Slusallek, P. A Quality-Centered Analysis of Eye Tracking Data in Foveated Rendering. J. Eye Mov. Res. 2017, 10, 1-12. https://doi.org/10.16910/jemr.10.5.2
Roth T, Weier M, Hinkenjann A, Li Y, Slusallek P. A Quality-Centered Analysis of Eye Tracking Data in Foveated Rendering. Journal of Eye Movement Research. 2017; 10(5):1-12. https://doi.org/10.16910/jemr.10.5.2
Chicago/Turabian StyleRoth, Thorsten, Martin Weier, André Hinkenjann, Yongmin Li, and Philipp Slusallek. 2017. "A Quality-Centered Analysis of Eye Tracking Data in Foveated Rendering" Journal of Eye Movement Research 10, no. 5: 1-12. https://doi.org/10.16910/jemr.10.5.2
APA StyleRoth, T., Weier, M., Hinkenjann, A., Li, Y., & Slusallek, P. (2017). A Quality-Centered Analysis of Eye Tracking Data in Foveated Rendering. Journal of Eye Movement Research, 10(5), 1-12. https://doi.org/10.16910/jemr.10.5.2