Multimodal Comprehension of Language and Graphics: Graphs with and Without Annotations
Abstract
:Introduction
Theoretical Aspects and the Purpose of the Study
Methods
Participants and Materials
- i.
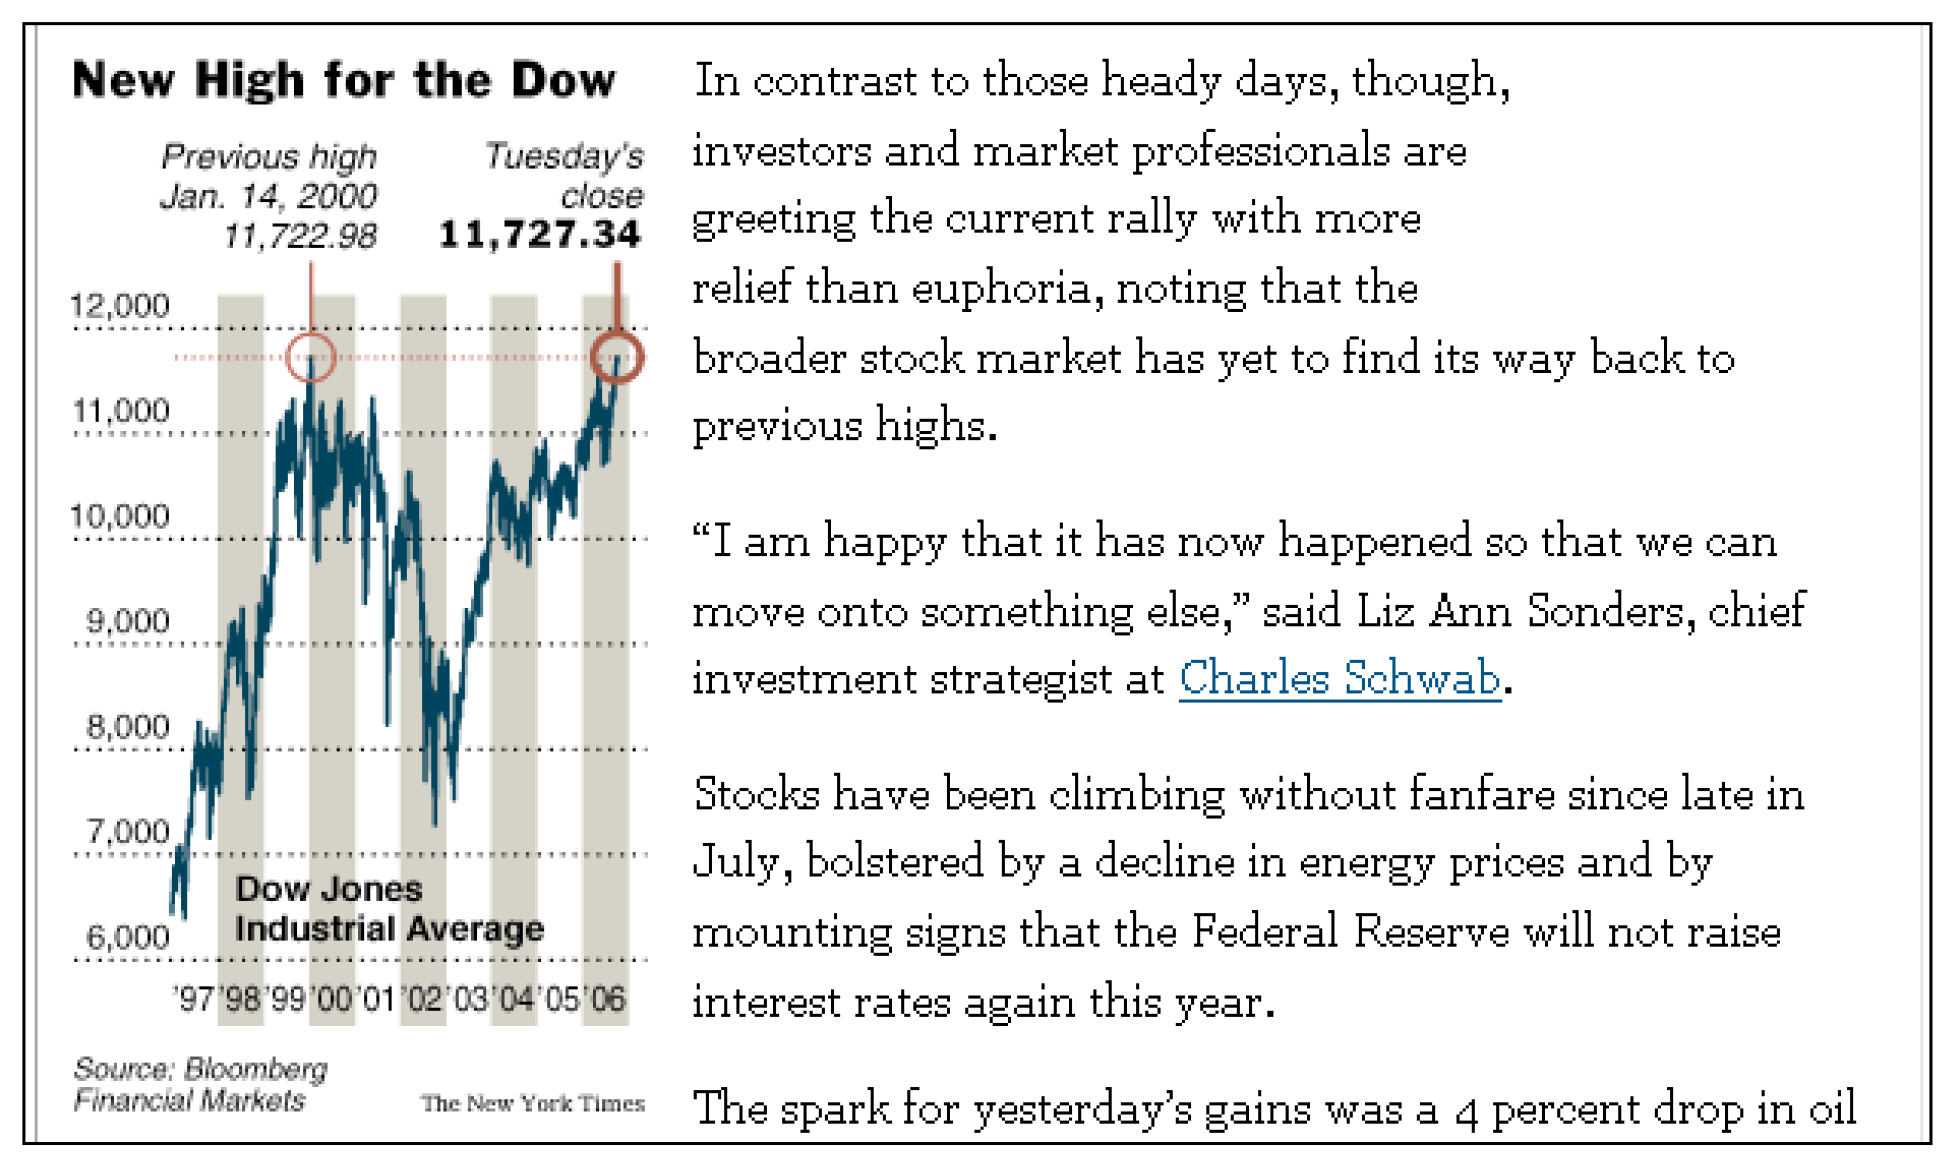
- Text plus annotated graph condition (shortly, annotated-graph condition): In this condition, the paragraphs were presented together with the accompanying graph. In addition, the graph included linguistic annotations.
- ii.
- Text plus non-annotated-graph condition (shortly, non-annotated-graph condition): In this condition, the paragraphs were presented together with the accompanying graph, but the graph did not include linguistic annotations.
- iii.
- Text-only condition: In this condition, the paragraphs were presented without an accompanying graph.

Procedure
Analysis
Results
Analysis of Eye Movement Parameters
General Characteristics of Scan Paths
- i.
- Main Title region: This region corresponds to the Main Title AOI. It covers only the main title of the document.
- ii.
- Paragraphs region: This region corresponds to the Paragraphs AOI. It covers only the paragraphs in the document.
- iii.
- Graph region: This region corresponds to the sum of the remaining AOIs. It covers the graph (proper), axes, graph title, and annotations.
Analysis of Answers to Post-test Questions
Discussion
Conclusions
Acknowledgments
Appendix A
Appendix A.1. Mean Fixation Counts

 |
Appendix A.2. Mean Gaze Times
  |
Appendix A.3. Post-test Scores
 |
| i | In this paper, we use the term “modality” as shorthand for “representational modality” (see Bernsen, 1994). Accordingly, the term “multimodal document” is used for “a document that includes more than one representational modality,” such as a document with text and illustrations. “Multimodality” concerning various “sensory modalities” is beyond the scope of this study, since the processing of multimodal documents containing text and diagrams—and presented on paper or a computer screen—is based on the visual sensory modality only. |
| ii | “Information graphics,” as used in the present paper, subsumes graphs, diagrams, and charts as characterized by Kosslyn (1989). Furthermore, information graphics seems to correspond largely to “diagrams” as focused on in Chabris and Kosslyn (2005) and “arbitrary pictures” discussed by Alesandrini (1984). In the following, we use the term “graph” as shorthand for “information graphics,” or statistical graphs representing relations between abstract variables. |
| iii | There is no clear-cut border between perception and comprehension of graphs. What we mean by “comprehension” is task-dependent processes beyond perception such as problem solving, which are also discussed extensively in Artificial Intelligence. |
| iv | The integration task partially corresponds to comprehension of language during perception of the visual world (Henderson & Ferreira, 2004). However, it differs from the “visual world” case since graphs are conventionalized representations, specified by syntactic and semantic principles. |
| v | Ainsworth (2006) has a similar line of argumentation independent of Chabris and Kosslyn (2005) with respect to learning with multiple representations. |
| vi | We use the term “annotation” to refer to verbal elements (i.e., annotation labels or annotation text) that are connected to specific parts of a graph (e.g., the top or the maximum point in a line graph) via connecting symbols (e.g., a symbol such as a circle attached to a thin straight line). We use the term “foregrounding”, within the framework of mental model approaches, to mean activation of certain elements (tokens) and retainment of this information foregrounded during comprehension (see Zwaan & Radvansky, 1998; Glenberg, Meyer, & Lindem 1987). |
| vii | It should be noted that the term “annotation” has different meanings in literature. For example, an author’s personal marks on a working paper or marks for communicative purposes in coauthoring activities are also called annotations. Although both are used for communicative purposes, our use of the term “annotation” is different than those used in co-authoring activities. Annotations are also used in a different way than “captions” (i.e. verbal descriptions of the figure, located generally below the figure and starting with a phrase like Figure 1.). Although both enrich an illustration in a way that labels and legends cannot achieve (Preim, Michel, Hartmann, & Strothotte, 1998), figure captions refer to a whole illustration, while annotations refer to the parts of a graph. In addition, we use static annotations in static documents and hypertext rather than dynamic annotations in animations and video files. Last of all, our use of the term “annotation” has a more descriptive than instructive aspect in Bernard’s (1990) terminology. |
| viii | The original articles were: ©The New York Times. Dow Jones Index Hits a New High, Retracing Losses, by Vikas Bajaj, published on October 4, 2006 (translated to Turkish by the experimenter); ©Radikal. Endeks 30 bin sınırını aştı [The Index exceeded the 30 thousand limit (Translation by the experimenter)], published on August 5, 2005; ©Sabah. Borsa, Mayıs 2006’ya geri döndü [The stock market retraced to May 2006 (Translation by the experimenter)], published on January, 25, 2007. |
| ix | Hegarty and Just (1993) have included gazes with a duration of more than 250 ms on the text as well as gazes with a duration of more than 100 ms on the diagram components in their analysis of text-pulley diagram documents. On the other hand, other researchers include gazes with fixation durations less than these values for other types of stimuli. For example, Underwood, Jebbett, and Roberts (2004) include gazes with a fixation duration above 60 ms in the analysis of real world photographs. The time to encode sufficient information for object identification is about 50-75 ms, the value being found by eye-contingent masking technique (Rayner, 1998). In this study, for the sake of being conservative with respect to text-graph co-reference constructions specifically, we included gazes above 100 ms in the analysis. The outlier data was eliminated by excluding data above or below mean plus/minus two standard deviations. |
| x | This is astonishing, since thorough discussions about types of illustrations started in the 1980s (Alesandrini, 1984; Peeck, 1987; Winn, 1987). |
| xi | The veridicality commitments of drawings are less strict, but—as Chabris and Kosslyn (2005) argue for the sub-case of caricatures—this property of drawings can facilitate processing. |
References
- Acarturk, C., C. Habel, and K. Cagiltay. 2008. Multimodal comprehension of graphics with textual annotations: The role of graphical means relating annotations and graph lines. In Diagrammatic representation and inference: Lecture notes in computer science. Edited by J. Howse, J. Lee and G. Stapleton. Berlin: Springer, Vol. 5223, pp. 335–343. [Google Scholar]
- Ainsworth, S. E. 2006. DeFT: A conceptual framework for considering learning with multiple representations. Learning and Instruction 16: 183–198. [Google Scholar] [CrossRef]
- Alesandrini, K. L. 1984. Pictures and adult learning. Instructional Science 13: 63–77. [Google Scholar]
- Arsenault, D. J., L. D. Smith, and E. A. Beauchamp. 2006. Visual inscriptions in the scientific hierarchy. Science Communication 27, 3: 376–428. [Google Scholar]
- Berger, C. R. 2005. Slippery slopes to apprehension: Rationality and graphical depictions of increasingly threatening trends. Communication Research 32: 3–28. [Google Scholar]
- Bernard, R. M. 1990. Using extended captions to improve learning from instructional illustrations. British Journal of Educational Technology 21: 212–225. [Google Scholar] [CrossRef]
- Bernsen, N. O. 1994. Foundations of multimodal representations: A taxonomy of representational modalities. Interacting with Computers 6, 4: 347–371. [Google Scholar]
- Bertin, J. 1983. Semiology of graphics: Diagrams, networks, maps. Translated by W. J. Berg. Madison: University of Wisconsin Press. [Google Scholar]
- Carney, R., and J. Levin. 2002. Pictorial illustrations still improve students’ learning from text. Educational Psychology Review 14, 1: 5–26. [Google Scholar]
- Carroll, P. J., R. J. Young, and M. S. Guertin. 1992. Visual analysis of cartoons: A view from the far side. In Eye movements and visual cognition: Scene perception and reading. Edited by K. Rayner. New York: Springer, pp. 444–461. [Google Scholar]
- Chabris, C. F., and S. M. Kosslyn. 2005. Representational correspondence as a basic principle of diagram design. In Knowledge and information visualization: Searching for synergies: Lecture notes in computer science. Edited by S.-O. Tergan and T. Keller. Berlin: Springer, Vol. 3426, pp. 36–57. [Google Scholar]
- Chandler, P., and J. Sweller. 1992. The split-attention effect as a factor in the design of instruction. British Journal of Educational Psychology 62: 233–246. [Google Scholar] [CrossRef]
- Cleveland, W. S., and R. McGill. 1984. Graphical perception: Theory, experimentation, and application to the development of graphical methods. Journal of the American Statistical Association 77: 541–547. [Google Scholar] [CrossRef]
- Glenberg, A. M., M. Meyer, and K. Lindem. 1987. Mental models contribute to foreground during text comprehension. Journal of Memory and Language 26: 69–83. [Google Scholar] [CrossRef]
- Graham, J. L. 1937. Illusory trends in the observation of bar graphs. Journal of Experimental Psychology 6, 20: 597–608. [Google Scholar]
- Habel, C., and C. Acarturk. 2007. On reciprocal improvement in multimodal generation: Co-reference by text and information graphics. In Proceedings of the Workshop on Multimodal Output Generation: MOG 2007. Edited by I. van der Sluis, M. Theune, E. Reiter and E. Krahmer. United Kingdom: University of Aberdeen, pp. 69–80. [Google Scholar]
- Hegarty, M., and M. A. Just. 1993. Constructing mental models of machines from text and diagrams. Journal of Memory and Language 32: 717–742. [Google Scholar]
- Hegarty, M., P. A. Carpenter, and M. A. Just. 1996. Diagrams in the comprehension of scientific texts. In Handbook of Reading Research. Edited by R. Barr, M. L. Kamil, P. Mosenthal and P. D. Pearson. Mahwah, NJ: Erlbaum, Vol. 2, pp. 641–688. [Google Scholar]
- Henderson, J. M., and F. Ferreira, eds. 2004. The interface of language, vision, and action: Eye movements and the visual world. New York: Psychology Press. [Google Scholar]
- Kosslyn, S. M. 1980. Image and mind. Cambridge, MA: Harvard University Press. [Google Scholar]
- Kosslyn, S. 1989. Understanding charts and graphs. Applied Cognitive Psychology 3: 185–225. [Google Scholar] [CrossRef]
- Kosslyn, S. 1994. Elements of graph design. New York: W. H. Freeman. [Google Scholar]
- Kukich, K. 1983. Design of a knowledge-based report generator. Paper presented at the 21st Annual Meeting of the Association for Computational Linguistics, Cambridge, MA, USA. [Google Scholar]
- Larkin, J. H., and H. A. Simon. 1987. Why a diagram is (sometimes) worth ten thousand words. Cognitive Science 11: 65–99. [Google Scholar]
- Levin, J. R., G. J. Anglin, and R. N. Carney. 1987. On empirically validating functions of pictures in prose. In The Psychology of Illustration: I. Basic Research. Edited by D. M. Willows and H. A. Houghton. New York: Springer, pp. 51–85. [Google Scholar]
- Mautone, P. D., and R. E. Mayer. 2007. Cognitive aids for guiding graph comprehension. Journal of Educational Psychology 99, 3: 640–652. [Google Scholar]
- Mayer, R. E. 2001. Multimedia learning. Cambridge, MA: Cambridge University Press. [Google Scholar]
- Mayer, R. E., ed. 2005. The Cambridge handbook of multimedia learning. Cambridge, MA: Cambridge University Press. [Google Scholar]
- Newcombe, N. S., and A. Learmonth. 2005. Development of spatial competence. In Handbook of visuospatial thinking. Edited by P. Shah and A. Miyake. Cambridge, MA: Cambridge University Press, pp. 213–256. [Google Scholar]
- Peebles, D. J., and P. C.-H. Cheng. 2002. Extending task analytic models of graph-based reasoning: A cognitive model of problem solving with Cartesian graphs in ACT-R/PM. Cognitive Systems Research 3: 77–86. [Google Scholar]
- Peeck, J. 1987. The role of illustrations in processing and remembering illustrated text. In The psychology of illustration. Edited by D. M. Willows and H. A. Houghton. New York: Springer-Verlag, Vol. 1, pp. 115–151. [Google Scholar]
- Pinker, S. 1990. A theory of graph comprehension. In Artificial intelligence and the future of testing. Edited by R. Freedle. Hillsdale, NJ: Erlbaum, pp. 73–126. [Google Scholar]
- Preim, B., R. Michel, K. Hartmann, and T. Strothotte. 1998. Figure captions in visual interfaces. Proceedings of the Working Conference on Advanced Visual Interfaces, L’Aquila, Italy. [Google Scholar]
- Rayner, K. 1998. Eye movements in reading and information processing: 20 years of research. Psychological Bulletin 124, 3: 372–422. [Google Scholar]
- Rayner, K., C. M. Rotello, A. J. Stewart, J. Keir, and S. A. Duffy. 2001. Integrating text and pictorial information: Eye movements when looking at print advertisements. Journal of Experimental Psychology: Applied 7: 219–226. [Google Scholar] [CrossRef]
- Scaife, M., and Y. Rogers. 1996. External cognition: How do graphical representations work? International Journal of Human Computer Studies 45: 185–213. [Google Scholar]
- Shah, P., E. Freedman, and I. Vekiri. 2005. The comprehension of quantitative information in graphical displays. In The Cambridge Handbook of Visuospatial Thinking. Cambridge, MA: Cambridge University Press, pp. 426–476. [Google Scholar]
- Sigurd, B. 1995. STOCKTEXT – Automatic generation of stockmarket reports. Unpublished manuscript. Lund, Sweden: Department of Linguistics, Lund University. [Google Scholar]
- Simkin, D., and R. Hastie. 1987. An information processing analysis of graph perception. Journal of the American Statistical Association 82, 398: 454–465. [Google Scholar]
- Spence, I. 2005. No humble pie: The origins and usage of a statistical chart. Journal of Educational and Behavioral Statistics 30: 353–368. [Google Scholar]
- Tabachneck-Schijf, H. J. M., A. M. Leonardo, and H. A. Simon. 1997. CaMeRa: A computational model of multiple representations. Cognitive Science 21: 305–350. [Google Scholar]
- Tufte, E. R. 1983. The visual display of quantitative information. Cheshire CT: Graphic Press. [Google Scholar]
- Underwood, G., L. Jebbett, and K. Roberts. 2004. Inspecting pictures for information to verify a sentence: Eye movements in general encoding and in focused search. The Quarterly Journal of Experimental Psychology 57A: 165–182. [Google Scholar]
- Wainer, H. 1984. How to display data badly. American Statistician 38, 2: 137–147. [Google Scholar] [CrossRef]
- Wainer, H., and P. F. Velleman. 2001. Statistical graphics: Mapping the pathways of science. Annual Review of Psychology 52: 305–335. [Google Scholar]
- Washburne, J. N. 1927. An experimental study of various graphic, tabular and textual methods of presenting quantitative material. Journal of Educational Psychology 18: 361–376, 465–476. [Google Scholar]
- Winn, B. 1987. Charts, graphs, and diagrams in educational materials. In The psychology of illustration. Edited by D. M. Willows and H. A. Houghton. New York: Springer-Verlag, Vol. 1, pp. 152–198. [Google Scholar]
- Zwaan, R. A., and G. A. Radvansky. 1998. Situation models in language comprehension and memory. Psychological Bulletin 123, 2: 162–185. [Google Scholar]

 |
 |
 |
 |
© 2008 by the author. 2008 Cengiz Acarturk, Christopher Habel, Kursat Cagiltay, Ozge Alacam
Share and Cite
Acarturk, C.; Habel, C.; Cagiltay, K.; Alacam, O. Multimodal Comprehension of Language and Graphics: Graphs with and Without Annotations. J. Eye Mov. Res. 2007, 1, 1-14. https://doi.org/10.16910/jemr.1.3.2
Acarturk C, Habel C, Cagiltay K, Alacam O. Multimodal Comprehension of Language and Graphics: Graphs with and Without Annotations. Journal of Eye Movement Research. 2007; 1(3):1-14. https://doi.org/10.16910/jemr.1.3.2
Chicago/Turabian StyleAcarturk, Cengiz, Christopher Habel, Kursat Cagiltay, and Ozge Alacam. 2007. "Multimodal Comprehension of Language and Graphics: Graphs with and Without Annotations" Journal of Eye Movement Research 1, no. 3: 1-14. https://doi.org/10.16910/jemr.1.3.2
APA StyleAcarturk, C., Habel, C., Cagiltay, K., & Alacam, O. (2007). Multimodal Comprehension of Language and Graphics: Graphs with and Without Annotations. Journal of Eye Movement Research, 1(3), 1-14. https://doi.org/10.16910/jemr.1.3.2