Abstract
Fixations consist of small movements including microsaccades, i.e., rapid flicks in eye position that replace the retinal image by up to 1 degree of visual angle. Recently, we showed in a delayed-saccade task (1) that the rate of microsaccades decreased in the course of saccade preparation and (2) that microsaccades occurring around the time of a go signal were associated with prolonged saccade latencies (Rolfs et al., 2006). A re-analysis of the same data set revealed a strong dependence of these findings on microsaccade amplitude. First, microsaccade amplitude dropped to a minimum just before the generation of a saccade. Second, the delay of response saccades was a function of microsaccade amplitude: Microsaccades with larger amplitudes were followed by longer response latencies. These finding were predicted by a recently proposed model that attributes microsaccade generation to fixation-related activity in a saccadic motor map that is in competition with the generation of large saccades (Rolfs et al., 2008). We propose, therefore, that microsaccade statistics provide a behavioral correlate of fixation-related activity in the oculomotor system.
Introduction
Microsaccades are small but rapid eye movements that occur while an observer fixates the eyes on a stationary point in a visual scene. Though the purpose of microsaccades had been debated vividly for several decades (Ditchburn, 1980; Kowler & Steinman, 1980), a number of recent studies using psychophysical experiments, neurophysiological approaches, and modeling techniques suggest that microsaccades serve a purpose for visual perception and oculomotor control. Specifically, microsaccades modulate spiking activity in all studied areas in the visual cortex (Bair & O’Keefe, 1998; Leopold & Logothetis, 1998; Martinez-Conde, Macknik, & Hubel, 2000; Martinez-Conde, 2006; Martinez-Conde, Macknik, & Hubel, 2002; Snodderly, Kagan, & Gur, 2001) and may increase stimulus visibility (Deubel & Elsner, 1986; Elsner & Deubel, 1986; Gerrits & Vendrik, 1974; Laubrock, Engbert, & Kliegl, 2008; Martinez-Conde, Macknik, Troncoso, & Dyar, 2006; Troncoso, Macknik, & Martinez-Conde, 2008). In addition and in line with an early hypothesis (Cornsweet, 1956), microsaccades decrease the variability in eye position that is imposed by ocular drift and body movements, effectively limiting fixation errors (Engbert & Kliegl, 2004; Rolfs, Engbert, & Kliegl, 2004), possibly based on visual input signals (Mergenthaler & Engbert, 2007).
With an increasing interest in the consequences of microsaccades, discussion of the physiological mechanisms involved in their generation began recently. Inspired by studies concerned with the physiological processes on the level of the superior colliculus (SC), a brainstem structure critically involved in the control of saccades and fixations (see Munoz, Dorris, Paré, & Everling, 2000; Scudder, Kaneko, & Fuchs, 2002; Sparks, 2002, for reviews), Rolfs, Kliegl, and Engbert (2008) have proposed a common-field model of microsaccade and saccade generation. In this model, mi-rosaccades are the result of activity in the center of a saccadic motor map (a neural field) that is typically observed during visual fixation (see Figure 1A, for a schematic overview of the model). Large saccades, in turn, are generated by activity in the periphery of the map. Global inhibition mechanisms between distant locations induce that fixation-related and saccade-related activity are in continual competition. Thus, according to the model, the mechanisms involved in the generation of microsaccades and saccades should interfere with each other. Indeed, in a previous study of ours, microsaccades had a strong impact on saccadic latencies in a delayed saccade task (Rolfs, Laubrock, & Kliegl, 2006): Microsaccades occurring around the time of the go signal (offset of the fixation spot), which instructed a saccadic response to a pre-defined target, delayed the response saccade by some 50 ms on average. In addition and in line with the idea of competition between fixation-related activity and saccade preparation, the rate of microsaccades decreased during the delay period and dropped to a minimum just before the saccade.
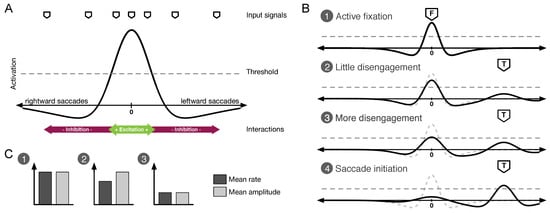
Figure 1.
Schematic outline and predictions of the common-field model of microsaccade and saccade generation as proposed by Rolfs et al. (2008). Microsaccade statistics are the result of the average distribution of suprathreshold activity at the central part of a saccadic motor map. The amount of this activity mediates microsaccade rate. The generated microsaccade-amplitude distribution covers the range of amplitudes in the field that exhibit suprathreshold activation. Note that the characteristics of a particular microsaccadic event are determined by the current distribution of activity in the map, which is strongly influenced by noise. A Model outline showing an average distribution of activity during visual fixation. Incoming input signals modulate activity in the map. Its internal dynamics are shaped by local excitation and global inhibition mechanisms. B Changes of activity in the map during saccade preparation. Activity distributions 1 through 4 illustrate fixational disengagement as saccade preparation progresses. Dashed gray lines in 2, 3, and 4 display the distribution during active fixation (1). C Predictions for microsaccade rate and amplitude for activity distributions 1, 2 and 3 of panel B. Fixational disengagement results in fewer microsaccades with smaller mean amplitudes.
The common-field model of microsaccade and saccade generation (Rolfs et al., 2008) makes two predictions in addition to these results (see Figure 1B and C). First, the mean amplitude of microsaccades should decrease while a saccade is being prepared, predicting a smaller mean microsaccade amplitude at the time a saccade is required. Second, in turn, microsaccades with large amplitudes may only result when activity is high in the center of the map and should thus (on average) be associated with a stronger increases of the subsequent saccade’s latency as compared to small amplitude saccades. Here, we tested and confirmed these specific predictions of the common-field model of microsaccade and saccade generation in a re-analysis of our previously published data (Rolfs et al., 2006).
Methods
Participants
Thirty-one students of the University of Potsdam were paid 7e or received study credit for their participation. They were 19 to 40 years old (24.3 years on average), had normal or corrected-to-normal vision, and were in good health.
Experimental setup and eye-movement recording
Participants were seated in a silent and darkened room with the head positioned on a chin rest, 50 cm in front of a computer screen. Stimuli were presented on a 19-inch EYE-Q 650 CRT (1024 by 768 resolution or 40° by 30° of visual angle; refresh rate 100 Hz). The experiment was controlled by an Apple Power Macintosh G4 computer. Eye-position data were recorded and available on-line using an EyeLink-II system (SR Research, Osgoode, Ontario, Canada) with a sampling rate of 500 Hz and a noise-limited spatial resolution better than 0.01°. The experimental software controlling stimulus display and response collection was implemented in Matlab (MathWorks, Natick, Massachusetts, USA), using the Psychophysics (Brainard, 1997; Pelli, 1997) and Eyelink (Cornelissen, Peters, & Palmer, 2002) toolboxes.
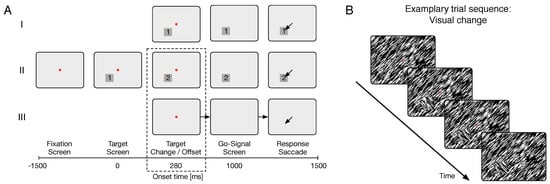
Figure 2.
Illustration of the experimental procedure in the delayed-saccade task. A Sequences of visual stimulation in the three conditions (I = Visual static; II = Visual change; III = Memory). B Example of a display sequence in the Visual change condition. Note, that the target square changes its appearance from the second to the third screen, while the background remains the same.
Procedure
Participants performed 306 test trials of a delayed response task similar to that used by Supèr, van der Togt, Spekreijse, and Lamme (2004). Before the first and after every 50 trials the eye tracker was calibrated (standard 9-point grid) and calibration was validated. To start a trial, participants had to fixate a red spot at the center of a random-noise screen (each pixel was set to black or white). Correct fixation was checked, and the stimulus screen appeared if gaze position was detected in the fixation region. Otherwise, a drift correction was carried out and the trial was started over. If the eyes were still not detected within the critical area, the calibration was repeated.
Figure 2A depicts the sequences of visual stimulations used in the present experiment. Participants fixated a point at the center of the computer screen. After 1500 ms of fixation, a square target appeared at one of three possible positions in the periphery (top: 90°, bottom-left: 210°, or bottom-right: 330°). Participants maintained fixation for an additional 1000 ms until a go signal (fixation point offset) commanded a saccadic response to the target. Response saccades (eye position shift to either of the three target square regions) were detected on-line. If either a response saccade was detected or a response interval of 500 ms was exceeded, the next trial was started after an inter-trial interval of 500 ms. The sequence of visual stimulation was varied according to three different experimental conditions: (1) The target remained on the screen during the whole fixation period (Visual static condition), (2) it was replaced by a different figure of the same size 280 ms after target onset (Visual change condition; see example in Figure 2B), or (3) it disappeared after 280 ms of presentation (Memory condition). Trials were presented in randomized order, with 102 trials per condition. In addition to stimulus condition (Visual static, Visual change, Memory), the factorial design included target position (top, bottom-right, or bottom-left) and target orientation (45° or 135°).
If gaze position left a fixation square (2° side length, centered on the fixation spot) during the 2500 ms fixation period, the trial was aborted. Aborted trials were repeated in random order after the 306 regular trials.
Stimuli
The background of the stimulus screen consisted of a texture of randomly distributed white-on-black line segments of a single orientation. In each trial, a square target (side length 3°) was presented at one of three possible locations (top, bottom-left, or bottom-right, with 4.4° eccentricity of the squares center from the central red fixation spot of 0.2° diameter). Target squares consisted of a random texture of line segments with an orientation orthogonal to the background pattern (see Figure 2B for example screens). In two of three conditions, this texture was replaced after 280 ms by either a background-homogeneous texture (Memory trials) or another figure texture (Visual change trials). Line segments were 16 x 1 pixels (0.62° x 0.039°) and had an orientation of 135° or 45°. Both orientations were used for both figure and background, resulting in complementary stimulus pairs. On average, 40% of the screen was covered by lines.
Data preparation
For data analysis, a post-hoc saccade detection was performed using a new version (Engbert & Mergenthaler, 2006) of the algorithm by Engbert and Kliegl (2003). Velocities were computed from subsequent samples in the series of eye positions in the response time window 500 ms on from the go signal. Saccades were detected in 2D velocity space using thresholds for peak velocity and minimum duration. We used a relative threshold of 6 SDs of the velocity and a minimal duration of 6 ms (or three data samples). The first saccade that shifted gaze across one of the three target areas was taken as a response saccade. Saccadic reaction time (SRT) was defined as the latency between go signal and saccade onset.
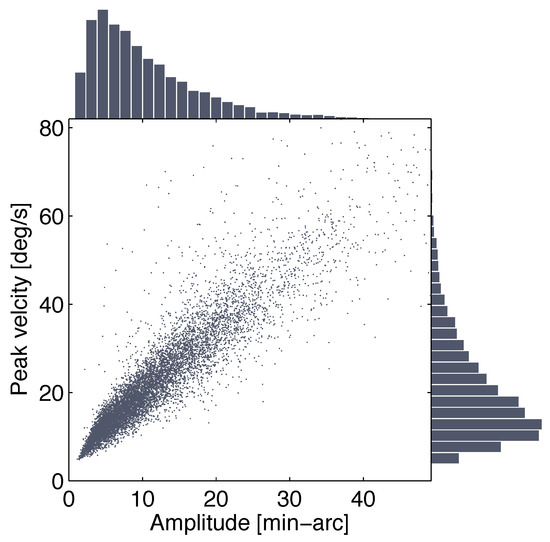
Figure 3.
Main sequence for microsaccades observed in the interval between 100 ms before target onset and the response saccade. Distributions of microsaccade amplitude and peak velocity are shown in the flanking bar graphs.
Subsequently, we used the same algorithm to detect microsaccades (amplitude < 1°) in the interval from fixation onset to the response saccade. We considered only binocular microsaccades, that is, microsaccades detected in both eyes with temporal overlap of at least one data sample.
Trials including saccades larger than 1° prior to the response saccade were discarded, as were trials with no or incorrect responses and SRTs shorter than 70 ms. Some trials had to be excluded due to data loss during eye-movement recording. Thirty-one participants contributed 238 to 304 trials to the final data analyses, resulting in a total of 8603 trials (out of 9486 or 90.7%; 2853 visual-static, 2887 visual change, and 2863 memory trials) in which 9747 microsaccades were detected in the inverval between 100 ms before target onset and the response saccade. Figure 3 shows distributions of microsaccade amplitudes and peak velocities for these data as well as the correlation of the two variables, the main sequence.
Results
Microsaccade amplitude
As reported previously for this data set (Rolfs et al., 2006), microsaccade rate strongly decreased prior to the response saccade. To find out whether this effect was accompanied by a reduction in mean microsaccade amplitude, we defined three time windows, a Baseline time window (-100 to 0 ms before target onset), a Prego time window (900 to 1000 ms after target onset), and a Pre-sac time window (last 100 ms before the saccade). Figure 4 displays means and 95% confidence intervals of microsaccade amplitudes for each condition separately. This plot suggests that mean microsaccade amplitude decreased significantly from about 12 min-arc before target onset to 10 min-arc around the time of the go signal. Microsaccade occurring just before the response saccade had the lowest amplitude (less than 8 min-arc on average). The plot indicates that this pattern of results was independent of condition. Thus, a participant’s data were collapsed across conditions for a repeated-measures ANOVA with time window as an independent variable; indeed, mean microsaccade amplitude decreased across time; F(2, 58) = 13.75, p < 0.001.
Microsaccades and saccadic response latencies
To determine the impact of microsaccades on saccadic response times, a linear mixed-effects model (LME; e.g., Pinheiro & Bates, 2000) was tested, using the lmer program of the lme4 package (Bates, 2007) in the R environment (R Development Core Team, 2007). The last microsaccade occurring after target onset, but no later than 70 ms after the go-signal presentation in a trial was used for the subsequent analyses. A microsaccade was observed in that time window in 1806, 1836, and 1807 trials in the Visual static, Visual change, and Memory conditions, respectively. We tested the linear effect of microsaccade onset time, linear effect of microsaccade amplitude (both centered around zero), and the interaction of these two variables on saccadic latencies. Hence, six parameters were estimated, that is four fixed effects (including the intercept), plus a random effect for subjects (i.e., the variance of the intercept between subjects assuming normal distribution and zero mean), and the residual error variance. The results are shown in Table 1. Microsaccade-induced prolongation of response times was significantly affected by microsaccade onset time; later microsaccades were associated with longer SRTs (b = 39.8 ms/s, SE = 3.1 ms/s, t = 12.63), replicating our earlier report in an LME analysis. In addition, SRTs increased with increasing microsaccade amplitudes (b = 0.41 ms/min-arc, SE = 0.13 ms/min-arc, t = 3.24). Finally, the effect of onset time was more pronounced for large microsaccades, resulting in a significant interaction of the two factors (b = 1.85 ms/(s∗min-arc), SE = 0.39 ms/(s∗min-arc), t = 4.76). Figure 5 illustrates these results along with a distribution of the predictors (gray-shaded background histograms).
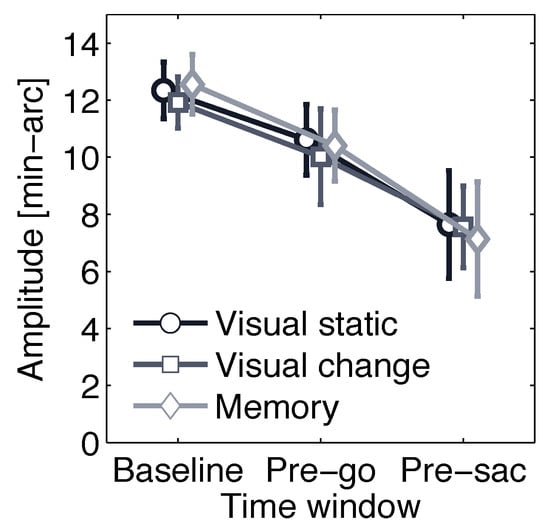
Figure 4.
Mean microsaccade amplitude in three time windows: Baseline (last 100 ms before target onset), Pre-go (last 100 ms before go signal), and Pre-sac (last 100 ms before the response saccade) is plotted for each condition separately. Error bars are 95% confidence intervals.
In an additional analysis, we tested for potential differences between experimental conditions (Visual static vs. Visual change vs. Memory). To this end, the factor condition was taken into the model as a fixed effect; the Visual-static condition was used as a reference condition. The results of this LME model resembled those described above (see lower part in Table 1). The model fit did not improve significantly (χ2[8] = 6.81, p = 0.56) and there was no significant difference between the three conditions in any of the effects reported. We conclude that the effects of microsaccade onset time, microsaccade amplitude and the interaction of these two variables were to a large degree independent of the experimental condition.
Discussion
In a previous study, we showed a strong impact of microsaccades on the latencies of subsequent saccades (Rolfs et al., 2006). Microsaccades occurring up to several hundred milliseconds before a saccade had to be executed were associated with a pronounced slowing of SRTs. Using the same data set, we showed here that the costs that microsaccades imposed on performance were not only a function of microsaccade onset but also of their amplitude. That is, later and larger microsaccades exhibited a stronger impact. Moreover, we showed that the previously reported reductions in microsaccade rate in the course of saccade preparation were accompanied by a decrease in mean microsaccade amplitude.
These results were predicted by the common-field model of microsaccade and saccade generation (Rolfs et al., 2008). The mechanisms of this model were largely inspired by the physiological processes in the SC motor map. Specifically, we proposed that activity of neurons in the rostral pole of the intermediate and deeper layers of the SC is a likely neural correlate of microsaccade generation. Rostral SC activity is high during visual fixation (see Munoz et al., 2000, for a review of the pertinent literature). As the process of saccade generation is thought to require reciprocal activation of the neurons in the rostral and caudal part of the SC (Munoz & Istvan, 1998; Munoz & Wurtz, 1993b, 1995), according to our model, a decrease in microsaccade rate and amplitude accompanies saccade preparation. Correlations between microsaccade rate and amplitude effects (e.g., Martinez-Conde et al., 2006; Rolfs et al., 2008) are a general prediction that can be derived from the model (see Rolfs et al., 2008, for predicted exceptions), since only the most central part of the motor map (i.e., the very rostral SC) remains activated above threshold as fixation disengages (see Figure 1). Thus, the generation of large-amplitude microsaccades is more likely when a high level of activity is found in the center of the map, imposing greater costs on the latency of participants’ saccadic response, especially when observed just before a response saccade was instructed by the go signal. The fact that all of our findings were largely independent of whether the response was made to a visual or a memorized target location is in line with the idea that the observed effects occur at the final stages of the oculomotor machinery.

Table 1.
Means, 95% confidence intervals (CI95, 1.96 times the standard error), and t-values of fixed effects on SRTs after microsaccades occurring after target onset, but no later than 70 ms after the go signal, estimated in two LME models.
Table 1.
Means, 95% confidence intervals (CI95, 1.96 times the standard error), and t-values of fixed effects on SRTs after microsaccades occurring after target onset, but no later than 70 ms after the go signal, estimated in two LME models.
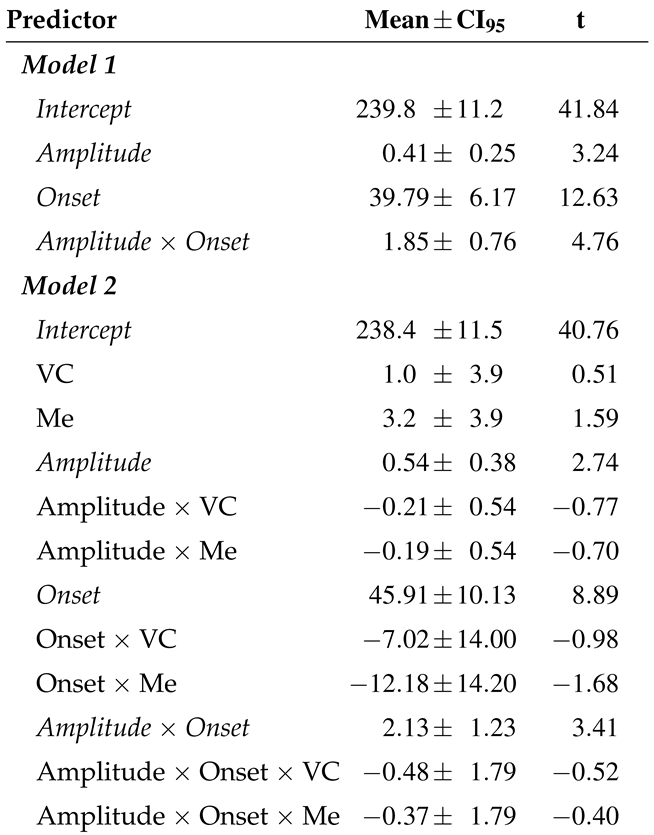 |
Note. Significant effects are italicized. Means and CI95 are given in ms, ms/min-arc, and ms/s for Intercepts, Amplitudes, and Onsets, respectively. Visual static is the reference condition in Model 2. VC and Me depict the contrast between that reference condition and the Visual change and Memory conditions, respectively. Random effects: SDs of intercepts (over subjects) and residual variance were 31.5 ms and 60.0 ms, respectively, for both models.
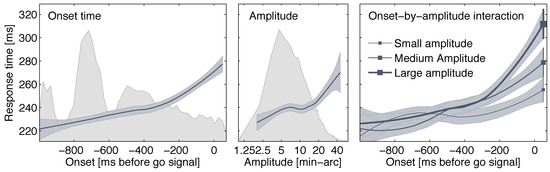
Figure 5.
Main effects (panels 1 and 2) and interaction (panel 3) of microsaccade onset and microsaccade amplitude on SRT. Data were collapsed across conditions. For panel 3, microsaccade amplitudes were cut into three quantiles to illustrate the interaction; small, medium, and large amplitudes have the ranges [1.34,6.44], (6.44,11.9], and (11.9,59.9] min-arc, respectively. Error bands represent 95% confidence intervals; smoothing is based on local polynomial regression fitting. Background histograms in panels 1 and 2 show distributions of the predictors, with binning set to 10 ms for onset times and 1 min-arc for amplitudes.
Obviously, the model’s predictions concerning the role of microsaccade amplitude in saccade generation strongly depend on the specific shape of the activity distribution assumed. If for example, fixation-related activity was high at the center of the saccadic motor map, but fell in a ramp-like fashion at a certain eccentricity, no effects of microsaccade amplitude would be predicted. In the common-field model of microsaccade and saccade generation, a peak of activity is strongly localized (see Figure 1; see also Rolfs et al., 2008). The shape of the distribution of activity around that peak is a result of local excitation and long-distance inhibition interactions in the motor map and resembles a mexican-hat function. This choice was dictated by physiological findings (e.g., Munoz & Istvan, 1998; Trappenberg, Dorris, Munoz, & Klein, 2001). In addition, a series of computational models that made similar assumptions were successful in reproducing neurophysiological processes in the SC and in relating to them to saccadic behavior in a variety of tasks (e.g., Kopecz, 1995; Kopecz & Schöner, 1995; Nakahara, Morita, Wurtz, & Optican, 2006; Trappenberg et al., 2001). We conclude that–according to the current state of the art–the shape of peaks of activity in the motor map is physiologically plausible.
While the idea that microsaccades are correlated with neuronal activity in the rostral SC has not yet been tested directly, it finds some support in some physiological studies. Several authors showed that electrical stimulation of these rostral SC cells elicited saccades with amplitudes often smaller than 1° (Basso, Krauzlis, & Wurtz, 2000; Gandhi & Keller, 1999; Robinson, 1972). Others reported that these cells do sometimes not decrease their discharge rate for small-amplitude contraversive saccades (Anderson, Keller, Gandhi, & Das, 1998; Krauzlis, 2003; Krauzlis, Basso, & Wurtz, 1997, 2000; Munoz & Wurtz, 1993a, 1995). The findings presented here and in our earlier work (Rolfs et al., 2006, 2008) provide behavioral support for this idea. In addition, a recent study by Otero-Millan, Troncoso, Macknik, Serrano-Pedraza, and Martinez-Conde (2008) demonstrated in a variety of visual inspection tasks that all pair-wise combinations of microsaccades and saccades have equivalent inter-saccadic intervals (see also Cunitz & Steinman, 1969), supporting the notion that microsaccades and saccades share the same neural machinery.
Conclusion
The present manuscript demonstrates specific interactions of microsaccade characteristics and saccade generation. The investigation of these interactions sheds new light on the mechanisms involved in the generation of microsaccades and may provide a way to examine the underlying neurophysiological dynamics. Finally, the study of microsaccades helps explain some of the variability that is observed in saccade latencies during simple oculomotor tasks and should thus be of concern in a broad range of eye-movement studies.
Funding
This research was supported by Deutsche Forschungsge-meinschaft (grants KL-955/3 and KL/955-6).
References
- Anderson, R. W., E. L. Keller, N. J. Gandhi, and S. Das. 1998. Two-dimensional saccade-related population activity in superior colliculus in monkey. Journal of Neurophysiology 80: 798–817. [Google Scholar] [PubMed]
- Bair, W., and L. P. O’Keefe. 1998. The influence of fixational eye movements on the response of neurons in area MT of the macaque. Visual Neuroscience 15: 779–786. [Google Scholar] [PubMed]
- Basso, M. A., R. J. Krauzlis, and R. H. Wurtz. 2000. Activation and inactivation of rostral superior colliculus neurons during smooth-pursuit eye movements in monkeys. Journal of Neurophysiology 84: 892–908. [Google Scholar]
- Bates, D. 2007. lme4: Linear mixed-effects models using s4 classes. (R package version 0.99875-9). [Google Scholar]
- Brainard, D. H. 1997. The Psychophysics Toolbox. Spatial Vision 10: 433–436. [Google Scholar] [PubMed]
- Cornelissen, F. W., E. M. Peters, and J. Palmer. 2002. The Eyelink Toolbox: Eye tracking with MATLAB and the Psychophysics Toolbox. Behavior Research Methods, Instruments, & Computers 34: 613–617. [Google Scholar]
- Cornsweet, T. N. 1956. Determination of the stimuli for involuntary drifts and saccadic eyer movements. Journal of the Optical Society of America 46: 987–993. [Google Scholar]
- Cunitz, R. J., and R. M. Steinman. 1969. Comparison of saccadic eye movements during fixation and reading. Vision Research 9: 683–693. [Google Scholar]
- Deubel, H., and T. Elsner. 1986. Threshold perception and saccadic eye movements. Biological Cybernetics 54: 351–358. [Google Scholar]
- Ditchburn, R. W. 1980. The function of small saccades. Vision Research 20: 271–272. [Google Scholar]
- Elsner, T., and H. Deubel. 1986. The effect of saccades on threshold perception-A model study. Biological Cybernetics 54: 359–366. [Google Scholar]
- Engbert, R., and R. Kliegl. 2003. Microsaccades uncover the orientation of covert attention. Vision Research 43: 1035–1045. [Google Scholar]
- Engbert, R., and R. Kliegl. 2004. Microsaccades keep the eyes’ balance during fixation. Psychological Science 15: 431–436. [Google Scholar] [PubMed]
- Engbert, R., and K. Mergenthaler. 2006. Microsaccades are triggered by low retinal image slip. Proceedings of the National Academy of Sciences, USA 103: 7192–7197. [Google Scholar]
- Gandhi, N. J., and E. L. Keller. 1999. Comparison of saccades perturbed by stimulation of the rostral superior colliculus, the caudal superior colliculus, and the omnipause neuron region. Journal of Neurophysiology 82: 3236–3253. [Google Scholar] [PubMed]
- Gerrits, H. J. M., and A. J. H. Vendrik. 1974. The influence of stimulus movements on perception in parafoveal stabilized vision. Vision Research 14: 175–180. [Google Scholar] [CrossRef]
- Kopecz, K. 1995. Saccadic reaction times in gap/overlap paradigms: A model based on integration of intentional and visual information on neural, dynamic fields. Vision Research 35: 2911–2925. [Google Scholar]
- Kopecz, K., and G. Schöner. 1995. Saccade motor planning by integrating visual information and pre-information on neural dynamic fields. Biological Cybernetics 73: 49–60. [Google Scholar]
- Kowler, E., and R. M. Steinman. 1980. Small saccades serve no useful purpose: Reply to a letter by R.W. Ditchburn. Vision Research 20: 273–276. [Google Scholar]
- Krauzlis, R. J. 2003. Neuronal activity in the rostral superior colliculus related to the initiation of pursuit and saccadic eye movements. Journal of Neuroscience 23: 4333–4344. [Google Scholar]
- Krauzlis, R. J., M. A. Basso, and R. H. Wurtz. 1997. Shared motor error for multiple eye movements. Science 276: 1693–1695. [Google Scholar]
- Krauzlis, R. J., M. A. Basso, and R. H. Wurtz. 2000. Discharge properties of neurons in the rostral superior colliculus of the monkey during smooth-pursuit eye movements. Journal of Neurophysiology 84: 876–891. [Google Scholar] [CrossRef] [PubMed]
- Laubrock, J., R. Engbert, and R. Kliegl. 2008. Fixational eye movements influence the perceived direction of ambiguous apparent motion. Journal of Vision. in press. [Google Scholar]
- Leopold, D. A., and N. K. Logothetis. 1998. Microsaccades differentially modulate neural activity in the striate and extrastriate visual cortex. Experimental Brain Research 123: 341–345. [Google Scholar] [CrossRef]
- Martinez-Conde, S. 2006. Fixational eye movements in normal and pathological vision. Progress in Brain Research 154: 151–176. [Google Scholar] [PubMed]
- Martinez-Conde, S., S. L. Macknik, and D. H. Hubel. 2000. Microsaccadic eye movements and firing of single cells in the striate cortex of macaque monkeys. Nature Neuroscience 3: 251–258. [Google Scholar]
- Martinez-Conde, S., S. L. Macknik, and D. H. Hubel. 2002. The function of bursts of spikes during visual fixation in the awake primate lateral geniculate nucleus and primary visual cortex. Proceedings of the National Academy of Sciences, USA 99: 13920–13925. [Google Scholar] [CrossRef] [PubMed]
- Martinez-Conde, S., S. L. Macknik, X. G. Troncoso, and T. A. Dyar. 2006. Microsaccades counteract visual fading during fixation. Neuron 49: 297–305. [Google Scholar] [CrossRef]
- Mergenthaler, K., and R. Engbert. 2007. Modeling the control of fixational eye movements with neurophysiological delays. Physical Review Letters 98, 138104: 1–4. [Google Scholar]
- Munoz, D. P., M. C. Dorris, M. Paré, and S. Everling. 2000. On your mark get set: Brainstem circuitry underlying saccadic initiation. Canadian Journal of Physiology and Pharmacology 78: 934–944. [Google Scholar] [CrossRef]
- Munoz, D. P., and P. J. Istvan. 1998. Lateral inhibitory interactions in the intermediate layers of the monkey superior colliculus. Journal of Neurophysiology 79: 1193–1209. [Google Scholar] [CrossRef]
- Munoz, D. P., and R. H. Wurtz. 1993a. Fixation cells in monkey superior colliculus I. Characteristics of cell discharge. Journal of Neurophysiology 70: 559–575. [Google Scholar] [CrossRef]
- Munoz, D. P., and R. H. Wurtz. 1993b. Fixation cells in monkey superior colliculus II. Reversible activation and deactivation. Journal of Neurophysiology 70: 576–589. [Google Scholar] [PubMed]
- Munoz, D. P., and R. H. Wurtz. 1995. Saccade-related activity in monkey superior colliculus II. Spread of activity during saccades. Journal of Neurophysiology 73: 2334–2348. [Google Scholar]
- Nakahara, H., K. Morita, R. H. Wurtz, and L. M. Optican. 2006. Saccade-related spread of activity across superior colliculus may arise from asymmetry of internal connections. Journal of Neurophysiology 96: 765–774. [Google Scholar]
- Otero-Millan, J., X. G. Troncoso, S. L. Macknik, I. Serrano-Pedraza, and S. Martinez-Conde. 2008. Saccades and microsaccades during visual fixation, exploration and search: Foundations for a common saccadic generator. Journal of Vision. accepted pending minor revisions. [Google Scholar] [CrossRef] [PubMed]
- Pelli, D. G. 1997. The VideoToolbox software for visual psychophysics: Transforming numbers into movies. Spatial Vision 10: 437–442. [Google Scholar]
- Pinheiro, J., and D. Bates. 2000. Mixed-effects models in S and S-PLUS. New York: Springer. [Google Scholar]
- R Development Core Team. 2007. R: A language and environment for statistical computing. Vienna, Austria: ISBN 3-900051-07-0. [Google Scholar]
- Robinson, D. A. 1972. Eye movements evoked by collicular stimulation in the alert monkey. Vision Research 12: 1795–1808. [Google Scholar] [CrossRef]
- Rolfs, M., R. Engbert, and R. Kliegl. 2004. Perception and motor control: The link between fixational eye movements and postural sway. Perception 33 Suppl. S: 136. [Google Scholar]
- Rolfs, M., R. Kliegl, and R. Engbert. 2008. Toward a model of microsaccade generation: The case of microsaccadic inhibition. Journal of Vision 8, 11: 5.1–23. [Google Scholar]
- Rolfs, M., J. Laubrock, and R. Kliegl. 2006. Shortening and prolongation of saccade latencies following microsaccades. Experimental Brain Research 169: 369–376. [Google Scholar]
- Scudder, C. A., C. R. S. Kaneko, and A. F. Fuchs. 2002. The brainstem burst generator for saccadic eye movements: A modern synthesis. Experimental Brain Research 142: 439–462. [Google Scholar]
- Snodderly, D. M., I. Kagan, and M. Gur. 2001. Selective activation of visual cortex neurons by fixational eye movements: Implications for neural coding. Visual Neuroscience 18: 259–277. [Google Scholar] [PubMed]
- Sparks, D. L. 2002. The brainstem control of saccadic eye movements. Nature Reviews Neuroscience 3: 952–964. [Google Scholar] [PubMed]
- Supèr, H., C. van der Togt, H. Spekreijse, and V. A. F. Lamme. 2004. Correspondence of presaccadic activity in the monkey primary visual cortex with saccadic eye movements. Proceedings of the National Academy of Sciences USA 101: 3230–3235. [Google Scholar]
- Trappenberg, T. P., M. C. Dorris, D. P. Munoz, and R. M. Klein. 2001. A model of saccade initiation based on the competitive integration of exogenous and endogenous signals in the superior colliculus. Journal of Cognitive Neuroscience 13: 256–271. [Google Scholar] [CrossRef]
- Troncoso, X. G., S. L. Macknik, and S. Martinez-Conde. 2008. Microsaccades counteract perceptual filling-in. Journal of Vision. in press. [Google Scholar]
© 2008 by the author. 2008 Martin Rolfs, Jochen Laubrock, Reinhold Kliegl