Article

A Comparison of Different Machine Learning Algorithms in the Classification of Impervious Surfaces: Case Study of the Housing Estate Fort Bema in Warsaw (Poland)

by
Janusz Sobieraj
1,
Marcos Fernández
2 and
Dominik Metelski
3,*
1
Department of Building Engineering, Warsaw University of Technology, 00-637 Warsaw, Poland
2
Institute of Robotics, Information Technologies and Communication Research (IRTIC), University of Valencia, 46980 Valencia, Spain
3
Department of International and Spanish Economics, University of Granada, 18071 Granada, Spain
*
Author to whom correspondence should be addressed.
Buildings 2022, 12(12), 2115; https://doi.org/10.3390/buildings12122115
Submission received: 3 November 2022 / Revised: 28 November 2022 / Accepted: 29 November 2022 / Published: 1 December 2022

Abstract

:
The aim of this study is to extract impervious surfaces and show their spatial distribution, using different machine learning algorithms. For this purpose, geoprocessing and remote sensing techniques were used and three classification methods for digital images were compared, namely Support Vector Machines (SVM), Maximum Likelihood (ML) and Random Trees (RT) classifiers. The study area is one of the most prestigious and the largest housing estates in Warsaw (Poland), the Fort Bema housing complex, which is also an exemplary model for hydrological solutions. The study was prepared on the Geographic Information System platform (GIS) using aerial optical images, orthorectified and thus provided with a suitable coordinate system. The use of these data is therefore supported by the accuracy of the resulting infrared channel product with a pixel size of 0.25 m, making the results much more accurate compared to satellite imagery. The results of the SVM, ML and RT classifiers were compared using the confusion matrix, accuracy (Root Mean Square Error /RMSE/) and kappa index. This showed that the three algorithms were able to successfully discriminate between targets. Overall, the three classifiers had errors, but specifically for impervious surfaces, the highest accuracy was achieved with the SVM classifier (the highest percentage of overall accuracy), followed by ML and RT with 91.51%, 91.35% and 84.52% of the results, respectively. A comparison of the visual results and the confusion matrix shows that although visually the RT method appears to be the most detailed classification into pervious and impervious surfaces, the results were not always correct, e.g., water/shadow was detected as an impervious surface. The NDVI index was also mapped for the same spatial study area and its application in the evaluation of pervious surfaces was explained. The results obtained with the GIS platform, presented in this paper, provide a better understanding of how these advanced classifiers work, which in turn can provide insightful guidance for their selection and combination in real-world applications. The paper also provides an overview of the main works/studies dealing with impervious surface mapping, with different methods for their assessment (including the use of conventional remote sensing, NDVI, multisensory and cross-source data, ‘social sensing’ and classification methods such as SVM, ML and RT), as well as an overview of the research results.

1. Introduction

Mapping and monitoring of impervious surfaces is required for a number of purposes, e.g., urban planning [1], monitoring subtle urban changes (so-called subtle urban dynamics) [2,3,4], as an essential component of effective stormwater management [5], to assess the hydrologic condition of an area/catchment [5], to evaluate water quality [5,6,7], but also to facilitate rational stormwater management policies for specific lands/properties [8], to improve environmental management and finally to promote sustainable urban development, including construction of appropriate facilities/infrastructure [1]. Other important applications of impervious surface mapping/classification include developing appropriate standards for managing pollution from stormwater runoff [9], implementing flood control measures [5,8] and supporting emergency management activities [5]. Sobieraj et al. [5] emphasize the need to map impervious surfaces in the context of so-called sustainable drainage technologies and small-scale architecture (sustainable urban drainage systems /SUDS/, water-sensitive urban design /WSUD/, low impact developments /LID/). According to Bauer et al. [10], a measure of imperviousness can also be used as a proxy for assessing environmental quality. More specifically, impervious surface is an indicator of the ecological health of the areas in question [9]. It indicates the degree of urbanization and has a direct impact on water balance [9] and temperature cycles [5] as well as water quality [5,6,7,8,11,12]. In this context, it is worth noting that the need for detailed estimates of impervious surfaces has increased [1,5,7,8]. Yang et al. [13] state that accurate and up-to-date geospatial data on urban impervious surfaces serve a multi-level study of urban ecosystems. In most cases, an increase in impervious surfaces leads to insufficient groundwater recharge and an increase in storm runoff [1,14]. This, in turn, leads to an increase in the frequency of flooding and localized flooding [5] and also affects water quality in the watersheds in which they are located. In addition, there are also studies that show that wherever the ratio of impervious to pervious surfaces increases, this leads to increased pollution (contamination) from nonpoint sources [15]. This is due to increased transport of toxic pollutants, pathogens and various types of sediments.
Various approaches to characterizing and quantifying impervious surfaces can be found in the literature, with much attention paid to remote sensing and, in particular, some chronological context for the development of this method [1]. One such approach to estimating impervious surfaces is the integration of remote sensing and various machine learning-based classification methods [1]. In addition, although examples of studies dedicated to the use of AI in impervious surface classification can be found in the literature, e.g., using Support Vector Machines (SVM) [16], Maximum Likelihood (ML) [6,17], or Random Trees/Forest (RT/F) [18,19], there is a lack of comparison of different machine learning methods (for impervious surface classification) in terms of their accuracy on high-resolution orthophoto maps. However, in general, there are examples of studies in the literature showing that SVM is superior to other classification methods in terms of performance, in particular it performs better than ML [20,21,22,23]. However, it is worth noting that in some cases the results of the ML method were only slightly worse (the study concerned land cover) [21], while in another study SVM gave better results for SAR images (while ML proved to be the better classifier for TM images) [20].
The aim of the article is to compare the performance of different machine learning algorithms in mapping impervious surfaces, using high-resolution orthophotos and evaluating the confusion matrix and other performance indicators. In this context, the article can be considered as original research (reporting a new work) that provides empirical sources and presents original evidence. In addition, the article also summarizes the existing literature on the topic under study and attempts to explain the current state of understanding on this topic. The essence of the review of several studies, on the other hand, is to highlight the importance of mapping and knowledge of impervious surfaces to solve various problems that are directly or indirectly applicable in civil engineering (e.g., for evaluating the stormwater bill of the site and determining the intensity of stormwater runoff). While there is an abundance of literature on impervious surface mapping, unlike other work, this study is original in that, in addition to practical experiments, knowledge of impervious surface classification was placed in the context of its usefulness for construction-related applications.
The use of remote sensing data and various machine learning algorithms to classify impervious surfaces shows how such surfaces can be mapped (that there are many different effective segmentation methods and GIS software to facilitate this) and how accurate and effective these methods are. In terms of contributions to the literature, the paper first provides a thorough overview of what is known about impervious surfaces, with particular attention to the context of remote sensing (due to its low cost) and various machine learning algorithms. Subsequently, the application of selected methods is demonstrated using a specific case study at the property level as an example. More specifically, the geographical area used and presented in the case study is one of the most prestigious housing estates in Warsaw (with an area of 1 square kilometre), which is ideal for this type of study, as the use of very high-resolution orthophotos (1 px = 0.25 m) allows precise segmentation at the parcel level (thus, the study area is neither too large nor too small to be suitable for the applied methods). At the same time, it is an area with a certain anthropological diversity (characterized by a high spectral heterogeneity) and therefore represents a certain challenge for mapping [2,4], so that the effectiveness and efficiency of the above methods can be tested in detail.
Indeed, Zhang et al. [24] emphasize the need for further research in this context, i.e., research that compares different classification methods. Our study addresses this issue and, in a sense, fills a research gap. It is also worth noting that a similar study (but less detailed) was conducted by Martines et al. [25], who also compared three image classification algorithms, namely SVM, ML and RT. However, in the case of this study, the AI classifiers were not used to estimate impervious surfaces, but to verify the discriminability of forest areas, forestry and other uses, for which these authors used geoprocessing and remote sensing techniques, as well as Sentinel satellite data, which have a relatively low resolution (although still higher than Landsat).
In the case of our study, however, orthophoto map data (rather than satellite data) were used because it would not have been possible to obtain such an accurate image from publicly available data and a pixel resolution of 10 m for Sentinel and 25 m for Landsat would not have provided satisfactory classification results at the scale of the settlement. More specifically, the data used in this study are aerial optical images (non-satellite and radar images) that have been orthorectified and therefore have a suitable coordinate system. The use of these data is therefore supported by the accuracy of the resulting product and the presence of the near-infrared channel.
The structure of this article is as follows. First, we introduce the materials and methods and outline the current state of academic knowledge on remote sensing, impervious surfaces and AI classification methods. Then, we present the methodology used and explain the differences between the three AI classification methods. Finally, we describe the obtained results, discuss them and draw conclusions from the conducted research.

2. Materials and Methods

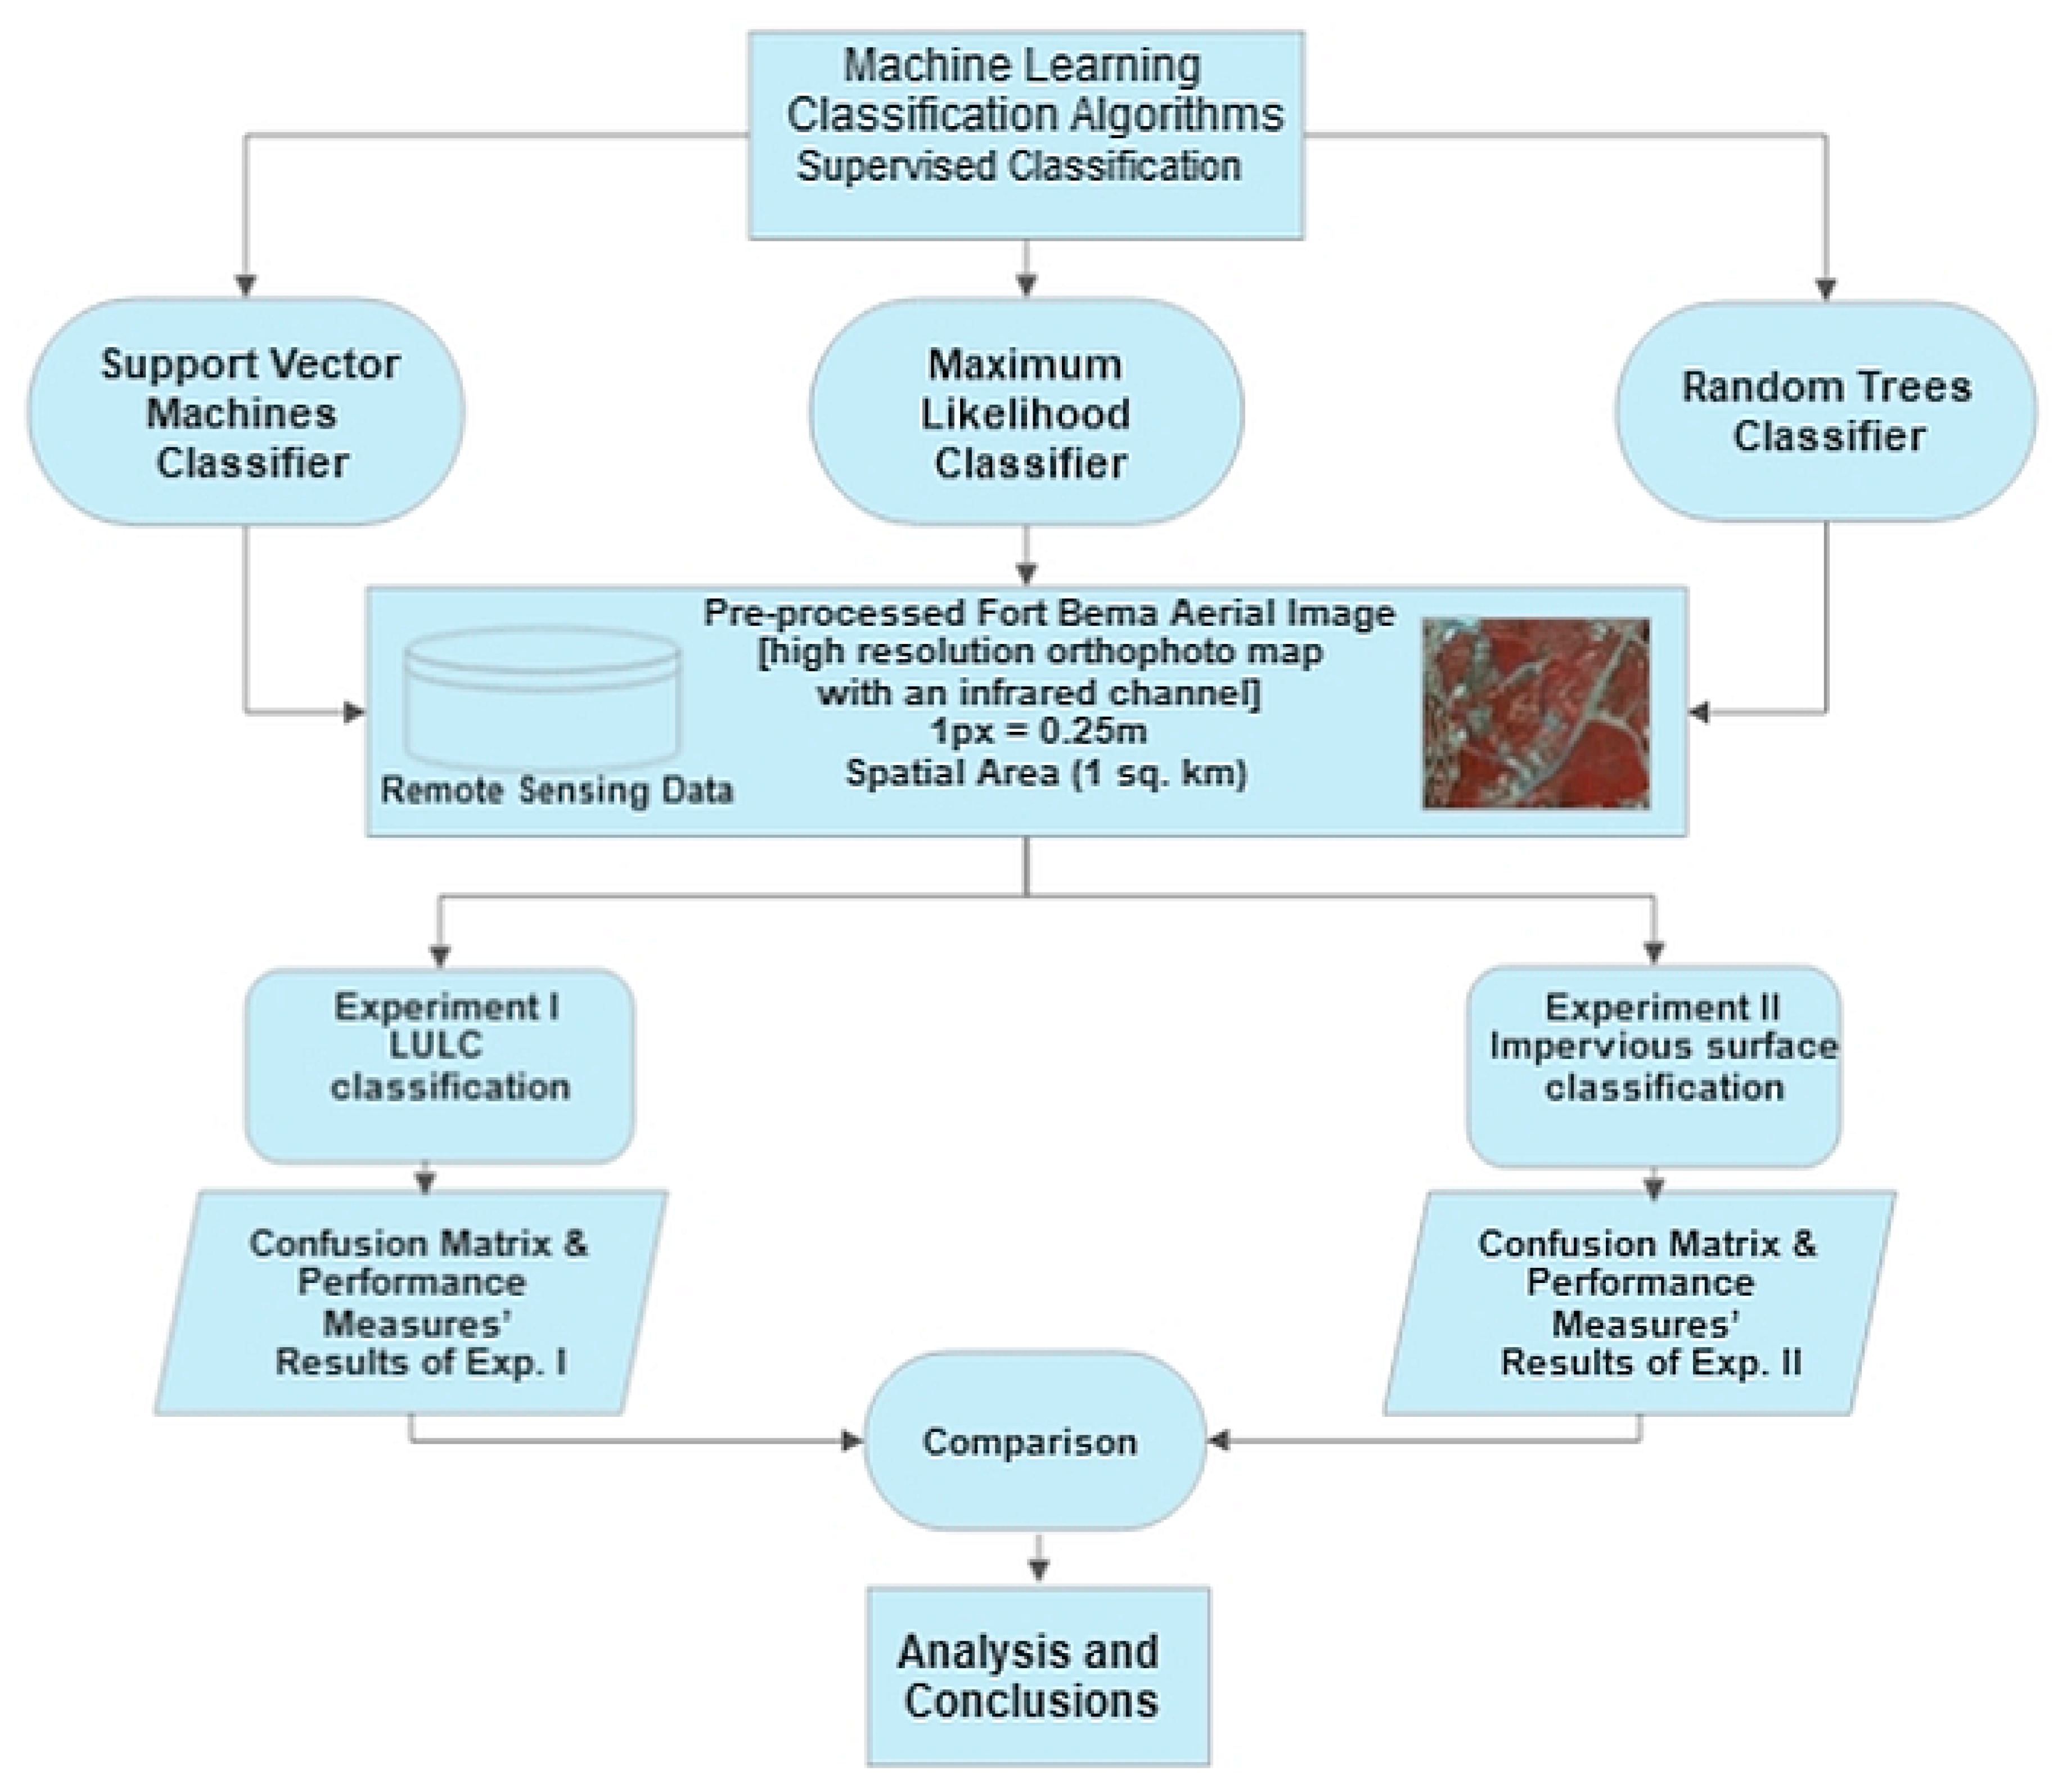
As mentioned in the introduction, the objective of this paper is to investigate the classification of impervious surfaces using remote sensing data and various machine learning classifiers. There are several classification methods used in this type of engineering problems, namely Support Vector Machines (SVM), Maximum Likelihood (ML) and Random Forest/Trees (RT). More specifically, the study is based on the geographic information systems (GIS) that allow the integration and joint analysis of geospatial data (remote sensing imagery (orthophoto maps)) with AI classifiers. In other words, GIS is a system that creates, manages, analyses and links/integrates location data with a map (in the case of this article, these are data for the Fort Bema property in Warsaw-Bemowo with an area of about 1 km2) and provides useful descriptive information. As part of the GIS data types, orthophoto maps used for the purposes of this article are a powerful visual aid and serve as a source of derived information such as planimetry and classification schemes to provide knowledge details related to land use/land cover.
For example, Sobieraj et al. [5,8] point out that decisions about land use plans and development conditions should be coupled with a review of the hydrologic systems for the sites in question and a possible commitment to low-impact developments and SuDS facilities in places where the appropriate hydrologic systems are at risk. Modern technologies offer the ability to very easily verify the degree of urbanization of a given site relative to green space. One such technology is machine learning-based classifiers that can be used to calculate the ratio of urbanized to green space for specific sites. More specifically, methods such as SVM, ML or RT classification allow the extraction of features from multispectral images, and these classification results can then be used for further analysis. It is worth mentioning that the above-mentioned machine learning methods (of which there are many more) are increasingly used to solve many engineering problems [8]. SVM, ML and RT are suitable for identifying impervious surfaces such as roads, roofs and sidewalks. Many local governments use impervious surfaces to calculate stormwater runoff for a property [5,
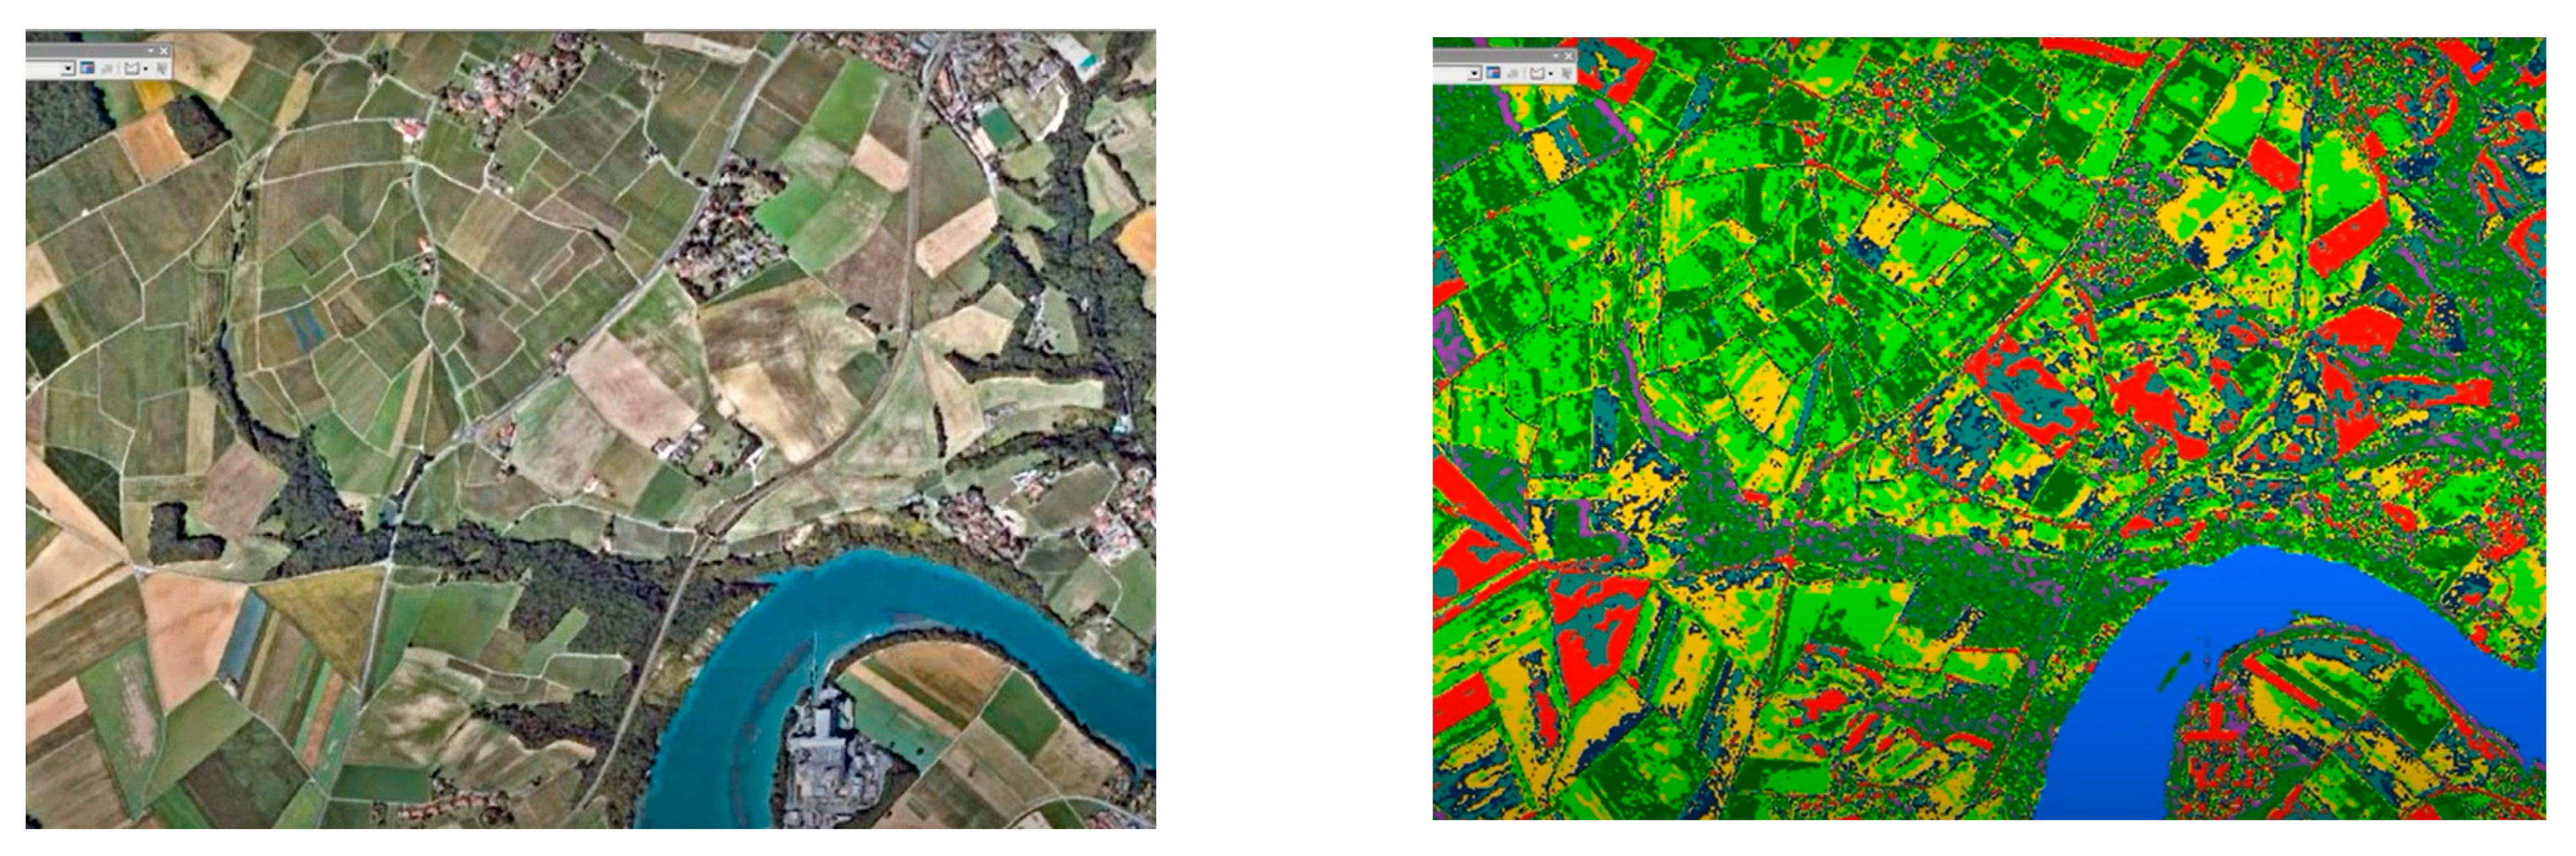
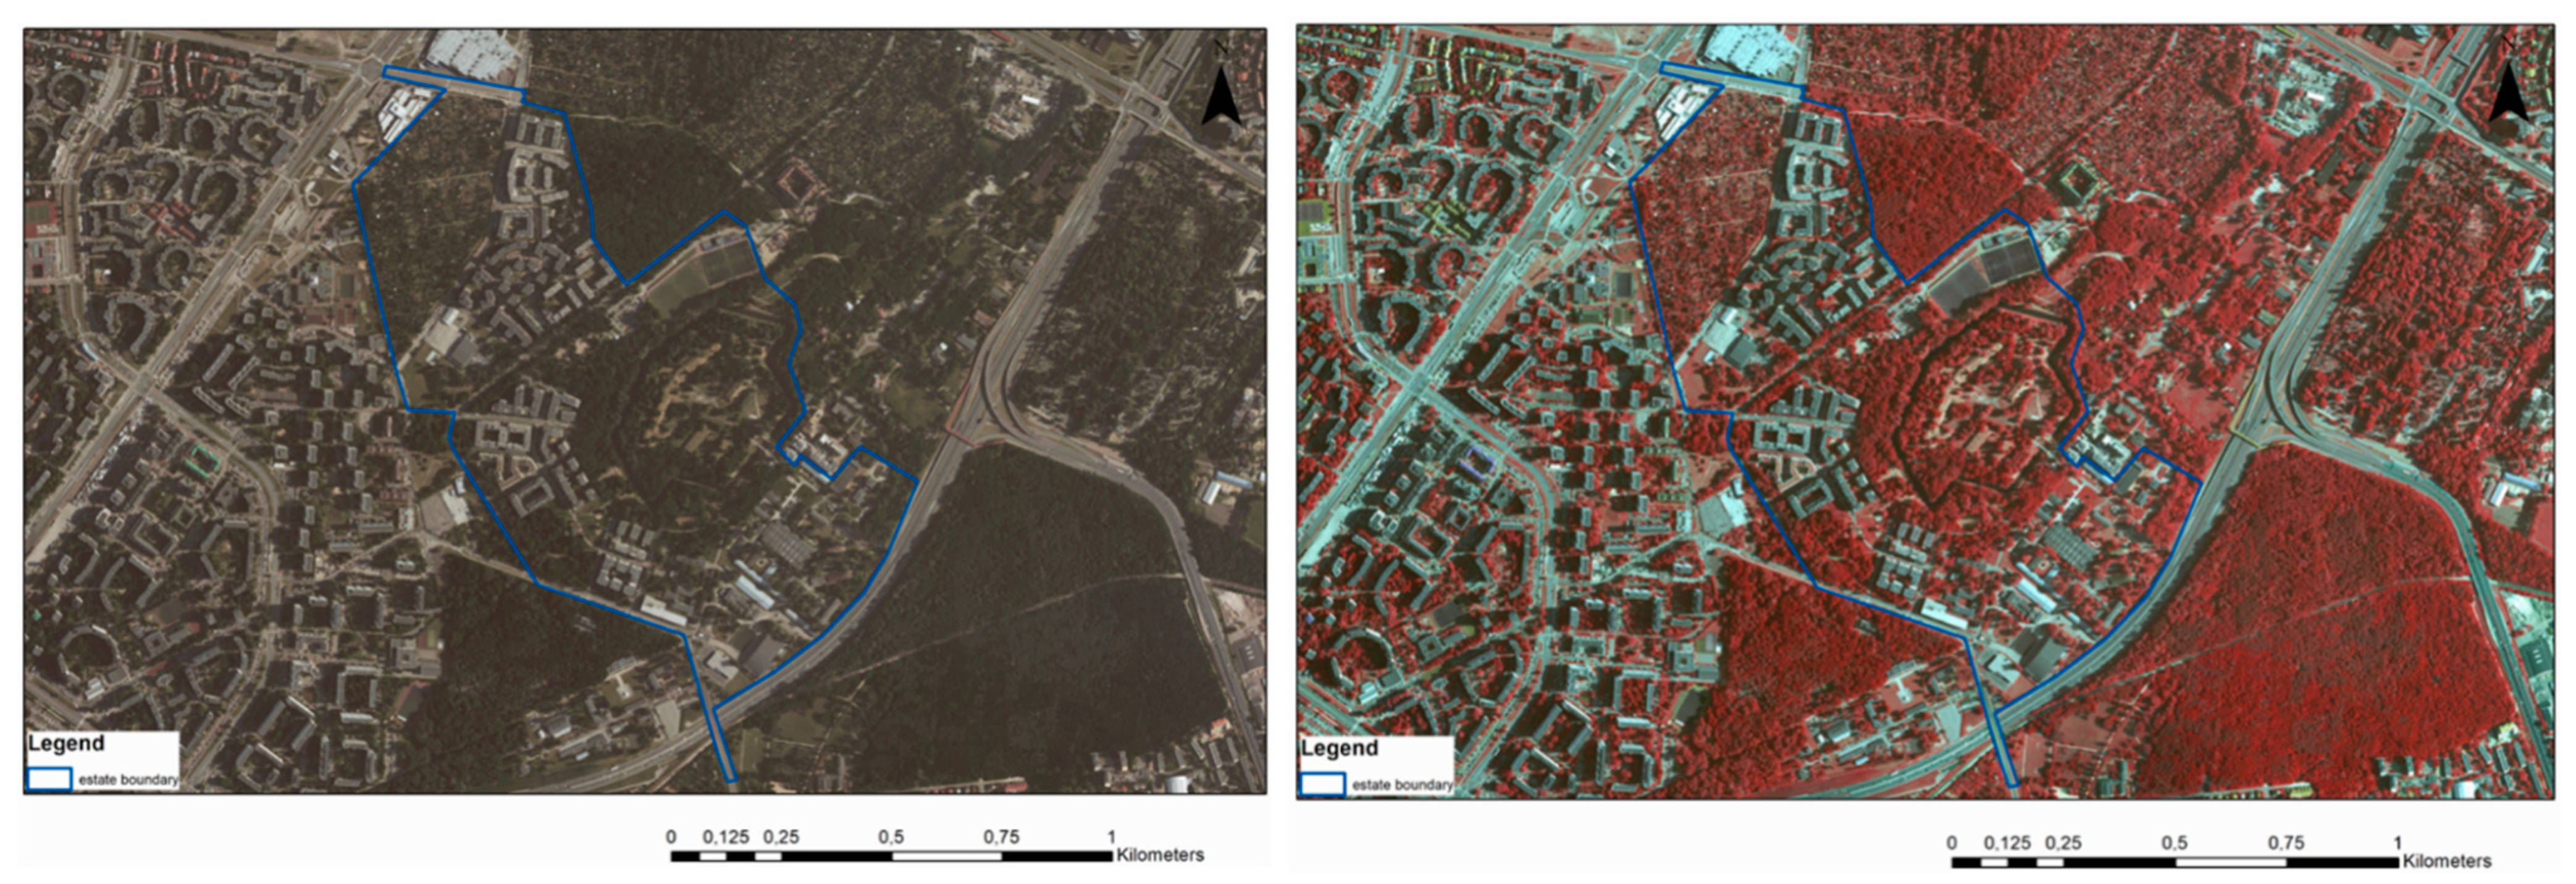
8]. There is a technique consisting of an object-oriented feature extraction method and GIS-based platforms (e.g., the ArcGIS Pro Classification Wizard) to accomplish such a task. Using multispectral imagery (very high resolution orthophotos) containing a near-infrared band, it is possible to perform detailed feature extraction of impervious surfaces. In particular, it is possible to change the combination of image bands to highlight important features such as vegetation and roads. In Figure 1, it can be seen that with the combination of colour and infrared bands, it is very easy to identify vegetation areas in the environment.
The combination of colour and infrared seems well suited for what is to be identified, as man-made features are clearly distinct from vegetation. The study provides a detailed GIS-based analysis with the use of three different AI impervious surface classification methods, which can be used, for example, to evaluate the stormwater bill of the property. Orthophoto maps are used for land cover classification. The next three subsections refer to: (Section 2.1) the spatial area studied, (Section 2.2) the remote sensing data used in the study and (Section 2.3) a justification of why the study of impervious surfaces (using remote sensing and various classification methods) is so relevant and an interesting and important topic from a scientific perspective. A comprehensive overview of the many important studies of impervious surfaces and land cover combined with the various relevant classification methods can also be found in Table A1 in Appendix A, later in this article.

2.1. Spatial Area under Study and Data—Case Study of the Fort Bema Housing Complex

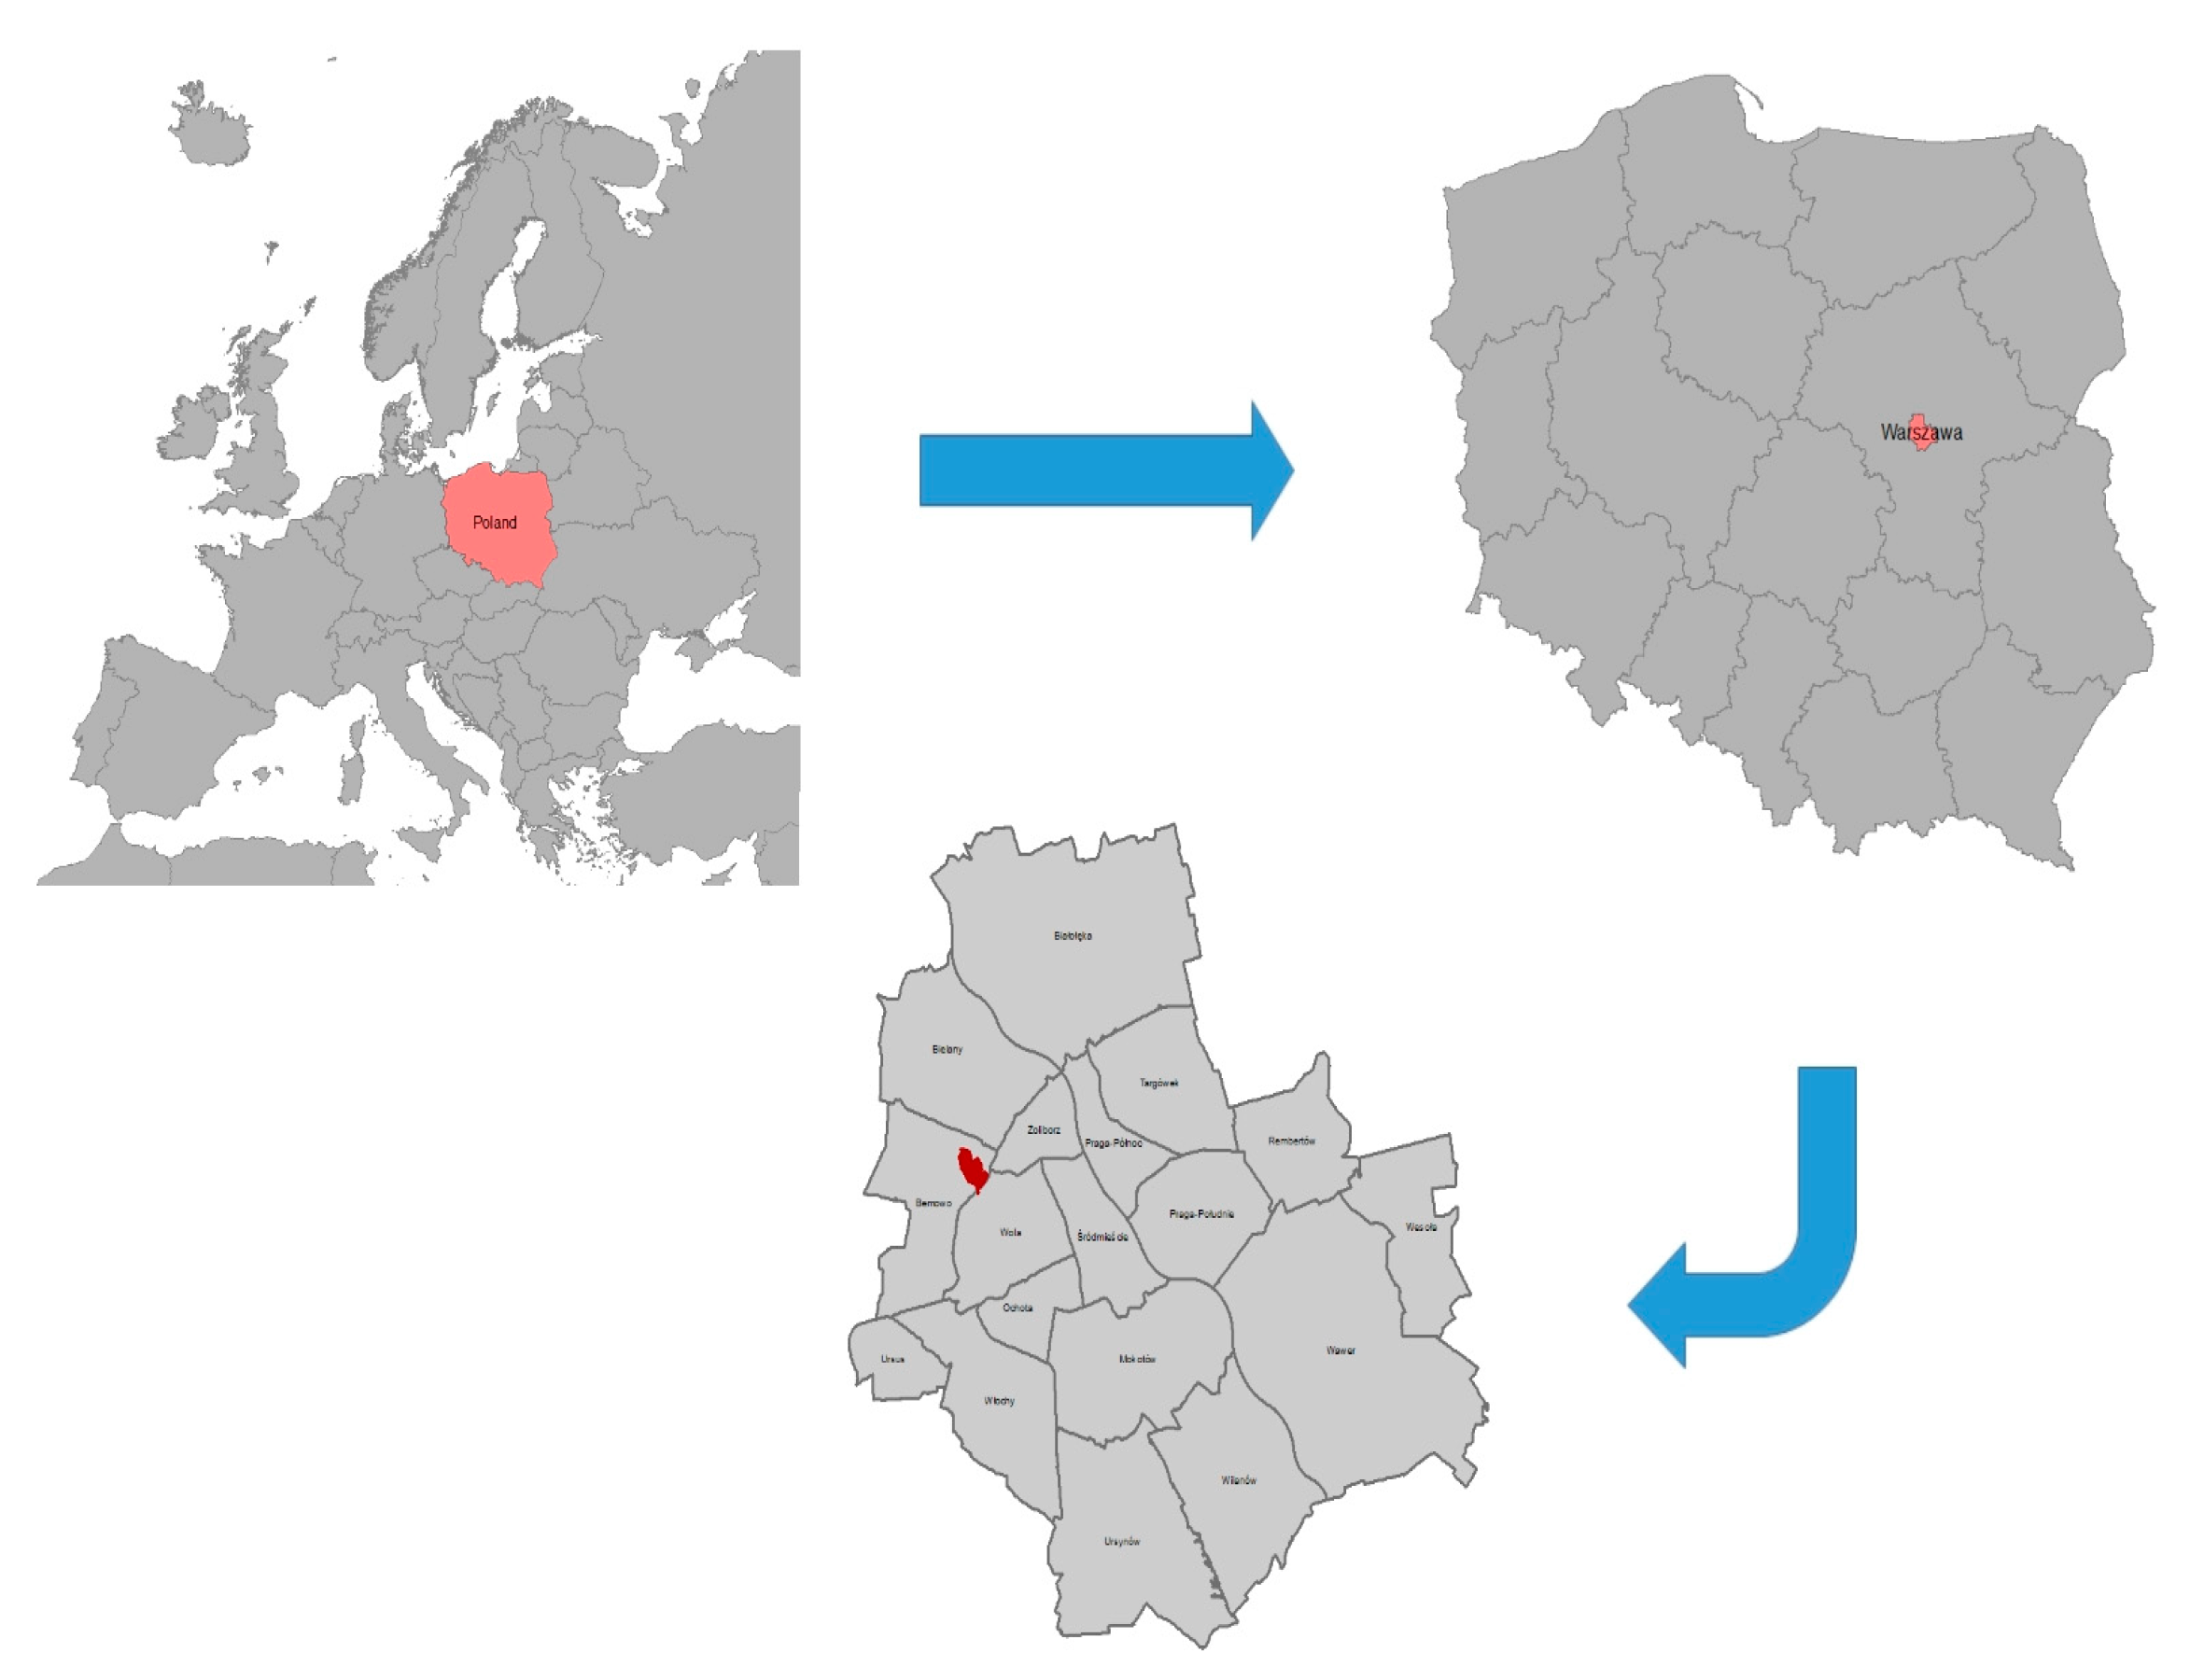
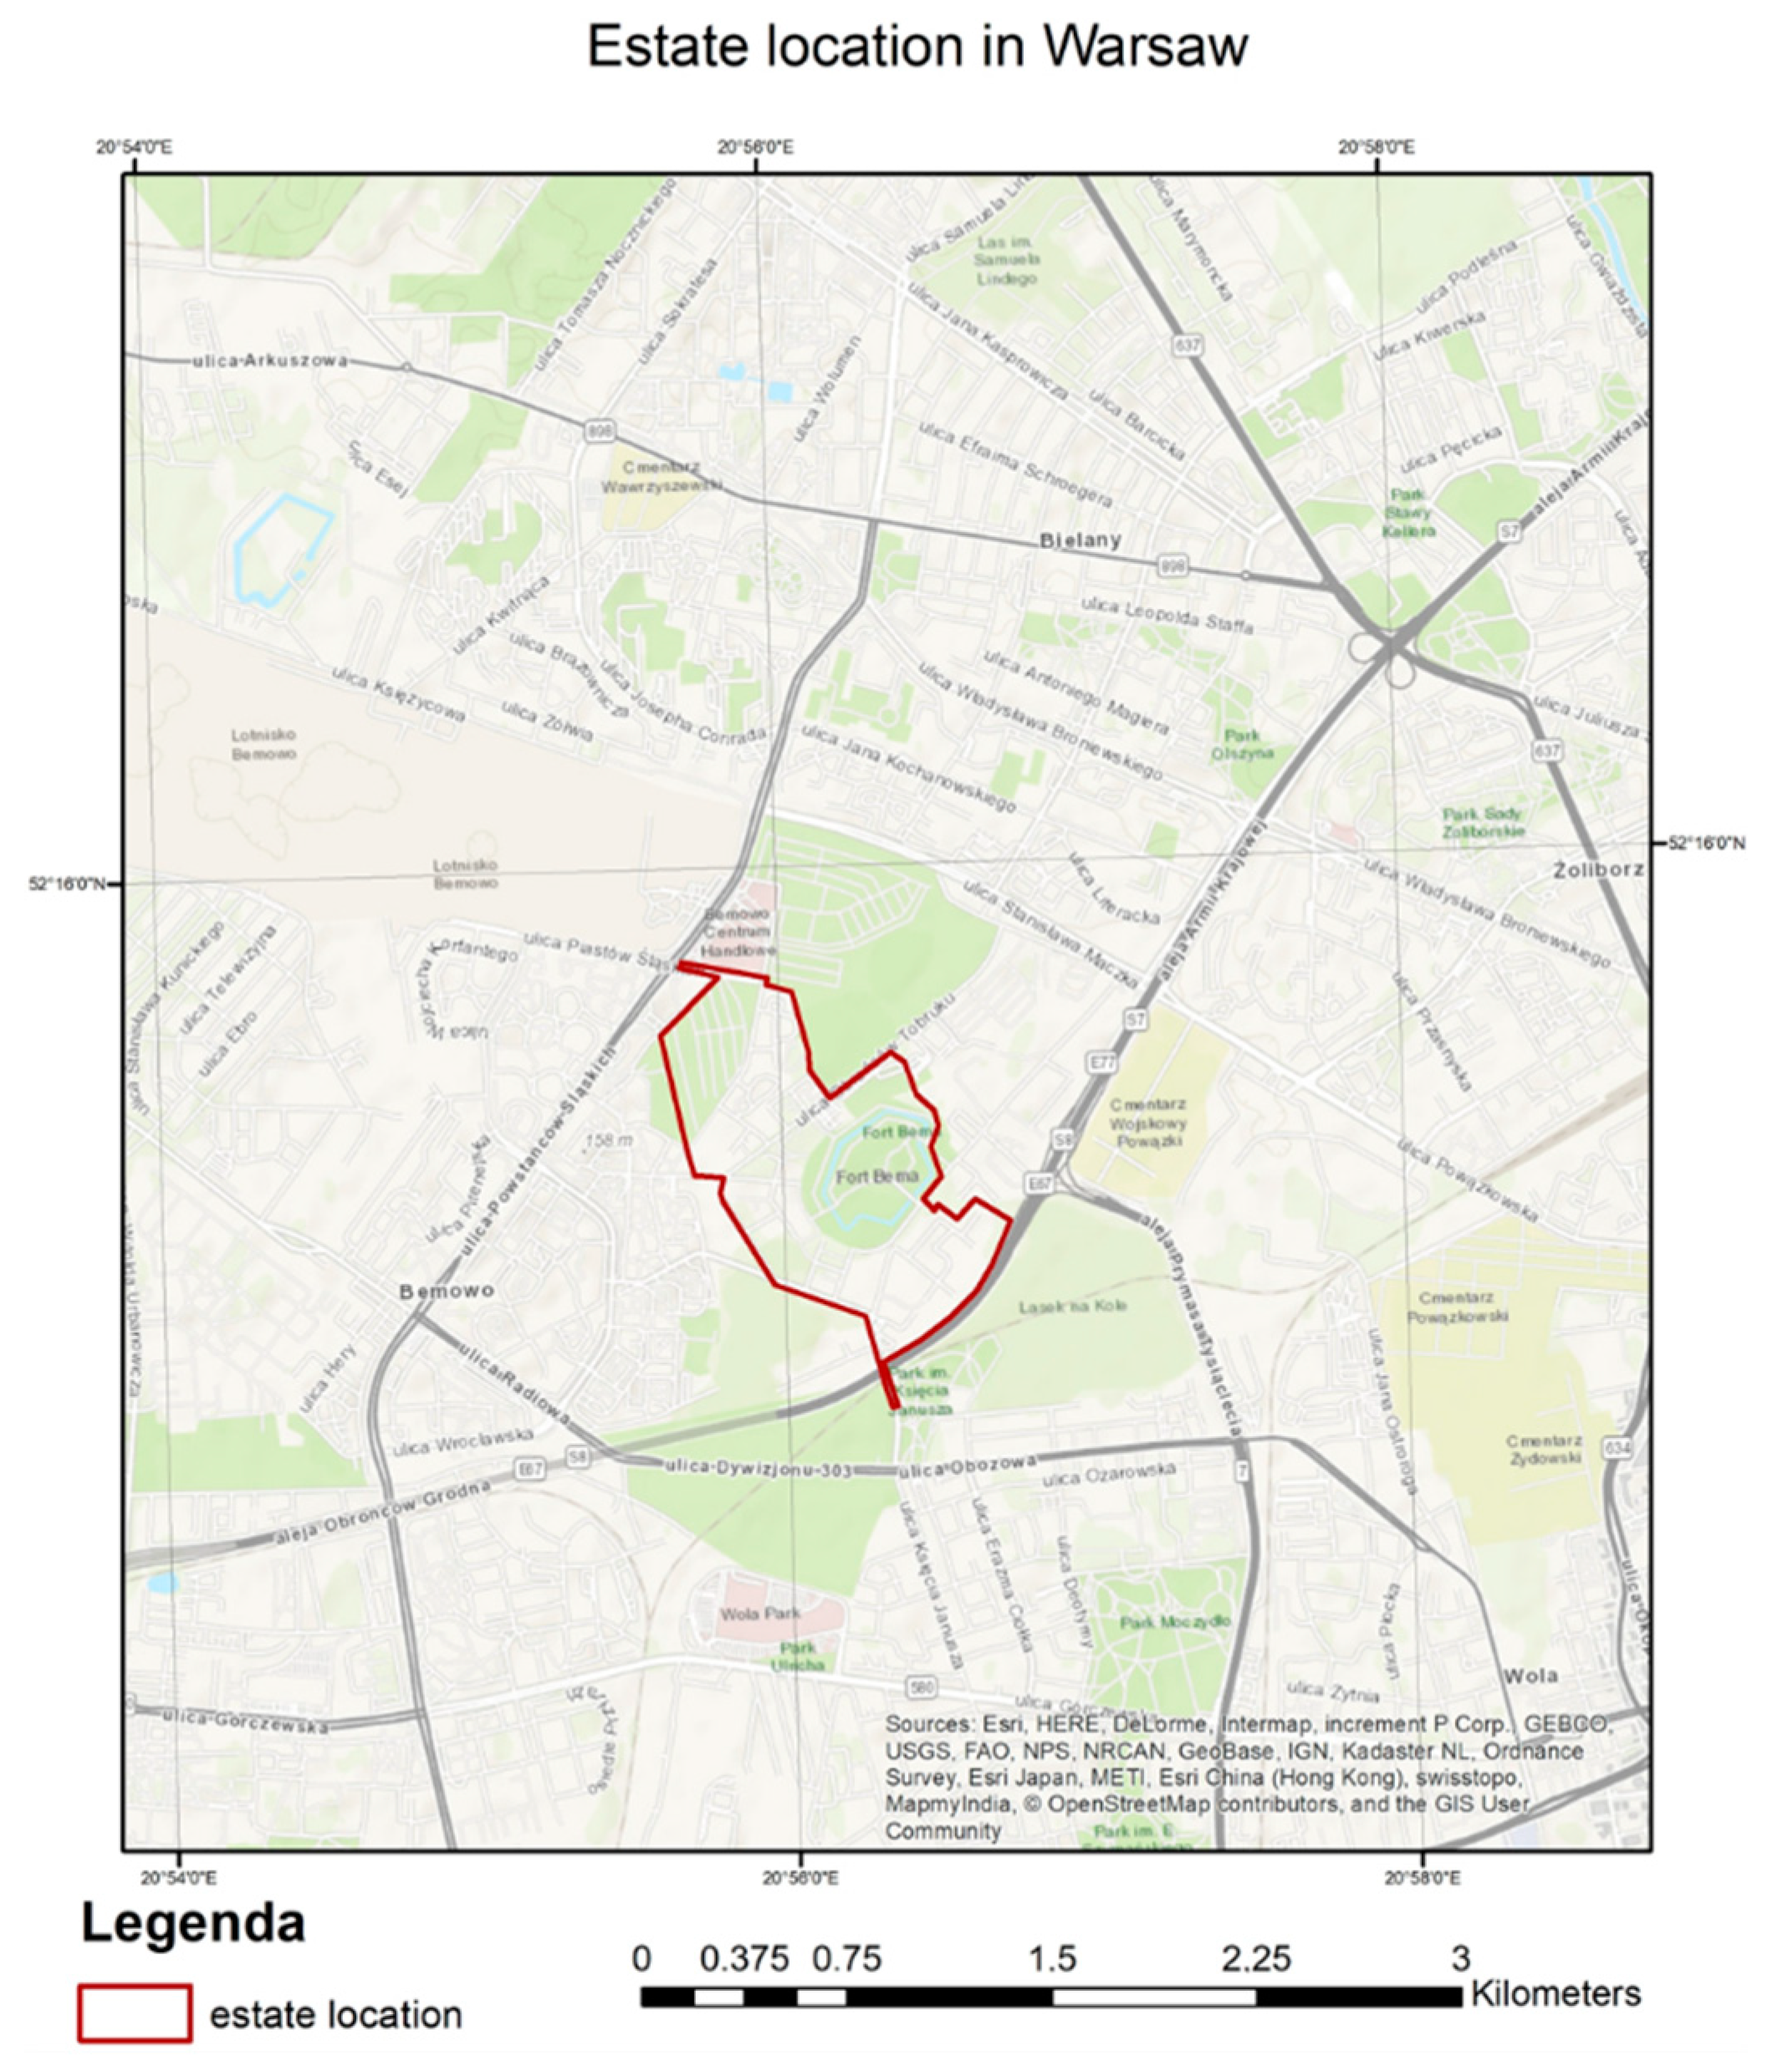
The area under study is located on the edge of the Vistula Basin (between 52°14′–52°16′ N and 20°55′–20°57′ E) and its spurs into the Bemowo Forest and further into the Kampinos Primeval Forest. Figure 2 shows Poland against the background of Europe, then Warsaw (in relation to Poland) and finally the geographic area under study within Warsaw itself. Fort Bema, also known as Fort Parysów (after the name of the village), was built in 1886–1890 as part of the Inner Ring of Warsaw Fortifications—a complex of forts and other fortifications built around Warsaw by the authorities of the Russian Empire in the period from 1879 to 1913. Earlier it was an ammunition depot and later the site was used by various army units. Among others, the equestrian section of the military sports club “Legia” had its headquarters here. In 2002, the area was revitalized, the banks of the ditch were cleaned and new bridges were built over the ditch. In the summer season there is a water bike rental service. Fort Bema residential estate complex is one of the largest housing estates in Warsaw–Bemowo district [5,8]. It was built in 1999–2011, with a part of 1,480,000 (i.e., 148 hectares) earmarked for urban development and land use, and built with residential buildings (about 200,000 sqm of usable and residential space + services) [5,8,
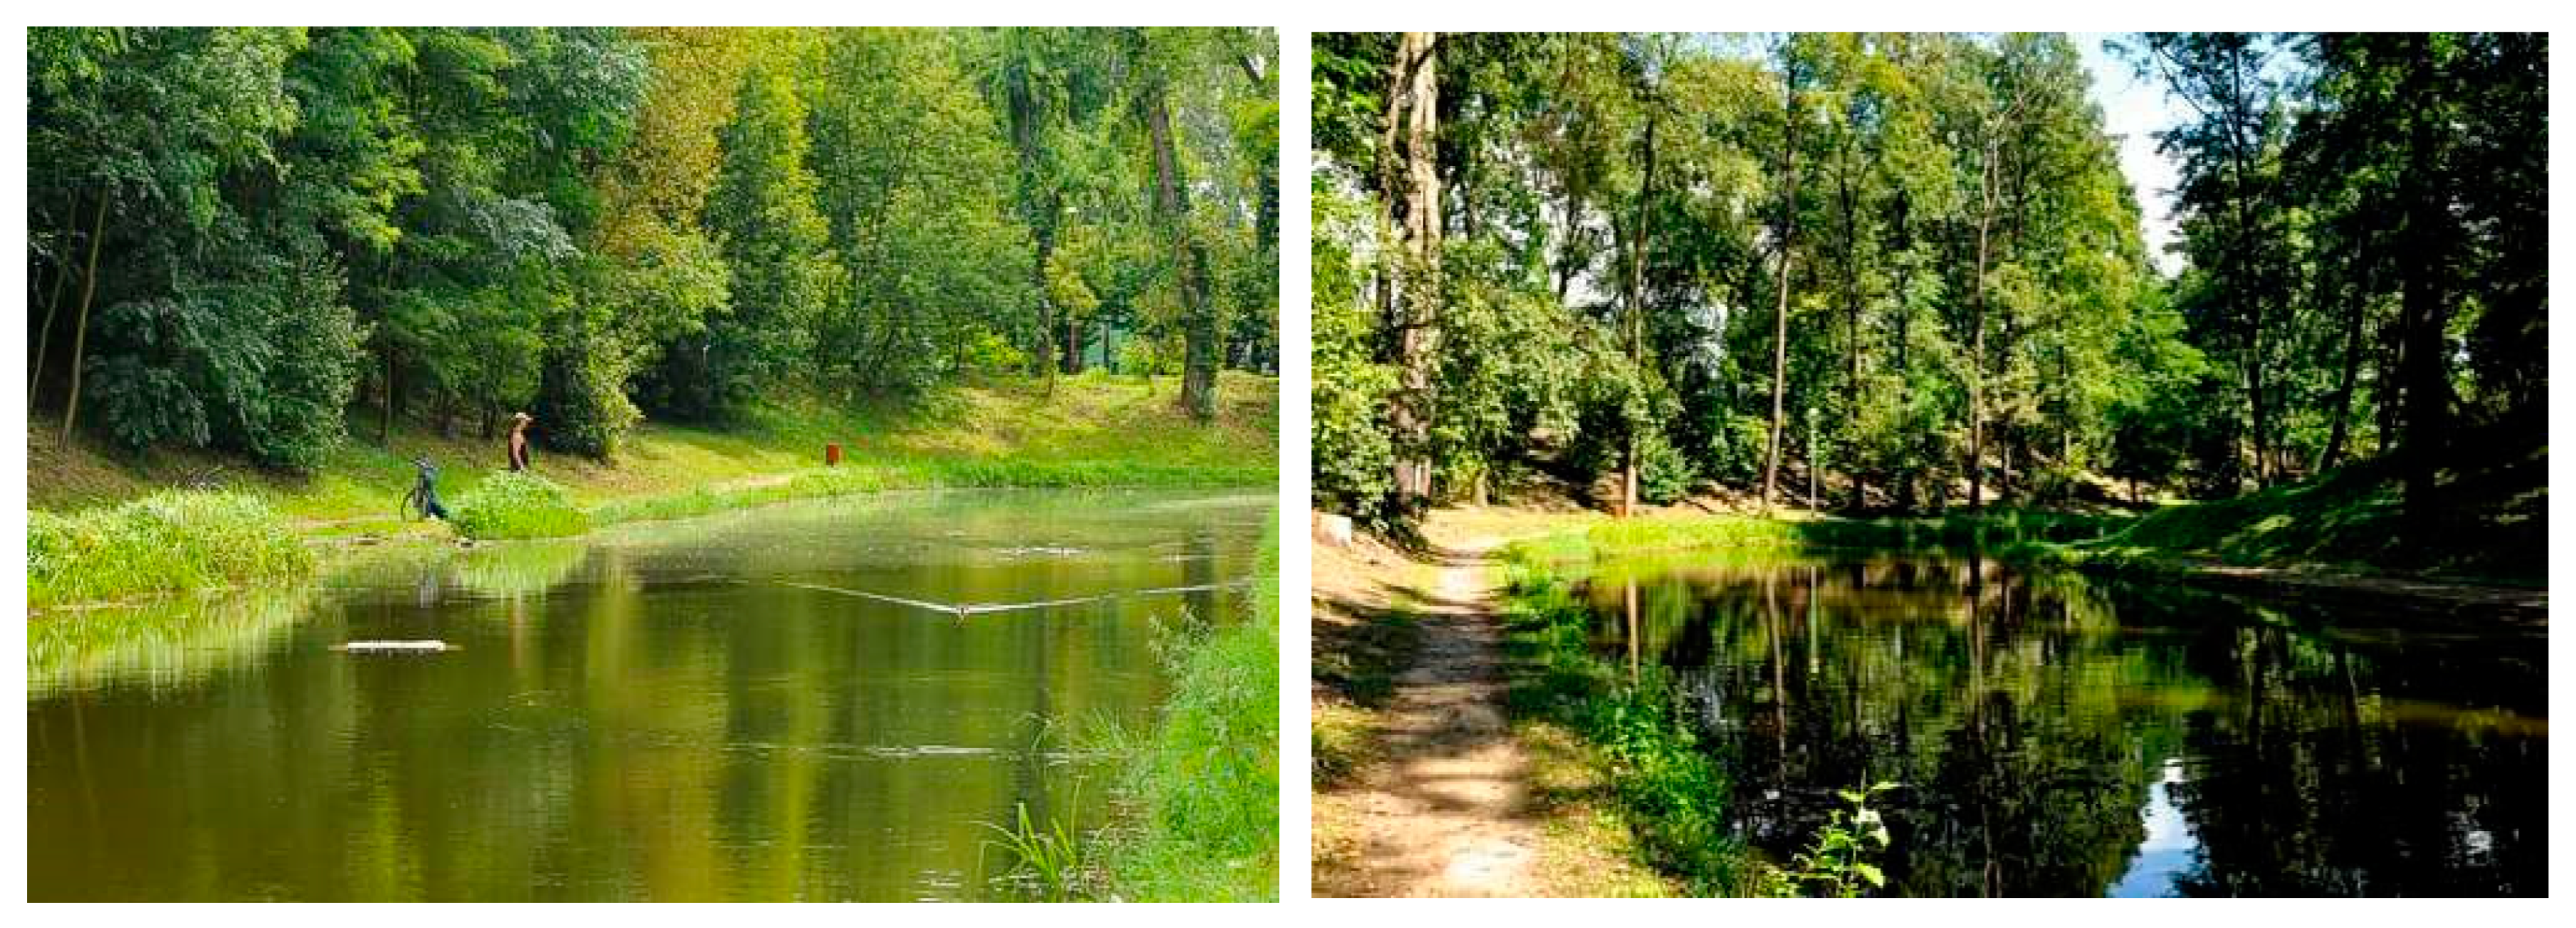
26]. New housing estates are being built in the area, but the fortress still has many meadows and trees, which are a good source of food for dragonflies (see Figure 3).

2.2. Remote Sensing Data Used in the Study

Publicly available satellite imagery has at best a pixel resolution of 10 m (Sentinel) or 25 m (Landsat). It should be noted that the quality in such a case is rather poor and insufficient when it comes to surveying the area of a housing estate in the order of 1 square kilometre (for use with the expected accuracy of classification). In the case of the study of the residential area of Fort Bema, we needed high-resolution data, as such images provide much better results. Therefore, the survey conducted for this article used orthophotos with an infrared channel and a pixel size of 0.25 m, which provide much more accurate results. The data are from 2017 (or more precisely, 27 May 2017). The data were used for classification by the different methods presented in this article, i.e., SVM, ML and RT. ArcGIS software was used for the classification. The orthophoto map is provided free of charge on Geoportal (https://www.geoportal.gov.pl/, accessed on 3 November 2022). Unfortunately, 2017 was the last year it was acquired with an infrared channel, and no more recent data are available. For the NDVI, we used data from SENTINEL—10 m resolution, the satellite imagery is from 9 May 2022, and the data were downloaded from Earth Explorer (https://earthexplorer.usgs.gov, accessed on 2 November 2022). In addition, we would not obtain sufficiently accurate imagery from Landsat or even Sentinel and expect satisfactory classification results at the settlement/ neighbourhood level of one square kilometre. The orthophotos used for the purposes of this article, on the other hand, are optical aerial photographs (and thus non-satellite and non-radar) that have been orthorectified, i.e., they have been given an appropriate coordinate system. The use of these data is therefore supported by the accuracy of the resulting product and the presence of the near-infrared channel.
Figure 4 shows the visual composition with the housing estate and the NIR band. The blue colour indicates the boundaries of the FORT-BEMA housing estate, which is located in the western-northern part of Warsaw.

2.3. Impervious Surfaces

Impervious surfaces are man-made associated structures such as roads, sidewalks, parking lots, roofs and other outdoor facilities of an anthropogenic nature [1,7,27]. They are an important determinant of the degree of urbanization and have a direct impact on water and temperature cycles and water quality—and thus on the ecological health of the areas they affect [5,6,7,8,11,12]. In this context, Weng [1] and Yu et al. [7] point out the increasing need for detailed maps showing impervious surfaces. Since the size of impervious surfaces is variable, it would be good if such maps were as reliable as possible while being up-to-date and reflecting the latest state of affairs. Therefore, cost-effective methods are even more important in this context. Weng [1] has reviewed various surveying methods with particular emphasis on remote sensing, which has been practiced for more than half a century [28].
Deng et al. [9] emphasize that the knowledge of impervious surface is used as an important indicator and also as an input parameter for the simulation of water management, hydrological cycle and pollution assessment of the studied area. In this context, it can be used to evaluate the environmental changes in the studied areas [9,29]. Wu and Murray [29] emphasize that the analysis of impervious surface changes is particularly important for a better understanding of the urban environment and human activities. Yang et al. [13] state that accurate and up-to-date geospatial data on urban impervious surfaces are used for multilevel studies of urban ecosystems and, in particular, to study land use planning issues, resource management, urban hydrology and local climate. Weng [1] highlights various approaches to characterizing and quantifying impervious surfaces and devotes much space to remote sensing, in particular providing some chronological context for the development of this method. The author emphasizes that although remote sensing data have been used since the 1970s, it is only since the beginning of the first decade of the current century that they have really been used extensively. Furthermore, Weng [1] points out the different approaches and techniques used to process remote sensing data in terms of space, spectrum, texture and the actual context of these data.
The use of high-resolution remote sensing data plays an important role in monitoring subtle urban changes (referred to as subtle urban dynamics) [2,3,4]. In addition to the remote sensing data themselves, appropriate methods are still needed to extract impervious surfaces with sufficient efficiency, especially when dealing with the problem of spectral heterogeneity—which is particularly important when extracting impervious surfaces in a diverse environment, especially with high-resolution data [2,3,4,30]. Lu et al. [30] point out that mapping and monitoring the dynamic changes in impervious surfaces in a complex urban–rural interface is particularly challenging due to the spectral confusion of impervious surfaces with other non-vegetated land covers (the so-called mixed pixel problem), and the use of very high spatial resolution satellite imagery is required to address this problem. It is worth mentioning that the multidimensional heterogeneity of the data leads, among other things, to spatial misregistration manifested by the parallax effect, i.e., the incompatibility of different images of the same object observed from different directions (considering different viewpoints)—which is particularly relevant for high object structures [4]. Huang et al. [4] emphasize that there are few studies that use high-resolution data to detect changes on large geographic scales. According to Bauer et al. [10], Landsat TM data are well suited to quantify the degree of surface imperviousness (over large areas and over a long period of time, at moderate cost); the measure of imperviousness can also be used as a proxy for assessing environmental quality.
As Arnold and Gibbons [31], Weng [1] and Yu et al. [7] have noted, impervious surfaces are anthropogenic objects that promote infiltration into the soil and are good indicators of the degree of urbanization and environmental quality [2,29]. Wu and Murray [29] and Liu et al. [2] emphasize that impervious surfaces are an important indicator to observe and analyse changes in urban land cover and draw some conclusions about human–environment interactions. Schueler [12] notes that the specificity of impervious surfaces due to their large impact on watershed hydrology, means that their analysis at different scales brings together specialists from different disciplines, from various activists, planners, officials, architects, engineers to scientists and social scientists. Weng [1] emphasizes that hydrology is influenced by both the size and spatial pattern (including geometry and location) of impervious surfaces. Size, of course, refers to the ratio of impervious to pervious surfaces. An increase in the latter ratio in turn determines the intensity of water runoff, more specifically its volume and duration [5,32].
Moreover, it is widely recognized in land use planning that the negative impacts of impervious surfaces associated with transportation infrastructure are more harmful compared to those of rooftops [1,32]. In most cases, an increase in impervious surfaces leads to insufficient groundwater recharge and an increase in runoff during storm events [1,14]. This, in turn, leads to an increase in the frequency of flooding and localized inundation [5,8] and also affects water quality in the watercourses of the watershed in which they are located. In addition, there are also studies that show that wherever the ratio of impervious to pervious surfaces increases, pollution (contamination) from nonpoint sources also increases [15]. This is due to increased transport of toxic pollutants, pathogens and various types of sediments. In turn, the disturbance associated with the hydrological cycle in an area (manifested, among other things, in water pollution, but also in runoff rates and an increase in runoff volume) in turn leads to a disturbance of the natural ecosystem as a whole (i.e., the biota) and, in particular, can lead to an impairment of aquatic habits, such as a disturbance of riparian areas and habitats [1,14]. This is perfectly illustrated by a study conducted by Gillies et al. [14], who used remote sensing data to examine the effects of urbanization on aquatic fauna in the Line Creek watershed in Atlanta. In the study, the authors presented impervious surfaces as an ecological indicator to explain the impact of water resources on mussel populations in three watersheds. The study shows that the extent of impervious surfaces increases habitat degradation for mussels. In other words, the loss of species (in the order of 50–70%) could be attributed primarily to the areas where the expansion of impervious surfaces was observed. Hence the great importance of this issue.
The size of impervious surfaces affects not only water management but also climate by causing, among other things, changes in warm air movement. Williams et al. [33] and Sobieraj et al. [5,8] point out that rapid urbanization due to the increase in impervious surfaces and climate change makes urban communities more vulnerable to natural hazards and weakens urban resilience [5,33]. Sabine et al. [34] and Sobieraj et al. [5] highlight that increased urbanisation and the associated increase in impervious surfaces pose an increased risk to climate change, including by altering carbon cycling and other biogeochemical processes, and by disrupting heat fluxes within urban canopies and boundary layers [13]. Sobieraj et al. [5,8] note that the so-called precipitation peaks are also becoming more frequent, which in the case of large cities turn them into heat islands (partly due to soil properties and the degree of urbanization). This is due to the pressure of the heated air masses on the city, and this additional energy is released at the periphery of the cities [5]. An insufficient ratio of impervious to pervious surfaces leads to a decrease in vegetation production (decrease in vegetation cover, changes in cover within the watershed and thus in vegetation production). Depending on the type of land use (the particular land use category), the percentage of land covered by impervious surfaces may vary [1]. Weng [1] points out that mapping impervious surfaces is therefore particularly important, especially in the context of their central role in monitoring human–environment interactions and environmental change [2]. Similarly, Sobieraj et al. [8] emphasized the need to map impervious surfaces in the context of a range of sustainable drainage technologies and small-scale architecture (SUDS, WUDS, LIDs).
There are a number of reasons that justify the need to map and estimate impervious surfaces, such as urban planning issues, hydrological condition assessment, water quality assessment, but also to facilitate the handling of stormwater taxation issues, and finally this would allow better environmental management, facilitate the concern of sustainable urban development, including the construction of adequate facilities and urban infrastructure [1]. Impervious surfaces can be estimated based on ground measurements (field measurements with GPS) and remote sensing data [1]. The former are accurate and reliable, but also very time consuming and expensive [1]. Other methods include digitizing paper maps, using aerial imagery, scanning and feature extraction using appropriate algorithms [1]. Satellite imagery and aerial photography have been used for environmental studies since the 1970s [27]. Slonecker et al. [27] mention imperviousness modelling as one of the applications of these images, in addition to interpretive or spectral applications, etc. The mapping and measurement of the impervious surface is well described in the work of Brabec et al. [11]. In their work, these authors refer to the use of various methods, including the use of aerial photography and the measurement of impervious surface either based on a planimeter or by overlaying a special grid and counting the intersections on this grid; other methods include image classification and estimation of the percentage of urbanization in a given area. Weng [1] points out that the use of remote sensing to estimate impervious surfaces was rare in practice until the end of the last century because there were no suitable remote sensing sensors for analysing and estimating such surfaces, computational power was inadequate at the time (standards were not satisfactory in this regard), and finally, suitable techniques for digital processing of such images (with resolution less than 5 m) had not yet been developed. The increasing interest in the application of remote sensing to the measurement of impervious surfaces (with the beginning of the 21st century) was also accompanied by a corresponding increase in the number of scientific studies on this topic. Against the background of all studies dealing with remote sensing, the estimation of impervious surfaces (using remote sensing) had one of the highest citation rates, indicating that this particular area of knowledge is rapidly growing and gaining popularity [1]. In the context of growing awareness of environmental threats (e.g., climate change and problems in hydrological systems), research on estimation of impervious surfaces (using remote sensing and various methods) is increasingly being conducted by various government agencies and non-governmental organizations with the intention of mapping and collecting information about these surfaces for various civil and environmental objectives.

3. Methodology

Two types of classification (using machine learning algorithms: SVM, ML and RT classifiers and high resolution orthophoto maps /0.25 m per pixel/) are performed in the study. First, the land use/land cover classification is presented (for 7 classes—C1—water; C2—forest; C3—paved/asphalt roads; C4—artificial surface; C5—roofs and sidewalks; C6—grassland; C7—bare ground). The same study is then repeated for 2 classes (i.e., C1—pervious; C2—impervious). The point is that comparing the confusion matrices, precision, RMSE index and kappa index for each method—for 7 and 2 classes, respectively—can also provide relevant inferences from such a comparison, given some specificity of each method. A suitable platform GIS (ArtGis Pro 2.9 software) was used to perform the classification. Section 3.1, Section 3.2 and Section 3.3 briefly present the assumptions on which each of the classification methods used is based. The main steps of the study are presented below in the form of a flowchart (see Figure 5):

3.1. SVM Classifier

Support Vector Machines (SVMs) are a type of supervised learning algorithm that can be used for both classification and regression tasks. The main advantage of an SVM is that it can achieve very high accuracy on a large number of data sets, even on relatively small training sets. SVMs are also versatile, as they can be used with various types of kernel functions to learn nonlinear decision boundaries.
Classification algorithms such as SVM (classifier) use an appropriate decision function to determine the magnitude of a point in a hyperplane. The assumption of a suitable decision function is necessary because it is used to indicate how close the points in the plane are to each other (i.e., to denote the magnitude of the hyperplane), and within the bounds of such a decision function, the classifier then classifies the model. Thus, for a given training set S = { ( X 1 , y 1 ) , , ( X , y ) } n × { 1 ; 1 } , a suitable decision function must first be found for which a convex optimization problem must be solved to display the results of such training. Fauvel et al. [35] have formulated this problem as follows:
M a x a g ( a ) = i = 1 ε α i 1 / 2 i , j = 1 ε α i α j y i y j k ( x i , x j ) ,
with 0 α i C , where α denotes the Lagrange coefficient, the kernel function is represented as k , and the training error is represented as the constant C . After solving Equation (1) (the solution is αi), the correct classification of a sample x is performed by checking the sides of the hyperplane to which this sample belongs, which can be represented as follows [35]:
y = s g n 1 2 i = 1 ε α i y i k ( x i , x ) + b
Class separation in an SVM classification system (based on statistical learning theory) involves the use of a decision surface (called the optimal hyperplane) that maximizes the margin between classes. The support vectors (critical elements of the training set) are the data points closest to this hyperplane. When the classes are not linearly separable, the SVM classification uses different types of kernels, e.g., polynomial, sigmoidal or radial. In most cases, this classification method is used to separate two classes (as a binary classifier), but it also provides the possibility of separating multiple classes. To perform such classification, the SVM classifier is treated as a binary classifier separating every possible pair of classes (such binary classifiers are combined). In image classification (where accurate results are important), the higher accuracy of the SVM classifier is achieved by relying on a smaller number of training pixels. The radial and sigmoidal kernels show high sensitivity to the a priori parameters, which is considered a weakness of this method, since its efficiency largely depends on this point [36]. Another important point is that the SVM method is not used in applications that require excessively fast classification to avoid too many support vectors [37].
The SVMs determine the bounds of the decision function whose results yield the optimal class separation [38]. Pattern recognition itself involves assigning the results of the decision function to one of two linearly or nonlinearly separable classes. In the case of linear separation, the SVM classifier identifies a linear decision boundary and maximizes the margin between the classes, defined as the sum of the distances to the hyperplane from the nearest points of the two classes [38]. Appropriate quadratic programming optimization techniques (QP) are used here to solve such a maximization problem. The data points (so-called support vectors—hence the name of this method) closest to the hyperplane are used to measure the margin (their number is always small) [38].
For nonlinearly separable classes, on the other hand, the SVM classifier finds the appropriate hyperplane by making a tradeoff between maximizing the margin and minimizing the magnitude reflected in the number of classification errors. This tradeoff can be optimized by appropriately (positively) varying the constant C described above (which, as mentioned earlier, expresses the penalty of training errors) [39]. The SVM classifier also supports nonlinear decision surfaces by assuming a high-dimensional feature space onto which the input data are projected. A linear classification problem is formulated in this feature space, which is mapped to this space in a nonlinear manner [40]. Since such a high-dimensional feature space would require high computational costs, suitable kernel functions are used to reduce them accordingly [38]. The SVM method also supports multi-class classification methods. In this case, the matching methods “one-against-one” and “one-against-all” are used [38].

3.2. Maximum Likelihood Classifier

Maximum likelihood (ML) is a statistical method commonly used for estimation and prediction in machine learning. ML estimates the probability of each possible outcome and then selects the one with the highest probability as the predicted label. ML is popular because it is simple and easy to implement; however, overfitting can occur if the training data are not representative of the true underlying distribution. In other words, ML is a supervised classification method based on Bayes’ theorem and assumes that the membership of a given data case (e.g., a pixel) to a class i can be expressed using the following equation:
P ( i | ω ) = P ( i | ω ) / P ( i ) P ( ω )
where the features of a given data case (e.g., a pixel) can be described as a vector ω , P ( i | ω ) is the a posteriori probability distribution (expressing that a data value with feature vector ω belongs to class i ), P ( ω | i ) is the likelihood function, P ( i ) reflects the information before the classification experiment, i.e., the a priori probability that a given class i is determined before classification. Assuming that the number of classes is equal to m , the probability P ( ω ) that ω is observable (often referred to in the literature as the so-called normalization constant) can be expressed as follows:
P ( ω ) = i = 1 m P ( i | ω ) / P ( i )
where, sigma, i.e., i = 1 m P ( i | ω ) sums to 1. It is therefore necessary to introduce the normalization constant P ( ω ) , i.e., to multiply a non-negative function by it and thus make it a probability density function (such that the area under the graph of this function is 1, i.e., the normalization constant ensures that i = 1 m P ( i | ω ) sums to 1). In order to determine which class a particular case should be placed in, it is necessary to determine which a posteriori probability is higher. In other words: When a pixel x is classified, it is recognized as belonging to class i if the following condition is satisfied [41]: x i , if P ( i | ω ) > P ( j | ω ) , for all j I . When accurate training data are available during classification, this method performs very well and is the most commonly used (it is considered the best classification method for such conditions) [42].

3.3. Random Forest Classifier

Random Trees (RT) is an effective machine learning method that relies on a large number of decision trees. A voting system gives each tree the same weight in its result, avoiding overfitting. This method can be applied to classification problems where there are a large number of variables to consider and classes are difficult to distinguish. Since RT is only a classification algorithm based on decision trees, its ability to make predictions is limited depending on the quality of the training data. However, the probabilistic nature of RT allows it to be compared to other classifiers, and it generally performs as well or better than the current state of the art randomization-based models.
The advantages of this method are extended by using many different decision trees and by implementing pruning, which reduces the number of nodes per tree to avoid overfitting. RT classifier is a non-parametric approach that assumes no relationship between the attributes and the output variable. This can be useful when there are strong dependencies between attributes and only a limited amount of training data are available. RT classifiers can be more robust to outliers, but at the same time they can lead to overconfidence in the models. They do not require the sample size to be fixed a priori, but train on an undefined subset and use the votes to make predictions.
More specifically, the classification method RT is based on a combination of tree classifiers, using a randomly selected vector at the level of a single tree classifier, independent of the input vector. To classify the input vector, all N trees cast a unit vote for the most popular class [43]. In this study, the RT classifier is exactly the same as the more popular Random Forest classifier in the literature, i.e., a classifier based on the algorithm developed by Leo Breiman [43]. This classifier is designed to use a random feature or combination of features at each node to grow the tree. Assuming that N is the size of the original training dataset, for each selected feature or combination of features, a special procedure (within RT classification) is applied to generate the corresponding training dataset based on the so-called bagging, where N examples with replacement are randomly drawn [44].
Classification of arbitrary examples (pixels in the case of this study) is carried out by voting for the most popular class with respect to all predictors of the tree in the forest [43]. By choosing the appropriate attribute selection measure and pruning method, the decision tree can be designed accordingly. An important concept related to RT classification is induction, a method for learning decision trees (building classification knowledge) based on a training set [45]. As with decision tree induction, appropriate attribute measures must be selected. There are several approaches for this, but the most common is to assign a quality measure to the attributes. One of the most commonly used approaches for attribute selection is the information ratio criterion proposed by Ross Quinlan [46], where bias against multi-valued attributes is reduced by considering the number and size of branches. Another approach for attribute selection is the Gini index [47]. More specifically, the Gini index is a measure of attribute selection and it measures the impurity of an attribute relative to classes [47]. Assuming that T is a training set, the probability that a randomly selected instance (e.g., a pixel) belongs to class C i is expressed as follows: f C i , T / | T | , while the above-mentioned Gini index can be represented as follows:
j i ( f C i , T / T ) ( f C j , T / T )
Random trees/forest classifiers have many advantages over other decision tree methods (such as the method presented by Quinlan [46]). One of them is that mature trees are not pruned, but grow to their maximum height each time with new training data and for specific feature combinations. As Maheshl and Mather [48] point out, the performance of tree-based classifiers is primarily determined by the choice of an appropriate method for pruning the trees rather than by a feature selection measure. Moreover, this method has the advantage that increasing the number of trees (even without pruning) leads to convergence of the generalization error [43]; due to the law of large numbers, overfitting is also not a problem [49]. To generate a random forest classifier (consisting of N trees), one must first determine a priori the number of features used at each node (which are relevant for generating the tree) and second, the number of N trees themselves. For the best partitioning, only selected relevant features are sought at each node. The actual classification of, e.g., remote sensing images (which is also a given dataset) consists of going through each data case (i.e., one pixel) of such a dataset for each of the N trees and then selecting the class for the specific data case that received the most votes (out of N votes).

4. Results

Figure 6 and Figure 7 and Table 1, Table 2, Table 3, Table 4, Table 5, Table 6, Table 7 and Table 8 show the respective results. 
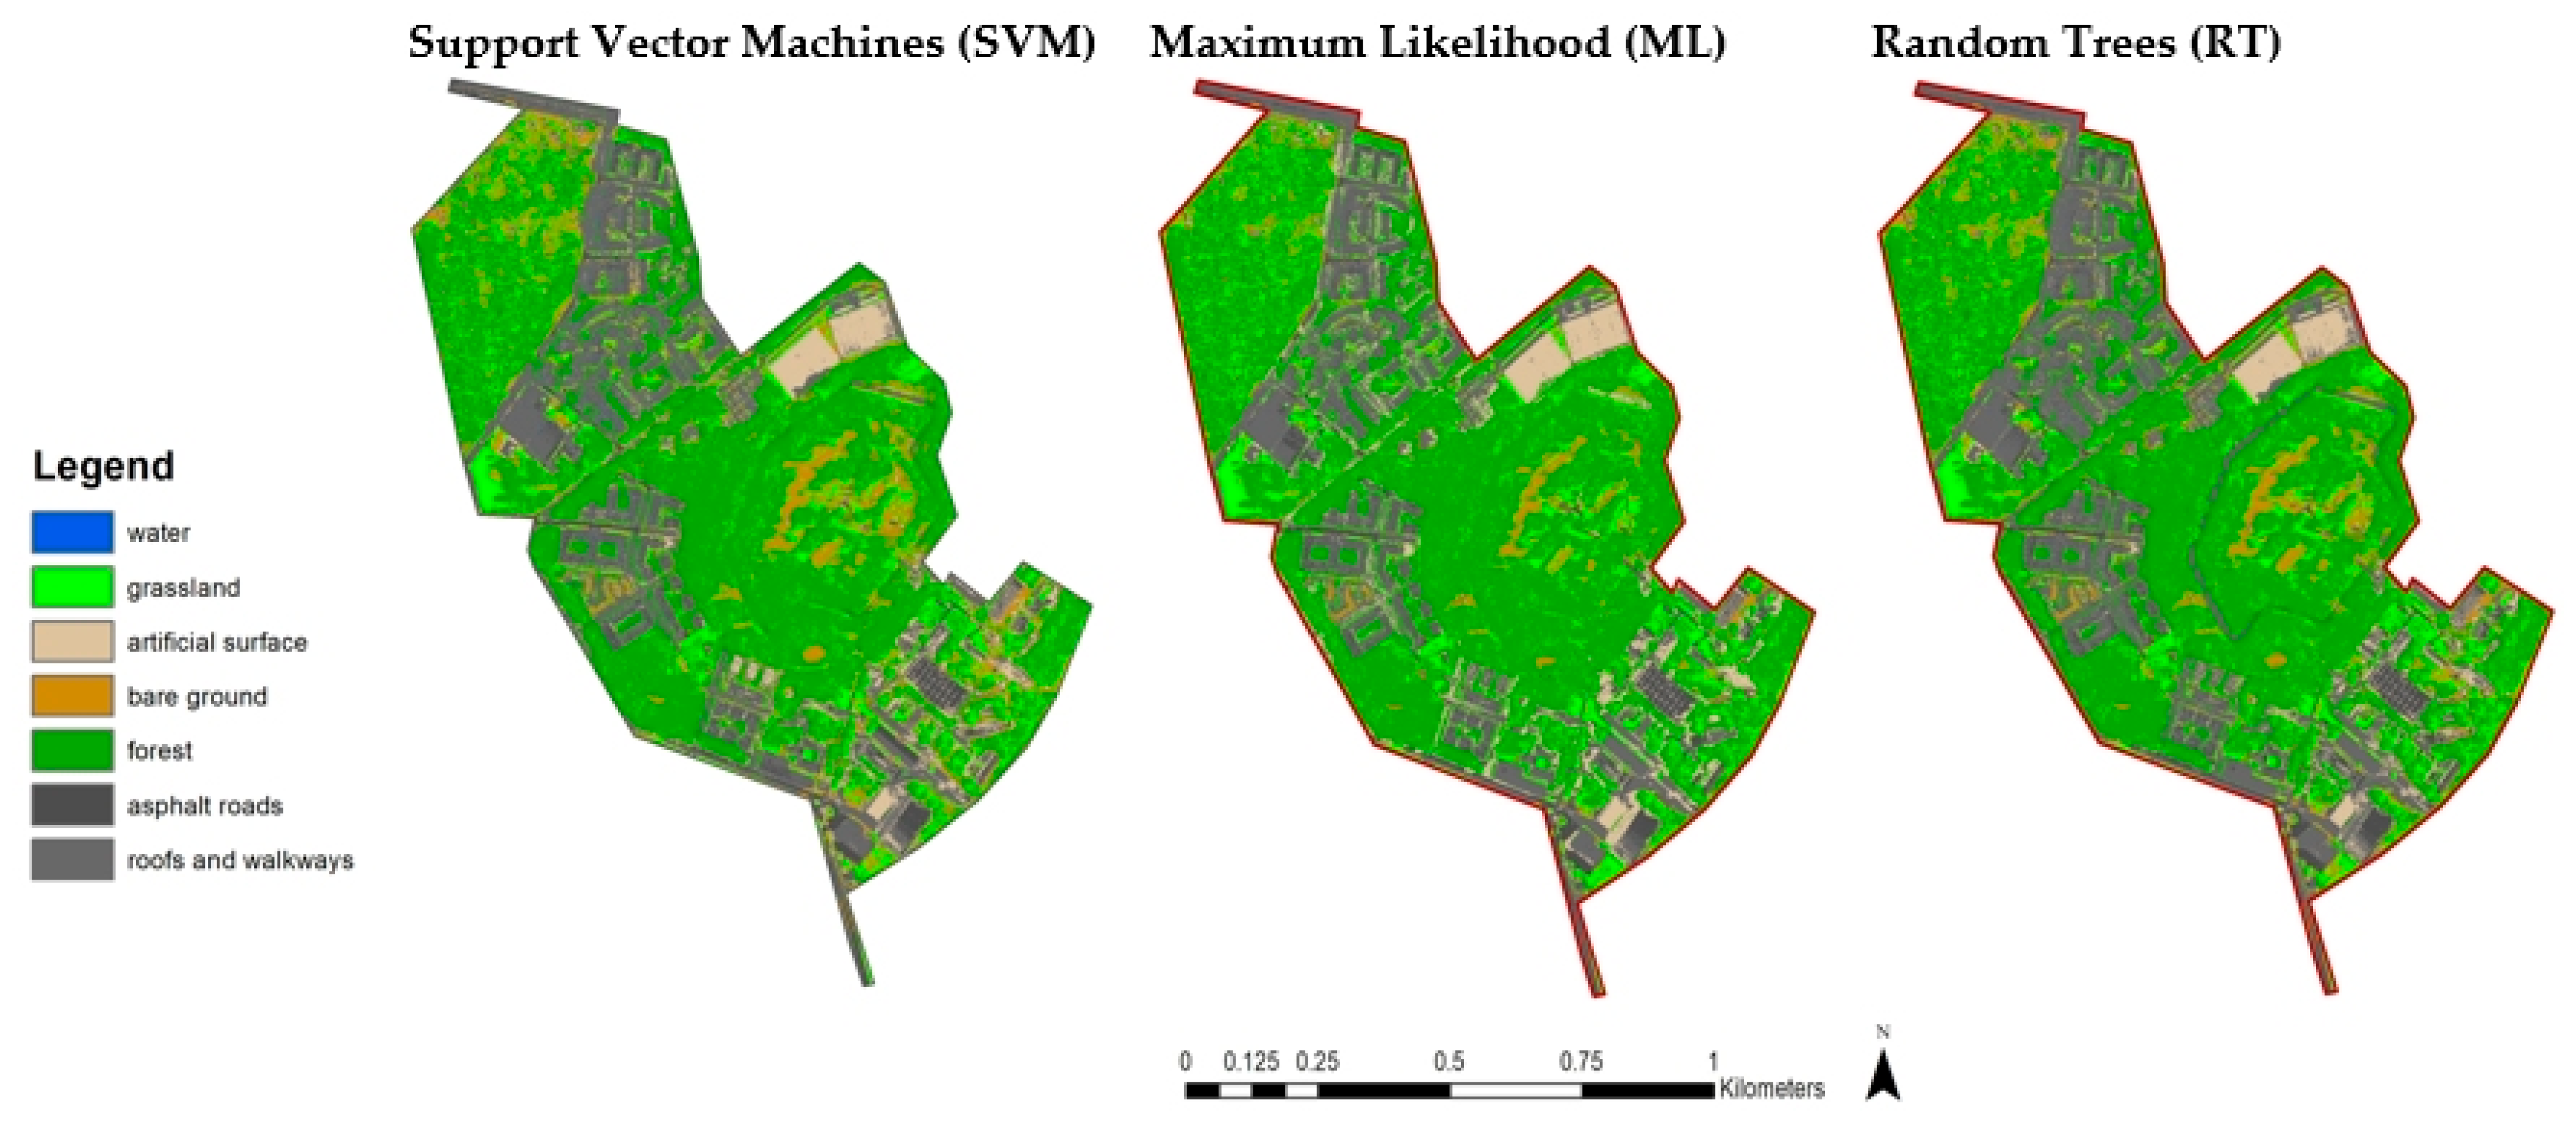
Figure 6 compares the land use and land cover (LULC) classification for the Fort-Bema housing estate (an area of approximately one square kilometre), which was conducted using three different methods, SVM, ML and RT. From the comparison shown in Figure 6, it is evident that the LULC classification performed with the SVM method reflects much more of the fine details that are not visible with either the ML or RT methods.
Table 1, Table 2 and Table 3 show the confusion matrices for all three methods (SVM, ML and RT) for LULC classification of 7 classes (C1—water; C2—forest; C3—asphalt roads; C4—artificial surfaces; C5—roofs and sidewalks; C6—grassland; C7—bare soil). The RT method has the lowest accuracy (0.75), while approximately similar values (0.83–0.84) were obtained for SVM and ML. When comparing SVM and ML, the SVM method proved to be slightly better (kappa = 0.8416). The RT method, on the other hand, shows the greatest detail in subdividing permeable and impermeable surfaces, but as it turns out (as confirmed by the confusion matrices) is not always correct, because in many cases water/shade features are misclassified as impermeable surfaces (hence kappa = 0.7469). Table 1 shows the confusion matrix for the classification performed with the SVM method.
The confusion matrix for the classification performed with the method ML is shown below in Table 2.
The confusion matrix for LULC classification (7 classes) using the RT method is shown in Table 3.
Table 4, in turn, shows the respective RMSE values, which are a measure of accuracy. It can be considered as a useful measure to understand the performance of classification [7,29]. This study shows that SVM classification (3.31) has the lowest error, followed by ML (3.50) and RT (4.50), further confirming the higher classification accuracy of the SVM classifier.
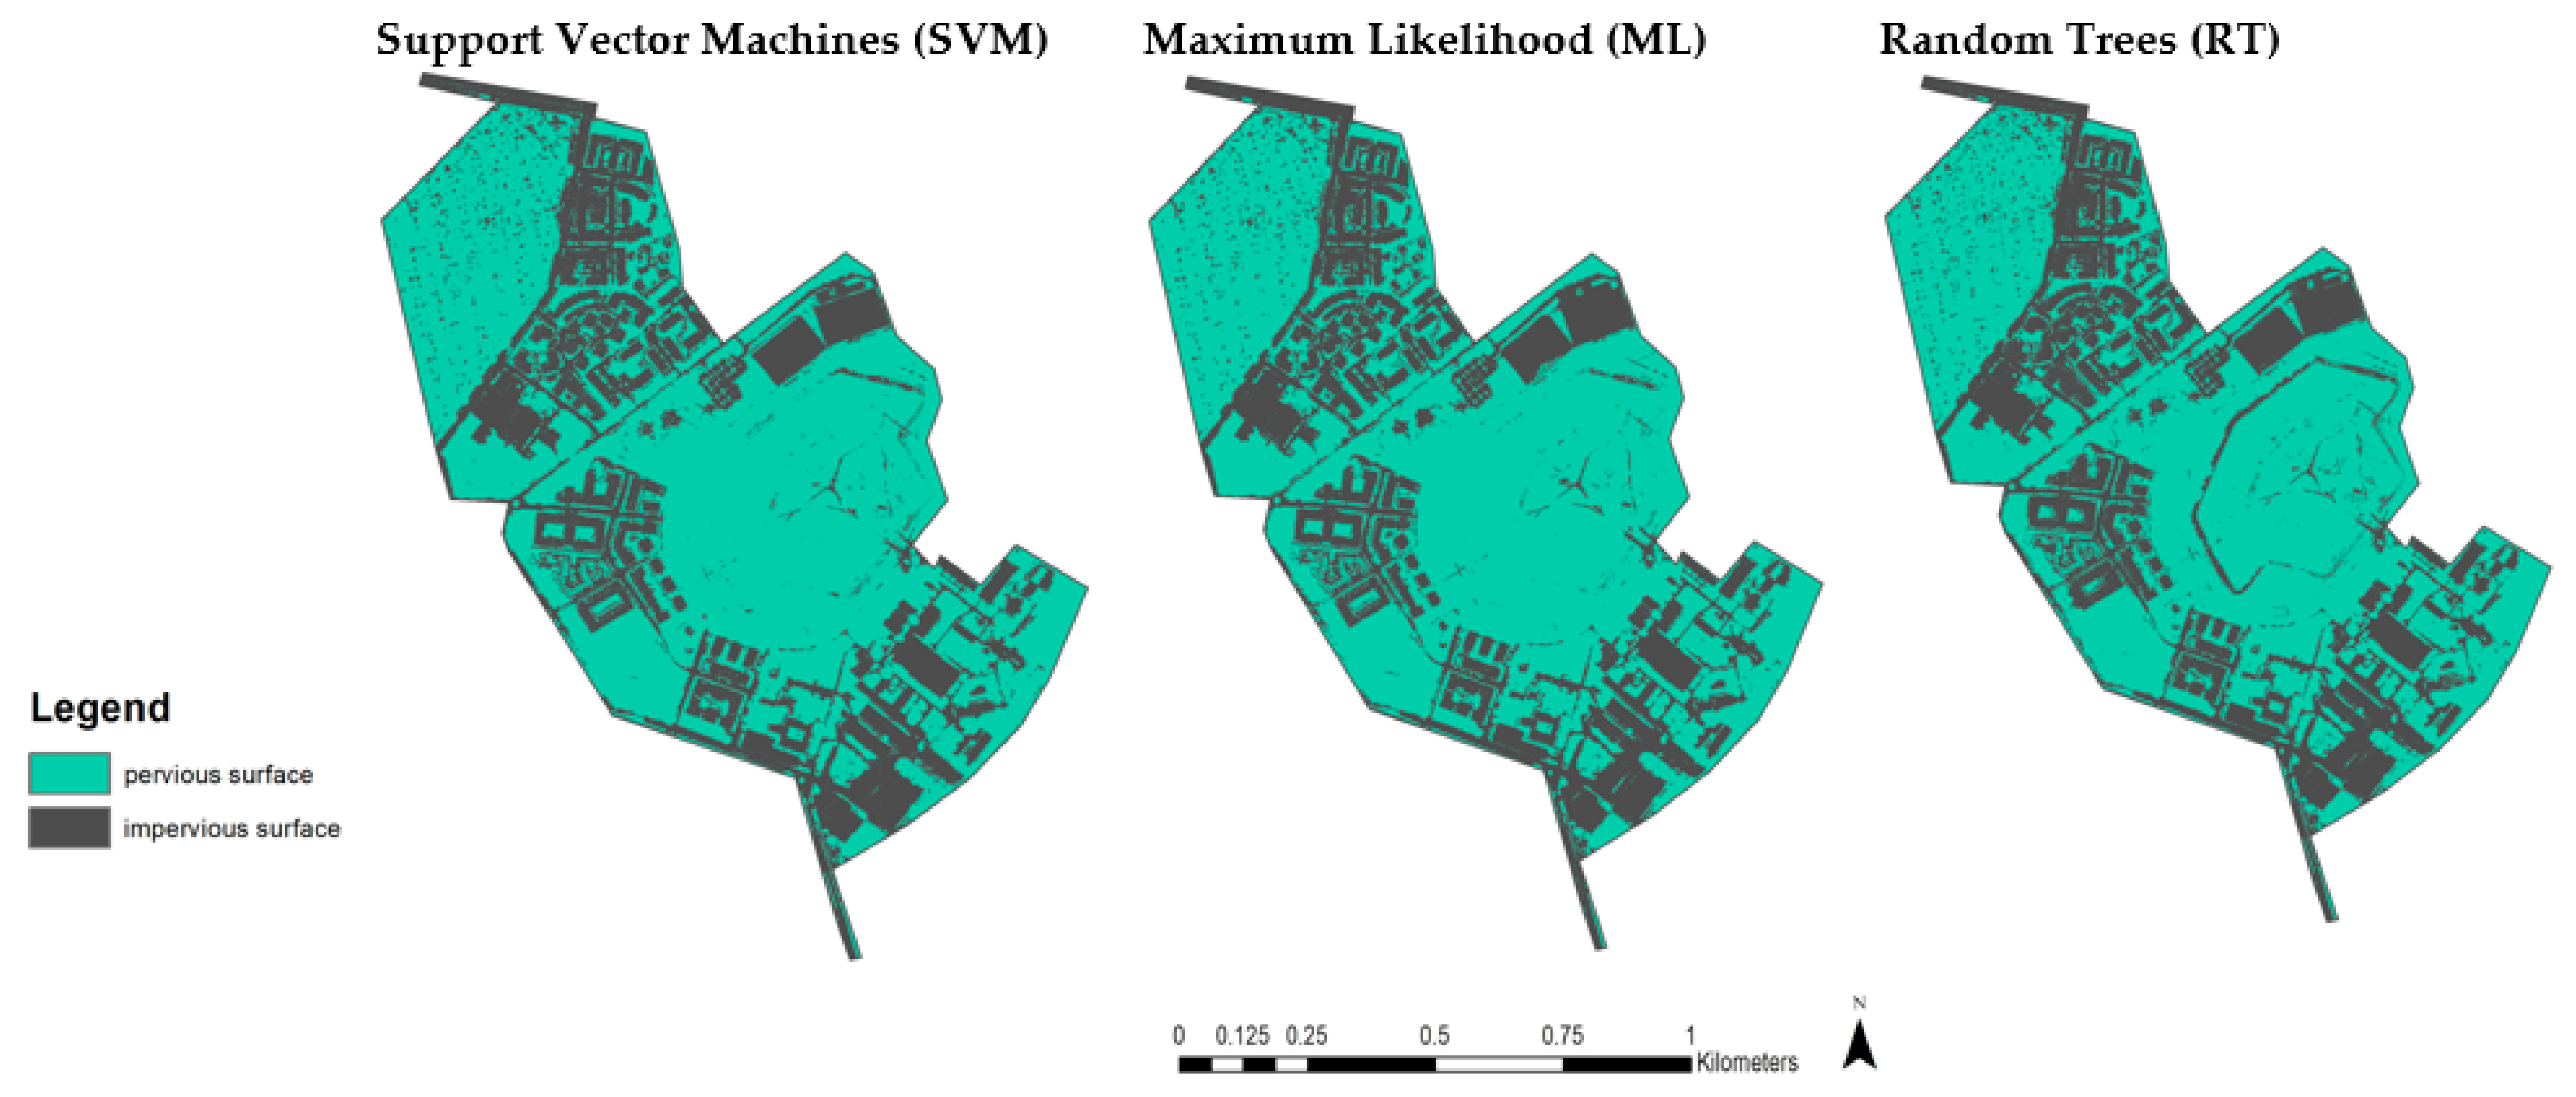
Below is a classification of impervious surfaces (i.e., a binary classification) (see Figure 7). It is worth noting that with this type of classification using a binary classifier, the classification accuracy is much higher than with the LULC classification presented above.
When classified into 2 classes (impervious-pervious), the results showed that SVM again achieved the highest percentage of overall accuracy. However, the classification results of ML were only slightly worse (the difference was almost nonexistent, i.e., 91.51% vs. 91.35%), and again RT had the worst accuracy (see Table 5, Table 6 and Table 7).
In addition, the RMSE was lowest for the ML classification (see Table 8). Considering both the kappa index and the RMSE, we can conclude that when classifying orthophoto map data with a very high resolution (0.25 m per pixel), both the SVM and ML classifiers give very similar results.
In addition, the SVM classification method was also used to accurately quantify the character of the area in the Fort Bema housing estate complex: (1) pervious—630,117.2948 m2 = 0.64 km2—67.42%; (2) impervious—304,538.23 m2 = 0.30 km2—32.58%.
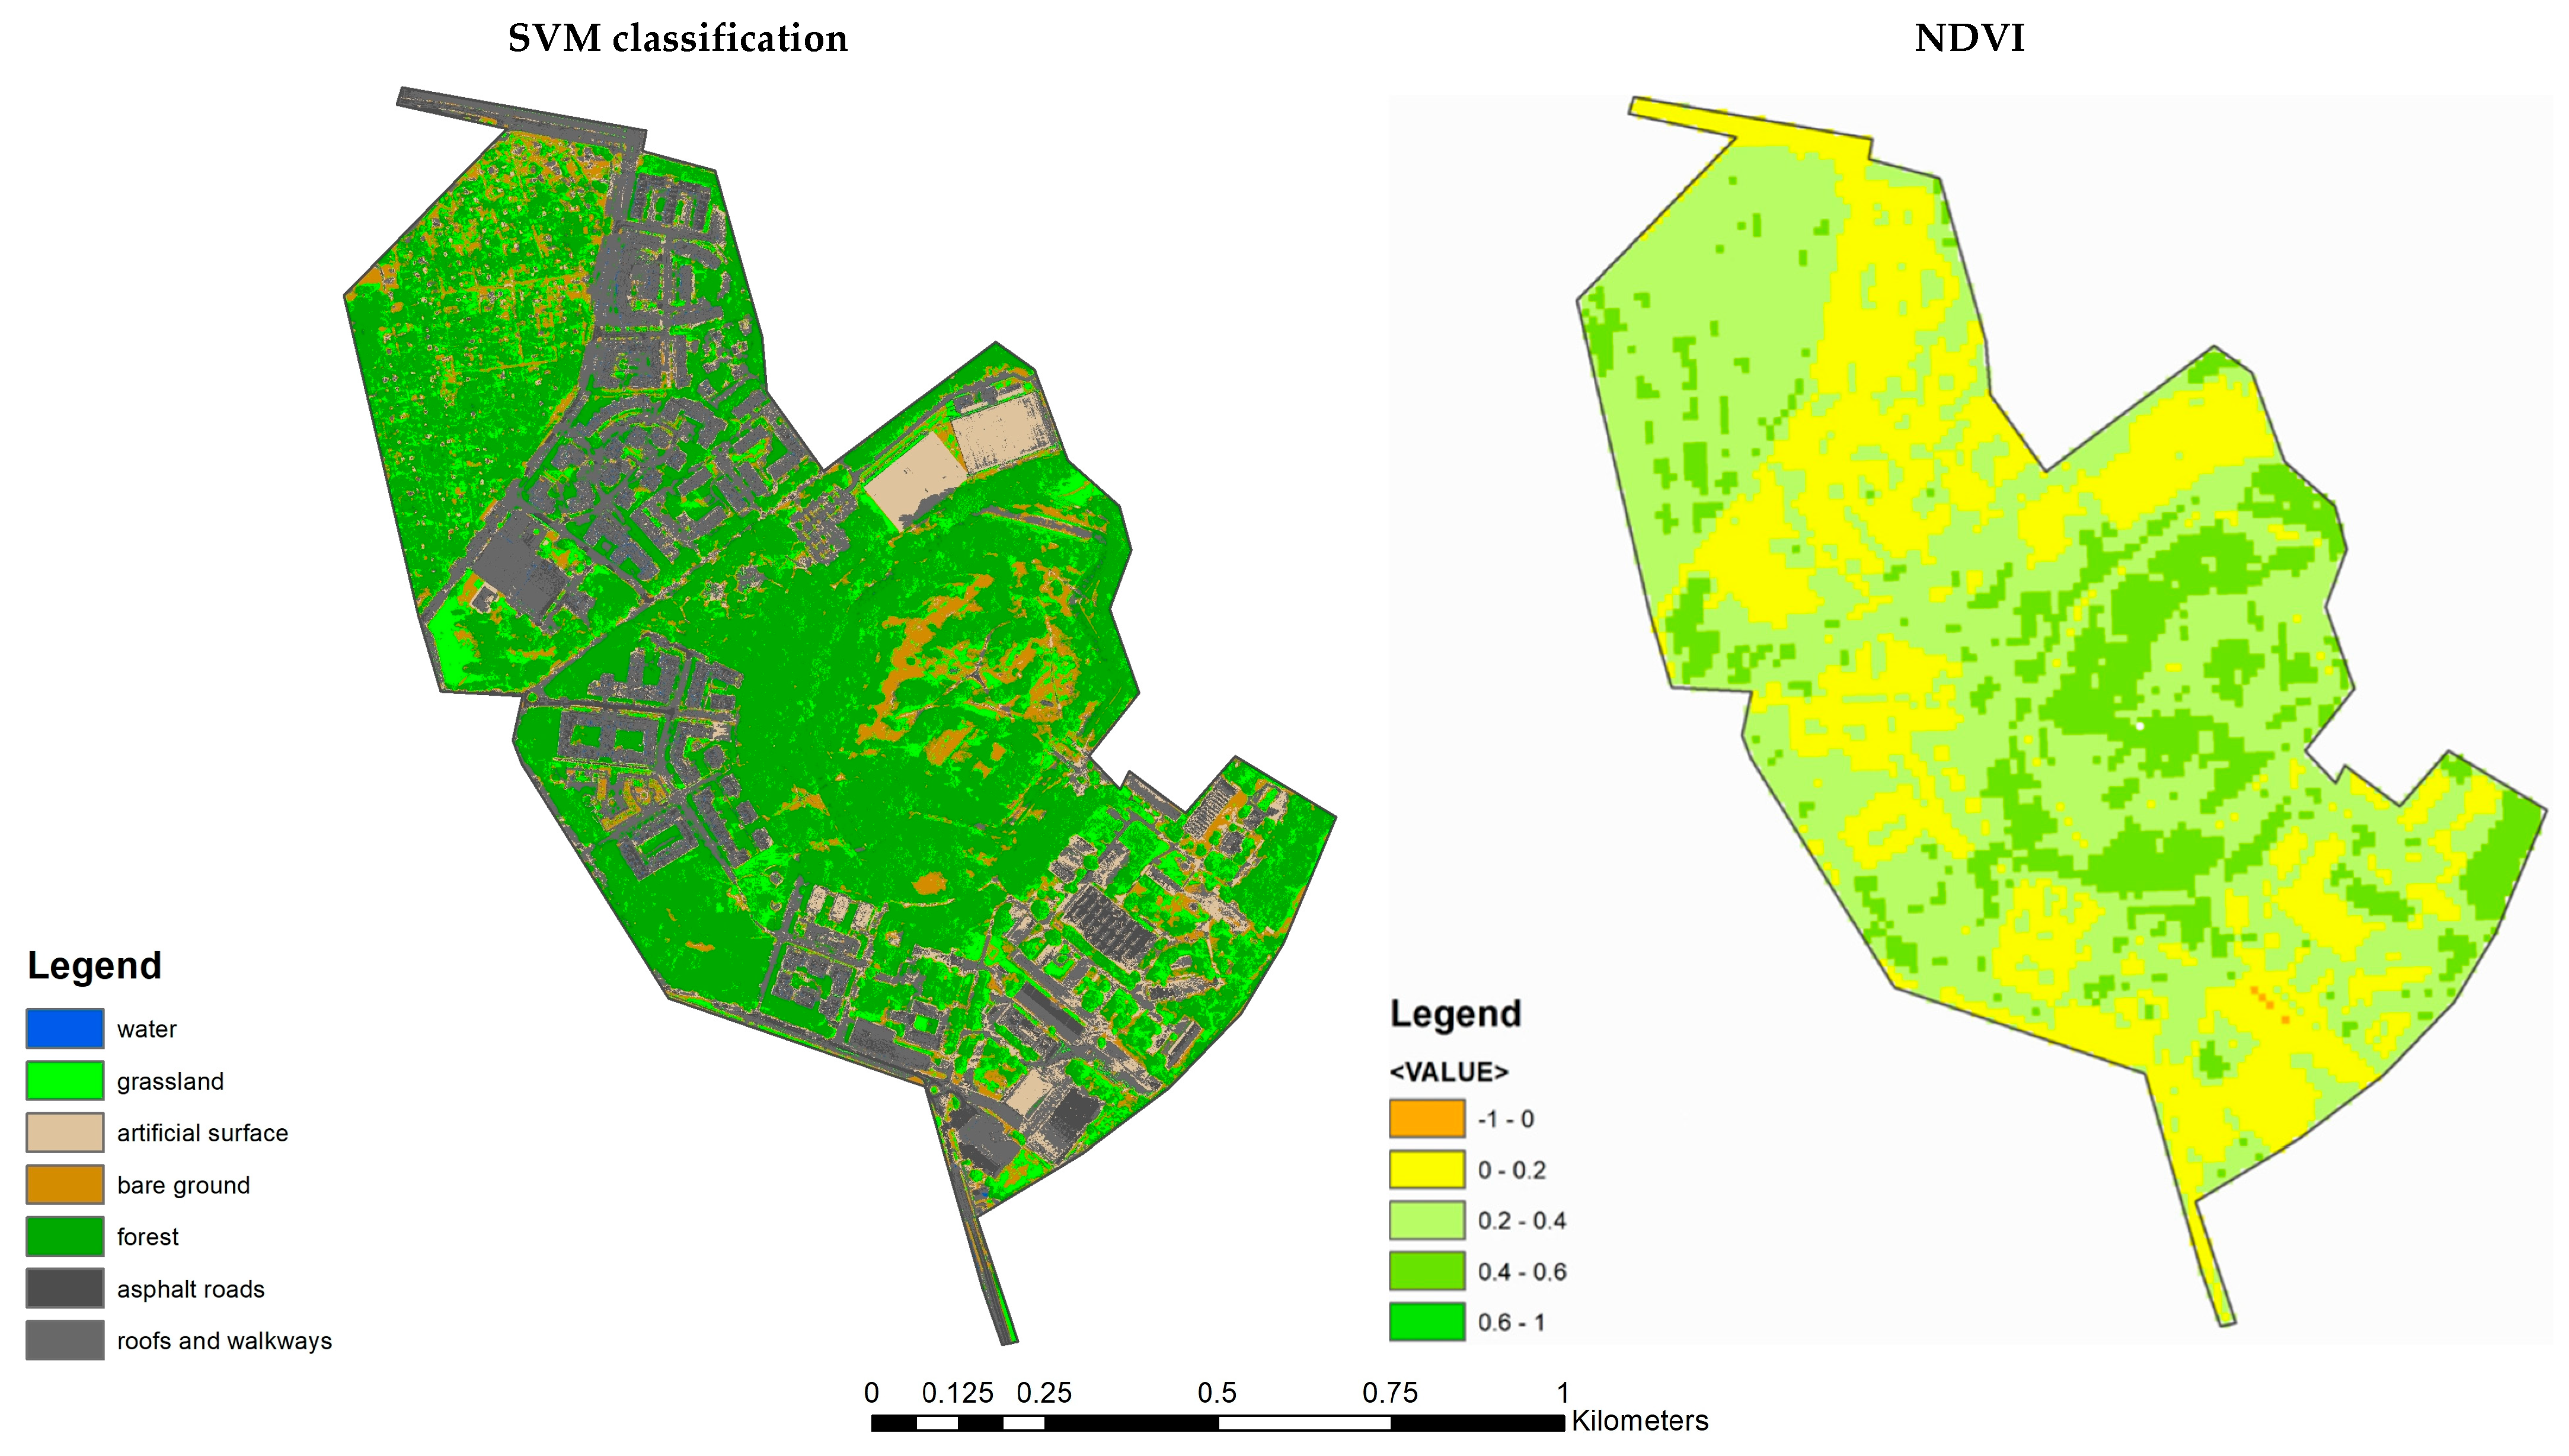
High-resolution orthophotos covering the near-infrared range are also a good method to estimate sealed areas in an urban area (such as the residential complex that is the spatial study area of this paper). Vegetation production in near-infrared images has a relatively high reflectance, which in turn can be very well represented by the Normalized Difference Vegetation Index (NDVI) [50]. This index represents the ratio between visible light and near-infrared light. Briefly, the NDVI index can be expressed as follows:
NDVI = NIR R NIR + R
where R represents the red band and NIR represents the near infrared band.
When the NDVI index has a high value, it is clear that vegetation production is present. More specifically, vegetation is characterized by a high index, while sealed surfaces, such as built-up areas such as roads and sidewalks, are characterized by low values of this index (see Figure 8).

5. Discussion

SVM, ML and RT are different classification methods used in machine learning. While ML is a parametric method—built as a probabilistic model whose parameters are determined based on Bayes theory (which amounts to knowing/estimating the parameters of the model before classification), SVM and RT are non-parametric methods. The former is an optimization-based non-parametric method and the latter is an ensemble method that belongs to the special category of bagging methods. There are a number of studies that confirm the effectiveness of the ML method in solving classification and signal identification problems from very different fields of knowledge: in quadrature-linked classification, which combines the two simplest digital modulations: Amplitude (ASK) and Phase (PSK) [51], in speech recognition [52], in bioengineering and in particular in gene selection [53] or finally in remote sensing [54]. Similarly, the application of the SVM method is ubiquitous in almost all fields that involve the classification and prediction of data to solve very different problems from different walks of life. For example, to solve problems in engineering [55,56,57,58,59,60] and construction [61,62]. Similarly, there are many application examples for RT classification [63,64,65,66].
When comparing the three methods, the performance of each method is different [20,21,22,23]. In particular, with respect to the application in remote sensing, there are many studies in the literature showing that SVM is superior to other classification methods in terms of performance, especially it performs better than ML [20,21,22,23]. However, it is worth noting that in some cases the ML method performed only slightly worse (e.g., in the land cover classification study) [21], and in another study, SVM provided better results only for SAR images, while ML proved to be the better classifier for TM images [20]. Indeed, Zhang et al. [24] emphasize the need for further research in this context, i.e., research that compares different machine learning classification methods [24].
ML classifiers are quite complex models because they involve a large number of data points in their calculations (this should sound familiar to anyone who has ever studied regression analysis). However, ML also has some drawbacks. For example, ML classifiers can be slow compared to SVM and may even produce misleading results in certain situations. On the other hand, RT can be extremely fast. Sometimes the speed can even be too fast, since the model itself does not try to consider more than one branching scenario whenever possible. SVM is a more complex classifier (but at the same time gives better results) and does not require any preprocessing of the input data. SVM and ML algorithms can be trained much faster than RT and can handle a large number of features (SVMs even use the absence of a given feature as a positive feature). Among the algorithms of the same classifiers, SVM has the best generalization capabilities. The disadvantage of SVMs is their complexity and lack of interpretability.
Moreover, it is worth mentioning that the SVM classifier not only works well on standard images, but also performs well on segmented raster data. It performs pixel-based classification based on a predefined sample of training attributes. Multiband images with arbitrary bit depth are well suited for classification using the SVM method. The advantages of the SVM classifier compared to the ML method are: (a) requiring fewer samples, which, unlike ML, do not have to be normally distributed; (b) being more robust to noise, correlated bands and unbalanced number or size of training sites in each class. Unlike the SVM classifier, the ML classifier assumes that the statistics for each class in each band are normally distributed and computes the probability that a given pixel belongs to a given class. Nevertheless, the results of this study show that the SVM and ML methods give very similar results for the binary classification of high-resolution orophotomaps (0.25 m per pixel), with Cohen’s kappa coefficients of over 0.9 indicating very high classification precision (near perfect level of agreement). The kappa coefficient tests interrater reliability, which indicates the extent to which the data collected in the study accurately reflect the variables measured [67].
When we compare the results presented in Table 5, Table 6 and Table 7 with the interpretation of Coehan’s kappa value (see Table 9) in terms of the percentage reliability of the data (measured by Cohen’s kappa), we find that the percentage reliability of the data is in the range of 82–100% when classified by the SVM and ML methods. The test performed by the method RT is slightly worse, but even in this case the level of agreement can be considered strong, as the percentage reliability of the data is in the range of 64–81%.
This study is a testament to the growing importance of remote sensing. It analyses different methods and compares them with each other. It also identifies the current state of research and prevailing trends (in the form of Table A1 in Appendix A). The study addresses the current standards for remote sensing data used to estimate impervious surfaces. In this context, it is worth considering how the characteristics of the remote sensing data (i.e., spatial, spectral and temporal resolution) affect the results. In this study, we evaluate different methods for estimating impervious surfaces and compare classification accuracy as a function of method (for high-resolution orthophoto map data). It is also worth noting that there are increasingly powerful and readily available (also for cost reasons) GIS platforms that use digital image processing algorithms and integrate various machine learning methods for classification. These platforms make the field of remote sensing very popular and allow easy estimation and mapping of impervious surfaces, especially very fast visualization of these surfaces and estimation of their size.
It should also be emphasized that the delineation of sealed surfaces (i.e., impervious surfaces) and the temporal and spatial analysis of these surfaces are important and relevant from a policy, environmental and land use management perspective [9].
Choosing one of these methods is usually not easy, as each has its own advantages and disadvantages. In summary, all three algorithms are efficient and provide either near-perfect (for SVM and ML classification) or strong (for RT classification) results. Much also depends on what data are tested (i.e., what types of images), but also on how the training set is chosen, which can also affect the results accordingly. It is good to have some knowledge in this area, and highlighting some of the important elements of the comparison between the three methods is also one of the goals of this article.
The advantage of the SVM method can be seen in another context. Pai et al. [68] state that the SVM is based on the assumption of minimizing structural risk and an upper bound on generalization error, rather than minimizing training error. In this respect, the SVM method provides better results than, for example, most conventional neural network models based on the principle of empirical risk minimization. Therefore, empirical results for SVMs provide better classification and problem-solving results, which has been confirmed in various studies on different knowledge domains. Ustuner et al. [60] state that the selection of appropriate classification algorithms (e.g., SVMs) and the accuracy of remote sensing data lead to classification results that are crucial from the perspective of the spatial data community, as they provide a basis for other models and various applications.
Finally, Zhang et al. [24] suggest that classification improvement can still be achieved by combining both classification methods, i.e., ML (based on Bayesian theory) with SVM. Elements of Bayesian decision theory can be used in the SVM method to optimize parameters [69], improve performance in optimizing certain features [70], reduce optimality error (in visualizing SVM outputs) [71], reduce posterior probability of class membership [72], or finally speed up the training process itself (to estimate certain hyperparameters), among others [73]. A broader and more comprehensive investigation of the possibility of integrating both classification methods (i.e., SVM and ML) to further improve performance can therefore be identified as a future research direction.
It should be noted that the methods presented in this study may be useful, for example, for urban environment assessment, calculation of percent sealed area (%ISA), or land use/land cover (LULC) classification. Mapping of impervious surfaces and knowledge of NDVI can also be used for quantitative analysis LST in urban heat island studies using infrared remote sensing in urban environments [6]. Knowledge of impervious surfaces can be useful in determining runoff intensity and pollution levels in a given area [5]. It is worth mentioning that researchers are interested in calculating the percentage of sealed area for a given catchment. In the case of Warsaw, the subject of such a study is the Służewiecki [5,8] stream catchment in the southern part of Warsaw. One of the methods of estimating impervious surfaces of large-scale projects can be high-resolution remote sensing aerial photographs covering the near-infrared range and mapping the NDVI [74]. This is because vegetation in near-infrared imagery has a relatively high reflectance, which in turn can be very well represented by the NDVI index. This index represents the ratio of visible light to near-infrared light. So, if it has a high value, it is clear that we are dealing with the production of vegetation. More specifically, vegetation is characterized by a high NDVI index, while impervious surfaces, such as built-up areas such as roads and sidewalks, are characterized by low values of this index. The NDVI scale ranges from −1.0 to +1.0, and a value just above 0 is considered a threshold for this index, separating vegetation production from any non-vegetation (this is well illustrated in Figure 7).
The quality of the NIR images is also important for proper classification. In other words, an image showing the area may give different results depending on the quality. Thus, the more accurate the images are, the better. Classifying the areas according to the different NDVI indices allows the study area to be represented in terms of vegetation and non-vegetation. In order to determine the impervious areas, it is necessary to take into account that there is a strong correlation between the areas covered with vegetation production and the pervious areas. Thus, when determining the areas covered with vegetation, one is actually indicating permeable areas and vice versa when it comes to NDVI from the lower end of the range of values of this indicator (they are indicative of impermeable areas). It should also be pointed out that this method is not without drawbacks. First of all, the method based on NIR band images underestimates the actual results in some very specific cases. Examples of such situations are shading of some areas by tall objects. Such shaded areas, e.g., by trees, are treated as opaque because they hinder the propagation of light. Another example is soils and surfaces where no vegetation grows. In this case, too, the surface may be incorrectly classified as opaque when in fact it is permeable. Therefore, the classification of vegetation surfaces should be performed in a supervised manner and any doubt about the classification must be corrected manually. However, these drawbacks do not diminish the great value of the method for knowledge building.
Finally, in the literature review in Table A1 in Appendix A, we show that the first methods for classifying urban coverage (based on remote sensing) were developed in the early 1990s. At that time, a linear segmentation model was used that included texture, contextual information and reflectance properties [75]. For the time, this model provided satisfactory results. However, it was not until the early 2000s, with advances in sensors and computing power, that studies of impervious surfaces were conducted on a larger scale. At that time, traditional estimation methods were used, including a linear spectral mixture model to model heterogeneous urban land cover [29], a regression model relating the percentage of impervious surface to the green area of the urban fringe [10] and a regression tree model [13]. With the growing interest in urban land use classification, more complex methods have been developed over time, often combining different approaches, such as the decision tree method using a linear spectral mixture analysis model (simultaneously combining impervious surface classifications with population density knowledge) [76]. Increasingly available high-resolution imagery facilitates the mapping of impervious surfaces. One such study used a hierarchical image segmentation method combining a multichannel watershed transformation and watershed contour dynamics [77]. Another study sought tools to extract spatial features from remote sensing imagery using morphological attribute profiles (MAPs) [78]. High-resolution imagery has also made it possible to analyse normalized multitemporal portions of impervious surfaces [30]. Later, impervious surfaces also began to be estimated using multisensory and cross-source data [9]. The second decade of the 2000s brought entirely new challenges. New opportunities emerged with the increasing availability of various location data acquisition technologies for geospatial research and the massive analysis of location data and discovery of patterns in location data [79]. In addition, machine learning algorithms were used, for example, in the classification of point-of-interest data (POI) [80]. At a later stage, different data sources also began to be integrated, which led to the creation of a modified normalized difference index of impervious surface (MNDISI) in one such study [2]. Over time, social knowledge became an important element in the integration of various data sources. Several of these studies combined remote sensing features with social knowledge (VGI, OSM data, POI, social sensorimotor data, etc.) [7,81,82,83,84,85]. It is also worth noting that there is considerable interest in studying the so-called subtle dynamics of urban change, based on a multi-level approach (pixel, grid and city block) [4], a multi-object approach to monitor surface changes over several years [3]. In terms of outlook and suggestions from the review, it is natural to expect further progress in integrating different types of methods, including of course social knowledge, as advances in technology facilitate this type of research. Nonetheless, there is also a need for studies such as this one, which combines different methods and compares the results, embedding knowledge about impervious surface segmentation and urban land use classification in the context of their usefulness. In this study, we show, among other things, what the integration of different methods (remote sensing, machine learning algorithms, NDVI) can be useful from the point of view of civil engineering theorists and practitioners, especially in the construction sector in its broadest sense, highlighting, for example, issues of urban planning and hydrology).

6. Conclusions

This article contains an analysis and evaluation of the classification of an urban settlement in one of the districts of Warsaw (Fort-Bema settlement complex with an area of about one square kilometre). The study was conducted using remote sensing data (more precisely, orthophotos with a resolution of 0.25 m) and three different classification methods, namely SVM, ML and RT. More precisely, the study consists of three parts. First, multi-class LULC classification was performed (for each method), followed by impervious surface classification (binary classification)—also for all three classification methods. Third, the NDVI index was mapped for the same study area (Fort-Bema Estate), which can be treated as a proxy for permeable surfaces since it has a high positive correlation with it (vegetation is characterized by a high index, while sealed surfaces such as built-up areas e.g., roads and sidewalks, are characterized by low values in this index). The results obtained with the GIS platform presented in this paper allow a better understanding of how these advanced classifiers work, which in turn can provide insightful guidance for their selection and combination in real-world applications. The rapid development of various remote sensing data acquisition technologies (including very high resolution orthophotos—0.25 m pixels) and the increasing availability of GIS platforms create significant challenges and opportunities for geoscience research [79]. Some of the opportunities and challenges have been highlighted in this article (e.g., the potential for various applications of sealed surface mapping in urban planning).
All in all, all three classifiers had errors, but especially for impervious surfaces, the highest accuracy was obtained with the SVM classifier. The results showed that SVM achieved the highest percentage of overall accuracy, followed by ML and RT with 91.51%, 91.35% and 84.52%, respectively.
However, it is worth noting that in binary classification, the difference between SVM and ML methods was negligible. In contrast, the order of results for LULC classification was similar (SVM followed by ML and RT), but the values for Coehn’s kappa index were slightly lower, 84.16%, 82.80% and 74.69%, respectively. A GIS-based comparison of the visual results and the confusion matrix shows that although the RT method showed the most detailed classification into pervious and impervious, it was not always correct, e.g., water/shadow was detected as an impervious surface.

Author Contributions

Conceptualization, J.S., M.F. and D.M.; validation, J.S., M.F. and D.M.; investigation, J.S., M.F. and D.M.; resources, M.F., J.S. and D.M.; writing—original draft preparation, M.F., J.S. and D.M.; writing—review and editing M.F., J.S. and D.M.; visualization, M.F. and D.M.; supervision, J.S. All authors have read and agreed to the published version of the manuscript.

Funding

This research received no external funding.

Institutional Review Board Statement

Not applicable.

Informed Consent Statement

Not applicable.

Data Availability Statement

Not applicable.

Conflicts of Interest

The authors declare no conflict of interest.

Appendix A

The following is an overview of the main work/studies dealing with impervious surface mapping, with different methods for their assessment (including the use of conventional remote sensing, NDVI, multisensory and cross-source data, ‘social sensing’ and classification methods such as SVM, ML and RT). Table A1 briefly characterizes these studies and presents their contribution to the understanding of the technical problems analysed.
Table A1. Scientific approach—various methods to study impervious surfaces (including remote sensing and machine learning classification methods).
YearAuthors/Short DescriptionContribution
1990Møller-Jensen [75]Møller-Jensen [75] used an expert approach and developed a method for classifying Landsat-TM satellite imagery for urban coverage, more specifically a linear segmentation model that takes into account texture and context information as well as reflectance features. The classification was performed for central Bangkok, and given the spatial resolution of the data, the results had acceptable accuracy.
2003Sawaya et al. [86]Sawaya et al. [86] used high resolution satellite imagery (for Minnesota) to map and classify impervious surfaces, lake water clarity and aquatic vegetation. The results showed high accuracy of results, with the highest accuracy for impervious surfaces. The authors indicated that this type of data has the potential to extend satellite-based remote sensing and is well suited for producing reliable soil/land assessments at the local scale.
2003Yang et al. [13].Yang et al. [13] used Landsat-7 ETM+ data and high resolution imagery to map impervious surfaces. In particular, they used multisensor and multisource datasets to quantify impervious urban surfaces as a continuous variable. An appropriate regression tree model was used to calculate the amount (percentage) of impervious surfaces. In this way, the percentage of impervious surfaces was determined at the sub-pixel level at 30 m resolution. The mapping of impervious surfaces was tested for large areas in the United States, more specifically in South Dakota and the state of Virginia. The proposed method was later used to map impervious surfaces for the entire U.S. in the creation of a national land cover database.
2003Wu and Murray [29]Wu and Murray [29] used Landsat ETM+ data and a linear spectral mixture model to model heterogeneous urban land cover for the Columbus metropolitan area in the United States. In this way, they estimated the distribution of impervious surface along with vegetation and land cover. They used the albedo parameter (a photometric parameter that determines the reflectivity of a surface) to estimate the fraction of impervious surface. More specifically, the analysis of impervious surfaces was performed for layers with low and high values of this parameter. In the study by Wu and Murray [29], the root mean square error (RMSE) was 10.6%, which is in the same order of magnitude as the error obtained for Digital Orthophoto Quarterquadrangle images, while demonstrating the effectiveness of this type of method in impervious surface estimation studies.
2004Bauer et al. [10]Bauer et al. [10] used Landsat TM data and a regression model to determine the percentage of impervious surface for a metropolitan area (Twin Cities) for three different time points (referring to the 1990s). The method has high efficiency and, in particular, the results showed that by linking the impervious surfaces to the green area of the urban edges, 80–90 percent of the variation in imperviousness was reflected in the green area. The conclusion of the study is that classification of Landsat TM data allows effective mapping and monitoring, as well as quantification of the extent of impervious surfaces. In addition, determining the percentage of impervious surfaces can be a proxy indicator of environmental quality.
2006Lu and Weng [76]Lu and Weng [76] used a decision tree classification method and a linear spectral mixture analysis model to estimate impervious urban surface in Indianapolis, Indiana (USA), for five land use classes (corresponding to a low to very high development intensity classification). To conduct the study, the authors used Landsat Enhanced Thematic Mapper data and integrated the fractal imagery with a linear analysis of spectral mixing and land surface temperature. The method proposed by the authors to integrate the fractal image data and the surface temperature gave quite good results in extracting the impervious surface (the mean square error was 9.22%, the system error was 5.68% and Kappa = 83.78%). The high value of Kappa index indicates high overall classification accuracy for the five urban land use classes.
2010Li et al. [77]Li et al. [77] used a hierarchical method to segment multispectral images with very high resolution. They obtained the segmentation result by applying a multichannel morphological method to the spectral image, and the resulting extracted image gradient was then subjected to watershed transformation. The multilevel hierarchical segmentation results with different levels of detail were then compared by the authors with existing methods for mapping impervious surfaces, i.e., the single-level segmentation method, as well as the pixel-based classification method. The results of this comparison show that the multi-level hierarchical method provides significantly more accurate segmentation results, especially when visual and quantitative aspects are taken into account.
2010Dalla Mura et al. [78]Dalla Mura et al. [78] used morphological attribute profiles (MAPs) as a tool to extract spatial features from remote sensing imagery. MAPs can be used to characterize imagery resulting from the sequential application of morphological attribute profiles at multiple levels and allow for the modeling of structural information and various parametric features. The authors note that by characterizing the image with different attributes, it is possible to model spatial information more accurately than with conventional morphological philtres. The authors used two very high resolution panchromatic images (Quickbird) of Trento, Italy, and applied MAPs to perform a classification characterized by a good description of the scene in terms of thematic and geometric accuracy by considering different attribute profiles.
2011Lu et al. [30] Lu et al. [30] used integrated satellite imagery from Landsat and QuickBird and selected the district of Lucas do Rio Verde in the Brazilian state of Mato Grosso and performed an analysis of the normalized multitemporal fractions of impervious surfaces. An original element and some added value of the study is the introduction of a two-step calibration. First, a previously created regression model for the QuickBird derived imagery was used to calibrate the values of the impermeable fractions for the Landsat imagery. The next step was to normalise the results, more precisely the differences of the calibrated images of the impervious surface obtained for different dates (different time points). The conclusion of the study is that the one-pixel (per pixel) method tends to significantly overestimate the size of impervious surfaces in some areas (by up to 60 percent), especially in urban fringe areas (i.e., urban-rural interface). Another conclusion is that normalization of multitemporal images of impervious surface fractions is necessary to reduce the effects of varying environmental conditions. Traditional classification methods based on per-pixel analysis cannot effectively solve the mixed pixel problem.
2012Deng et al. [9]Deng et al. [9] used remote sensing in combination with a linear spectral mixing method to map changes in the impervious surface (in the Pearl River Delta, China). More specifically, they performed a multitemporal analysis of the fraction of impervious surface for Landsat data (Landsat images from different years, i.e., 1998, 2003 and 2008). Using a linear spectral model, they were able to extract information about the impervious surface from the Landsat imagery. The authors of this study were able to indicate exactly (the study was quantitative in nature) by how much the amount of impervious surface changed in percentage terms over the different time periods, i.e., 1998–2003 and 2003–2008. Interestingly, the changes in impervious surface (in conjunction with social conditions) allowed for a better examination of the direction of expansion to better understand urban change in the area studied (in the Pearl River Delta). The authors note that temporal and spatial analyses of impervious surface changes allow for better understanding and planning of spatial change and, in particular, land use management and spatial planning policy design.
2012Lu and Liu [79]Lu and Liu [79] discussed the opportunities and challenges posed by the rapid development and increasing availability of various location data collection technologies for geospatial research. In particular, they highlighted three important issues, namely, large-scale location data collection and pattern recognition of location data. Lu and Liu [79] not only provide an overview of the current state of the art, but also point out potential opportunities for geospatial research.
2012Rodrigues et al. [80]Rodrigues et al. [80] used machine learning to classify point of interest (POI) data containing locations (in China) and information available on the Internet about these locations, i.e., Google Place1, Facebook Place2 or Gaode Place3. The use of POI data is a relatively new direction in urban research (urbanization monitoring) and refers to more specific information, including addresses, names, coordinates, etc. The authors compared, among others, flat and hierarchical approaches (different algorithms) in the context of urban planning.
2013Liu et al. [2]Liu et al. [2] used 3 different data sources (i.e., nighttime luminance, ground temperature and multispectral reflectance) and proposed a modified normalized difference index of impervious surface (MNDISI). In this way, they succeeded in suppressing unwanted land cover while improving the mapping of impervious surfaces. It is worth noting that the Normalized Impervious Surface Difference Index (NDISI) alone works very well to extract impervious surfaces from multispectral imagery. However, there were concerns about its low effectiveness in extracting impervious surfaces—i.e., it may not work well in a diverse environment (i.e., an environment with spectral heterogeneity) where impervious materials are interspersed with other land cover. Therefore, the multi-source composition index proposed by Liu et al. [2] has helped to solve this problem. Combining different data sources and creating a modified NDISI (MNDISI) proved to be an effective approach for mapping and estimating impervious surfaces in an environment with different land covers.
2013Arsanjani et al. [85]Arsanjani et al. [85] used high-resolution imagery with a spatial resolution of 5 m (RapidEye) and volunteer geographic information (VGI) contributed to the OpenStreetMap (OSM) project as alternative data sources to extract land use patterns in Koblenz (Germany). The method used by the authors is maximum likelihood classification. The results show that the accuracy of this method is very good—a kappa index of 89% was achieved. Based on the study by Arsanjani et al. [85], it can be concluded that the remote sensing approach can be integrated with VGI to facilitate the process of observing and monitoring the Earth.
2015Liu et al. [82] Liu et al. [82] point out that Big Data—including from smart cards, GPS data from cabs or data from social media and those from internet maps—make it possible to add to and better explore/understand knowledge about socio-economic environments. The authors use the term ‘social sensing’ in the context of analyzing such geospatial/remote sensing Big Data. Liu et al. [82] emphasize that these data—as they reflect some relevant socio-economic characteristics—are a good complement to remote sensing methods and traditional remote sensing data. The authors have conceptually combined social sensing with remote sensing and point to applications of this type of social sensing analysis. This type of analysis is still in its infancy and goes beyond traditional remote sensing analysis, but could have broad applications in the future for evaluating spatial interactions and the semantics of places.
2015Jiang et al. [84]Jiang et al. [84] performed classification and validation of online data from POI to estimate land use at the census block level. Jiang et al. [84] collected, standardized, classified and validated POI type volunteered geographic information (VGI) to estimate disaggregated land use at very high spatial resolution (census block level) using a porttion of the Boston metropolitan area in the United States as an example. The approach proposed by Jiang et al. [84] allows estimation of land use in blocks with high resolution, while VGI is a low-cost method and provides good value for money (ensuring relatively high quality at a certain accuracy threshold). Jiang et al. [84] also point out the usefulness of classifying POI data for different types of urban analysis.
2016Johnson i Iizuka [83]Johnson and Iizuka [83] explored the potential of remote sensing data with social knowledge. The authors used data such as OpenStreetMap (OSM) and NDVI Landsat time series used for LULC classification, OSM land use and ‘natural’ training data. More specifically, they used Landsat satellite imagery time series and training data from OpenStreetMap datasets and performed (supervised) land use/land cover/LULC classification/mapping. The best results were obtained using the Random Forest algorithm (classification accuracy 84%).
2016Hu et al. [81]Hu et al. [81] used satellite imagery and open social data to extract/identify urban land use features in large areas (in Beijing). The authors performed a classification of parcels according to different land use classes. For this purpose, the authors used Open Street Map (OSM) data and various features derived from Points of Interest (POI) data and data from Landsat 8 Operational Land Imager (OLI) imagery; thresholding methods and probability measures were used in the classification. The method used produced different results for the different land classes (between 69.89% and 81.04%).
2017Huang et al. [4]Huang et al. [4] used satellite imagery with multiple views (from the Ziyuan 3 satellite /ZY-3/) to study subtle urban dynamics. The pixel block method proposed by the authors to analyze changes allowed to solve the problem of spectral heterogeneity—which is particularly important when extracting impervious surfaces in different environments (in high resolution data). The results made it possible to identify different patterns of urban development in China. Knowledge of subtle changes resulting from urban infrastructure construction provides important information for urban planners—to better observe spatial details and understand the local environment and human activities. Specifically, the authors used ZY-3 satellite data and photogrammetric derivatives to generate multispatial orthographic images. They presented a framework for accurately analyzing urban change using a multilevel approach (pixel, grid and city block), which they tested for two Chinese cities, Wuhan and Beijing.
The authors’ proposed multilevel method for monitoring subtle urban change was found to be relatively accurate (kappa coefficients ~0.8 at the pixel level; 93–95% correctness at the grid level). The authors’ analysis allowed them to draw important conclusions about the nature of spatial changes. Among other things, they pointed to a high degree of fragmentation and spatial heterogeneity of buildings, as well as insufficient spacing between building patches. One of the conclusions is that high-resolution sensors are needed to accurately detect subtle urban changes (which ZY-3 provides with a resolution of 2.5 m compared to Landsat/30 m/, for example). According to the authors, it is not possible to monitor subtle urban changes with Landsat data.
2018Zhang and Huang [3]Zhang and Huang [3] monitored the change in impervious surface using a multi-objective approach to monitor the surface change and showed the changes occurred over several years. Zhang and Huang [3] used high-resolution time-series data to address the problem of mixed pixels and, in particular, the problem of spectral confusion between impervious surfaces and other non-vegetated land covers. The research experiment conducted allowed (enabled) the extraction of impervious surfaces from high resolution images. The researchers’ experiment was conducted for the city of Shenzhen in China, using satellite imagery (1.2–2.4 m): QuickBird, WorldView-2 and WorldView-3, from various data over 14 years. The high value of the kappa coefficient for the obtained results (kappa > 0.90) indicates high efficiency in extracting certain features (high efficiency of image classification).
2018Yu et al. [7]Yu et al. [7] used an approach based on the integration of remote sensing and social data in their study to estimate impervious surface. They extracted physical features using morphological attribute profiles in remote sensing images based on a spectral mixture analysis model, while they extracted social features based on normalized kernel densities of point-of-interest datasets and vector paths. The authors then estimated impervious surfaces based on the extracted and integrated physical and social features, using a multivariate linear regression model. The study of estimating impervious surfaces based on the method described above was conducted for the urban area of Guangzhou (in China)—at pixel and parcel levels. The results at pixel and parcel levels were similar (RMSE of about 11%), which proves the effectiveness of combining remote sensing imagery and social data to map impervious surface.

References

  1. Weng, Q. Remote sensing of impervious surfaces in the urban areas: Requirements, methods, and trends. Remote Sens. Environ. 2012, 117, 34–49. [Google Scholar] [CrossRef]
  2. Liu, C.; Shao, Z.; Chen, M.; Luo, H. MNDISI: A multi-source composition index for impervious surface area estimation at the individual city scale. Remote Sens. Lett. 2013, 4, 803–812. [Google Scholar] [CrossRef]
  3. Zhang, T.; Huang, X. Monitoring of urban impervious surfaces using time series of high-resolution remote sensing images in rapidly urbanized areas: A case study of Shenzhen. IEEE J. Sel. Top. Appl. Earth Obs. Remote Sens. 2018, 11, 2692–2708. [Google Scholar] [CrossRef]
  4. Huang, X.; Wen, D.; Li, J.; Qin, R. Multi-level monitoring of subtle urban changes for the megacities of China using high-resolution multi-view satellite imagery. Remote Sens. Environ. 2017, 196, 56–75. [Google Scholar] [CrossRef]
  5. Sobieraj, J.; Bryx, M.; Metelski, D. Stormwater Management in the City of Warsaw: A Review and Evaluation of Technical Solutions and Strategies to Improve the Capacity of the Combined Sewer System. Water 2022, 14, 2109. [Google Scholar] [CrossRef]
  6. Yuan, F.; Bauer, M.E. Comparison of impervious surface area and normalized difference vegetation index as indicators of surface urban heat island effects in Landsat imagery. Remote Sens. Environ. 2007, 106, 375–386. [Google Scholar] [CrossRef]
  7. Yu, Y.; Li, J.; Zhu, C.; Plaza, A. Urban impervious surface estimation from remote sensing and social data. Photogramm. Eng. Remote Sens. 2018, 84, 771–780. [Google Scholar] [CrossRef]
  8. Sobieraj, J.; Bryx, M.; Metelski, D. Management of rainwater as a barrier for the development of the City of Warsaw. Arch. Civ. Eng. 2022, 68, 1–27. [Google Scholar]
  9. Deng, Y.; Fan, F.; Chen, R. Extraction and analysis of impervious surfaces based on a spectral un-mixing method using Pearl River Delta of China Landsat TM/ETM+ imagery from 1998 to 2008. Sensors 2012, 12, 1846–1862. [Google Scholar] [CrossRef] [Green Version]
  10. Bauer, M.E.; Heinert, N.J.; Doyle, J.K.; Yuan, F. Impervious surface mapping and change monitoring using Landsat remote sensing. In Proceedings of the ASPRS Annual Conference, Denver, CO, USA, 18–23 May 2004. [Google Scholar]
  11. Brabec, E.; Schulte, S.; Richards, P.L. Impervious surfaces and water quality: A review of current literature and its implications for watershed planning. J. Plan. Lit. 2002, 16, 499–514. [Google Scholar] [CrossRef]
  12. Schueler, T. The importance of imperviousness. Watershed Prot. Tech. 1994, 1, 100–101. [Google Scholar]
  13. Yang, L.; Huang, C.; Homer, C.G.; Wylie, B.K.; Coan, M.J. An approach for mapping large-area impervious surfaces: Synergistic use of Landsat-7 ETM+ and high spatial resolution imagery. Can. J. Remote Sens. 2003, 29, 230–240. [Google Scholar] [CrossRef] [Green Version]
  14. Gillies, R.R.; Box, J.B.; Symanzik, J.; Rodemaker, E.J. Effects of urbanization on the aquatic fauna of the Line Creek watershed, Atlanta—A satellite perspective. Remote Sens. Environ. 2003, 86, 411–422. [Google Scholar] [CrossRef] [Green Version]
  15. Hurd, J.D.; Civco, D.L. Temporal characterization of impervious surfaces for the State of Connecticut. In Proceedings of the ASPRS Annual Conference, Denver, CO, USA, 23–28 May 2004. [Google Scholar]
  16. Kamusoko, C.; Gamba, J.; Murakami, H. Monitoring urban spatial growth in Harare Metropolitan province, Zimbabwe. Adv. Remote Sens. 2013, 2, 322–331. [Google Scholar] [CrossRef] [Green Version]
  17. Han, W.S.; Burian, S.J. Determining effective impervious area for urban hydrologic modeling. J. Hydrol. Eng. 2009, 14, 111–120. [Google Scholar] [CrossRef]
  18. Dong, X.; Meng, Z.; Wang, Y.; Zhang, Y.; Sun, H.; Wang, Q. Monitoring spatiotemporal changes of impervious surfaces in Beijing City using random forest algorithm and textural features. Remote Sens. 2021, 13, 153. [Google Scholar] [CrossRef]
  19. Pal, M. Random forest classifier for remote sensing classification. Int. J. Remote Sens. 2005, 26, 217–222. [Google Scholar] [CrossRef]
  20. Waske, B.; Benediktsson, J.A. Fusion of support vector machines for classification of multisensor data. IEEE Trans. Geosci. Remote Sens. 2007, 45, 3858–3866. [Google Scholar] [CrossRef]
  21. Szuster, B.W.; Chen, Q.; Borger, M. A comparison of classification techniques to support land cover and land use analysis in tropical coastal zones. Appl. Geogr. 2011, 31, 525–532. [Google Scholar] [CrossRef]
  22. Pal, M.; Mather, P.M. Assessment of the effectiveness of support vector machines for hyperspectral data. Future Gener. Comput. Syst. 2004, 20, 1215–1225. [Google Scholar] [CrossRef]
  23. Huang, C.; Davis, L.S.; Townshend, J.R.G. An assessment of support vector machines for land cover classification. Int. J. Remote Sens. 2002, 23, 725–749. [Google Scholar] [CrossRef]
  24. Zhang, Y.; Ren, J.; Jiang, J. Combining MLC and SVM classifiers for learning based decision making: Analysis and evaluations. Comput. Intell. Neurosci. 2015, 2015, 44. [Google Scholar] [CrossRef] [PubMed]
  25. Martines, M.R.; Lúcio, M.D.P.G.; Cavagis, A.D.; Fantin, M.; Ferreira, R.V.; Alves, M.O.; Toppa, R.H. Separability Analysis of Atlantic Forest Patches by Comparing Parametric and Non-Parametric Image Classification Algorithms. J. Geogr. Inf. Syst. 2019, 11, 567–578. [Google Scholar] [CrossRef] [Green Version]
  26. Sobieraj, J.; Metelski, D. Project Risk in the Context of Construction Schedules—Combined Monte Carlo Simulation and Time at Risk (TaR) Approach: Insights from the Fort Bema Housing Estate Complex. Appl. Sci. 2022, 12, 1044. [Google Scholar] [CrossRef]
  27. Slonecker, E.T.; Jennings, D.B.; Garofalo, D. Remote sensing of impervious surfaces: A review. Remote Sens. Rev. 2001, 20, 227–255. [Google Scholar] [CrossRef]
  28. Shahtahmassebi, A.R.; Song, J.; Zheng, Q.; Blackburn, G.A.; Wang, K.; Huang, L.Y.; Deng, J.S. Remote sensing of impervious surface growth: A framework for quantifying urban expansion and re-densification mechanisms. Int. J. Appl. Earth Obs. Geoinf. 2016, 46, 94–112. [Google Scholar] [CrossRef] [Green Version]
  29. Wu, C.; Murray, A.T. Estimating impervious surface distribution by spectral mixture analysis. Remote Sens. Environ. 2003, 84, 493–505. [Google Scholar] [CrossRef]
  30. Lu, D.; Moran, E.; Hetrick, S. Detection of impervious surface change with multitemporal Landsat images in an urban–rural frontier. ISPRS J. Photogramm. Remote Sens. 2011, 66, 298–306. [Google Scholar] [CrossRef] [Green Version]
  31. Arnold, C.L., Jr.; Gibbons, C.J. Impervious surface coverage: The emergence of a key environmental indicator. J. Am. Plan. Assoc. 1996, 62, 243–258. [Google Scholar] [CrossRef]
  32. Weng, Q. Modeling urban growth effect on surface runoff with the integration of remote sensing and GIS. Environ. Manag. 2001, 28, 737–748. [Google Scholar] [CrossRef]
  33. Williams, D.S.; Costa, M.M.; Sutherland, C.; Celliers, L.; Scheffran, J. Vulnerability of informal settlements in the context of rapid urbanization and climate change. Environ. Urban. 2019, 31, 157–176. [Google Scholar] [CrossRef] [Green Version]
  34. Sabine, C.L.; Heimann, M.; Artaxo, P.; Bakker, D.C.; Chen, C.T.; Field, C.B.; Valentini, R. Current status and past trends of the global carbon cycle. Scope-scientific committee on problems of the environment international council of scientific unions. In The Global Carbon Cycle. Integrating Humans, Climte and the Natural World; Field, C.B., Raupach, M.R., Eds.; Island Press: Washington, DC, USA, 2004; Volume 62, pp. 17–44. [Google Scholar]
  35. Fauvel, M.; Chanussot, J.; Benediktsson, J.A. Kernel principal component analysis for the classification of hyperspectral remote sensing data over urban areas. EURASIP J. Adv. Signal Process. 2009, 1, 1–14. [Google Scholar] [CrossRef]
  36. Debojit, B.J.H.; Manoj, K.A.; Balasubramanian, R. Study and implementation of a non-linear support vector machine classifier. Int. J. Earth Sci. Eng. 2011, 985–988. [Google Scholar]
  37. Keerthi, S.S.; Chapelle, O.; DeCoste, D.; Bennett, K.P.; Parrado-Hernández, E. Building support vector machines with reduced classifier complexity. J. Mach. Learn. Res. 2006, 7, 1493–1515. [Google Scholar]
  38. Vapnik, V. The Nature of Statistical Learning Theory; Springer Science & Business Media: Berlin, Germany, 1999. [Google Scholar]
  39. Cortes, C.; Vapnik, V. Support-vector networks. Mach. Learn. 1995, 20, 273–297. [Google Scholar] [CrossRef]
  40. Boser, B.E.; Guyon, I.M.; Vapnik, V.N. A Training Algorithm for Optimal Margin Classifiers; Morgan Kaufmann Publishers: San Mateo, CA, USA, 1992; pp. 144–152. [Google Scholar]
  41. Ahmad, A.; Quegan, S. Analysis of maximum likelihood classification on multispectral data. Appl. Math. Sci. 2012, 6, 6425–6436. [Google Scholar]
  42. Perumal, K.; Bhaskaran, R. Supervised classification performance of multispectral images. arXiv 2010, arXiv:1002.4046. [Google Scholar]
  43. Breiman, L. Random Forests—Random Features. Technical Report 567; University of California: Berkeley, CA, USA, 1999. [Google Scholar]
  44. Breiman, L. Bagging predictors. Mach. Learn. 1996, 24, 123–140. [Google Scholar] [CrossRef] [Green Version]
  45. Kim, H.; Koehler, G.J. Theory and practice of decision tree induction. Omega 1995, 23, 637–652. [Google Scholar] [CrossRef]
  46. Quinlan, J.R. C4.5: Programs for Machine Learning; Morgan Kaufmann Publishers: San Mateo, CA, USA, 2014. [Google Scholar]
  47. Breiman, L.; Friedman, J.H.; Olshen, R.A.; Stone, C.J. Classification and Regression Trees; Wadsworth & Brook: Monterey, CA, USA, 1984. [Google Scholar]
  48. Mahesh, P.; Mather, P.M. Support vector classifiers for land cover classification. In Proceedings of the 6th Annual International Conference, Map India 2003, New Delhi, India, 28–31 January 2003. [Google Scholar]
  49. Feller, W. An Introduction to Probability Theory and Its Applications; John Wiley & Sons: Hoboken, NJ, USA, 2008; Volume 2. [Google Scholar]
  50. Wang, L.; Duan, Y.; Zhang, L.; Rehman, T.U.; Ma, D.; Jin, J. Precise Estimation of NDVI with a Simple NIR Sensitive RGB Camera and Machine Learning Methods for Corn Plants. Sensors 2020, 20, 3208. [Google Scholar] [CrossRef]
  51. Wei, W.; Mendel, J.M. Maximum-likelihood classification for digital amplitude-phase modulations. IEEE Trans. Commun. 2000, 48, 189–193. [Google Scholar] [CrossRef]
  52. He, X.; Zhao, Y. Prior knowledge guided maximum expected likelihood based model selection and adaptation for nonnative speech recognition. Comput. Speech Lang. 2007, 21, 247–265. [Google Scholar] [CrossRef]
  53. Huang, H.L.; Lee, C.C.; Ho, S.Y. Selecting a minimal number of relevant genes from microarray data to design accurate tissue classifiers. BioSystems 2007, 90, 78–86. [Google Scholar] [CrossRef] [PubMed]
  54. Liu, K.; Shi, W.; Zhang, H. A fuzzy topology-based maximum likelihood classification. ISPRS J. Photogramm. Remote Sens. 2011, 66, 103–114. [Google Scholar] [CrossRef]
  55. Dugad, S.; Puliyadi, V.; Palod, H.; Johnson, N.; Rajput, S.; Johnny, S. Ship intrusion detection security system using image processing & SVM. In Proceedings of the 2017 International Conference on Nascent Technologies in Engineering (ICNTE), Navi Mumbai, India, 27–28 January 2017. [Google Scholar]
  56. Sun, X.; Liu, L.; Li, C.; Yin, J.; Zhao, J.; Si, W. Classification for remote sensing data with improved CNN-SVM method. IEEE Access 2019, 7, 164507–164516. [Google Scholar] [CrossRef]
  57. Bayrami, B. Estimation of splitting tensile strength of modified recycled aggregate concrete using hybrid algorithms. Steel Compos. Struct. 2022, 44, 389–406. [Google Scholar] [CrossRef]
  58. Yang, C.; Feng, H.; Esmaeili-Falak, M. Predicting the compressive strength of modified recycled aggregate concrete. Struct. Concr. 2022. [Google Scholar] [CrossRef]
  59. Sun, Z.; Guo, H.; Li, X.; Lu, L.; Du, X. Estimating urban impervious surfaces from Landsat-5 TM imagery using multilayer perceptron neural network and support vector machine. J. Appl. Remote Sens. 2011, 5, 053501. [Google Scholar] [CrossRef]
  60. Ustuner, M.; Sanli, F.B.; Dixon, B. Application of support vector machines for landuse classification using high-resolution rapideye images: A sensitivity analysis. Eur. J. Remote Sens. 2015, 48, 403–422. [Google Scholar] [CrossRef]
  61. An, S.H.; Park, U.Y.; Kang, K.I.; Cho, M.Y.; Cho, H.H. Application of support vector machines in assessing conceptual cost estimates. J. Comput. Civ. Eng. 2007, 21, 259–264. [Google Scholar] [CrossRef]
  62. Goel, A.; Pal, M. Application of support vector machines in scour prediction on grade-control structures. Eng. Appl. Artif. Intell. 2009, 22, 216–223. [Google Scholar] [CrossRef]
  63. Busch, J.R.; Ferrari, P.A.; Flesia, A.G.; Fraiman, R.; Grynberg, S.P.; Leonardi, F. Testing statistical hypothesis on random trees and applications to the protein classification problem. Ann. Appl. Stat. 2009, 3, 542–563. [Google Scholar] [CrossRef]
  64. Xu, Y.; Zhao, X.; Chen, Y.; Yang, Z. Research on a mixed gas classification algorithm based on extreme random tree. Appl. Sci. 2019, 9, 1728. [Google Scholar] [CrossRef] [Green Version]
  65. Calderoni, L.; Ferrara, M.; Franco, A.; Maio, D. Indoor localization in a hospital environment using random forest classifiers. Expert Syst. Appl. 2015, 42, 125–134. [Google Scholar] [CrossRef]
  66. Puissant, A.; Rougier, S.; Stumpf, A. Object-oriented mapping of urban trees using Random Forest classifiers. Int. J. Appl. Earth Obs. Geoinf. 2014, 26, 235–245. [Google Scholar] [CrossRef]
  67. McHugh, M.L. Interrater reliability: The kappa statistic. Biochem. Med. 2012, 22, 276–282. [Google Scholar] [CrossRef]
  68. Pai, P.F.; Wei-Chiang, H.; Ping-Teng, C.; Chen-Tung, C. The application of support vector machines to forecast tourist arrivals in Barbados: An empirical study. Int. J. Manag. 2006, 23, 375. [Google Scholar]
  69. Vega, J.; Murari, A.; Vagliasindi, G.; Rattá, G.A.; JET-EFDA Contributors. Automated estimation of L/H transition times at JET by combining Bayesian statistics and support vector machines. Nucl. Fusion 2009, 49, 085023. [Google Scholar] [CrossRef]
  70. Vong, C.M.; Wong, P.K.; Li, Y.P. Prediction of automotive engine power and torque using least squares support vector machines and Bayesian inference. Eng. Appl. Artif. Intell. 2006, 19, 277–287. [Google Scholar] [CrossRef]
  71. Ren, J. ANN vs. SVM: Which one performs better in classification of MCCs in mammogram imaging. Knowl. Based Syst. 2012, 26, 144–153. [Google Scholar] [CrossRef] [Green Version]
  72. Foody, G.M. RVM-based multi-class classification of remotely sensed data. Int. J. Remote Sens. 2008, 29, 1817–1823. [Google Scholar] [CrossRef]
  73. Hsu, C.C.; Wang, K.S.; Chang, S.H. Bayesian decision theory for support vector machines: Imbalance measurement and feature optimization. Expert Syst. Appl. 2011, 38, 4698–4704. [Google Scholar] [CrossRef]
  74. Maciejewska, A.; Kuzak, Ł.; Sobieraj, J.; Metelski, D. The Impact of Opencast Lignite Mining on Rural Development: A Literature Review and Selected Case Studies Using Desk Research, Panel Data and GIS-Based Analysis. Energies 2022, 15, 5402. [Google Scholar] [CrossRef]
  75. Lu, Y.; Liu, Y. Pervasive location acquisition technologies: Opportunities and challenges for geospatial studies. Comput. Environ. Urban Syst. 2012, 36, 105–108. [Google Scholar] [CrossRef]
  76. Møller-Jensen, L. Knowledge-based classification of an urban area using texture and context information in Landsat-TM imagery. Photogramm. Eng. Remote Sens. 1990, 56, 899–904. [Google Scholar]
  77. Lu, D.; Weng, Q. Use of impervious surface in urban land-use classification. Remote Sens. Environ. 2006, 102, 146–160. [Google Scholar] [CrossRef]
  78. Li, P.; Guo, J.; Song, B.; Xiao, X. A multilevel hierarchical image segmentation method for urban impervious surface mapping using very high resolution imagery. IEEE J. Sel. Top. Appl. Earth Obs. Remote Sens. 2010, 4, 103–116. [Google Scholar] [CrossRef]
  79. Mura, M.D.; Benediktsson, J.A.; Waske, B.; Bruzzone, L. Morphological attribute profiles for the analysis of very high resolution images. IEEE Trans. Geosci. Remote Sens. 2010, 48, 3747–3762. [Google Scholar] [CrossRef]
  80. Rodrigues, F.; Pereira, F.C.; Alves, A.; Jiang, S.; Ferreira, J. Automatic classification of points-of-interest for land-use analysis. In Proceedings of the Fourth International Conference on Advanced Geographic Information Systems, Applications, and Services, Valencia, Spain, 30 January–4 February 2012. [Google Scholar]
  81. Hu, T.; Yang, J.; Li, X.; Gong, P. Mapping urban land use by using landsat images and open social data. Remote Sens. 2016, 8, 151. [Google Scholar] [CrossRef]
  82. Liu, Y.; Liu, X.; Gao, S.; Gong, L.; Kang, C.; Zhi, Y.; Shi, L. Social sensing: A new approach to understanding our socioeconomic environments. Ann. Assoc. Am. Geogr. 2015, 105, 512–530. [Google Scholar] [CrossRef]
  83. Johnson, B.A.; Iizuka, K. Integrating OpenStreetMap crowdsourced data and Landsat time-series imagery for rapid land use/land cover (LULC) mapping: Case study of the Laguna de Bay area of the Philippines. Appl. Geogr. 2016, 67, 140–149. [Google Scholar] [CrossRef]
  84. Jiang, S.; Alves, A.; Rodrigues, F.; Ferreira, J., Jr.; Pereira, F.C. Mining point-of-interest data from social networks for urban land use classification and disaggregation. Comput. Environ. Urban Syst. 2015, 53, 36–46. [Google Scholar] [CrossRef] [Green Version]
  85. Arsanjani, J.J.; Helbich, M.; Bakillah, M. Exploiting volunteered geographic information to ease land use mapping of an urban landscape. In Proceedings of the 29th Urban Data Management Symposium (International Archives of the Photogrammetry, Remote Sensing and Spatial Information Sciences), London, UK, 29–31 May 2013. [Google Scholar]
  86. Sawaya, K.E.; Olmanson, L.G.; Heinert, N.J.; Brezonik, P.L.; Bauer, M.E. Extending satellite remote sensing to local scales: Land and water resource monitoring using high-resolution imagery. Remote Sens. Environ. 2003, 88, 144–156. [Google Scholar] [CrossRef]
Figure 1. Classification of impervious surfaces using the SVM machine learning method (source: own elaboration based on orthophoto maps available on Geoportal—https://www.geoportal.gov.pl/, accessed on 2 November 2022).
Buildings 12 02115 g001
Figure 2. Site of Fort Bema in the Bemowo district of Warsaw, Poland (source: own elaboration).
Buildings 12 02115 g002aBuildings 12 02115 g002b
Figure 3. Fort Bema—Green and blue solutions to mitigate climate change in urban areas (Source: wazki.pl).
Buildings 12 02115 g003
Figure 4. Visual composition with the housing estate and the NIR band (note: the blue colour indicates the boundaries of the housing estate FORT-BEMA, which is located in the western-northern part of Warsaw) [source: own elaboration based on orthophoto maps available on Geoportal—https://www.geoportal.gov.pl/, accessed on 2 November 2022].
Buildings 12 02115 g004
Figure 5. Flowchart of Main Steps in the Research Study (source: own elaboration).
Buildings 12 02115 g005
Figure 6. Land Use/Land Cover (LULC) classification using SVM, ML and RT methods. (Source: own elaboration own elaboration based on orthophoto maps available on Geoportal—https://www.geoportal.gov.pl/, accessed on 2 November 2022).
Buildings 12 02115 g006
Figure 7. The classification of impervious surfaces using SVM, ML and RT methods. (Source: own elaboration based on orthophoto maps available on Geoportal—https://www.geoportal.gov.pl/, accessed on 2 November 2022).
Buildings 12 02115 g007
Figure 8. Classification with the SVM and visualization of vegetation production (representative of the permeable surface) with NDVI methods [source: own elaboration based on data from SENTINEL—10 m resolution, satellite images are from 9 May 2022, and data were downloaded from Earth Explorer (https://earthexplorer.usgs.gov, accessed on 2 November 2022)].
Buildings 12 02115 g008
Table 1. Confussion Matrix (SVM method).
Object IDClass ValueC_1C_2C_3C_4C_5C_6C_7TotalU_AccuracyKappa
1C_16030100100.60
2C_203500010360.972220
3C_30060400100.60
4C_40028000100.80
5C_500202901320.906250
6C_6000001001010
7C_701000010110.909090
8Total63613834111111900
9P_Accuracy10.972220.4615310.852940.909090.9090900.873940
10Kappa0000000000.84169
Note: C_1—water; C_2—forest; C_3—asphalt roads; C_4—artificial surface; C_5—roofs and sidewalks; C_6—grassland; C_7—bare ground.
Table 2. Confusion Matrix (ML method).
Object IDClass ValueC_1C_2C_3C_4C_5C_6C_7TotalU_AccuracyKappa
1C_18000000810
2C_204100100420.976190
3C_3008010090.888880
4C_40118000100.80
5C_500602310300.766660
6C_60200180110.727270
7C_7001001790.777770
8Total8441682610711900
9P_Accuracy10.931810.510.884610.8100.865540
10Kappa0000000000.82803
Note: C_1—water; C_2—forest; C_3—asphalt roads; C_4—artificial surface; C_5—roofs and sidewalks; C_6—grassland; C_7—bare ground.
Table 3. Confusion Matrix (RT method).
Object IDClass ValueC_1C_2C_3C_4C_5C_6C_7TotalU_AccuracyKappa
1C_1800010090.888880
2C_203500020370.945940
3C_3006030090.666660
4C_4010701090.777770
5C_504812100340.617640
6C_60000191110.818180
7C_70010009100.90
8Total84015826121011900
9P_Accuracy10.8750.40.8750.807690.750.900.798310
10Kappa0000000000.74694
Note: C_1—water; C_2—forest; C_3—asphalt roads; C_4—artificial surface; C_5—roofs and sidewalks; C_6—grassland; C_7—bare ground.
Table 4. RMSE for the classification of 7 class (LULC).
SVMMLRT
RMSE3.316624793.5050983284.503967
Table 5. Confusion Matrix (SVM method).
Class ValueC_1C_2TotalU_AccuracyKappa
C_1634670.9402985070
C_2151520.9807692310
Total645511900
P_Accuracy0.9843750.92727272700.9579831930
Kappa00000.915157565
Note: C_1—pervious; C_2—impervious.
Table 6. Confusion Matrix (ML method).
Class ValueC_1C_2TotalU_AccuracyKappa
C_1673700.9571428570
C_2247490.9591836730
Total695011900
P_Accuracy0.9710144930.9400.9579831930
Kappa00000.91353001
Note: C_1—pervious; C_2—impervious.
Table 7. Confusion Matrix (RT method).
Class ValueC_1C_2TotalU_AccuracyKappa
C_1643670.9552238810
C_2646520.8846153850
Total704911900
P_Accuracy0.9142857140.9387755100.9243697480
Kappa00000.845298281
Note: C_1—pervious; C_2—impervious.
Table 8. RMSE for 2 class classification (impervious-pervious).
SVMMLRT
RMSE2.9154759472.5495097574.743416
Table 9. Percentage of reliability of data measured with Cohen’s Kappa.
Value of KappaLevel of Agreement% of Data That Are Reliable
0–0.20None0–4%
0.21–0.39Minimal4–15%
0.40–0.59Weak15–35%
0.60–0.79Moderate35–63%
0.80–0.90Strong64–81%
Above 0.90Almost Perfect82–100%
Publisher’s Note: MDPI stays neutral with regard to jurisdictional claims in published maps and institutional affiliations.

