Article

An Integrated User Interface of Assessment and Optimization for Architectural Façade Shading Designs in Taiwan

1
Department of Architecture, National Cheng Kung University, Tainan 701, Taiwan
2
Taiwan Design Research Institute, Taipei 110, Taiwan
*
Author to whom correspondence should be addressed.
Buildings 2022, 12(12), 2116; https://doi.org/10.3390/buildings12122116
Submission received: 7 August 2022 / Revised: 10 November 2022 / Accepted: 25 November 2022 / Published: 2 December 2022
(This article belongs to the Special Issue Advanced Building Performance Analysis)

Abstract

:
In response to sustainable development goals, the architectural industry aims to decrease the high proportion of emissions and energy use in the construction sector. Therefore, the design method of building performance optimization (BPO) has been advocated in recent studies as a method for accomplishing high-performance building design. However, BPO remains difficult to implement in practice due to the lack of a definite process and supporting tools for architects/designers in the early design process. The purpose of this paper is to propose a BPO framework and integrated design decision support (DDS) interface to provide a visual and science-based analysis and assist designers working with high-performance building façade designs. The framework and DDS tool are then tested by designers through a practice design of the headquarters façade. All the designers started and implemented the facade optimization design in a short training session, although they reported that the developed support tools still needed to be improved in terms of also integrating optimization tools. The characteristics of the user interface help considerably with comparing and making decisions in optimal solutions. The results emphasize the importance of developing design support tools for practical adoption from practical designers’ perspectives.

1. Introduction

In recent years, climate change and the energy crisis have become one of the biggest challenges for mankind and have also begun to force fundamental changes in the human lifestyle. In 2015, the United Nations issued the 2030 Agenda for Sustainable Development, including 17 Sustainable Development Goals (SDGs), as a universal call to action to end poverty and protect the planet [1]. SDGs cover the three major aspects of economic growth, social progress, and environmental protection; based on this, various corporate departments began attaching importance to their social corporate responsibilities and responding to these SDGs. In line with this, the Sustainable Development Goal Business Index (SDGBI) was published by the Association for Supporting SDGs of the United Nations (ASD) and encouraged enterprises to create concrete strategies for achieving the SDGs [2,3]. According to the United Nations Environment Programme (UNEP) report, the construction industry has the greatest potential and significant cost-effectiveness with regard to reducing emissions; however, the construction sector still accounts for a significant 39% of total energy-related CO2 emissions and 36% of final energy use [4]. Due to the extremely important impact, it has on the environment and human sustainability, the field of architectural design must assume its social responsibility to achieve sustainable design solutions that integrate energy efficiency, comfort, and health. We believe that designers actively face these challenges when designing future buildings.
With the development of parametric modeling, modern building facades have more possibilities for complex geometric shapes and forms. These facade designs not only represent the appearance of the office or public building but also significantly affect energy usage, daylight environment, internal vision, and even occupants’ health throughout the entire building [5,6,7,8,9]. The integrated analysis of building performance simulation (BPS) through parametric software can quantify the physical environment, structure, system equipment, etc. of the building. Designers can conduct environmental assessments and make decisions based on the results. According to the statistics of Directory of Energy Software Tools for Buildings (BESTD) in 2010, there are more than 350 building energy simulation tools. BPS is used to accurately calculate a hypothetical or existing building’s performance, such as energy, daylight, acoustics, Heating, Ventilation, Air Conditioning (HVAC) systems, indoor air quality, costs, etc. Regarding the design process and BPS, Morbitzer (2003) proposed issues at various stages in the design process, as well as problems that designers may have in Table 1 [10].
Recently, with the advancement of computing tools, many researchers have studied building performance optimization (BPO) and have been committed to enhancing the form and performance of buildings by using environmental simulation tools and optimization algorithms. For example, Gadelhak (2019) developed a simplified framework and design support tools to aid designers in the multidimensional optimization of building facades, where environmental performance measures are enhanced by incrementally improving façade design using multi-objective optimizations [9]. Ouf et al. (2019) used genetic algorithms to optimize ten façade-related design parameters of a private office building facing south. The annual energy consumption was used as the objective function, and the latest technology of the standard user model and the random user model were used to set up the simulation [11]. Pilechiha et al. (2020) proposed an approach for quantifying Quality of View in office buildings, balancing energy performance and daylighting, thus enabling an optimization framework for office window design [12]. Ochoa et al. (2012) discussed the obvious contradiction of window size between low energy consumption and visual comfort and then adopted an optimization method to determine the window size to obtain a solution that meets both energy and visual requirements [13]. Vanhoutteghem et al. (2015) evaluated the impact of window design variables on thermal performance, comfort, and daylighting and found window solutions suitable for various room sizes [14]. Fang et al. (2019) discussed simple building geometry and the size and configuration of windows and skylights in order to achieve multiple target designs for energy and daylighting performance [15]. Yi (2019) proposed a method for integrating the two different properties of quality and quantity into a measurable goal. The proposed method provides a building facade that meets daylighting performance and, most importantly, allows for the consideration of users’ aesthetic feelings and the matching of their design preferences [16]. Chen et al. (2017) took the cooling system as a design variable in the early design stage and discussed it with the building geometry and structure of the building envelope. The results show that the process can provide recommendations for design in the early stages [17]. Zhang et al. (2020) selected parameters related to spatial form and building envelope for optimization and take the cooling and heating load as the optimization object. Turn out that this method can effectively reduce the energy consumption of residential buildings [18].
BPO can significantly improve building performance [19]. Despite the great potential for high-performance building design, as well as that most of the previous tools and pictures have been found helpful in previous studies, BPO is still largely a research tool and is very challenging to use in design practice [19,20]. The main obstacles include a lack of an appropriate process, such resources such as time and expertise, and requirements for clearly defined issues (e.g., constraints, objective function, and finite list of design options) [21]. As Touloupaki (2017) mentioned that efforts need to be made to improve time feasibility, gains in performance, and cost for the whole process to be meaningful enough to justify the effort involved. Getting started with BPO in the design process is not easy for inexperienced users or designers [22]. Lin et al. (2021) also indicated that methods, algorithms, and tools to support the BPO process in the early design stage are still lacking [19]. If the shift can be made to better and easier-to-use software tools for BPS, design processes will get more efficient as well as the product of these processes [23,24]. Furthermore, the results of optimization are not easy to analyze; in particular, when multiple goals are targeted, it becomes more difficult to analyze and understand the trade-offs between multiple goals [21]. However, Evins (2013) pointed out that there is clear growth in the popularity of optimization for sustainable building design, and of multi-objective optimization in particular [25]. Therefore, developing simplified early design decision support tools (DDS) is vital to assist designers in realizing BPO and helping them with alternative selection and visualization. Since the 1980s, with the evolution of computer technology, many researchers have begun to study multi-purpose optimization. Through various optimization algorithms, find the optimal solution to the Pareto Front in a limited time. For example, MOGA, SPEA, PAES, VEGA, NSGA-II, etc., among which NSGA-II [26] and SPEA-II [27] are more common methods in the architectural study. Both algorithms apply nondominated sorting to search for Pareto optimal solutions among all solutions. Eliminating similar schemes on Pareto Front to make solutions more evenly distributed on Pareto Front [28]. There have been many studies on building facade or space design based on parametric design and optimization, and the results all show that optimization can effectively carry out complex architectural design. The studies in Table 2 showed up the simulation-based workflow helps to make generative modeling informed by powerful simulation engines more accessible to ordinary designers working on regular projects and schedules.
The main objective of this manuscript is to develop a BPO framework for high-performance facade design based on multiple objectives to help designers evaluate comprehensive environmental performance and optimize building exterior walls in the early design stage. The proposed framework is also integrated with a design decision support tool (UI: User Interface) to enable designers to effectively implement BPO and make program decisions using the tool. Then, several designers were given simple education and training and asked to use the tool to optimize the design of the parametric facade of a corporate headquarters. few collected feedback and suggestions from participants to verify the effectiveness of the BPO framework and the supporting tools.

2. Methodology

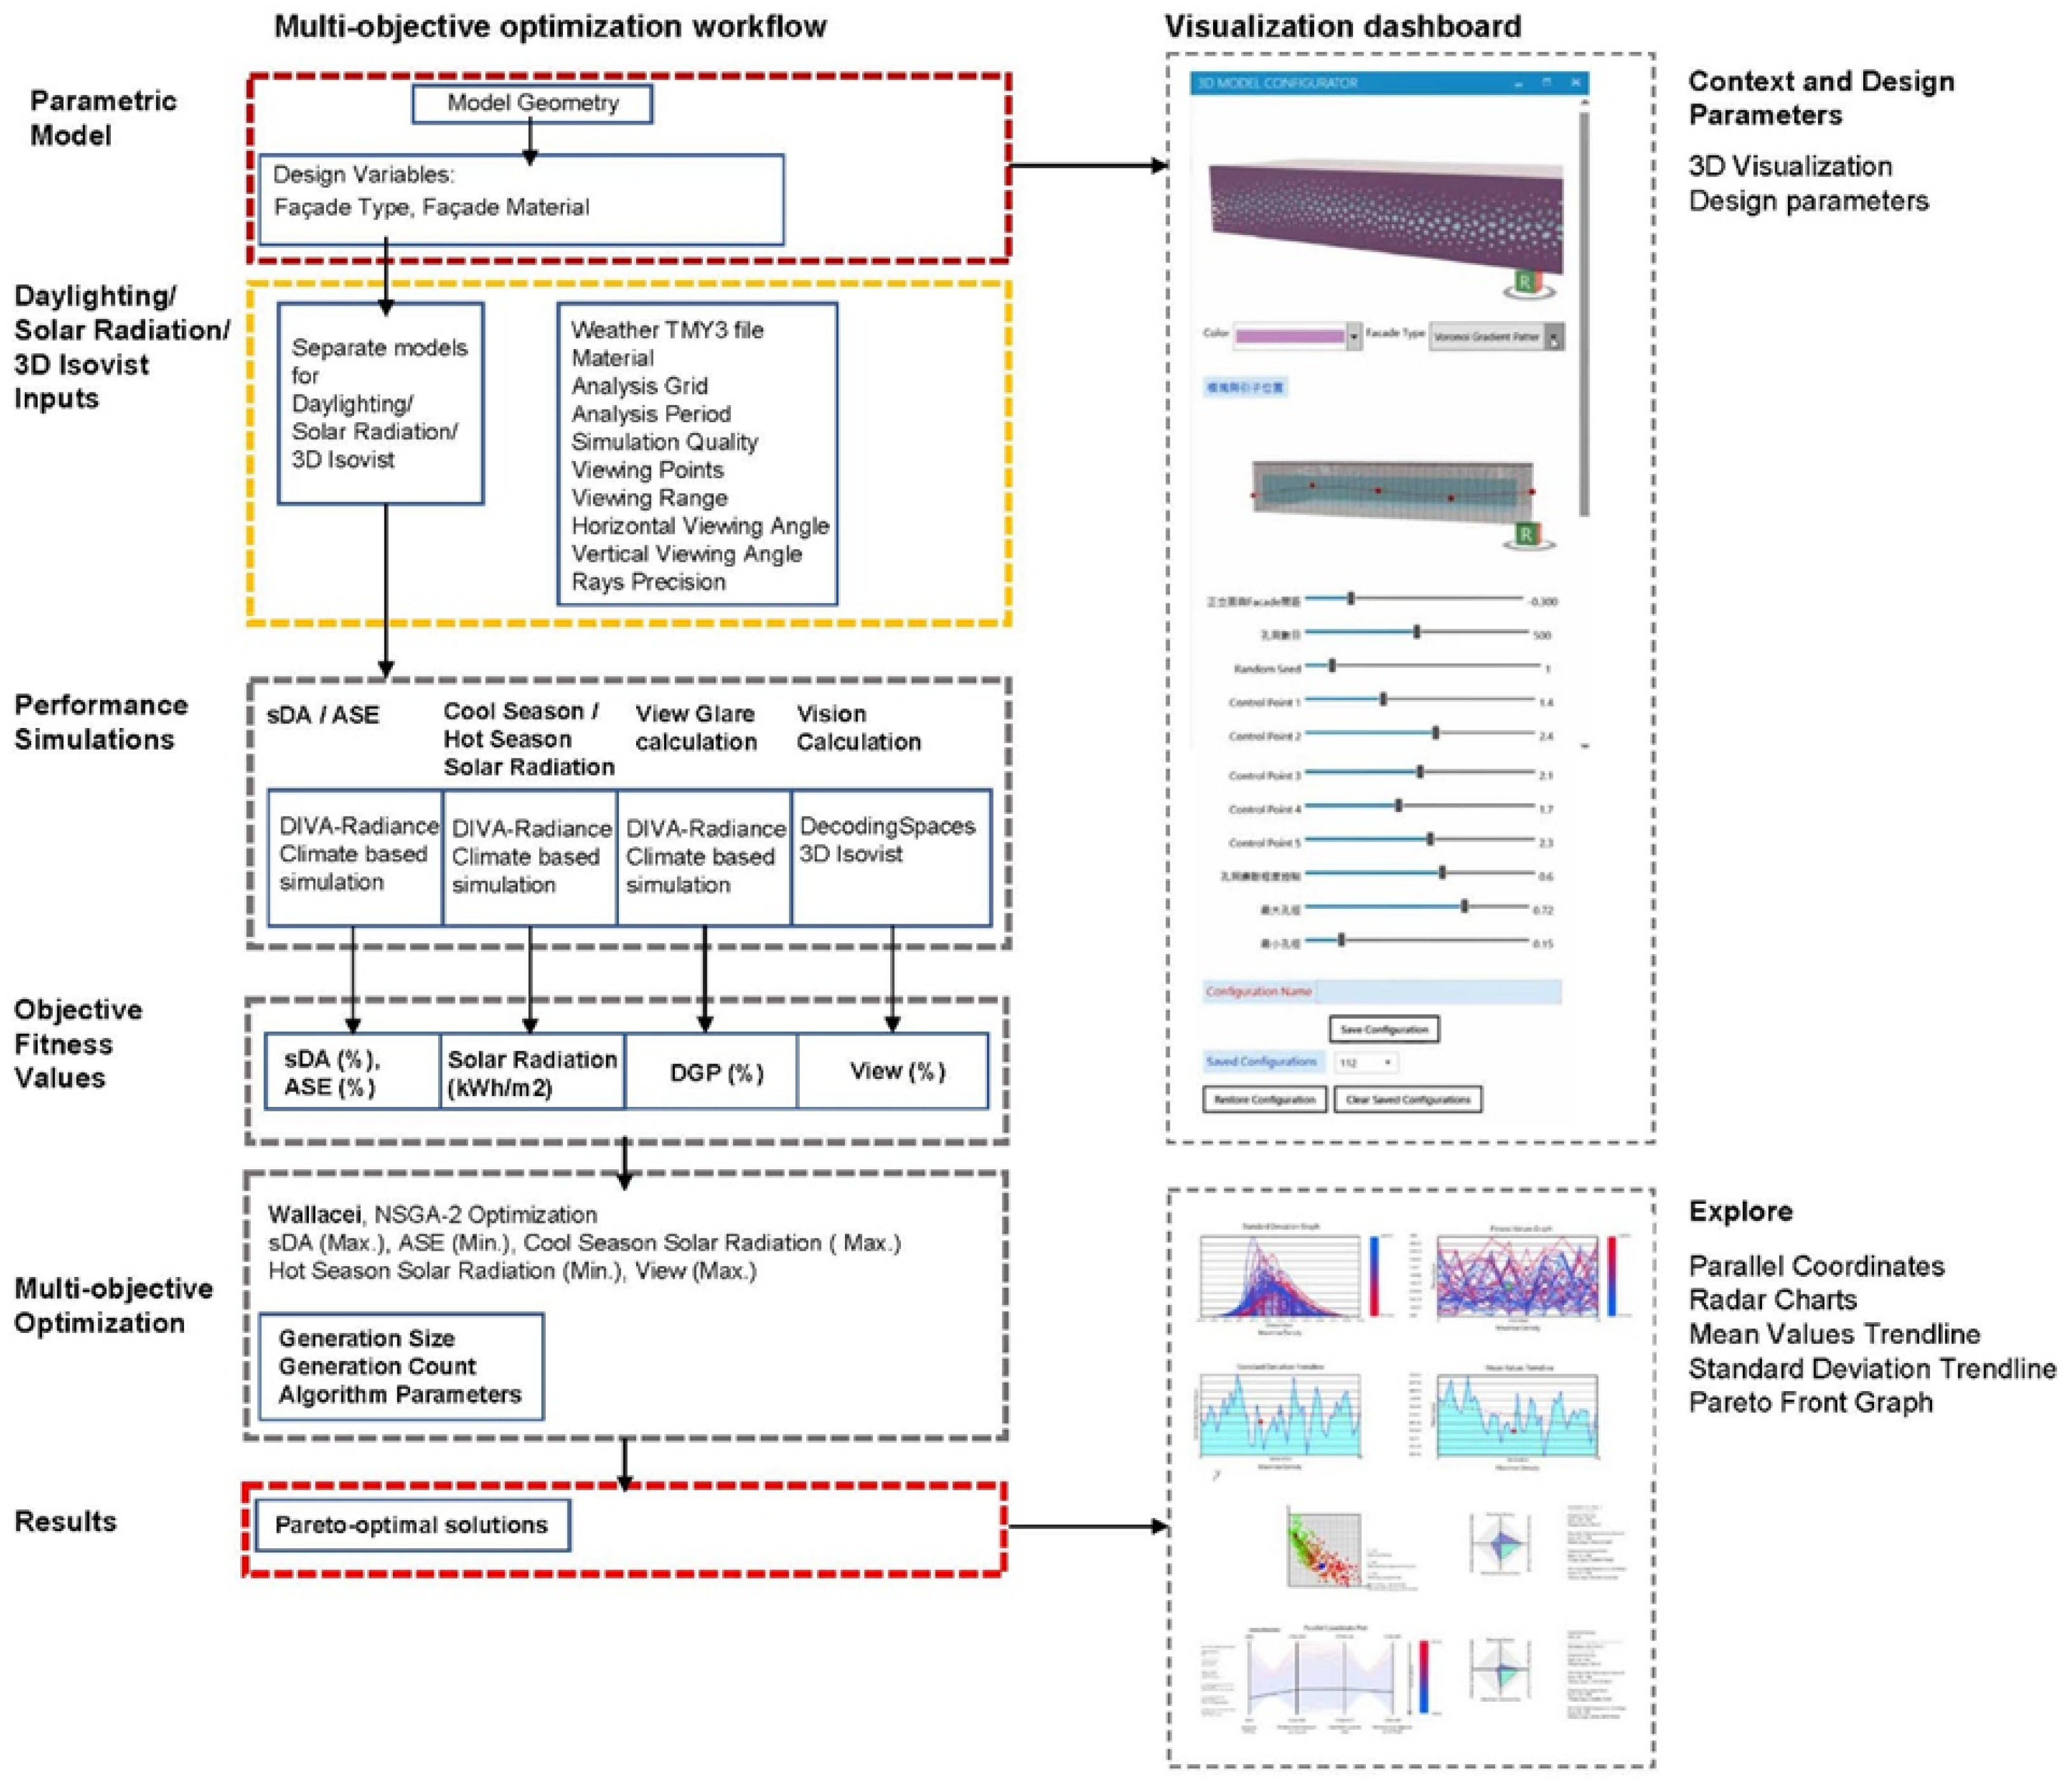
2.1. The BPO Framework

Although there is various professional BPS software to assist architectural design, there are still many problems with application. As stated by Hermund (2011), although there is a lot of BPS software that can be used as both a design tool and a simulation tool, for easy use and diverse geometric designs, designers prefer to use professional design software (e.g., ArchiCad, Sketchup, Revit, Rhino, etc.) [38]. In addition, parametric modeling that integrates design software and simulation software has been developed in recent years. Convert geometric elements (e.g., sun visor shapes, etc.) or definitions (e.g., material properties, etc.) in the building model into parameters controlled by functions. By adjusting the parameters or functions to generate different 3D models, designers can independently complete a building simulation analysis. Such as Grasshopper, Dynamo, Generative Components, etc., connect the geometric model and the simulation model. Dynamic analysis makes the design and simulation process smoother. Grasshopper is a visual programming language and user interface that runs in Rhinoceros 3D. Can be combined with open-source modules such as Ladybug, Honeybee, Butterfly, and other different simulation tools, enabling designers to simulate climate analysis, thermal comfort, sunlight, indoor and outdoor wind fields, energy, etc. [39]. Grasshopper can also be programmed on purpose for simulation analysis projects and visualization of simulation results.
This manuscript mainly focuses on building facade design, which is closely related to such building performance elements as user comfort and environmental impact. According to previous literature, daylighting, solar radiation, visual comfort, and occupants’ vision are considered the facade performance metrics for the development of the BPO framework. The proposed BPO framework is shown in Figure 1 and includes five main parts: modeling, parameter setting, performance simulation, objective function calculation, and multi-objective optimization. To integrate different performance simulations, the framework was built in Grasshopper [40], a visual programming language and environment that runs within the Rhinoceros 3D computer-aided design (CAD) application and features many developed analysis components.
In order to consider the multiple performance indicators mentioned above, in this manuscript, we used Wallacei to perform multi-purpose optimization [41]. Wallacei uses NSGA-II as the optimization algorithm and provides Pareto Fronts solution results.

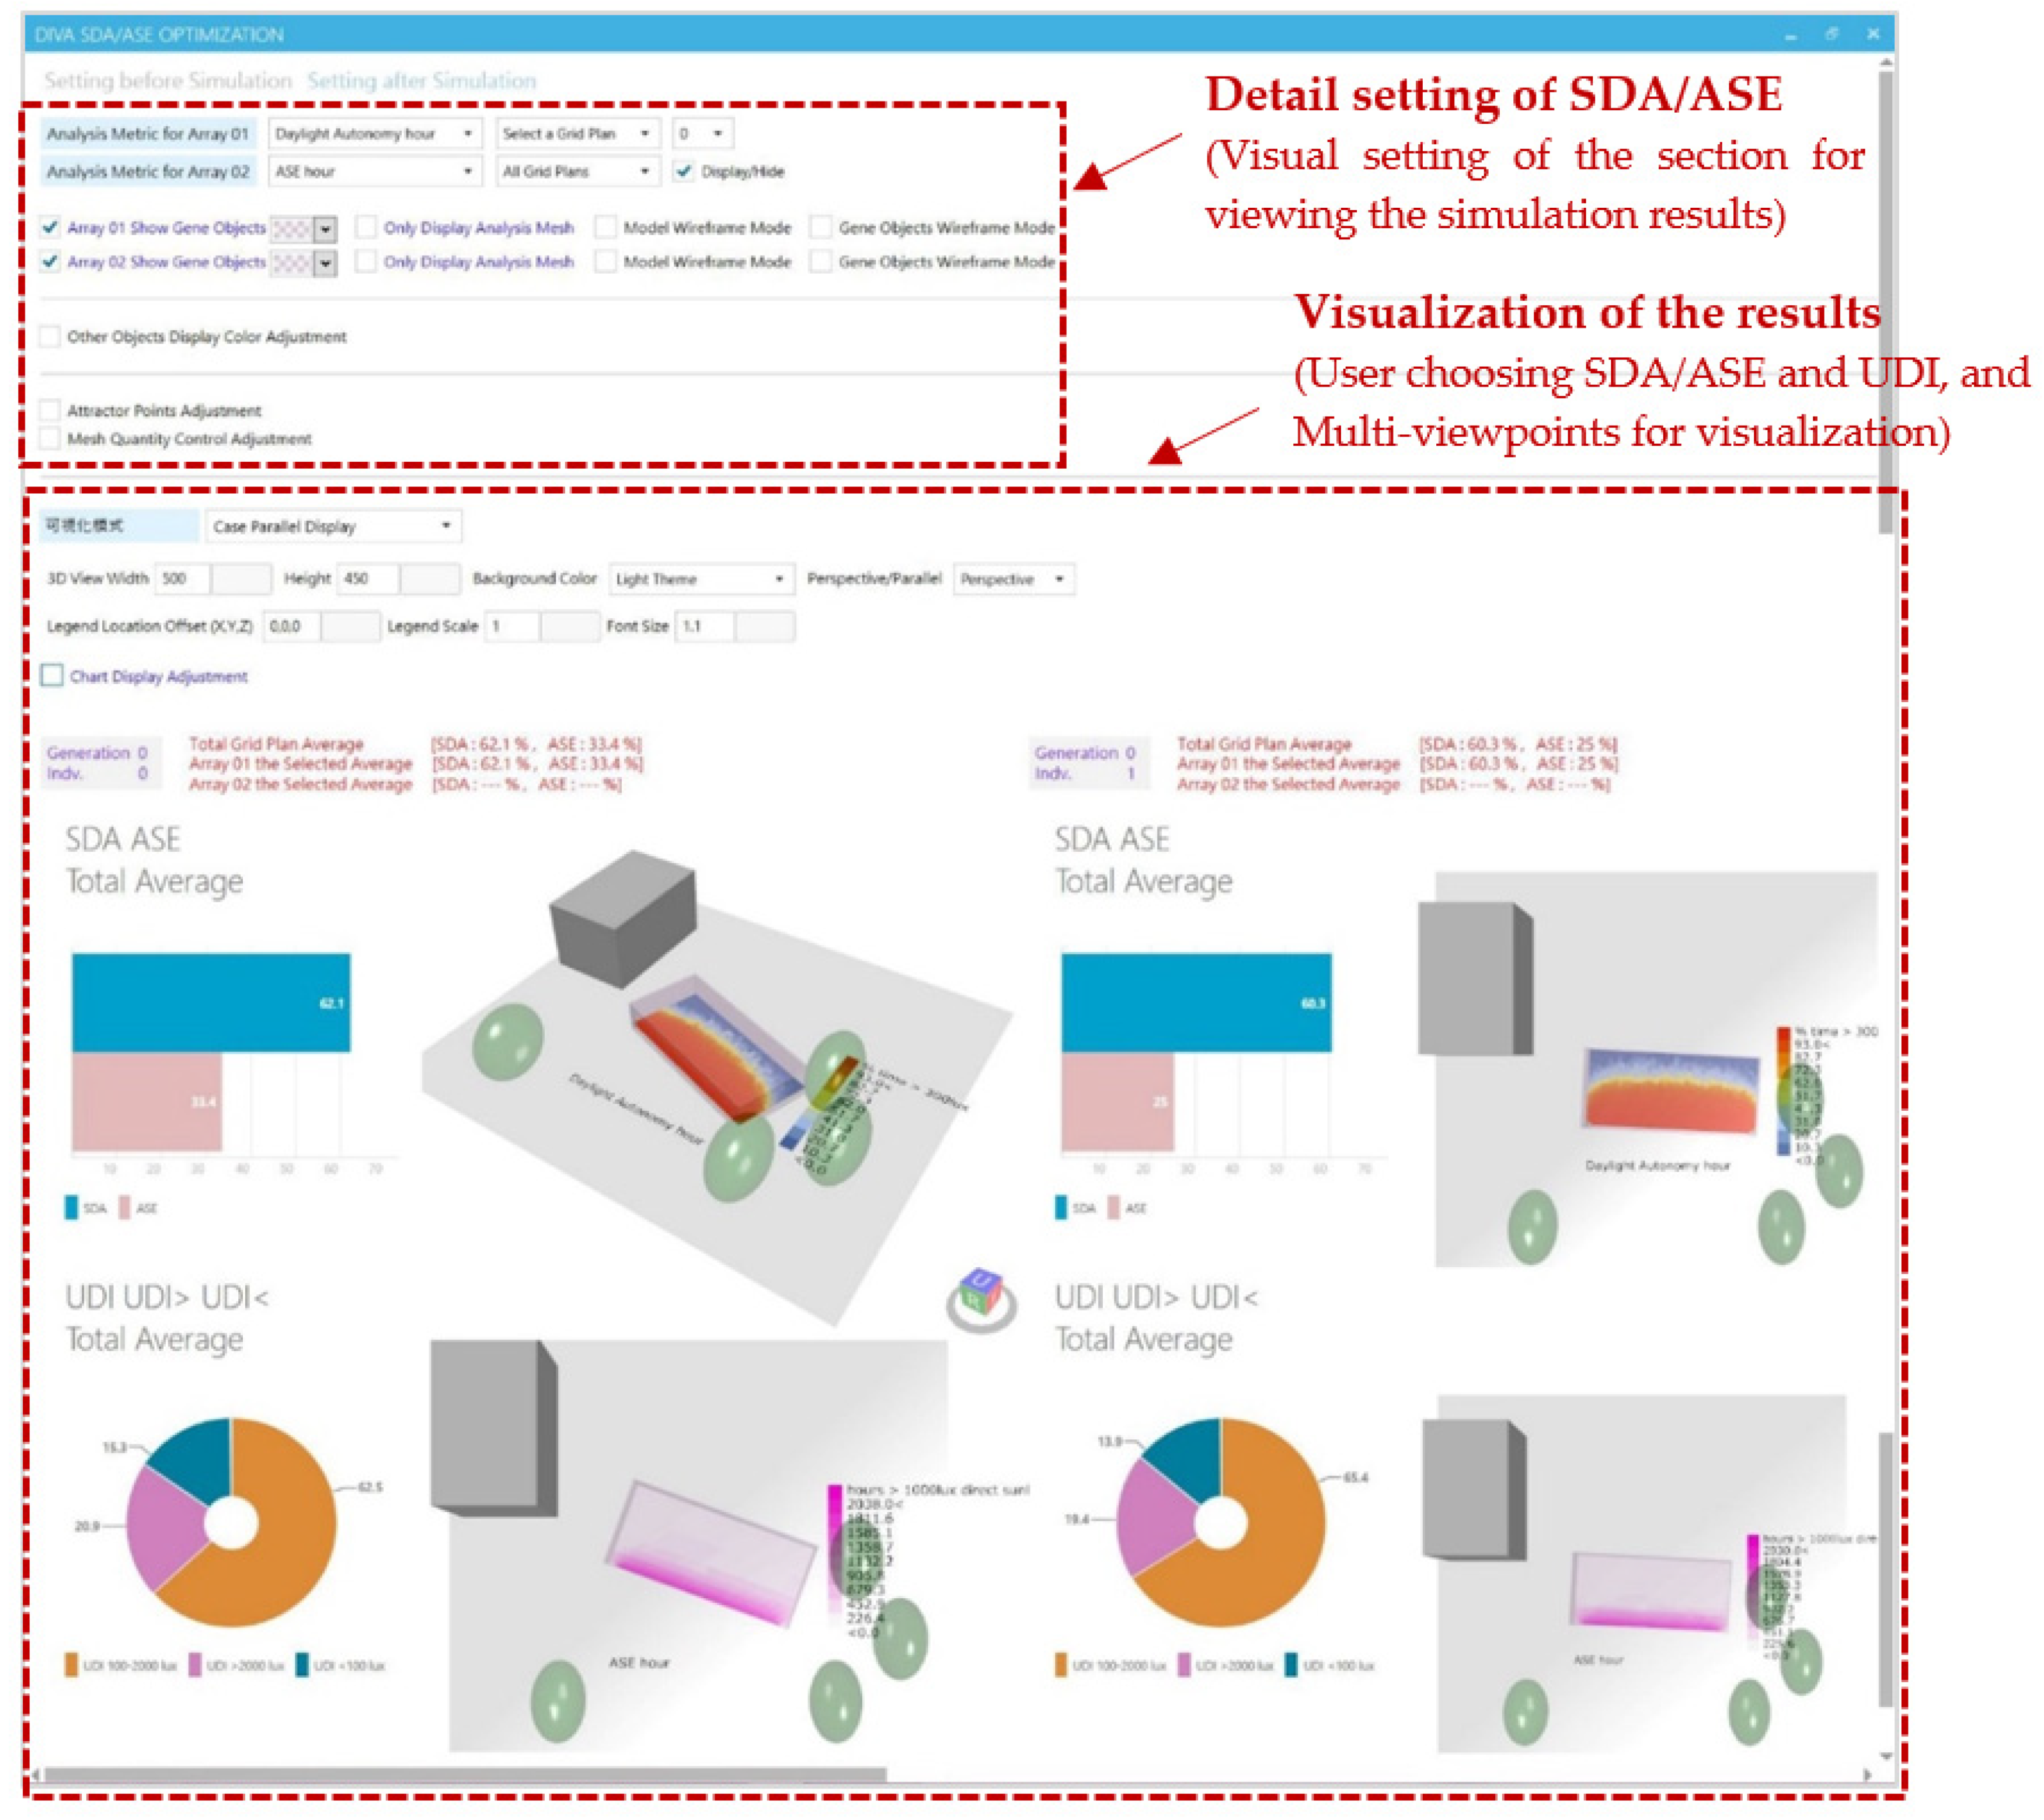
2.1.1. Daylighting Analysis

Natural light has a great influence on the health, mood, and behavior of the occupants. A bright, glare-free daylight environment has positive effects on the comfort and productivity of occupants. The maximized utilization of natural lighting can also reduce the use of indoor lighting equipment in buildings and save energy consumption. The dynamic daylight performance indicators spatial Daylight Autonomy (sDA) and Annual Sunlight Exposure (ASE) are adopted in BPO workflow. Spatial Daylight Autonomy (%) is defined with the following equation:
s D A 300 lux / 50 % = j S ( j ) j p j ,     S ( j ) = { 1 ,     i f   D A j 50 % 0 ,     i f   D A j < 50 %
where p j is a given point on analysis surface, and S ( j ) determines the spatial daylight credit of the given point, which depends on the evaluation of D A at the given point ( D A j ) and the set threshold of the occupied time percentage (set at 50% in this study).
The calculation of D A at the given point is shown in Equation (2):
D A 300 lux = i ( ω i × t i ) i t i ,     ω i = { 1 ,     i f   E D a y l i g h t 300 l u x 0 ,     i f   E D a y l i g h t < 300 l u x
where t i is a given time in the analysis period, and ω i determines the timely daylight credit of the given time, which is based on the evaluation of illuminance value at the given time ( E D a y l i g h t ) and the set illuminance threshold (set as 300 lux in this study).
The calculation of A S E at the given point is shown in Equation (3):
A S E 1000 lux / 250 hours = j A ( j ) j p j ,     A ( j ) = { 1 ,     i f   A S E h r j 250   h o u r s 0 ,     i f   A S E h r j < 250   h o u r s
where A ( j ) determines the sunlight exposure credit of the given point, which depends on the evaluation of A S E h r at the given point ( A S E h r j ) and the set threshold of occupied hours (set as 250 h in this study).
We evaluated the sDA and ASE using the daylight simulation tool DIVA for Rhino, a validated and Radiance and DAYSIM-based simulation tool [42]. In terms of optimization, the objective functions of daylight were set to maximize the performance of sDA and minimize the value of ASE.

2.1.2. Solar Radiation Analysis

Minimizing energy use is the primary goal of most high-performance buildings and has often been used as a performance index for optimizing buildings in past studies. Building energy simulation requires much data, such as zone division, materials and constructions, equipment systems, and various schedule settings. Such detailed information is difficult to obtain in the early design stage, and the simulation setting is relatively advanced and complicated for architects and designers. In situations where accurate energy simulation results cannot be obtained, the alternative method is to analyze the influence of the facade on indoor heat gain by evaluating the building’s solar radiation performance. Therefore, we adopted solar radiation as a performance index for building façade design in the proposed BPO framework. The performance of solar radiation is separately discussed based on the cool season and the hot season. The solar radiation in the framework was calculated through DIVA. When optimizing, the objective function was to maximize the solar radiation in the cool season and minimize it in the hot season.

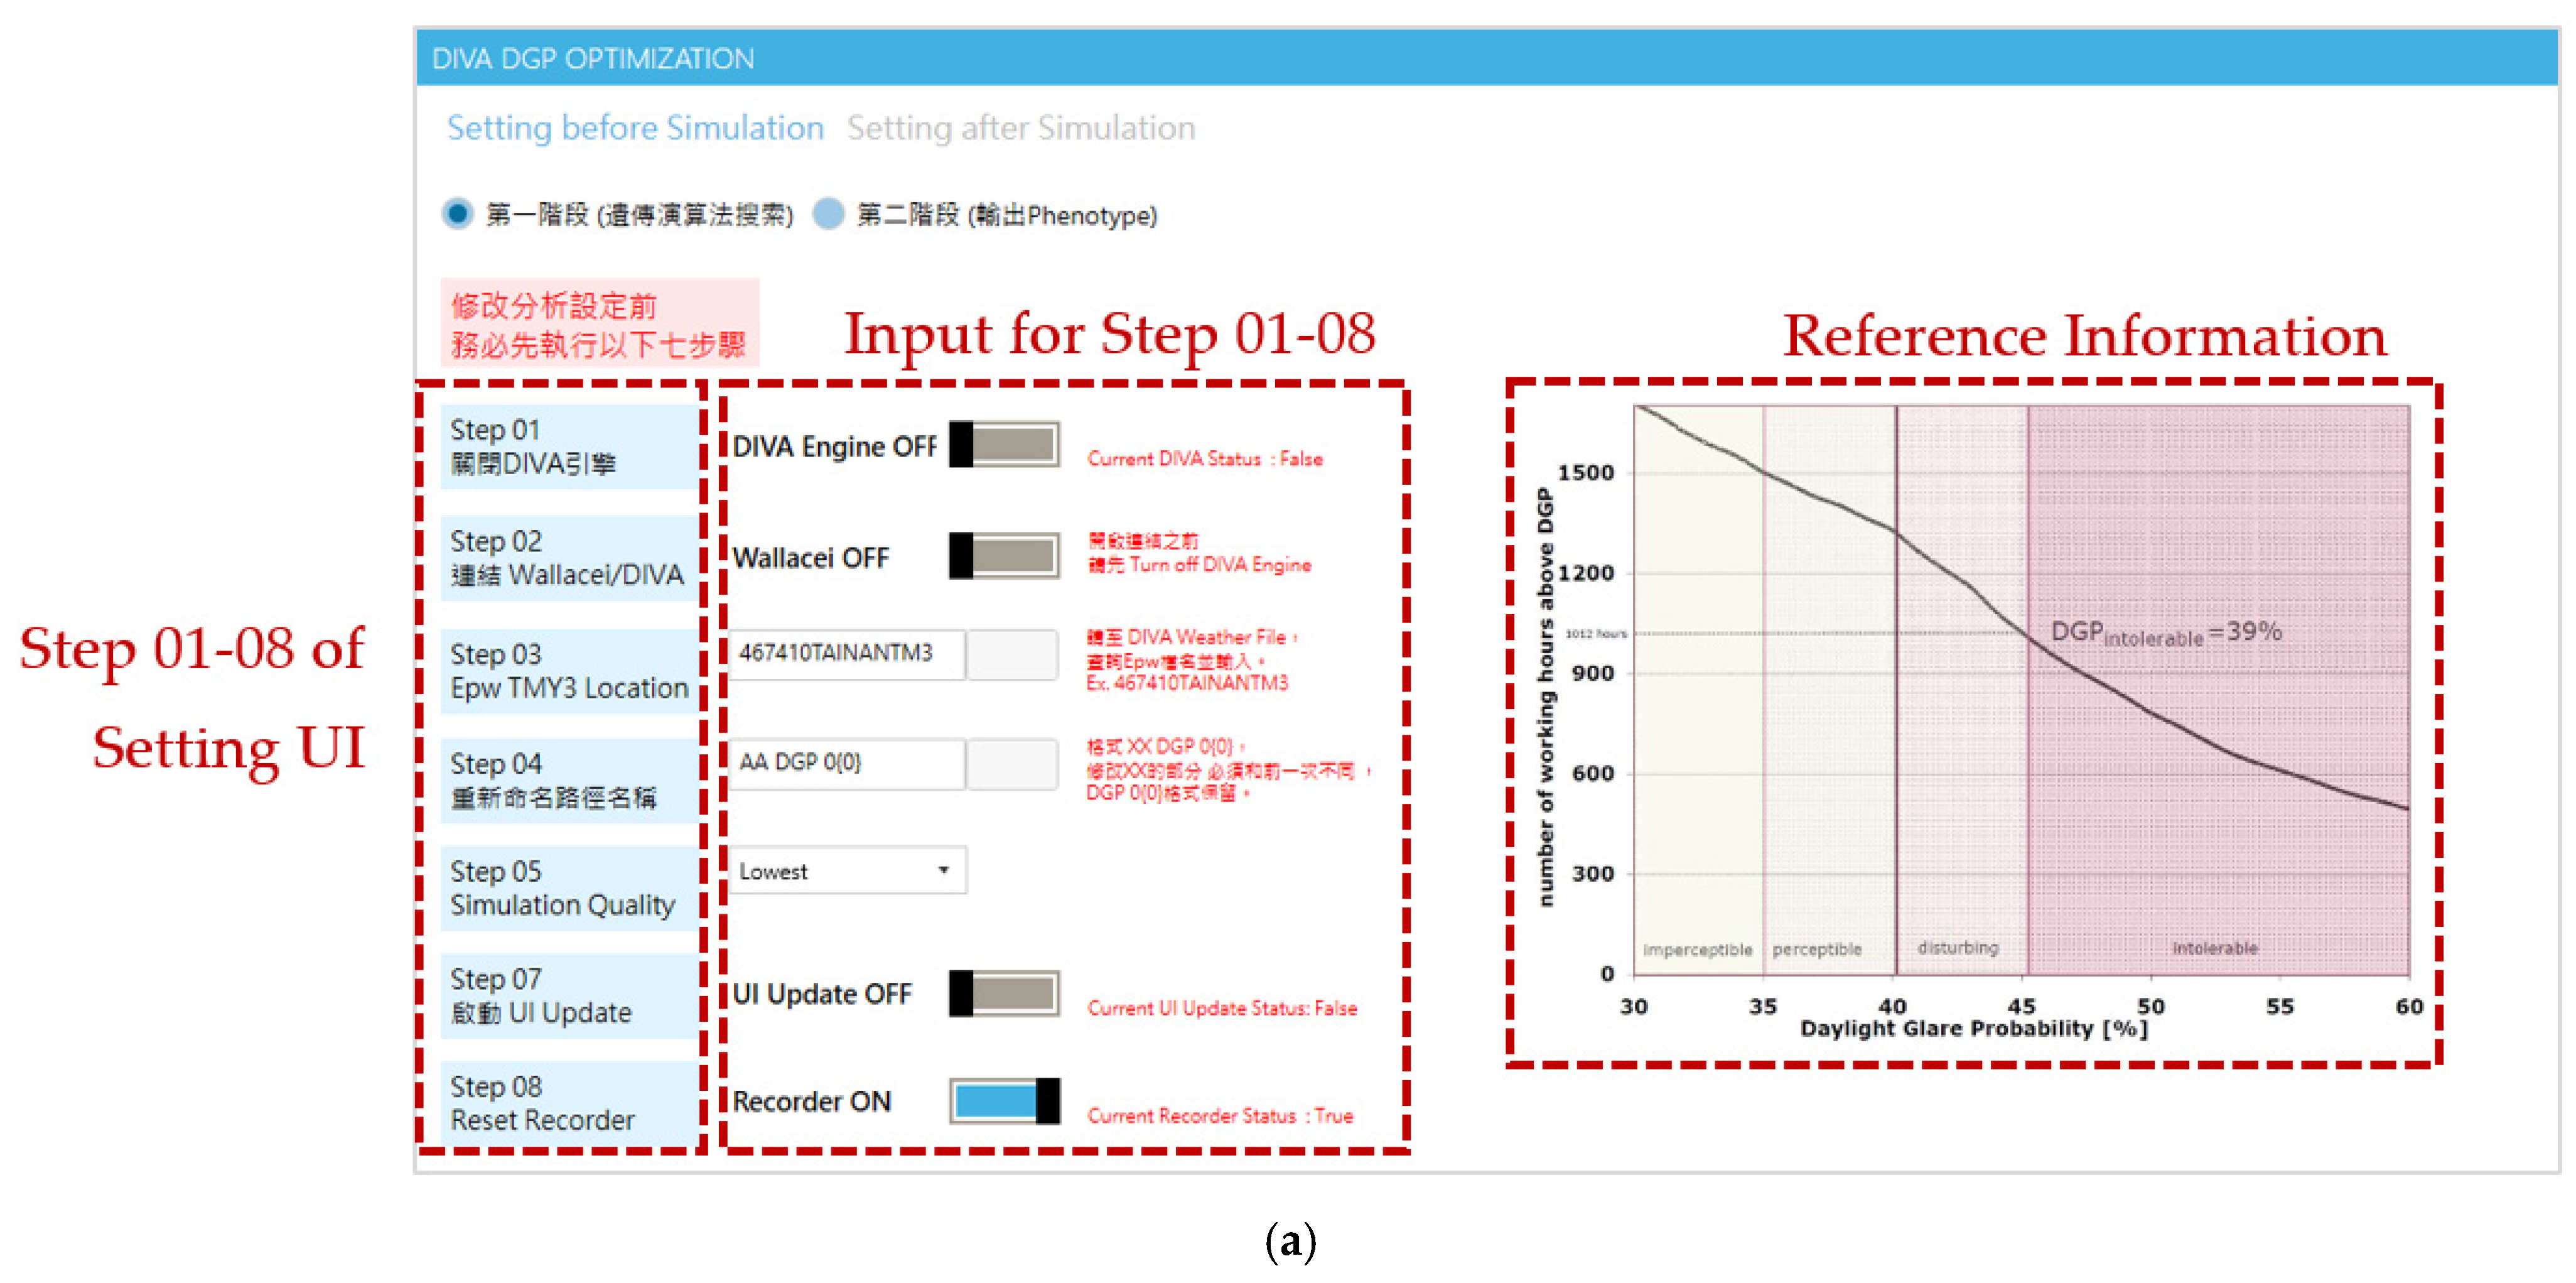
2.1.3. Glare Analysis

In terms of visual comfort, this manuscript adopted Daylight Glare Probability (DGP) as a performance indicator of avoiding daylight glare. Proposed by Wienold and Christoffesen in 2006, DGP considers the distance between the viewpoint and daylight source and the view angle, similar to the evaluation concept of luminance. DGP represents the probability of a person to be disturbed by glare and was developed from subjective user assessment [43,44]. According to DGP classification by Wienold, the glare evaluation is divided into four categories: intolerable glare (DGP > 45%), annoying glare (45% > DGP > 40%), perceivable glare (40% > DGP > 35%), and imperceptible glare (DGP < 35%). Therefore, the value of DGP at a given viewpoint in the objective function would be as small as possible. We calculated the DGP in the framework by using DIVA.

2.1.4. View Analysis

The openness of vision from indoor to outdoor affects the comfort and production efficiency of occupants [12]. When designing a façade and shading devices, many studies considered view as one of the main objectives in their building design process [45,46,47,48]. To evaluate openness of vision, this manuscript adopted the 3D Isovist method, which was developed by the DeCodingSpaces team as an extension of principles for constructing the 2D isovist [49] to the third dimension [50]. The named Isovist3D component in the DeCodingSpaces tool was used to calculate vision performance. According to a given preferred view, numerous rays were emitted from the observation point, and we analyzed the ratio of the penetrating rays to the total rays. In the optimization process, the objective function is to maximize the visual ratio.

2.2. Design Decision Support Tool

Based on the BPO framework, this study then adopted Human UI, a plugin of UI development tool in Grasshopper, to develop a design decision support tool (DDS tool) [51]. The miscellaneous setting and adjustment of performance simulation parameters in the BPO framework were arranged in steps and established in a clear operation interface. Therefore, designers without related skills would not have to struggle with complex Grasshopper operations and can perform the BPO process in a more concise and friendly setting.
The BPO DDS tools developed by this research institute mainly include four kinds of performance analysis (Daylighting, Solar Radiance, Glare, and View Analysis). Two main parts in the DDS tool are developed in this manuscript, simulation and visualization. According to different performance simulations, the two main UI are the Simulation Setting UI and the Visualization Setting UI. In order to make the UI accepted and easy to use by the participants in the test, this research initially designed the UI in Mandarin. It can be programmed to any language according to needs in the future.

2.2.1. Simulation Setting UI

Figure 2 shows the simulation setting UI based on DGP performance. The setting follows the following steps: the switch of simulation engine, connection to optimization engine Wallacei, weather data selection, analysis file name, and simulation quality setting.
Furthermore, custom simulation settings that users can adjust to conform with their design requirements, such as settings similar to viewpoint position and simulation time in DGP simulation (Figure 3). As the figure shows, each setting contains instructions and detailed remarks step by step.

2.2.2. Visualization Setting UI

According to investigations of users, they emphasized the importance of analysis visualization [21,24,52]. Describing a spatial performance in numbers is often considered insufficiently specific and intuitive. Compared with numbers, architects and designers tend to express or compare different alternatives with “visualized drawings”.
Figure 3 shows the visualization setting UI using Daylighting performance as an example. This UI contains various custom visualization options, e.g., legend color, graphic style, display mode, etc. Designers can display different daylight indicators (e.g., sDA/ASE) or different optimal solutions at the same time to support their decision-making.

2.3. DDS Tool Testing

To test the practical feasibility of DDS Tools developed for multi-objective BPO, a total of six designers participated in this test. All participants had experience in using performance simulation software in the past but no experience in parametric modeling or using optimized algorithms. The participants were introduced to the concept of optimization and the BPO framework, and a series of training regarding using the proposed tools and process was conducted. Each participant was then asked to select an enterprise to design the building facade of the corporate headquarters. During the design process, the environmental performance needs to be evaluated and design optimization achieved through the proposed BPO framework and DDS tool. The information on participants and their selected enterprises is shown in Table 3. This test was carried out on the desktop configuration with an Intel(R) Core (TM) i5-8500 CPU @ 3.00 GHz and 8 GB RAM.

3. Results

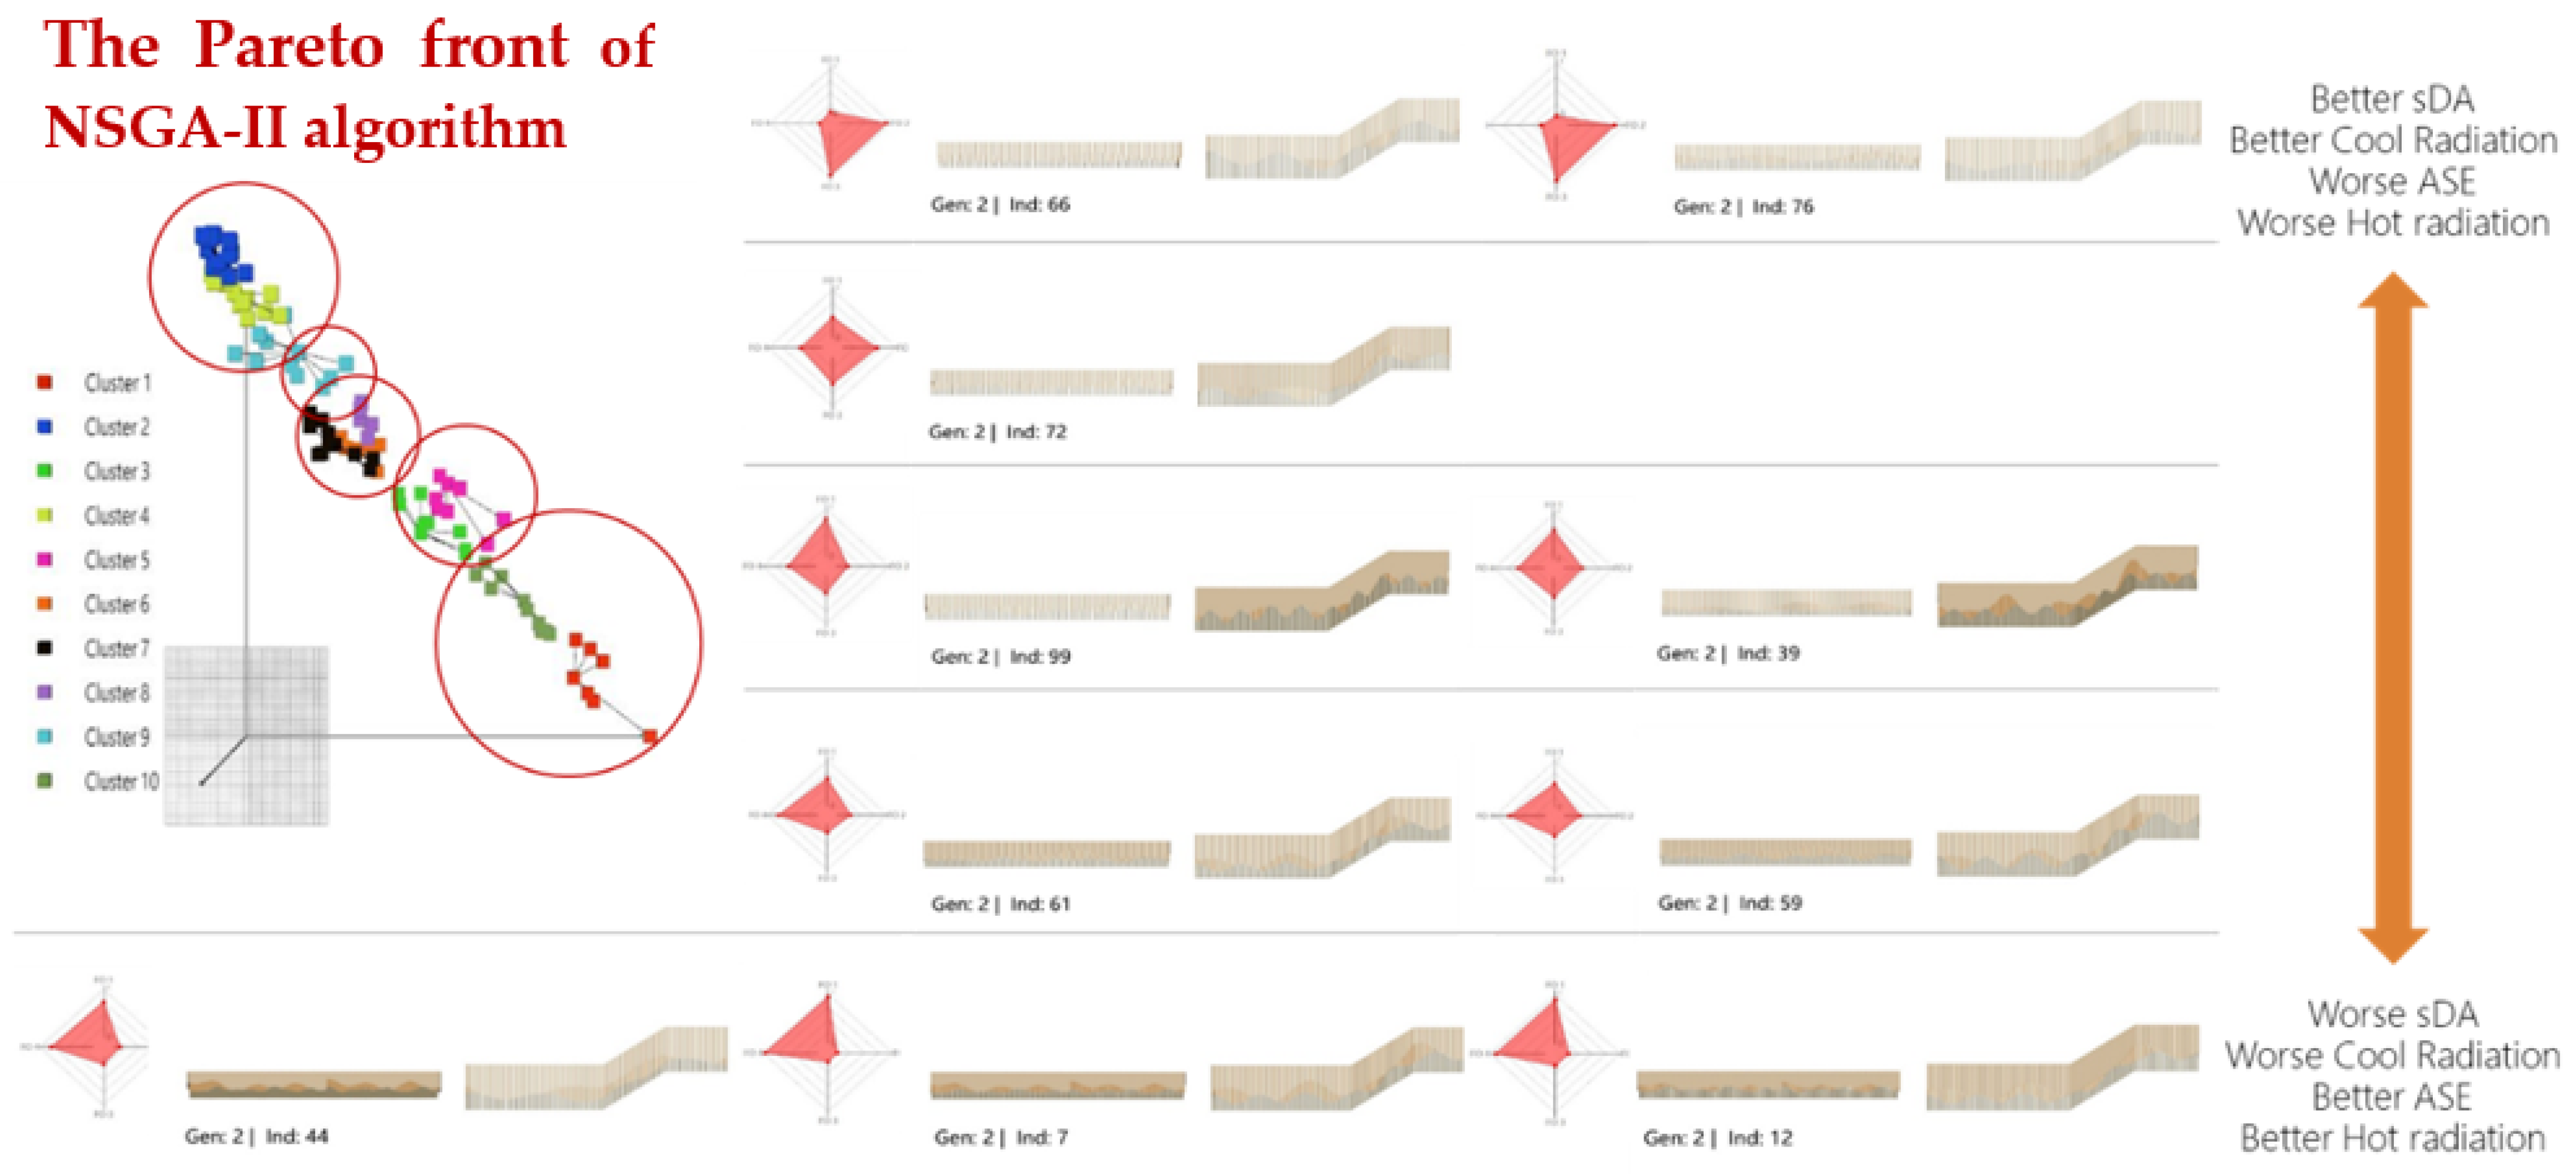
3.1. Façade Optimization

3.1.1. Participant A

Participant A designed the corporate headquarters for a Chinese food enterprise. The concept of the facade design was derived from the rolling mountains of an ink painting. The façade is composed of rods, and the depth of the mountain is made through different rod thicknesses. The edge of the mountain is established through two functions, as shown in Figure 4.
In this design, Participant A primarily considered daylighting and solar radiation performance and had four design optimization objectives: maximizing sDA, minimizing ASE, maximizing average radiation in the cool season, and minimizing average radiation in the hot season. A comparison of the radiation and daylight performance of different optimal solutions is shown in Figure 5, while Figure 6 shows the final design results.

3.1.2. Participant C

Participant C designed the corporate headquarters for a drinking water enterprise. The concept of the facade design is derived from ocean waves. The various possibilities of façade design according to ocean waves are shown in Figure 7.
This design has four design optimization objectives: maximizing sDA of the office, minimizing sDA of the co-lab space, minimizing ASE, and minimizing average radiation in the hot season. Figure 8 shows a comparison of different optimal solutions, while Figure 9 shows the final design decision.
The Diamond Fitness Chart in Figure 8 analyses the fitness values of a single solution. The aim is for the user to better understand how a single solution performs by comparing the fitness values and ranking for each of its fitness objectives.

3.2. Evaluation of BPO Framework and DDS Tool

Based on the demonstration of the participants, the results can be confirmed that the framework and DDS tools developed can enable designers to quickly get started, complete performance evaluations, and make decisions regarding optimal solutions. According to participants’ feedback, they all agreed that the proposed DDS tool was a great help. Through the DDS Tool, they could quickly understand the performance of different design solutions, compare design solutions, and make decisions, all of which would have been difficult without the tool. In particular, the participants emphasized that the visualization of the results and the charts provided by the DDS tool convinced them or others to choose a design with better performance.
However, most participants also mentioned that the issues to be considered in the early design process are so complex that they exceed focus on just the optimization of the physical environment. Therefore, even if the complexity of BPO is simplified, the implementation of BPO in such a compact process as early design is still considered to be quite troublesome. For example, the necessary parameterization of design in the BPO process is considered to have a high threshold as an unfamiliar modeling method for architects and designers. Therefore, despite their agreement that optimization is helpful for design and building performance, most participants prefer to use past cases of the case simulation method because the design parameter definition process is too time-consuming, difficult, and rarely used in design practice. These observations illustrate the fundamental limitations of BPO.

4. Discussion

BPS software can be roughly classified into a single performance analysis or comprehensive analysis. Single-purpose BPS software such as Lighting simulation software (e.g., DIALux, Radiance, Daysim, etc.); energy simulation software (e.g., EnergyPLUS, DOE-2, Equest, etc.); wind field simulation software (e.g., ANSYS Fluent, Phoenix, Comsol, Autodesk CFD, FlowDesigner, etc); and comprehensive simulation software, e.g., Cove.tool, ClimateStudio, and so on. Among them, Cove.tool is similar to the DDS Tool in this study. Although Cove.tool was defined as the top toolkit in all design stages [53], it requires payment and does not perform dynamic analysis. The software limitations of Cove.tool, demanding additional calculations such as the energy consumption portion related to air filters pressure drop and UVGI devices [54,55]. In order to understand other potential solutions (e.g., air pollution), other software such as Rhino [56] plus Grasshopper’s [57] Ladybug plugin [58] must be used additionally [54]. Based on Rhinoceros, this research uses Grasshopper for simulation and UI connection tools. The BPO DDS tools developed by this research makes the simulation process and the visualization of the results more flexible and can be adjusted according to each design case.

5. Conclusions

To help designers consider the environmental performance of a building during the design process, this manuscript has proposed a BPO framework and DDS tool. The BPO framework contains the multiple evaluation factors of daylighting, solar radiation, glare, view, and the optimization algorithm for high-performance façade design. The DDS tool integrates the BPO framework and provides a simplified UI for parameter setting and visualizing results to assist designers with comparing optimal solutions. Six designers participated and tested the DDS tool through a façade design of a headquarters building.
The results show that all six designers were able to start in a short time and used the DDS tools to execute the BPO framework. The participants successfully obtained the optimal façade solutions and compared the performance through visualization tools. According to participants, they were able to understand, compare, and make decisions quickly with the DDS tool. This achievement implied the effectiveness of DDS tools for BPO. Although using BPO in the early design process still has some limitations, this study serves as a starting point for developing such design decision support tools to reduce the learning curve for BPO. Such research requires further development if these kinds of DDS tools are to be applied to more practical and complex cases. What can be expected is that as designers become more familiar with parametric modeling methods and can clearly define their optimization goals, the compatibility of BPO methods and architectural design processes is expected to increase significantly. At such time, designers will be more willing to devote themselves to high-performance design challenges by adopting BPO.

Author Contributions

Conceptualization, Y.-S.T. and M.-S.W.; methodology, Y.-S.T. and M.-S.W.; software, M.-S.W.; validation, M.-S.W.; formal analysis, Y.-S.T. and M.-S.W.; investigation, Y.-S.T. and M.-S.W.; resources, Y.-S.T.; data curation, C.-H.L.; writing—original draft preparation, C.-H.L.; writing—review and editing, Y.-S.T. and C.-H.L.; visualization, C.-H.L.; supervision, Y.-S.T.; project administration, Y.-S.T.; and funding acquisition, Y.-S.T. All authors have read and agreed to the published version of the manuscript.

Funding

This research was funded by the National Science and Technology Council, Taiwan (111-2221-E-006-055).

Data Availability Statement

The data presented in this study are available on request from the corresponding author.

Conflicts of Interest

The authors declare no conflict of interest.

References

  1. UN General Assembly. Transforming Our world: The 2030 Agenda for Sustainable Development. 21 October 2015, A/RES/70/1. Available online: https://www.un.org/ga/search/view_doc.asp?symbol=A/RES/70/1&Lang=E (accessed on 2 November 2021).
  2. ASD. SDGBI: Sustainable Development Goals Business Index. Available online: http://asdun.org/?page_id=2729&lang=en# (accessed on 2 November 2021).
  3. ASD. 2020 UN SDGBI List Global. Available online: https://drive.google.com/file/d/11UJBcPioaTFburz3lugKy0A_DudDNB_o/view (accessed on 2 November 2021).
  4. UNEP. Global Status Report: Towards a Zero-Emission, Efficient and Resilient Buildings and Construction Sector. Available online: https://wedocs.unep.org/bitstream/handle/20.500.11822/27140/Global_Status_2018.pdf?sequence=1&isAllowed=y (accessed on 2 November 2021).
  5. Kim, J. Adaptive façade design for the daylighting performance in an office building: The investigation of an opening design strategy with cellular automata. Int. J. Low-Carbon Technol. 2013, 10, 313–320. [Google Scholar] [CrossRef] [Green Version]
  6. Araji, M.T. Balancing Human Visual Comfort and Psychological Wellbeing in Private Offices. Ph.D. Thesis, University of Illinois at Urbana-Champaign, Champaign, IL, USA, 2008. Available online: http://hdl.handle.net/2142/87360 (accessed on 5 May 2022).
  7. Nasrollahi, N.; Shokri, E. Daylight illuminance in urban environments for visual comfort and energy performance. Renew. Sustain. Energy Rev. 2016, 66, 861–874. [Google Scholar] [CrossRef]
  8. Amasyali, K.; El-Gohary, N.M. A review of data-driven building energy consumption prediction studies. Renew. Sustain. Energy Rev. 2018, 81, 1192–1205. [Google Scholar] [CrossRef]
  9. Gadelhak, M.I.A. A Computational Framework for the Optimization of the Environmental Performance of Facades in Early Design Stages. Ph.D. Thesis, Technical University of Munich, München, Germany, 2019. Available online: https://mediatum.ub.tum.de/doc/1481164/1481164.pdf (accessed on 5 May 2022).
  10. Morbitzer, C.A. Towards the Integration of Simulation into the Building Design Process. Ph.D. Thesis, University of Strathclyde, Glasgow, UK, 2003. [Google Scholar]
  11. Ouf, M.; O’Brien, W.; Gunay, B. Optimizing Building Performance using Stochastic Occupant Models. In Proceedings of the ASHRAE Transactions-2019 Winter Conference, Atlanta, GA, USA, 12–16 January 2019; pp. 96–105. [Google Scholar]
  12. Pilechiha, P.; Mahdavinejad, M.; Rahimian, F.P.; Carnemolla, P.; Seyedzadeh, S. Multi-objective optimization framework for designing office windows: Quality of view, daylight and energy efficiency. Appl. Energy 2020, 261, 114356. [Google Scholar] [CrossRef]
  13. Ochoa, C.E.; Aries, M.B.C.; van Loenen, E.J.; Hensen, J.L.M. Considerations on design optimization criteria for windows providing low energy consumption and high visual comfort. Appl. Energy 2012, 95, 238–245. [Google Scholar] [CrossRef] [Green Version]
  14. Vanhoutteghem, L.; Skarning, G.C.J.; Hviid, C.A.; Svendsen, S. Impact of façade window design on energy, daylighting and thermal comfort in nearly zero-energy houses. Energy Build. 2015, 102, 149–156. [Google Scholar] [CrossRef] [Green Version]
  15. Fang, Y.; Cho, S. Design optimization of building geometry and fenestration for daylighting and energy performance. Sol. Energy 2019, 191, 7–18. [Google Scholar] [CrossRef]
  16. Yi, Y.K. Building I multi-objective optimization for daylight and aesthetical perception. Build. Environ. 2019, 156, 178–190. [Google Scholar] [CrossRef]
  17. Chen, N.C.; Tsay, Y.S.; Chiu, W.J. Influence of vertical greening design of building opening on indoor cooling and ventilation. Int. J. Green Energy 2017, 14, 24–32. [Google Scholar] [CrossRef]
  18. Zhang, J.; Liu, N.; Sang, W. A parametric approach for performance optimization of residential building design in Beijing. Build. Simul. 2020, 13, 223–235. [Google Scholar] [CrossRef]
  19. Lin, B.; Chen, H.; Yu, Q.; Zhou, X.; Lv, S.; He, Q.; Li, Z. MOOSAS—A systematic solution for multiple objective building performance optimization in the early design stage. Build. Environ. 2021, 200, 107929. [Google Scholar] [CrossRef]
  20. Lin, S.H.E.; Gerber, D.J. Designing-in performance: A framework for evolutionary energy performance feedback in early stage design. Autom. Constr. 2014, 38, 59–73. [Google Scholar] [CrossRef]
  21. Attia, S.; Hamdy, M.; O’Brien, W.; Carlucci, S. Assessing gaps and needs for integrating building performance optimization tools in net zero energy buildings design. Energy Build. 2013, 60, 110–124. [Google Scholar] [CrossRef] [Green Version]
  22. Touloupaki, E.; Theodosiou, T. Performance simulation integrated in parametric 3D modeling as a method for early stage design optimization—A review. Energies 2017, 10, 637. [Google Scholar] [CrossRef] [Green Version]
  23. Lu, W.; Fung, A.; Peng, Y.; Liang, C.; Rowlinson, S. Cost-benefit analysis of Building Information Modeling implementation in building projects through demystification of time-effort distribution curves. Build. Environ. 2014, 82, 317–327. [Google Scholar] [CrossRef]
  24. Kanters, J.; Horvat, M.; Dubois, M.C. Tools and methods used by architects for solar design. Energy Build. 2014, 68, 721–731. [Google Scholar] [CrossRef]
  25. Evins, R. A review of computational optimization methods applied to sustainable building design. Renew. Sustain. Energy Rev. 2013, 22, 230–245. [Google Scholar] [CrossRef]
  26. Deb, K.; Pratap, A.; Agarwal, S.; Meyarivan, T. A fast and elitist multiobjective genetic algorithm: NSGA-II. IEEE Trans. Evol. Comput. 2002, 6, 182–197. [Google Scholar] [CrossRef] [Green Version]
  27. Zitzler, E.; Laumanns, M.; Thiele, L. SPEA2: Improving the strength pareto evolutionary algorithm. In TIK-Report 103; Swiss Federal Institute of Technology Zurich, Institute for Technical Informatics and Communication Networks: Zurich, Swiss, 2001. [Google Scholar]
  28. Knowles, J.; Nakayama, H. Meta-Modeling in Multiobjective Optimization. In Multiobjective Optimization; Springer: Berlin/Heidelberg, Germany, 2008; pp. 245–284. [Google Scholar] [CrossRef] [Green Version]
  29. Konis, K.; Gamas, A.; Kensek, K. Passive performance and building form: An optimization framework for early-stage design support. Sol. Energy 2016, 125, 161–179. [Google Scholar] [CrossRef]
  30. Chen, K.W.; Janssen, P.; Schlueter, A. Multi-objective ptimization of building form, envelope and cooling system for improved building energy performance. Autom. Constr. 2018, 94, 449–457. [Google Scholar] [CrossRef]
  31. Si, B.; Wang, J.; Yao, X.; Shi, X.; Jin, X.; Zhou, X. Multi-objective optimization design of a complex building based on an artificial neural network and performance evaluation of algorithms. Adv. Eng. Inform. 2019, 40, 93–109. [Google Scholar] [CrossRef]
  32. Hosamo, H.H.; Tingstveit, M.S.; Nielsen, H.K.; Svennevig, P.R.; Svidt, K. Multiobjective optimization of building energy consumption and thermal comfort based on integrated BIM framework with machine learning-NSGA II. Energy Build. 2022, 277, 112479. [Google Scholar] [CrossRef]
  33. Mahmoud, A.H.A.; Elghazi, Y. Parametric-based designs for kinetic facades to optimize daylight performance: Comparing rotation and translation kinetic motion for hexagonal I patterns. Sol. Energy 2016, 125, 111–127. [Google Scholar] [CrossRef]
  34. Doris, C. Solar energy density as a benchmark to improve daylight availability and energy performance in buildings: A single metric for a single-objective optimization. Sol. Energy 2022, 234, 304–318. [Google Scholar] [CrossRef]
  35. Zou, Y.; Zhan, Q.; Xiang, K. A comprehensive method for optimizing the design of a regular architectural space to improve building performance. Energy Rep. 2021, 7, 981–996. [Google Scholar] [CrossRef]
  36. Tabadkani, A.; Roetzel, A.; Li, H.X.; Tsangrassoulis, A. Simulation-based personalized real-time control of adaptive facades in shared office spaces. Autom. Constr. 2022, 138, 104246. [Google Scholar] [CrossRef]
  37. Lee, D.M.; Park, D.Y.; Baek, J.; Karunyasopon, P.; Chang, S. Multi-criteria decision making for adaptive façade optimal design in varied climates: Energy, daylight, occupants’ comfort, and outdoor view analysis. Build. Environ. 2022, 223, 109479. [Google Scholar] [CrossRef]
  38. Hermund, A. Anvendt 3D Modellering og Parametrisk Formgivning. Ph.D. Thesis, Royal Danish Academy, Copenhagen, Danish, 2011. [Google Scholar]
  39. Roudsari, M.S.; Pak, M. Ladybug: A parametric environmental plugin for grasshopper to help designers create an environmentally-conscious design. In Proceeding of BS2013, Chambéry, France, 26–28 August 2013; pp. 3128–3135. [Google Scholar]
  40. Robert McNeel & Associates. Grasshopper: New in Rhino 6. Available online: https://www.rhino3d.com/6/new/grasshopper/ (accessed on 2 November 2021).
  41. Wallicei. An Evolutionary Multi-Objective Optimization and Analytic Engine for Grasshopper 3D. Available online: https://www.wallacei.com/ (accessed on 18 October 2021).
  42. Jakubiec, J.A.; Reinhart, C.F. DIVA 2.0: Integrating daylight and thermal simulations using Rhinoceros 3D, DAYSIM and EnergyPlus. In Proceedings of the Building Simulation 2011, Sydney, Australia, 14–16 November 2011. [Google Scholar]
  43. Wienold, J.; Christoffersen, J. Evaluation methods and development of a new glare prediction model for daylight environments with the use of CCD cameras. Energy Build. 2006, 38, 743–757. [Google Scholar] [CrossRef]
  44. Wienold, J. Dynamic daylight glare evaluation. In Proceedings of the Eleventh International IBPSA Conference, Glasgow, Scotland, 27–30 July 2009; Available online: http://www.ibpsa.org/proceedings/BS2009/BS09_0944_951.pdf (accessed on 5 May 2022).
  45. Konstantzos, I.; Tzempelikos, A.; Chan, Y.C. Experimental and simulation analysis of daylight glare probability in offices with dynamic window shades. Build. Environ. 2015, 87, 244–254. [Google Scholar] [CrossRef]
  46. Tzempelikos, A. The impact of venetian blind geometry and tilt angle on view, direct light transmission and interior illuminance. Sol. Energy 2008, 82, 1172–1191. [Google Scholar] [CrossRef]
  47. Kim, J.T.; Kim, G. Advanced External Shading Device to Maximize Visual and View Performance. Indoor Built Environ. 2010, 19, 65–72. [Google Scholar] [CrossRef]
  48. Sherif, A.; Sabry, H.; Wagdy, A.; Mashaly, I.; Arafa, R. Shaping the slats of hospital patient room window blinds for daylighting and external view under desert clear skies. Sol. Energy 2016, 133, 1–13. [Google Scholar] [CrossRef]
  49. Benedikt, M.L. To Take Hold of Space: Isovists and Isovist Fields. Environ. Plan. B Urban. Anal. City Sci. 1979, 6, 47–65. [Google Scholar] [CrossRef]
  50. Bielik, M. Tutorial | 2D and 3D Isovists for Visibility Analysis. September 2019. Available online: https://toolbox.decodingspaces.net/tutorial-2d-and-3d-isovists-for-visibility-analysis/ (accessed on 2 November 2021).
  51. Heumann, A.; Syp, M.; Holland, N.; Ringley, B. Humanui. Available online: https://www.food4rhino.com/en/app/human-ui (accessed on 18 October 2021).
  52. Fernandez-Antolin, M.M.; del-Río, J.M.; del Ama Gonzalo, F.; Gonzalez-Lezcano, R.A. The Relationship between the Use of Building Performance Simulation Tools by Recent Graduate Architects and the Deficiencies in Architectural Education. Energies 2020, 13, 1134. [Google Scholar] [CrossRef] [Green Version]
  53. Forouzandeh, N.; Tahsildoost, M.; Zomorodian, Z.S. A review of web-based building energy analysis applications. J. Clean. Prod. 2021, 305, 127251. [Google Scholar] [CrossRef]
  54. Cortiços, N.D.; Duarte, C.C. COVID-19: The impact in US high-rise office buildings energy efficiency. Energy Build. 2021, 249, 111180. [Google Scholar] [CrossRef] [PubMed]
  55. Cortiços, N.D.; Duarte, C.C. Energy efficiency in large office buildings post-COVID-19 in Europe’s top five economies. Energy Sustain. Dev. 2022, 68, 410–424. [Google Scholar] [CrossRef]
  56. Bureau of Labor Statistics. (BLS, 2020) (30 June 2020). Share of US Workers by Telework Status during the COVID-19 Pandemic as of 2020, by Telework Status and Industry [Graph]. In Statista. Available online: https://www.statista.com/statistics/1169890/share-workers-working-from-home-covid-19-status-industry-us/ (accessed on 17 November 2020).
  57. American Society of Heating, Refrigerating and Air-Conditioning Engineers (ASHRAE, 2020–2021) “Offers COVID-19 Building Readiness/Reopening Guidance”, 10 May 2020. Available online: https://www.ashrae.org/about/news/2020/ashrae-offers-covid-19-building-readiness-reopening-guidance (accessed on 15 December 2020).
  58. American Society of Heating, Refrigerating and Air-Conditioning Engineers (ASHRAE, 2020–2022), «ASHRAE Epidemic Task Force», Chapter Sec. Mitigation Strategies, and Sec. Calculation Approach to Increase MERV in an AHU, Outdoor Air, pp. 79, 2020. Available online: https://www.ashrae.org/file%20library/technical%20resources/covid-19/ashrae-building-readiness.pdf (accessed on 5 May 2022).
Figure 1. The BPO framework for a building façade design.
Buildings 12 02116 g001
Figure 2. Simulation setting UI for DGP. (a) General simulation setting UI. (b) Custom simulation setting UI.
Buildings 12 02116 g002aBuildings 12 02116 g002b
Figure 3. Visualization setting UI for daylight.
Buildings 12 02116 g003
Figure 4. The concept of façade design (Participant A).
Buildings 12 02116 g004
Figure 5. The comparison of different optimal solutions on radiation performance.
Buildings 12 02116 g005
Figure 6. The final decision façade of headquarters (Participant A).
Buildings 12 02116 g006
Figure 7. The possibility of façade design (Participant C).
Buildings 12 02116 g007
Figure 8. The comparison of different optimal solutions (Participant C).
Buildings 12 02116 g008
Figure 9. The final decision façade of headquarters (Participant C).
Buildings 12 02116 g009
Table 1. Problems of performing BPS in the design stages [10].
Design StagesDesign AspectsModel CreationPerformance Prediction Analysis
Program of
Requirements/Outline
orientation,
heavy/light buildings, space usage,
heat recovery systems, etc.
typical users identified (architects) find it difficult to use advanced building simulationperformance prediction difficult for architects
Preliminary/Scheme
design
glazing area/type,
air change rate,
lighting strategy
does not cause major difficulties to simulation expert but time consumingimportant to have in-depth understanding of reasons behind building performance
Final/Detailed
design
Different heating/cooling systems;
different heating/cooling control strategies;
different ventilation strategies
more challenging than scheme design, but possible for simulation expertdepending on simulation study ranges from easy to complex, tedious and time consuming
Table 2. Research on the combination of parametric design and optimization.
ReferenceEvaluation ObjectSoftwareConclusion
[29]Daylighting,
Energy
  • Modeling and parametric interface: Rhino-Grasshopper
  • Simulation: DIVA,
  • Optimization: Octopus (SPEA-II, HypE)
  • The PPOF is capable of generating design solutions that outperform an ASHRAE 90.1-compliant reference building of equal floor area.
[30]Daylighting,
Energy
  • Modeling and parametric interface: Rhino-Grasshopper
  • Simulation: Energy plus, Diva Python
  • Optimization: NSGA-II
  • While the proposed optimization is useful for supporting the design of envelope and cooling system, prior knowledge of cooling systems is required for its application in the design process.
[16]Daylighting,
  • Modeling and parametric interface: Rhino-Grasshopper
  • Simulation: Not mentioned
  • Optimization: NSGA-II
  • Proposes a design process that can satisfy two different types of building performance, that is, the qualitative and quantitative performances of the building.
[31]Energy,
Thermal comfort
  • Modeling and parametric interface: Not mentioned
  • Simulation: Energy plus
  • Optimization: modeFRONTIER
  • (NSGA-II/MOPSO/MOSA/ES)
  • The best design solution was obtained by NSGA-II.
  • The BPO technique works effectively for complex building design problems by integrating with ANN modeling and choosing an appropriate optimization algorithm.
[32]Energy,
Thermal comfort
  • Modeling and parametric interface: Revit, Dynamo
  • Simulation: Machine learning
  • Optimization: Optimo (NSGA-II)
  • The GLSSVM-NSGAII model is very efficient for multi-objective optimization in reducing building energy consumption and enhancing interior thermal comfort.
[33]Daylighting,
Energy
  • Modeling and parametric interface: Rhino-Grasshopper
  • Simulation: Diva for Rhino
  • Optimization: Not mentioned
  • Rotational motion could perform well around the year as evinced by daylighting simulations as they helped block all the sunrays all the time.
  • Providing a toolkit for designers to apply and evaluate kinetic motions for effective daylight control in the early design stage.
[34]Daylighting,
Energy
  • Modeling and parametric interface: Rhino-Grasshopper
  • Simulation: Radiance, EnergyPlus
  • Optimization: Galapagos
  • The evolutionary algorithms are slow, especially when complicated set-ups requiring a long time to solve a single iteration come into play.
  • Proposes the use of a single metric, SED, as a benchmark to evaluate the dual performance (daylighting plus energy) of PS used in office buildings.
[35]Thermal comfort,
Visual comfort,
Energy
  • Modeling and parametric interface: Rhino-Grasshopper
  • Simulation: Radiance, EnergyPlus
  • Optimization: Python-Geatpy, TensorFlow (NSGA-II)
  • The goal of reducing building energy demand and improving indoor comfort can be achieved by optimizing building design.
  • After optimization, compared to the reference solutions, the objectives of the integrated solutions in the three cases have been improved by 24.6%, 18.7% and 14.2% on average.
[36]Daylighting,
Visual comfort,
Energy
  • Modeling and parametric interface: Rhino-Grasshopper
  • Simulation: Ladtbug, EnergyPlus
  • Optimization: Python (NSGA-II)
  • Both the design and operational systems of such facades should be evaluated by building performance simulations at design stages.
[37]Daylighting,
Visual comfort,
Energy
  • Modeling and parametric interface: Rhino-Grasshopper
  • Simulation: ClimateStudio for Grasshopper
  • Optimization: Python (sensitivity and correlation analysis)
  • The best design solutions, which were not affected by the changes in DMs’ viewpoints, identified both generalized improvements and drawbacks compared to the objective mean values.
Table 3. The information of participants and their selected enterprises.
ParticipantEnterpriseProductCityDesign Concept
ADin Tai FungChinese FoodTaichungMountain in ink painting
BAgodaHotel Booking ServiceKuala LumpurBrand characters
CTAIYENDrinking WaterHualienOcean wave
DSpotifyMusic Streaming ServiceTaipeiMusic rhythm
ELivFemale BicycleTaichungBrand logo
FLegoBlocksTainanLego block
Publisher’s Note: MDPI stays neutral with regard to jurisdictional claims in published maps and institutional affiliations.

