Article

Potential of ALOS2 Polarimetric Imagery to Support Management of Poplar Plantations in Northern Italy

1
Department for Innovation in Biological, Agro-Food and Forest Systems (DIBAF), Tuscia University, Via S. Camillo de Lellis, Snc, I-01100 Viterbo, Italy
2
Council for Agricultural Research and Economics (CREA), Research Centre for Forestry and Wood, Via Valle della Quistione, 27, I-00166 Rome, Italy
3
Council for Agricultural Research and Economics (CREA), Research Centre for Forestry and Wood, Viale Santa Margherita, 80, I-52100 Arezzo, Italy
*
Author to whom correspondence should be addressed.
Remote Sens. 2022, 14(20), 5202; https://doi.org/10.3390/rs14205202
Submission received: 15 September 2022 / Revised: 11 October 2022 / Accepted: 15 October 2022 / Published: 18 October 2022
(This article belongs to the Special Issue Application of Remote Sensing in Agroforestry II)

Abstract

:
Poplar is one of the most widespread fast-growing forest species. In Northern Italy, plantations are characterized by large interannual fluctuations, requiring frequent monitoring to inform on wood supply and to manage the stands. The use of radar satellite data is proving useful for forest monitoring, being weather independent and sensitive to the changes in forest canopy structure, but it has been scarcely tested in the case of poplar. Here, L-band ALOS2 (Advanced Land Observing Satellite-2) dual-pol data were tested to detect clear-cut plantations in consecutive years. ALOS2 quad-pol data were used to discriminate among different age classes, a much complex task than detecting poplar plantations extent. Results from different machine learning algorithms indicate that with dual-pol data, poplar forest can be discriminated from clear-cut areas with 80% overall accuracy, similar to what is usually obtained with optical data. With quad-pol data, four age classes were classified with moderate overall accuracy (73%) based on polarimetric decompositions, three 3 age classes with higher accuracy (87%) based on HV band. Sources of error are represented by poplar areas of intermediate age when stems, branches and leaves were not developed enough to detect by scattering mechanisms. This study demonstrates the feasibility of monitoring poplar plantations with satellite radar, which represents a growing source of information thanks to already-planned future satellite missions.

Graphical Abstract

1. Introduction

Poplar cultivation in Italy is the most relevant source of wood for industrial use. The extent of cultivated lands is insignificant compared to forest land, representing only 1.3% of the national territory. Nevertheless, poplar plantations constitute the most important segment of industrial timber production for plywood, packaging, pulp and paper and wood-based panels industries, providing more than 50% of the industrial hardwood domestic supply [1,2,3].
This wood production is thus very relevant, especially with respect to the Italian furniture industry. Over one million cubic meters of industrial roundwood are processed annually and used in Italy for the production of high-quality plywood [4,5]. Conventional poplar cultivations in Northern Italy are found in floodplains and characterized by intensively managed monospecific plantations, with short rotations cycles (9–12 years) and around 300 trees per hectare [2,6]. The Italian poplar stands amount for about 46,000 hectares and are mainly located in the Po River valley plain (Northern Italy) [7]. Poplar cultivation has a lower energy demand than other agriculture crops, and it is important for climate change adaptation and mitigation thanks to poplars’ high capacity to absorb CO2 and accumulate it in wood [8].
Poplar stands are relevant elements of the Italian ecological network, providing microhabitats [9] and being used as windbreaks. Poplars have a role in both soil protection and water regulation. Poplars reduce erosion of riparian soils during flood events and are useful in phytoremediation [10]. Certification of the sustainable management of wood plantations according to Forest Stewardship Council® or the Programme for the Endorsement of Forest Certification Schemes has been carried out in Italy for more than a decade and involves about 15% of specialized poplar cultivation. Poplar is one of the most widespread fast-growing tree species used for forest plantations. The fast growth, short rotation and dependency on the timber price market cause large interannual fluctuations in poplar extent and distribution [7]. Therefore, poplar plantations monitoring requires a frequent update of information, which is not feasible for the National Forest Inventories due to their low periodicity [5]. This frequent monitoring, which should include the plantation extent and the age classes, can be carried out using remote sensing tools, given the increased availability of satellite imagery that provide frequent data covering large areas.
Multispectral imagery, collected from either satellite or airborne platforms, is the main data source used in monitoring poplar plantations with remote sensing data. Ref. [1] found that the Copernicus satellite Sentinel-2, with a spatial resolution of 10 m, is well suited to identify the canopy cover in poplar stands from 5 to 10 years old. Ref. [7] conducted a large-scale assessment of poplar plantations based on tessellation stratified sampling on very high spatial resolution orthophotos (50 cm), identifying the different age classes based on canopy cover. Ref. [5] developed a deep learning approach for mapping poplar plantations using the Sentinel-2 time series and compared the results obtained with a fully connected neural network with those obtained with a traditional logistic regression. Ref. [11] recently mapped poplar plantations in France based on the Sentinel 2 time series. Ref. [12] classified different crown cover classes of poplar stands using texture features and vegetation indices derived by very high spatial resolution Ikonos and Quickbird data.
Much less research has been carried out using Synthetic Aperture Radar (SAR) satellite data in poplar monitoring, with an example provided by [13], who identified poplar plantations using Sentinel 2 time series and then used Sentinel 1 to distinguish between two age classes. However, SAR data are extensively used in vegetation classification, including in natural areas, forest plantations and agriculture areas. SAR can be used either alone [14,15,16] or joined to optical data to increase the accuracy of the results [17,18,19,20]. The advantage of using SAR is first related to its ability to acquire information in any weather condition, thus even in presence of cloud cover when optical data are useless. With the notable growth of available SAR missions, data access has become easier, and multiple advancements in SAR methodologies and newly developed applications have occurred in recent years [21].
The ALOS-2 Japanese satellite has an on-board PALSAR-2 sensor, a Synthetic Aperture Radar (SAR), which emits microwave and receives the reflection from the ground to acquire information. Since it does not need sources of light, the SAR provides images regardless day or night. The frequency is L-band, which is less affected by clouds and rain. In addition, it can reach to the ground, partially penetrating through vegetation to obtain information regarding the vegetation and ground surface. The ALOS-2/PALSAR-2 mission began in 2014; it has different acquisition modes each with specific polarization, incidence angle, resolution and swat.
Imaging radars can have different polarization configurations, and data can be acquired in single-, double- or full-polarization modes. Polarization refers to the direction of travel of an electromagnetic wave vector: vertical, horizontal or circular. A single-polarization SAR system transmits and receives a single polarization, resulting in a horizontal-horizontal (HH) or vertical-vertical (VV) imagery. A dual-polarization system might transmit in one polarization but receive in two, resulting in either HH and HV or VH and VV imagery. A quad-polarization system would alternate between transmitting H and V waves and would receive both H and V, resulting in HH, HV, VH and VV imagery and increased information content. According to different sensor architectures, SAR systems can thus acquire information in different polarimetric modes, providing information of the electrical and geometric properties of the observed surface in forests. The tree leaves and branches are randomly oriented geometric structures that scatter and depolarize the signal that bounces multiple times among them. Together with the other SAR sensor characteristics, such as system frequency (directly related to the penetrating capability) and spatial sampling (related to spatial resolution on the ground), the amount of polarimetric information content can have impacts on the accuracy of the analyses. Previous research on SAR has indicated that quad-polarization data outperforms dual-polarization data in classification tasks [22].
The availability of different SAR polarizations enables the application of polarimetric decomposition techniques, which provide a measure of the relative contributions of backscatter from different scattering mechanisms. Therefore, the targets’ structure information can be deduced as the sum of all scattering components. Typically, surface scattering relates to rough surfaces (e.g., water bodies, bare soil), double-bounce scattering corresponds to dihedral corners (e.g., ground-wall corners), volume scattering relates to random oriented dipoles (e.g., tree canopies) and helix scattering is associated with man-made structures [23]. Specifically, the Freeman-Durden [24] decomposition models the covariance matrix as the contribution of three scattering mechanisms: The resulting three bands represent the power scattered by the double-bounce, by the volume and by the surface-like scattering components, respectively. This decomposition can be successfully applied to SAR observations under the reflection symmetry assumption. However, areas exist in a SAR image where this condition does not hold. Reference [25] proposed an additional term corresponding to non-reflection symmetric case to account for the co-pol and the cross-pol correlations which generally appear in heterogeneous areas such as complicated shape targets. The Yamaguchi decomposition [25] models the covariance matrix as volume, double-bounce, surface and helix scatter components.
Different studies have successfully employed polarimetric data from various SAR sensors for classification: When available, these SAR data usually improve the target recognition. For instance, Ref. [26] used polarimetric decomposition techniques applied to ALOS data for land use land cover mapping, Ref. [27] explored decomposition methods of C-band SAR data in forest density classification, Ref. [28] used L-band decomposition SAR data to assess the tree growth of industrial forest plantations and Ref. [29] used SAR decomposition methods to classify wetland vegetation. The features extracted from remote sensing imagery, either SAR or multispectral data, can be used as input in classification models, such as those to classify poplar stands and detect age classes. In forest studies, advancements in statistical classification models include decision trees and machine learning algorithms, such as Classification and Regression Tree (CART; [30]), Random Forests (RF; [31]) and Support Vector Machine (SVM; [32]). All of these algorithms have been demonstrated in previous forest research to improve the classification or regression accuracy and, often, to outperform traditional classification approaches [33,34,35,36,37].
Based on this background, the general aim of this research is to test the use of SAR satellite remote sensing polarimetric data to support planning and management activities in the specific case of poplar plantations. Two objectives were selected to demonstrate the utility of SAR satellite images in applied forestry.
The first objective is to detect poplar clear-cut areas (herein, cut areas is synonymous to clear-cut). In Italy, the plantation cut usually occurs in the fall/winter months at the end of the growing season and prior to the next one. Two ALOS2 SAR Fine Beam Dual polarization (HH, HV) images were thus acquired in dates before (15 July 2017) and after (18 June 2018) the cut; dual-pol images were selected considering their frequent availability in archives.
The second objective is to classify the poplar plantations in different age classes. An ALOS2 SAR quad-polarization image dated 4 October 2017 was used. This data type has a larger information content but is less available. Meeting these objectives can result in the production of strategic information for forestry management and planning activities, such as the evaluation of timber productivity and harvesting time, the planning of new plantations setup, the provision of data for carbon accounting and the support to post-damage assessments considering the frequent destructive storms occurring in Northern Italy.

2. Materials and Methods

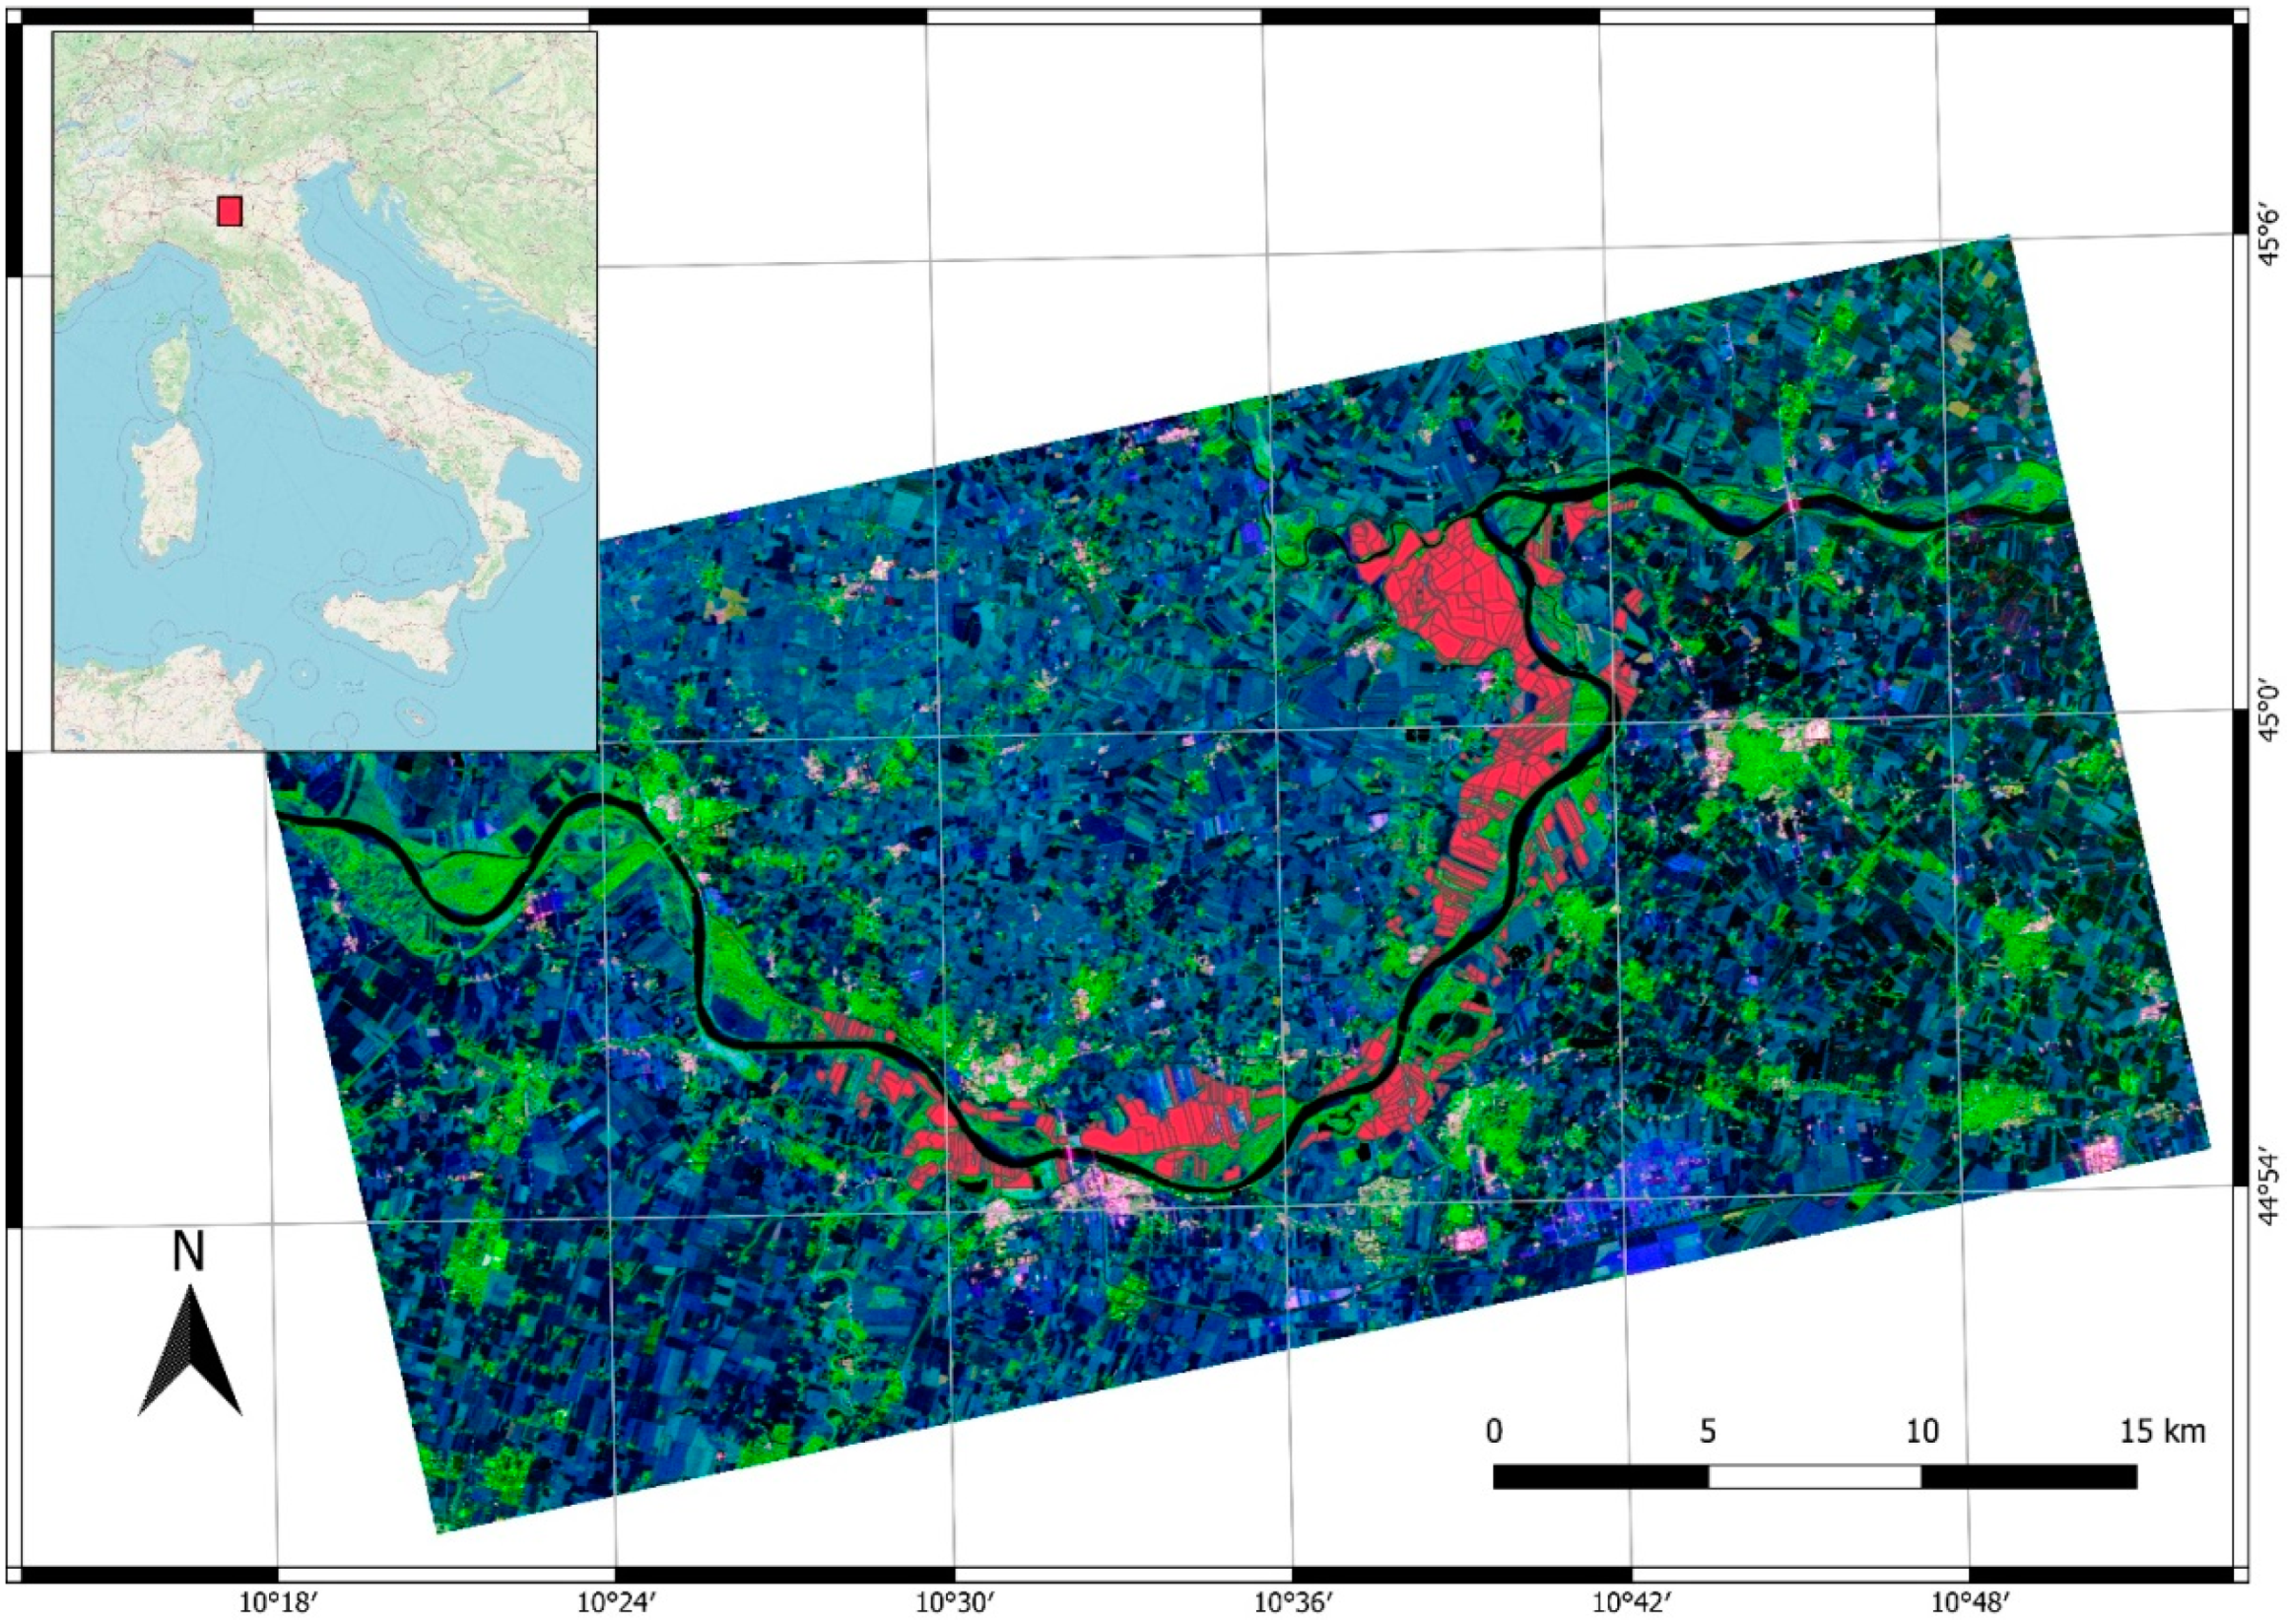
2.1. Study Area and Field Data

The study area is in the lower Po River valley, at the border of the Veneto and Emilia Romagna Italian northern regions, in the Ferrara province. The area is located near Viadana, Mantova (44°55′N; 10°35′E), and hosts hybrid poplar plantations target to plywood production. The plantation density ranges from 200 to 300 trees ha−1, with rotations around 10–12 years. The climate is humid subtropical: Winters are cool and damp, with January mean temperatures ranging between 0 and 5 °C and frequent fog and mist. Summers are hot and humid, with July mean temperatures ranging between 22 and 25 °C. Frequent thunderstorms and sudden hailstorms have the potential to produce large hail, dump large quantities of rain and be highly destructive to agriculture [38].
For this research, poplar plantations have been classified in four age classes, determined by the level of canopy cover, according to [39], by means of photointerpretation of very high-resolution airborne imagery (spatial resolution < 50 cm) available for the years 2014, 2015 and 2016. A subsequent check was carried out to obtain an error-free photointerpretation using Google Maps images available for late summer 2017 and spring 2018 following the methodology applied in [6]. Furthermore, about 3% of the photo-interpreted poplar plantations were selected by means of stratified sampling with proportional allocation and visited on the ground. In this additional ground survey, each tree was enumerated and the diameter at breast height and the tree height were recorded, together with year of plantation, clone type and tree spacing; the age classes were confirmed using tree cores, with no errors detected with respect to the initial class assignment [5,6,7,40]. Before the testing phase, stands having a total area < 0.5 ha and an area/perimeter ratio < 25 m were excluded from the analysis to avoid the inclusion of excessively fragmented areas. A few areas showing internal anomalies in Google Earth imagery in the June 2017–March 2018 period were also excluded as those stands were internally managed with different practices, leading to evident internal heterogeneity in texture and reflectance. A total of 366 stands remained to perform calibration and validation of the classification models (Figure 1). For the first objective, namely the classification of cut areas, all the stands cut in the 2017–2018 period were selected from the ground dataset (N = 28). For the second objective, namely the classification in age classes following the approach of [39] driven by poplar industry requirements, the full ground dataset was used (366 polygons), composed by: Class 1 (1 year old; 46 polygons); Class 2 (2–3 years old; 91 polygons); Class 3 (4–6 years old; 87 polygons); Class 4 (≥7 years old; 139 polygons).

2.2. Remote Sensing Images

The Japanese Space Agency ALOS2 satellite carries an L-band Synthetic Aperture Radar (SAR) which can acquire images in different modes [41]. The dual-polarization (HH and HV) images dated 15 July in 2017 and 18 June in2018 were downloaded as Fine Beam Mode (Single Look Complex) scenes (https://www.eorc.jaxa.jp/ALOS/en/index_e.htm, accessed on 11 October 2022) and processed using the European Space Agency (ESA) Sentinel Application Platform (SNAP).
The processing steps included Calibration, selection of Gamma naught for the analysis, speckle filtering (3 × 3 Frost filter; [42]), SAR simulation to produce the distortions mask and Range Doppler terrain correction using the Shuttle Radar Topography Mission Digital (SRTM) Elevation Model at 1 Arcsec. The final resolution was set equal to 14.5 m; no distortion effects were detected. The ALOS2 decibel values were linearized, and stand-level statistics were extracted from the two polarizations, including minimum, maximum, mean, standard deviation, polarization subtraction (HH − HV) and polarization addition (HH + HV). The ALOS2 quad-pol image, dated 4 October in 2017, was downloaded as Single Look Complex. Calibration was set to produce complex outputs and, subsequently, to produce the coherency T3 matrix. A Refined Lee 7 × 7 polarimetric speckle filter was applied to reduce speckle, and the Freeman-Durden and Yamaguchi decompositions were computed. The Range Doppler terrain correction was applied to the outputs using the 1 Arcsec SRTM digital elevation model, setting final spatial resolution equal to 6 m.
Stand level statistics were extracted including minimum, maximum, mean and standard deviation. For all the remote sensing imagery, only pixels included for >75% inside the areas were extracted and used in the analysis.

2.3. Data Analysis and Classification Algorithms
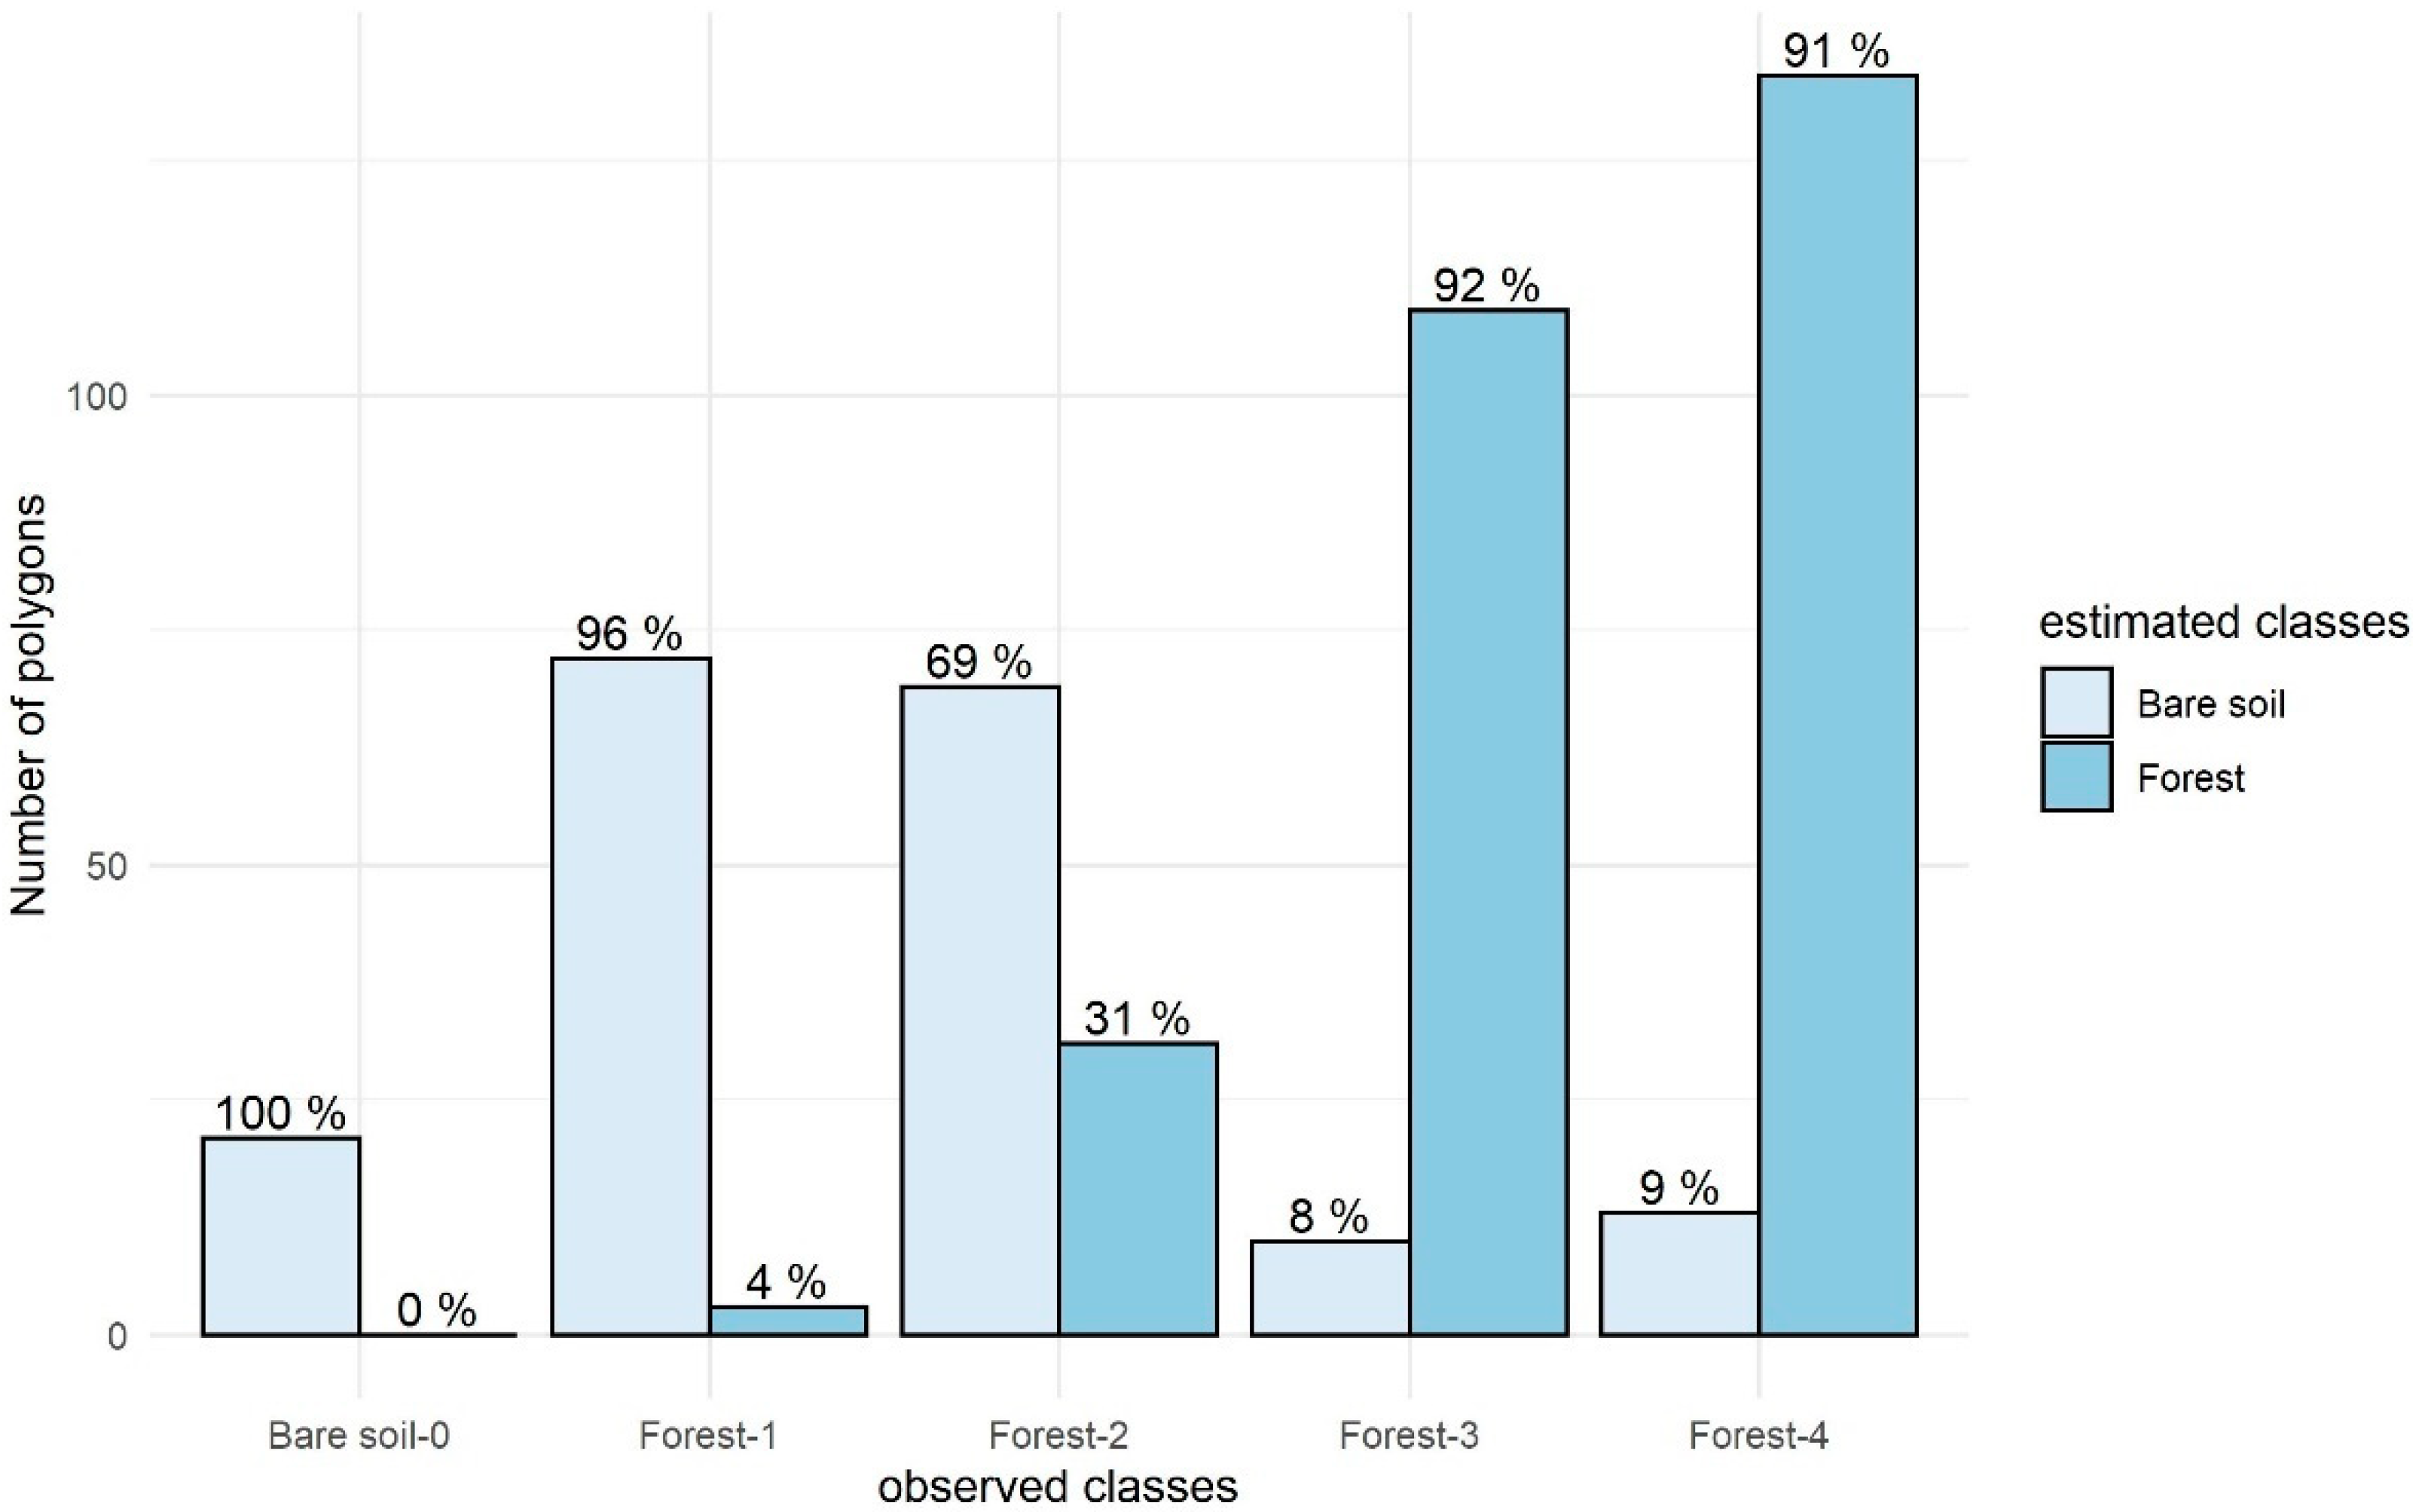
For the objective of poplar cut stands detection, the two ALOS2 dual polarization 2017 and 2018 scenes, before-cut (poplar forest) and after-cut (bare soil/low vegetation), respectively, were used. To generate the ground truth for calibration and validation, pixels were extracted from the 28 stands that, according to field data, resulted as cut during that period. Pixels were extracted from both images to provide the classification algorithm with examples of the poplar forest occurring before the cut, and bare soil/low vegetation occurring after the cut. For each scene, five features were available: the HH, HV, HH-HV, HH + HV polarizations and RFDI index. Four area-based statistics (minimum, maximum, mean and standard deviation) were then computed for each of the five features, resulting in a total of 20 predictors per scene. All computations were performed with the European Space Agency SNAP toolbox and the R software [43]. The CART algorithm, with leave-one-out (LOO) validation procedure, was used to discriminate the poplar forest from the bare soil/low vegetation in a binary classification exercise that exploited the 70% of ground truth for training and 30% for validation.
To detect age classes, the ALOS2 quad-polarization image was used. The following 11 features were available: 4 polarizations (HH, HV, VH, VV), 3 Freeman-Durden decompositions and 4 Yamaguchi decompositions. In the Freeman-Durden decomposition, band 1 represents the double bounce, band 2 represents the volume and band 3 represents the surface scattering. In the Yamaguchi decomposition, the first three bands correspond to the same scattering components as Freeman-Durden, while band 4 represents the helix scattering.
Pixels from stands of the different age classes, according to ground truth, were extracted from each feature, and four area-based statistics (minimum, maximum, mean, standard deviation) were computed for each of the 11 features, obtaining a total of 44 predictors used for training (70%) and validation (30%) of the models. Classification tests were separately carried out for polarizations, Freeman-Durden, and Yamaguchi derived predictors, using a 10-fold cross validation approach. MARS and Random Forests were used to classify the four poplar age classes. After the first results, the information from classes 1 and 2 was joined, thus obtaining 3 classes only: class A < 3 years age; class B 4–6 years age; class C > 7 years age. MARS, Random Forest, and Support Vector Machine algorithms were used to classify these three classes.
In this research, different machine learning algorithms were tested to evaluate their impact on the accuracy of the results. The CART decision tree is a non-parametric machine learning model for regression and classification problems [31]. A decision tree makes sequential, hierarchical decisions about the outcome variable based on the predictor data. Subgroups of observations with homogeneous explanatory variables but distinct response variables are selected and extracted by CART to find the best solution. CART can handle both numerical and categorical data. It uses clear Boolean logic, and no assumption is made on training data or prediction residuals. Moreover, it is efficient in large dataset analysis, robust against collinearity and has in-built feature selection that removes irrelevant predictor features. The Multivariate Adaptive Regression Splines (MARS; [44]), is a nonparametric regression procedure that combines piecewise linear basis functions. MARS fits an adaptive non-linear regression, computing the functions in pairs and connecting them to a knot; it does not assume a priori a specific function and is characterized by high analytical speed and simplicity of the produced models [45]. These characteristics make MARS suited for ecological applications in which the variables may not always be normally distributed. The Random Forest (RF; [46]) is a machine learning algorithm employed in many different application domains. RF is a tree-based ensemble algorithm that generates hundreds or even thousands of alternative models (hence, ‘forests’). In building a tree, instead of using the best split among all variables, the best split among a subset of randomly chosen variables is used (hence, ‘Random’). To incorporate the results from the hundreds of models, RF regression uses averaging. An advantage of RF is that it only has two parameters to tune—the number of random features for each split (mtry) and the number of the trees/models to build (ntree)—and having few parameters makes the result highly repeatable. Unlike some other tools, there is no assumption on data distribution. The embedded Out-of-Bag (OOB) strategy separates one-third of the samples aside for evaluation each time when a model is built provides unbiased internal error estimation. The support vector machine (SVM; [47]) is a supervised non-parametric statistical learning technique. Input vectors are non-linearly mapped to a very high-dimension feature space, and in this feature space a linear decision surface is constructed. Special properties of the decision surface ensure high generalization ability of the learning machine. SVM is known for the ability to generalize well even with limited ground truth, and it is often used to improve the classification of remotely sensed imagery.
For the classification tests, both CART and MARS were set without weights and interactions between predictors; for SVM, the polynomial kernel setting was selected; for Random Forest, the ntree parameter was set to 500 and the mtry value was equal to the number of predictors. All classification tests were carried out by partitioning the field data into calibration (70%) and validation (30%) datasets and using the Leave-one-out approach.
The classification results were evaluated using the overall accuracy and for the 3-class and 4-class tests, considering the imbalance in samples amount per class, also with the F-score. F-score balances both the concerns of precision and recall in one number; with precision quantifying the number of positive class predictions that actually belong to the positive class, and recall quantifying the number of positive class predictions made out of all positive examples in the dataset.

3. Results

The first aim was to distinguish the cut plantations using dual-pol SAR images. To this end, the CART algorithm was trained and validated with samples representing two classes: the poplar forest stands and the stands that were cut, with remaining bare soil or very low spontaneous vegetation. In total, 28 samples for each class were extracted from the dual-pol 2017 pre-cut and 2018 post-cut images, respectively; area statistics were computed and used as input in CART.
Among the predictors, CART selected only the HV mean, identifying a threshold value (0.002265 linearized dB) for the forest/non-forest distinction. The overall accuracy of this binary detection, validated with LOO procedure, was equal to 80%. The HV mean threshold value was used to classify the dual-pol 2018 image as forest/non-forest and explore the results with respect to the age classes reported by the 2018 ground survey (366 samples).
The results (Figure 2) showed that 100% of cut plantations (Bare soil—0) were correctly classified, 96% of new planted stands (Forest—1, age 1 year) were wrongly classified as cut plantations, 69% of areas of age class 2 (Forest—2, age 2–3 years) were wrongly as cut plantations, and 8% of stands in class Forest—3 (>4 years age) and 9% in class Forest—4 (>7 years age) were correctly classified as cut plantations. Thus, using a threshold and the dual-pol SAR imagery, even if the validated overall accuracy was notable (80%), only the cut plantations and stands above 4 years old were optimally classified.
The second aim was to classify four poplar age classes using the full-pol 2018 SAR image, according to [39] (Section 2.1; Class 1—1 year-old—46 samples; Class 2—2/3 years old—91 samples; Class 3—4/6 years old—87 samples; Class 4—≥7 years old—139 samples). Tests were carried out using MARS and Random Forest, and area-based statistics were extracted from 11 predictors represented by the four polarizations, the three Freeman-Durden and the four Yamaguchi decompositions of the full-pol SAR image. The results from 10-fold cross validation are reported in Table 1, together with the predictors selected by the Variable Importance approaches incorporated in the algorithms. Only predictors that contributed >20% to the result are reported, with the percentage of contribution.
The results indicate that the polarimetric decompositions helped to slightly increase the accuracy, with respect to that obtained using simple polarizations. Irrelevant differences occurred between the two decomposition types, and a very slight increase in accuracy was reached when using RF, according to the F-score. The volume decomposition was the most important result.
The tests were then repeated after aggregating the ground truth in three “new” age classes (class A < 3 years age; class B 4–6 years age; class C > 7 years age) using MARS, Random Forests and SVM algorithms. The overall accuracies obtained with 10-fold cross validation are reported in Table 2, together with the F-score and the Variable Importance results (available only for MARS and Random Forests).
In this case, according to OA, MARS and SVM showed similar performances, while Random Forest scored the best overall accuracies, with a notable increase in accuracy (>10%) when using the polarizations. However, the F-score, considering unbalanced sampling, shows that all results are in a very close range. The mean area statistics resulted in the most frequently used one, and results were mostly based on the mean volume derived from decompositions. The confusion matrices for the classifications of the three age classes are reported in Table 3.

4. Conclusions

The present research demonstrates the feasibility of monitoring poplar plantations with SAR polarimetric data, specifically detecting interannual cuts and classifying stands of different ages, thus producing valuable information to forest management and planning activities.
The detection of cut areas was based on two dual-pol (HH, HV) SAR ALOS2 images, which provided the inputs to train and validate the CART classification algorithm. Dual-pol data were used as they were available in the pre- and post-cut period, differently from quad-pol images. CART selected a threshold value from HV polarization to perform the discrimination between the cut areas and poplar forest, with 80% overall accuracy. It is recognized that the HV polarization is more sensitive than HH to the forest structure parameters that are sensed at the L-band thanks to HV’s signal penetration capability [48,49]. This fact explains the selection of the single HV input in the classification. Ref. [50] similarly found that a simple HV-based threshold approach was enough to identify forest cutting. This CART result—even if not especially accurate—can be considered valuable because recently planted and young poplar stands represent a major source of confusion due to their limited height and scarce foliage density. For new poplars plantations (stands with less than 1 year age), the crown cover is usually <5% of the plot and reaches about 25% in the third year; only poplars > 4 years show a cover > 75% [12]. This problem became evident when the sources of error were investigated: The majority of areas planted less than 3 years ago, especially those planted a few months ago, were misclassified as bare soil. In Chinese forests, the authors of [51] found that the sensitivity of L-band SAR backscatter to structure fluctuated with canopy density; while the authors of [52] showed that SAR backscattering in white poplar was sensitive to the leaf area index. These observations are in line with the scarce accuracy found for the lower age classes, which include areas with a limited canopy cover and poplars with a thin structure that cannot be easily sensed with ALOS2 data. The majority of previous studies based on the commonly used optical satellite data solely focused on mature poplar plantations (5–10 years; [1]), stated that it is impossible to discriminate poplars < 3 year of age [5], or observed similar issues for younger age classes when try to discriminate poplar stands from other cover types, obtaining similar accuracy with very high spatial resolution imagery [12]. The results presented here are similar to those obtained with the optical data, with the advantage that SAR systems are weather-independent, facilitating winter data acquisitions. Moreover, considering that SAR can potentially provide additional structure information, its use in poplar cut detection is strongly suggested. In fact, SAR data are widely used in monitoring the development of other forest plantations [50,53,54]. In addition, the use of a single threshold represents an easy approach that facilitates the detection of cutting occurring in poplar stands over the course of years, although results based on dual-pol ALOS2 cannot be considered reliable for the 1–3-year age classes. It is expected that this result could be improved if quad-pol images are available in the needed dates, given their larger information content.
The classification in age classes, based on quad-pol data, followed two steps: The first one attempted to discriminate the four original age classes provided from ground truth according to [39]. The results indicate a moderate overall accuracy (included in the 0.68–0.73 range), and slightly lower values when considering the F-score (0.60–0.72 range), with higher F-score values obtained with RF algorithm. The higher accuracy range was reached when using polarimetric decompositions as inputs. These moderately accurate results are explained in the light of the previous consideration regarding low age poplar classes, which represent a major source of confusion in classification. It is interesting to note that, when looking at the importance of input variables, the HV band contributed most when using polarization inputs, while the volume scattering contributed most when using decompositions inputs. This was true except in one case (considering OA result with RF algorithm) for which the Yamaguchi helix scattering decomposition, which is usually employed in very complex and heterogeneous urban areas [55], resulted the most important predictor in the classification. Further analyses are needed to interpret this result, which might be linked to the mix of regularly organized targets (trunks) in plantation and the variable understory vegetation and soils targets, composing a heterogeneous and complex target.
In the second step, we aggregated the ground data to obtain three age classes (<3 years; 4–6 years; >7 years), reducing the difficulty of the classification task but still providing important information in managing plantations and planning the poplar cuts. The overall accuracy increased, reaching the 0.76–0.79 range in all cases regardless the inputs used (polarimetric bands or decompositions) or the classification algorithm. Similarly, the F-score ranged between 0.74 and 0.77. In one single case, according to overall accuracy result based on polarimetric bands and RF, the accuracy reached the higher 0.87 value. However, considering the F-score that mitigates the unbalance sampling, the results are all very close each other regardless the used algorithm or the input predictors. In all the tests, the worst results were obtained for the intermediate age class when stems and leaves were not developed enough to detect by scattering mechanisms. Nevertheless, this is the least interesting class for management purposes, as the priority information targets mature stands ready for cut or recently planted stands to monitor their extent. The variable importance approach incorporated in MARS and RF algorithms confirmed the well-known importance of the HV polarization for forest and biomass detection [56,57], as well the value of the volumetric scattering, which, at the L band, is directly related to the development of branches and trucks and thus to the maturity of the forest.
These classification results are notable, considering that in previous research, the resulting values were lower or similar for the detection of mature stands only [1,12] or for the classification of only two age classes [13]. These positive results are certainly linked to the value of the quad-pol ALOS2 data. Different forest studies have highlighted that quad polarization mode performs better than dual and single polarization in land cover classification [58,59]. ALOS2 quad-pol data are often used to estimate forest structure parameters [60,61], including in plantations [62], and to understand the level and extent of disturbances and regrowth dynamics in forests [63]. Minimal differences occurred with the different machine learning algorithm, basically showing their equivalence in such classification exercises. In addition, minimal differences occurred when using the decompositions instead of bands. However, considering that the computation of the decompositions can be easily performed in open software, their testing is suggested. It is also noteworthy that the better performances were obtained in the previous four-class classification test. When available, the full-pol data are preferable with respect to the dual-pol as they include increased information content and higher spatial resolution. SAR data availability will surely increase in the near future according to the already-planned international satellite new missions, representing an opportunity to improve the monitoring of forest resources and plantations such as poplar.

Author Contributions

Conceptualization, G.V.L.; Formal analysis, N.P. and W.M.; Methodology, G.V.L., N.P. and W.M.; Software, N.P., S.I. and E.L.; Supervision, G.V.L. and R.V.; Writing—original draft, G.V.L.; Writing—review & editing, N.P., W.M., E.L. and S.I. All authors have read and agreed to the published version of the manuscript.

Funding

This research received no external funding.

Data Availability Statement

Data are available for research purposes upon request to the authors’ institutions.

Acknowledgments

The field data were collected in the framework of the Regione Lombardia project PRECISIONPOP (Sistema di monitoraggio multiscalare a supporto della pioppicoltura di precisione nella Regione Lombardia). ALOS2 imagery was accessed thanks to the imagery grant ‘SAR polarimetry supporting High Impact Weather Event risk management’, provided under the JAXA 2nd Research Announcement on the Earth Observations.

Conflicts of Interest

The authors declare no conflict of interest.

References

  1. Chianucci, F.; Puletti, N.; Grotti, M.; Bisaglia, C.; Giannetti, F.; Romano, E.; Brambilla, M.; Mattioli, W.; Cabassi, G.; Bajocco, S.; et al. Influence of image pixel resolution on canopy cover estimation in poplar plantations from field, aerial and satellite optical imagery. Ann. Silvic. Res. 2021, 46, 8–13. [Google Scholar] [CrossRef]
  2. Pra, A.; Pettenella, D. Investment returns from hybrid poplar plantations in northern Italy between 2001 and 2016: Are we losing a bio-based segment of the primary economy? Rev. Agric. Econ. 2019, 74, 49–71. [Google Scholar] [CrossRef]
  3. Porro, Z.; Odicino, M.; Bogliani, G.; Chiatante, G. Intensive forestry and biodiversity: Use of poplar plantations by woodpeckers in a lowland area of Northern Italy. For. Ecol. Manag. 2021, 497, 119490. [Google Scholar] [CrossRef]
  4. Puletti, N.; Grotti, M.; Scotti, R. Evaluating the eccentricities of poplar stem profiles with terrestrial laser scanning. Forests 2019, 10, 239. [Google Scholar] [CrossRef] [Green Version]
  5. D’Amico, G.; Francini, S.; Giannetti, F.; Vangi, E.; Travaglini, D.; Chianucci, F.; Mattioli, W.; Grotti, M.; Puletti, N.; Corona, P.; et al. A deep learning approach for automatic mapping of poplar plantations using Sentinel-2 imagery. GIsci. Remote Sens. 2021, 58, 1352–1368. [Google Scholar] [CrossRef]
  6. Marcelli, A.; Mattioli, W.; Puletti, N.; Chianucci, F.; Gianelle, D.; Grotti, M.; Chirici, G.; D’Amico, G.; Francini, S.; Travaglini, D.; et al. Large-scale two-phase estimation of wood production by poplar plantations exploiting Sentinel-2 data as auxiliary information. Silva Fenn. 2020, 54, 10247. [Google Scholar] [CrossRef] [Green Version]
  7. Corona, P.; Chianucci, F.; Marcelli, A.; Gianelle, D.; Fattorini, L.; Grotti, M.; Puletti, N.; Mattioli, W. Probabilistic sampling and estimation for large-scale assessment of fast-growing forest tree crops. The case of poplar plantations in Northern Italy. Eur. J. For. Res. 2020, 139, 981–988. [Google Scholar] [CrossRef]
  8. Marchi, M.; Bergante, S.; Ray, D.; Barbetti, R.; Facciotto, G.; Chiarabaglio, P.M.; Hynynen, J.; Nervo, G. Universal reaction norms for the sustainable cultivation of hybrid poplar clones under climate change in Italy. iForest 2022, 15, 47–55. [Google Scholar] [CrossRef]
  9. Cantamessa, S.; Rosso, L.; Giorcelli, A.; Chiarabaglio, P.M. The environmental impact of poplar stand management: A life cycle assessment study of different scenarios. Forests 2022, 13, 464. [Google Scholar] [CrossRef]
  10. Ancona, V.; Caracciolo Barra, A.; Campanale, C.; Rascio, I.; Grenni, P.; Di Lenola, M.; Bagnuolo, G.; Uricchio, F.V. Heavy metal phytoremediation of a poplar clone in a contaminated soil in southern Italy. J. Chem. Technol. Biotechnol. 2020, 95, 940–949. [Google Scholar] [CrossRef]
  11. Hamrouni, Y.; Paillassa, E.; Chéret, V.; Monteil, C.; Sheeren, D. Sentinel-2 poplar index for operational mapping of poplar plantations over large areas. Remote Sens. 2022, 14, 3975. [Google Scholar] [CrossRef]
  12. Grignetti, A.; Coaloa, D.; Niccolini, G. Classification of poplar stand areas by high-resolution satellite images. Forest 2009, 6, 299–311. [Google Scholar] [CrossRef] [Green Version]
  13. Hamrouni, Y.; Paillassa, É.; Cheret, V.; Monteil, C.; Sheeren, D. Synergistic use of sentinel-1 and sentinel-2 time series for poplar plantations monitoring at large scale, 2020. In Proceedings of the 24th ISPRS Congress-Technical Commission III, Nice, France, 31 August–2 September 2020; pp. 1457–1461. [Google Scholar]
  14. Dong, X.; Quegan, S.; Yumiko, U.; Hu, C.; Zeng, T. Feasibility study of C-and L-band SAR time series data in tracking Indonesian plantation and natural forest cover changes. IEEE J. Sel. Top. Appl. Earth Obs. Remote Sens. 2015, 8, 3692–3699. [Google Scholar] [CrossRef]
  15. Hashim, I.C.; Shariff, A.R.M.; Bejo, S.K.; Muharam, F.M.; Ahmad, K. Machine-Learning approach Using Sar data for the classification of oil palm trees that are non-infected and infected with the basal stem rot disease. Agronomy 2021, 11, 532. [Google Scholar] [CrossRef]
  16. Vaglio Laurin, G.; Del Frate, F.; Pasolli, L.; Notarnicola, C.; Guerriero, L.; Valentini, R. Discrimination of vegetation types in alpine sites with ALOS PALSAR-, RADARSAT-2-, and lidar-derived information. Int. J. Remote Sens. 2013, 34, 6898–6913. [Google Scholar] [CrossRef]
  17. Lehmann, E.A.; Caccetta, P.; Lowell, K.; Mitchell, A.; Zhou, Z.S.; Held, A.; Milne, T.; Tapley, I. SAR and optical remote sensing: Assessment of complementarity and interoperability in the context of a large-scale operational forest monitoring system. Remote Sens. Environ. 2015, 156, 335–348. [Google Scholar] [CrossRef]
  18. Sirro, L.; Häme, T.; Rauste, Y.; Kilpi, J.; Hämäläinen, J.; Gunia, K.; De Jong, B.; Paz Pellat, F. Potential of different optical and SAR data in forest and land cover classification to support REDD+ MRV. Remote Sens. 2018, 10, 942. [Google Scholar] [CrossRef] [Green Version]
  19. Vaglio Laurin, G.; Liesenberg, V.; Chen, Q.; Guerriero, L.; Del Frate, F.; Bartolini, A.; Coomes, D.; Wilebore, B.; Lindsell, J.; Valentini, R. Optical and SAR sensor synergies for forest and land cover mapping in a tropical site in West Africa. Int. J. Appl. Earth Obs. Geoinf. 2013, 21, 7–16. [Google Scholar] [CrossRef]
  20. Vaglio Laurin, G.; Francini, S.; Luti, T.; Chirici, G.; Pirotti, F.; Papale, D. Satellite open data to monitor forest damage caused by extreme climate-induced events: A case study of the Vaia storm in Northern Italy. Forestry 2021, 94, 407–416. [Google Scholar] [CrossRef]
  21. Balz, T.; Sörgel, U.; Crespi, M.; Osmanoglu, B. Editorial for Special Issue “Advances in SAR: Sensors, Methodologies, and Applications”. Remote Sens. 2018, 10, 1233. [Google Scholar] [CrossRef]
  22. Hou, W.; Zhao, F.; Liu, X.; Zhang, H.; Wang, R. A unified framework for comparing the classification performance between quad-, compact-, and dual-polarimetric SARs. IEEE Trans. Geosci. Remote Sens. 2021, 60, 5204814. [Google Scholar] [CrossRef]
  23. Yang, J.; Yamaguchi, Y.; Lee, J.S.; Touzi, R.; Boerner, W.M. Applications of polarimetric SAR. J. Sens. 2015, 2, 31639. [Google Scholar] [CrossRef]
  24. Freeman, A.; Durden, S.L. A three-component scattering model for polarimetric SAR data. IEEE Trans. Geosci. Remote Sens 1998, 36, 963–973. [Google Scholar] [CrossRef] [Green Version]
  25. Yamaguchi, Y.; Moriyama, T.; Ishido, M.; Yamada, H. Four-component scattering model for polarimetric SAR image decomposition. IEEE Trans. Geosci. Remote Sens. 2005, 43, 1699–1706. [Google Scholar] [CrossRef]
  26. Parida, B.R.; Mandal, S.P. Polarimetric decomposition methods for LULC mapping using ALOS L-band PolSAR data in Western parts of Mizoram, Northeast India. SN Appl. Sci. 2020, 2, 1049. [Google Scholar] [CrossRef]
  27. Varghese, A.O.; Suryavanshi, A.; Joshi, A.K. Analysis of different polarimetric target decomposition methods in forest density classification using C band SAR data. Int. J. Remote Sens. 2016, 37, 694–709. [Google Scholar] [CrossRef]
  28. Kobayashi, S.; Omura, Y.; Sanga-Ngoie, K.; Widyorini, R.; Kawai, S.; Supriadi, B.; Yamaguchi, Y. Characteristics of decomposition powers of L-band multi-polarimetric SAR in assessing tree growth of industrial plantation forests in the tropics. Remote Sens. 2012, 4, 3058–3077. [Google Scholar] [CrossRef] [Green Version]
  29. Hong, S.H.; Kim, H.O.; Wdowinski, S.; Feliciano, E. Evaluation of polarimetric SAR decomposition for classifying wetland vegetation types. Remote Sens. 2015, 7, 8563–8585. [Google Scholar] [CrossRef] [Green Version]
  30. Lawrence, R.L.; Wright, A. Rule-based classification systems using classification and regression tree (CART) analysis. Photogramm. Eng. Remote Sens. 2001, 67, 1137–1142. [Google Scholar]
  31. Breiman, L.; Friedman, J.H.; Olshen, R.A.; Stone, C.J. Classification and Regression Trees, 1st ed.; Routledge: London, UK, 2017. [Google Scholar] [CrossRef]
  32. Wu, Q.; Zhou, D.X. Analysis of support vector machine classification. J. Comput. Anal. Appl. 2006, 8, 99–119. [Google Scholar]
  33. Belgiu, M.; Drăguţ, L. Random forest in remote sensing: A review of applications and future directions. ISPRS J. Photogramm. Remote Sens. 2016, 114, 24–31. [Google Scholar] [CrossRef]
  34. Gómez, C.; Wulder, M.A.; Montes, F.; Delgado, J.A. Modeling forest structural parameters in the mediterranean pines of central Spain using QuickBird-2 imagery and classification and regression tree analysis (CART). Remote Sens. 2012, 4, 135–159. [Google Scholar] [CrossRef] [Green Version]
  35. Sheykhmousa, M.; Mahdianpari, M.; Ghanbari, H.; Mohammadimanesh, F.; Ghamisi, P.; Homayouni, S. Support vector machine versus random forest for remote sensing image classification: A meta-analysis and systematic review. IEEE J. Sel. Top. Appl. Earth Obs. Remote Sens. 2020, 13, 6308–6325. [Google Scholar] [CrossRef]
  36. Thanh Noi, P.; Kappas, M. Comparison of random forest, k-nearest neighbor, and support vector machine classifiers for land cover classification using Sentinel-2 imagery. Sensors 2017, 18, 18. [Google Scholar] [CrossRef] [Green Version]
  37. Vaglio Laurin, G.; Puletti, N.; Grotti, M.; Stereńczak, K.; Modzelewska, A.; Lisiewicz, M.; Sadkowski, R.; Kuberski, L.; Chirici, G.; Papale, D. Species dominance and above ground biomass in the Białowieża Forest, Poland, described by airborne hyperspectral and lidar data. Int. J. Appl. Earth Obs. Geoinf. 2020, 92, 102178. [Google Scholar] [CrossRef]
  38. Collino, E.; Bonelli, P.; Gilli, L. ST-AR (STorm-ARchive): A project developed to assess the ground effects of severe convective storms in the Po Valley. Atmos. Res. 2009, 93, 483–489. [Google Scholar] [CrossRef]
  39. Lapietra, G.; Coaloa, D.; Chiarabaglio, P.M. Rapporto annuale sulla pioppicoltura 1993. Cellul. Carta 1994, 45, 2–8. (In Italian) [Google Scholar]
  40. Chianucci, F.; Marchino, L.; Bidini, C.; Giorcelli, A.; Coaloa, D.; Chiarabaglio, P.; Giannetti, F.; Chirici, G.; Tattoni, C. Dataset of tree inventory and canopy structure in poplar plantations in Northern Italy. Ann. Silvic. Res. 2021, 46, 93–96. [Google Scholar] [CrossRef]
  41. Shimada, M. ALOS-2 Science Program. In Proceedings of the IEEE International Geoscience and Remote Sensing Symposium-IGARSS, Melbourne, Australia, 21–26 July 2013; pp. 2400–2403. [Google Scholar]
  42. Santoso, A.W.; Bayuaji, L.; Sze, L.T.; Lateh, H.; Zain, J.M. Comparison of various speckle noise reduction filters on synthetic aperture radar image. Int. J. Appl. Eng. Res. 2016, 11, 8760–8767. [Google Scholar]
  43. R Core Team. R: A Language and Environment for Statistical Computing; R Foundation for Statistical Computing: Vienna, Austria; Available online: https://www.R-project.org/ (accessed on 14 September 2022).
  44. Friedman, J.H. Multivariate adaptive regression splines. Ann. Stat. 1991, 19, 1–67. [Google Scholar] [CrossRef]
  45. Hastie, T.; Tibshirani, R.; Friedman, J.H. The Elements of Statistical Learning: Data Mining, Inference, and Prediction, 2nd ed.; Springer: New York, NY, USA, 2009; pp. 1–758. [Google Scholar]
  46. Breiman, L. Random forests. Mach. Learn. 2001, 45, 5–32. [Google Scholar] [CrossRef] [Green Version]
  47. Cortes, C.; Vapnik, V. Support-vector networks. Mach. Learn. 1995, 20, 273–297. [Google Scholar] [CrossRef]
  48. Huang, W.; Sun, G.; Ni, W.; Zhang, Z.; Dubayah, R. Sensitivity of multi-source SAR backscatter to changes in forest aboveground biomass. Remote Sens. 2015, 7, 9587–9609. [Google Scholar] [CrossRef]
  49. Nguyen, L.V.; Tateishi, R.; Nguyen, H.T.; Sharma, R.C.; To, T.T.; Le, S.M. Estimation of tropical forest structural characteristics using ALOS-2 SAR data. Adv. Remote Sens. 2016, 5, 131–144. [Google Scholar] [CrossRef] [Green Version]
  50. Khati, U.; Kumar, V.; Bandyopadhyay, D.; Musthafa, M.; Singh, G. Identification of forest cutting in managed forest of Haldwani, India using ALOS-2/PALSAR-2 SAR data. J. Environ. Manag. 2018, 213, 503–512. [Google Scholar] [CrossRef]
  51. Ji, Y.; Huang, J.; Ju, Y.; Guo, S.; Yue, C. Forest structure dependency analysis of L-band SAR backscatter. PeerJ. 2020, 8, e10055. [Google Scholar] [CrossRef]
  52. Gao, S.; Niu, Z.; Wu, C. Multi-polarization Envisat-ASAR images as a function of leaf area index (LAI) of white poplar and desert date plantations. Int. J. Remote Sens. 2010, 31, 1095–1102. [Google Scholar] [CrossRef]
  53. Pohl, C. Mapping palm oil expansion using SAR to study the impact on the CO2 cycle. In IOP Conference Series: Earth and Environmental Science; IOP Publishing: Bristol, UK, 2014. [Google Scholar]
  54. Takeuchi, S.; Suga, Y.; Oguro, Y.; Konishi, T. Monitoring of new plantation development in tropical rain forests using JERS-1 SAR data. Adv. Space Res. 2000, 26, 1151–1154. [Google Scholar] [CrossRef]
  55. Maurya, H.; Kumar, A.; Mishra, A.K.; Panigrahi, R.K. Improved four-component based polarimetric synthetic aperture radar image decomposition. IET Radar Sonar Navig. 2020, 14, 619–627. [Google Scholar] [CrossRef]
  56. Rauste, Y.; Hame, T.; Pulliainen, J.; Heiska, K.; Hallikainen, M. Radar-based forest biomass estimation. Int. J. Remote Sens. 1994, 15, 2797–2808. [Google Scholar] [CrossRef]
  57. Rignot, E.J.; Williams, C.L.; Way, J.; Viereck, L.A. Mapping of forest types in Alaskan boreal forests using SAR imagery. IEEE Trans. Geosci. Remote Sens. 1994, 32, 1051–1059. [Google Scholar] [CrossRef] [Green Version]
  58. Ainsworth, T.L.; Kelly, J.P.; Lee, J.S. Classification comparisons between dual-pol, compact polarimetric and quad-pol SAR imagery. ISPRS J. Photogramm. Remote Sens. 2009, 64, 464–471. [Google Scholar] [CrossRef]
  59. Liesenberg, V.; Gloaguen, R. Evaluating SAR polarization modes at L-band for forest classification purposes in Eastern Amazon, Brazil. Int. J. Appl. Earth Obs. Geoinf. 2013, 21, 122–135. [Google Scholar] [CrossRef]
  60. Godinho Cassol, H.L.; De Oliveira, E.; Cruz De Aragão, L.E.; Moraes, E.C.; De Brito Carreiras, J.M.; Shimabukuro, Y.E. Quad-pol Advanced Land Observing Satellite/Phased Array L-band Synthetic Aperture Radar-2 (ALOS/PALSAR-2) data for modelling secondary forest above-ground biomass in the central Brazilian Amazon. Int. J. Remote Sens. 2021, 42, 4985–5009. [Google Scholar] [CrossRef]
  61. Golshani, P.; Maghsoudi, Y.; Sohrabi, H. Relating ALOS-2 PALSAR-2 parameters to biomass and structure of temperate broadleaf hyrcanian forests. J. Indian Soc. Remote Sens. 2019, 47, 749–761. [Google Scholar] [CrossRef]
  62. Nouri, A.; Shataee, S.; Mohammadi, J. Capatility of Alos-Palsar-2 radar quad polarization data for estimation of structural quantitative characteristics of planted forest, Arabdagh region, Iran. IJFPR 2019, 27, 451–463. [Google Scholar]
  63. Musthafa, M.; Khati, U.; Singh, G. Sensitivity of PolSAR decomposition to forest disturbance and regrowth dynamics in a managed forest. Adv. Space Res. 2020, 66, 1863–1875. [Google Scholar] [CrossRef]
Figure 1. In the upper left box, the location of the study area in the Italian Po valley is shown. The main image is a RGB color composite obtained using the Yamaguchi decomposition of the quad-pol ALOS2 SAR scene (R: surface scattering: G: volumetric scattering; B: double bounce). The poplar stands used as ground truth in the classification models are evidenced in red.
Remotesensing 14 05202 g001
Figure 2. Results of the forest/non-forest binary classification of the 2018 dual-pol SAR image, with respect to the poplar stands age classes reported by the 2018 ground survey.
Remotesensing 14 05202 g002
Table 1. Overall accuracy (OA) and F-score for the classification of 4 poplar age classes with MARS and Random Forests models. The predictors contributing >20% to the result are reported in italic.
4 Poplar Age Classes
InputMARSRandom Forests
PolarizationsOA: 0.681
F-score: 0.604
Mean_HV (100%)
OA: 0.686
F-score: 0.607
Mean_HV (100%)
Mean_HH (40.1%)
Min_HV (21.1%)
Freeman-Durden decompositionsOA: 0.725
F-score: 0.664
Mean_volume (100%)
Mean_ double_bounce (29%)
OA: 0.734
F-score: 0.724
Mean_volume (100%)
StDev_double_bounce (40.1%)
Yamaguchi decompositionsOA: 0.731
F-score: 0.685
Mean_volume (100%)
Mean_double_bounce (31%)
OA: 0.725
F-score: 0.718
Mean_Helix (100%)
Mean_volume (94.8%)
StDev_Helix (53.8%)
Mean_double_bounce (37.5%)
Table 2. Overall accuracy (OA) and F-score for the classification of 3 poplar age classes, obtained with MARS, Random Forests and SVM models using 10-fold cross validation. The Variable Importance are also reported in italic for MARS and Random Forests.
3 Poplar Age Classes—Overall Accuracy
[Class A ≤ 3 Years Age; Class B 4–6 Years Age; Class C ≥ 7 Years Age]
InputMARS Random Forests SVM
PolarizationsOA: 0.79
F-score: 0.78
Mean_HV 100.0%
OA: 0.87
F-score: 0.76
Mean_HV 100.0%
Mean_HH 34.5%
Min_HV 20.8%
OA: 0.77
F-score: 0.74
NA
Freeman-Durden decompositionsOA: 0.76
F-score: 0.74
Mean_volume 100.0%
OA: 0.78
F-score: 0.76
Mean_volume 100.0%
StDev_double_bounce 38.3%
Max_volume 21.4%
OA: 0.77
F-score: 0.75
NA
Yamaguchi decompositionsOA: 0.77
F-score: 0.75
Mean_volume 100.0%
OA: 0.79
F-score: 0.77
Mean_Helix 100.0%
Mean_volume 95.5%
StDev_Helix 55.2%
Mean_double_bounce 22.1%
OA: 0.79
F-score: 0.76
NA
Table 3. Confusion matrices for the 3 age class classifications using different MARS, Random Forests, and SVM algorithms and all the available predictors, with a 10-fold cross validation approach.
3 Poplar Age Classes—Confusion Matrices
[Class A ≤ 3 Years Age; Class B 4–6 Years Age; Class C ≥ 7 Years Age]
InputMARSRandom ForestsSVM
PolarizationsclassAclassBclassCTotclassAclassBclassCTotclassAclassBclassCTot
125142141125133141121153139
14511883144776815441372
524113142529123157731117155
143891333661438913336614390133366
InputMARSRandom ForestsSVM
Freeman-Durden decompositionclassAclassBclassCTotclass AclassBclass CTotclassAclassBclassCTot
119182139127171145125163144
194619841149177714471677
525113143524115144626113145
143891343661438913336614589132366
InputMARSRandom ForestsSVM
Yamaguchi decompositionclassAclassBclassCTotclassAclassBclassCTotclassAclassBclassCTot
121152138124152141127152144
165123901449147712461573
623109138526117148528116149
143891343661438913336614489133366
Publisher’s Note: MDPI stays neutral with regard to jurisdictional claims in published maps and institutional affiliations.

