Article

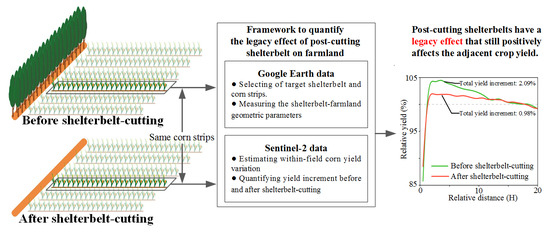
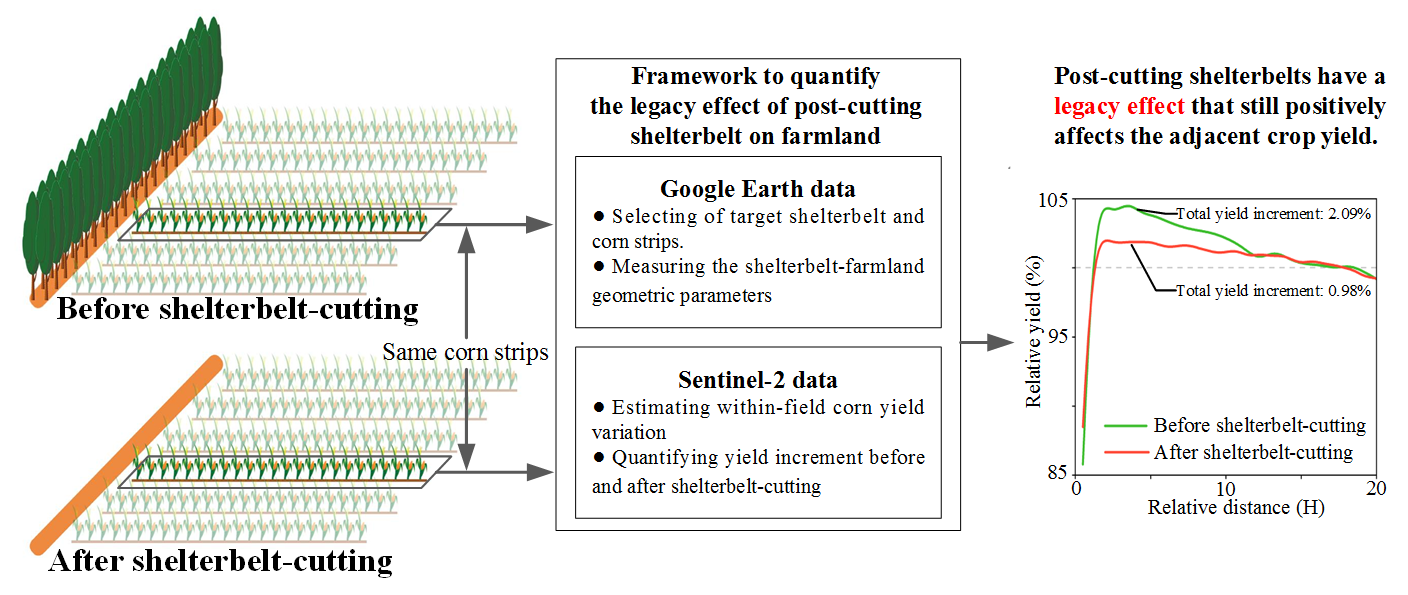
Estimating the Legacy Effect of Post-Cutting Shelterbelt on Crop Yield Using Google Earth and Sentinel-2 Data

1
CAS Key Laboratory of Forest Ecology and Management, Institute of Applied Ecology, Chinese Academy of Sciences, Shenyang 110016, China
2
College of Resources and Environment, University of Chinese Academy of Sciences, Beijing 100049, China
3
Department of Earth Sciences, Uppsala University, SE 75105 Uppsala, Sweden
4
Department of Physical Geography and Ecosystem Science, Lund University, SE 22100 Lund, Sweden
*
Author to whom correspondence should be addressed.
Remote Sens. 2022, 14(19), 5005; https://doi.org/10.3390/rs14195005
Submission received: 15 August 2022 / Revised: 16 September 2022 / Accepted: 20 September 2022 / Published: 8 October 2022
(This article belongs to the Special Issue Application of Remote Sensing in Agroforestry II)

Abstract

:
Shelterbelts (or windbreaks) can effectively improve the microclimate and soil conditions of adjacent farmland and thus increase crop yield. However, the individual contribution of these two factors to yield changes is still unclear since the short-term effect from the microclimate and the accumulated effect from the soil jointly affect crop yield. The latter (soil effect) is supposed to remain after shelterbelt-cutting, thus inducing a post-cutting legacy effect on yield, which can be used to decompose the shelterbelt-induced yield increase. Here, we develop an innovative framework to investigate the legacy effect of post-cutting shelterbelt on corn yield by combining Google Earth and Sentinel-2 data in Northeastern China. Using this framework, for the first time, we decompose the shelterbelt-induced yield increase effect into microclimate and soil effects by comparing the yield profiles before and after shelterbelt-cutting. We find that on average, the intensity of the legacy effect, namely the crop yield increment of post-cutting shelterbelts, is 0.98 ± 0.03%. The legacy effect varies depending on the shelterbelt–farmland relative location and shelterbelt density. The leeward side of the shelterbelt-adjacent farmland has a more remarkable legacy effect compared to the windward side. Shelterbelts with medium–high density have the largest legacy effect (1.94 ± 0.05%). Overall, the legacy effect accounts for 47% of the yield increment of the shelterbelt before cutting, implying that the soil effect is almost equally important for increasing crop yield compared to the microclimate effect. Our findings deepen the understanding of the mechanism of shelterbelt-induced yield increase effects and can help to guide shelterbelt management.

Graphical Abstract

1. Introduction

A shelterbelt is an effective agroforestry practice to protect adjacent farmland by reducing soil erosion and improving microclimate, resulting in a crop yield increase effect [1,2,3]. Many previous studies have reported the significant yield increase effect of shelterbelts, which can be up to 16% [4,5,6]. Regions with intensive use of agroforestry, such as North America [7], Eastern Europe [8], and East Asia [9], have put great effort into establishing shelterbelts through a series of national afforestation programs to ensure their food supply [6,10,11].
Microclimate modulation and soil quality improvement are considered the two main aspects favoring crop growth brought by a shelterbelt [12,13,14]. Although the mechanisms have been explored by many previous studies [2,15,16], the individual contribution of these two factors is still unclear. The shelterbelt-induced microclimate changes, such as the reduction of wind speed and the increase of air humidity, are short-term effects that disappear immediately when the shelterbelt is removed [17,18,19,20], while the soil effects, such as the improvement of soil quality, are accumulated processes that cannot vanish with shelterbelt-cutting [21,22,23]. Many studies have found that the accumulated improvement of soil quality could remain after shelterbelt-cutting due to the soil nutrient inheritance and the long memory effect maintained by soil microbes [24,25,26]. For example, shelterbelts have been shown to increase the soil microbial biomass and diversity in adjacent farmland [27,28], which is considered a memory effect and could be maintained for decades after environmental changes [29,30,31,32]. The post-cutting shelterbelt was called the “ghost shelterbelt” [23] because it still had considerable organic carbon stock inheritance in the adjacent farmland that was conducive to crop growth [33,34,35]. Thus, regarding the crop yield increase, the post-cutting shelterbelt should have a legacy effect due to lingering effects on soil composition. This legacy effect can conceptualize the distinct contributions of the soil and microclimate effects on the yield increase. However, this legacy effect of post-cutting shelterbelt on crop yield has never been verified.
The ongoing regeneration of the national shelterbelt program in China (i.e., cutting down the overmature shelterbelt and replanting new seedlings) provides a good opportunity to quantify the legacy effect [36]. China’s Three-North Shelter Forest Program is the world’s largest afforestation project, which has already planted 1.66 million hectares of shelterbelt to protect over 30 million hectares of farmland [37,38]. In recent years, over half of the trees in the shelterbelt became over-mature with a natural decline in growth [39]. To maintain a sustainable agroforestry ecosystem and optimize crop yield, a large number of the over-mature shelterbelts were regenerated [40], which provided a natural experiment to investigate the legacy effect of the post-cutting shelterbelt on crop yield.
Shelterbelt monitoring based on high-temporal and -spatial resolution remote sensing images provides new opportunities to assess shelterbelt-induced yield increase effects at a regional scale [41,42]. It complements the traditional field measurement that is hardly feasible for large-scale shelterbelt studies. Zheng et al. [6] identified shelterbelt-induced crop yield variation using 1 km resolution remote sensing data and a harvest index method. However, the study failed to resolve the variations in crop yield within a single field due to the coarse spatial resolution. Osorio et al. [5] combined the crop yield monitor equipment and a GIS-based method to quantify the yield variation induced by shelterbelts. Yet, the study only investigated a small area and was difficult to expand to a regional scale, due to the enormous workload on the in-site yield monitoring. It is, therefore, necessary to employ high-resolution remote sensing data and to develop a method for regional shelterbelt-crop yield studies.
To reveal the legacy effect of the post-cutting shelterbelt, this study developed an innovative framework to investigate the farmland yield variation induced by the shelterbelt using high-resolution remote sensing data at a large scale. Using this framework, we, for the first time, quantified the legacy effect of post-cutting shelterbelts on crop yield in Northeastern China. Moreover, we investigated the impact of shelterbelt–farmland relative location and shelterbelt structures on the legacy effect. We aim to decompose the shelterbelt-induced yield increase effect into microclimate and soil effects by comparing the general shelterbelt-induced yield increase effect and post-cutting shelterbelt legacy effect. It is hoped our findings could illuminate the mechanism of shelterbelt-induced yield increase effects and provide a new perspective on agroforestry ecosystem research.

2. Study Area, Data, and Methods
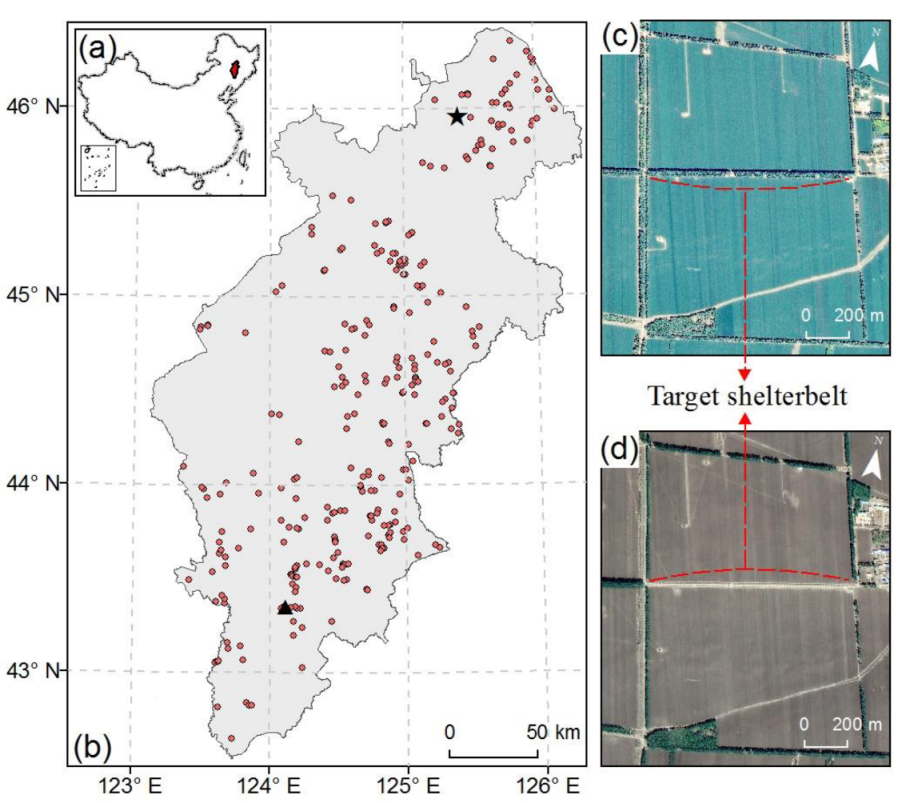
2.1. Study Area

This study was conducted in the Songliao Plain in Northeast China—the largest farmland shelterbelt district in the Three-North Shelter Forest Program and the major grain-producing area in China (Figure 1) [43]. It is located in the temperate semi-arid and semi-humid climate zone with an annual mean temperature of 1–7 °C and annual total precipitation of 300–550 mm [6]. The major crop is corn, which is grown from mid-April to late September [44]. In the growing season, the dominant wind direction in the study area is south–southwest and the mean wind speed is 2.9 m/s. The afforestation of this area began in 1978 [6]. The cover of poplar trees contributes to more than 98% of the shelterbelt areas (including Populus simonii, Populus × xiaozhuanica, Populus pseudo-simonii, Populus × beijingensis, etc.) [39]. In recent years, the over-mature shelterbelt (older than 30 years) in the study area has gradually been cut down and will be replanted for sustainable management. These cut-down shelterbelts have similar tree heights (~20 m) due to the unified tree age and management measures [45].

2.2. Data

We have developed an unprecedented dataset of 302 shelterbelts that went through regeneration from Google Earth images and Sentinel-2 data from 2016 to 2019 to identify the shelterbelts and analyze their impact on corn yield. Specifically, Google Earth© provided sub-meter spatial resolution imagery from the visible part of the spectrum for our study area [46]. We used the Google Earth Pro© software (https://www.google.com/earth/versions/#earth-pro, accessed on 1 December 2021) to analyze the temporal changes in Google Earth images to select the target shelterbelts that experienced cutting and to measure the shelterbelt–farmland geometric parameters (see details in Section 2.3.1).
Sentinel-2 provides 10–60 m spatial resolution hyperspectral images worldwide [47,48]. We used 10 m resampled Sentinel-2 data to estimate corn leaf area index (LAI) and yield through the Sentinel Application Platform (http://step.esa.int/main/, accessed on 1 February 2022). In addition, we conducted a field yield measurement of 68 plots in 2019 in the Conservation Tillage Research and Development Station of the Chinese Academy of Sciences (triangle in Figure 1). The measured corn yield data were used to estimate and validate the parameters in the yield estimation linear model (see details in Section 2.3.3).

2.3. Methods

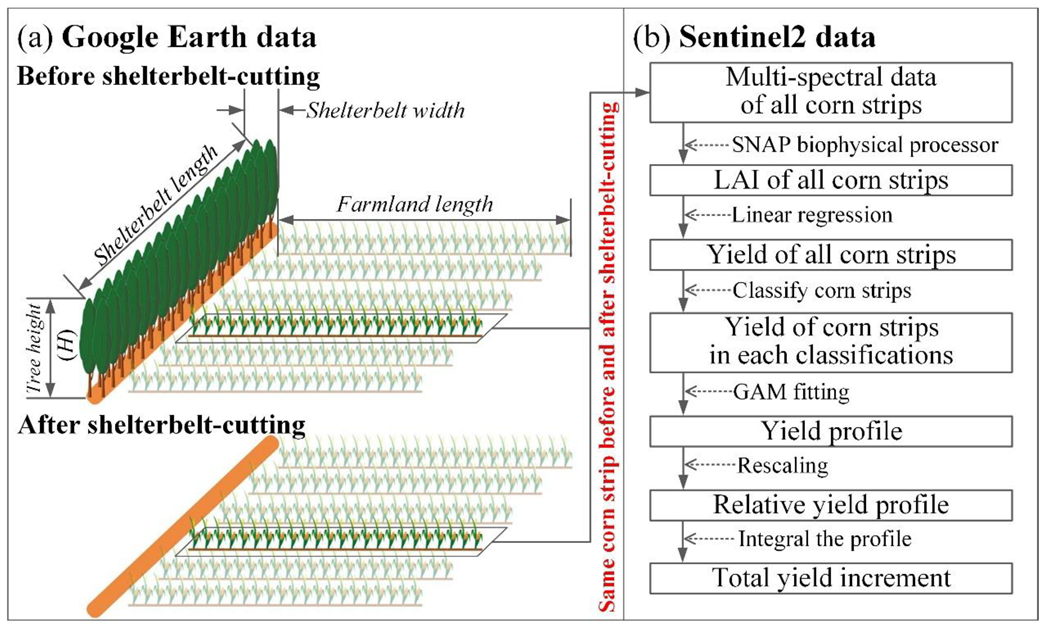
2.3.1. Selection of Target Shelterbelt and Corn Strips

The target shelterbelts were selected based on historical Google Earth images through manual identification. A total of 302 cut-down shelterbelts were identified in the study area during 2016–2019 (Figure 1). We then measured the geometric parameters of each identified shelterbelt and the adjacent farmland (i.e., the shelterbelt length, gap length, shelterbelt width, farmland length, and corn row–shelterbelt angle) using the linear ruler tools in Google Earth Pro (Figure 2a) [49].
Corn yield near the shelterbelt was estimated along the corn strips in each target shelterbelt. Niu’s corn phenology dataset [44] was used to identify the corn farmlands [44]. To highlight the impact of the shelterbelt on corn yield and exclude the potential influence of other factors, we used four criteria to select corn strips: (1) the strips were located in the middle of the target shelterbelt to minimize the influence of shelterbelt edge effect on corn yield; (2) the strips were homogenous in crop type (only corn) and continuous (no gap); (3) the strips were aligned with the direction of planting rows to ensure field management consistency; (4) the corn row–shelterbelt angle was greater than 60° to minimize the influence of the shelterbelt edge.

2.3.2. Estimation of the Corn Yield

We estimated the crop yield using Sentinel-2 data via two steps. First, the Weiss and Baret [50] method was used to convert the multi-spectral Sentinel-2 data of each corn strip into LAI. We then estimated the crop yield through a linear model based on previous studies (e.g., Jin et al. [51], Lambert et al. [52], and Skakun et al. [53]), which found that the corn LAI from late July to early September was linearly correlated with corn yield and could be used for yield estimation [54,55]. By combining the field measured yield data, we calibrated the linear model with local observations as Yield = 2.39 × LAI − 0.43. The localized linear model estimated the variability of corn yield well at within-field after verification (R2 = 0.62, RMSE = 0.36 t/ha) [56]. Finally, we obtained the corn yield for all the strips by applying this linear model to remote-sensing images with a resolution of 10 m.

2.3.3. Quantification of Yield Increment

We used the yield profile, i.e., the yield variation along with the distance to the shelterbelt, to quantify the yield increment of the shelterbelt [57]. Given the various corn yields among different shelterbelts, the raw yield profile was rescaled into the relative yield profile. Specifically, the x-axis was relative distance, which is expressed as the ratio of the real distance to H (H: tree height, 20 m for the cutting shelterbelt). The y-axis was relative yield, which is expressed as the ratio of the real yield to the yield that cannot be affected by the shelterbelt. The impact of shelterbelts on crop yield decreased with distance. Previous studies (e.g., Brandle et al. [58] and Bao et al. [59]) found that the yield increase effect almost disappeared at 15–20 H. Accordingly, we set the average crop yield at 15–20 H away from the shelterbelt as the baseline yield without the shelterbelt effect to calculate the relative yield profile. As the distance within 0.5 H was normally the machine-cultivated track and rarely planted, the yield data in this range were excluded during the calculation of the total impact of shelterbelt on corn yield.

2.3.4. Statistical Analysis

We compared the yield increment along the shelterbelt distance to quantify the yield increase effect. We conducted such comparisons for pre- and post-cutting. Pre-cutting represents conditions affected by both microclimate and soil, while post-cutting represents soil effect only, namely the legacy effect. Therefore, the difference between pre- and post-cutting with reference to crop yield is the microclimate effect.
Given that the shelterbelt–farmland relative location and shelterbelt structure could significantly affect the shelterbelt-induced yield increase effect [15,60], we further analyzed the dependency of the legacy effect on leeward/windward sides and shelterbelt density. Specifically, all the shelterbelts were classified into four density levels following the previous study [56]: high density (SW ≥ 20 m and RG ≤ 5%), medium–high density (SW ≥ 15 m and RG ≤ 10%), medium density (SW ≥ 10 m and RG ≤ 15%), and low density (SW ≥ 5 m and RG ≤ 20%), where SW and GF represent the shelterbelt width and the ratio of gap length to shelterbelt length. In addition, we divided the corn strips into leeward (north-northeast) and windward (south-southwest) groups based on the dominant wind direction (south-southwest) in the study area [61]. Then, we classified the yield-distance dataset into different subsets by four shelterbelt density groups and two leeward/windward side groups both before and after shelterbelt-cutting. For each subset, we fitted all yield–distance data into one yield profile using the generalized additive model [1] and converted it into the relative yield profile to calculate the yield increment both before and after shelterbelt-cutting. We also conducted a test for statistical significance for the yield increment effect within 0.5–15 H compared to the crop yield within 15–20 H for each subset (Figure S1).

3. Results and Discussion

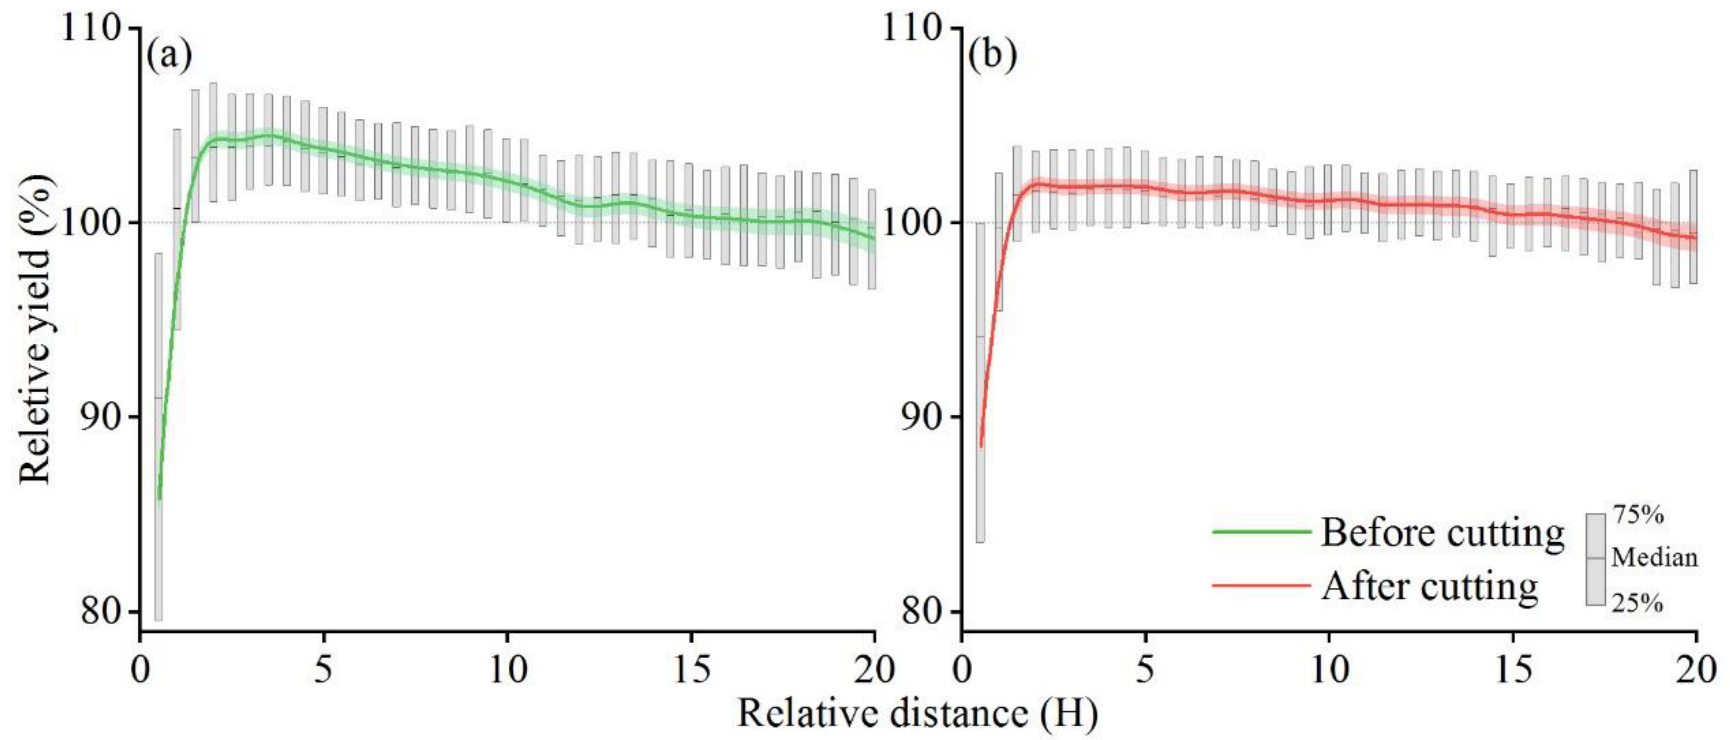
3.1. Profound Legacy Effect of Post-Cutting Shelterbelt

We found a strong legacy effect of the shelterbelt on crop yield across the study area (Figure 3). Before shelterbelt cutting, the minimum relative corn yield of 85.9% appears at 0.5 H from the shelterbelt (Figure 3a). The corn yield then increases rapidly at a distance of 2 H and maintains a high level at 2–5 H (H: tree high). The maximum relative yield is 104.6% at 3.6 H. Beyond 5 H, the corn yield starts to decline until 15 H. Overall, the existence of the shelterbelt increases corn yield by 2.09 ± 0.04% (mean ± standard error, the same below). After shelterbelt-cutting (Figure 3b), the shape of the yield profile is similar to that before shelterbelt-cutting. A yield increment still appears between 2 and 15 H, but to a smaller extent, representing the legacy effect of a post-cutting shelterbelt. The minimum and maximum relative corn yields appear at 0.5 and 3.7 H, with values of 88.5% and 102.0%, respectively. Overall, the average yield variation at 0.5–15 H, namely the intensity of the legacy effect, is 0.98 ± 0.03%. As mentioned in the introduction, this legacy effect is likely the result of lingering effects on soil properties [21,62]. The accumulated improvement of farmland soil structure and soil quality caused by shelterbelts could still partly remain after cutting [24,26]. Thus, the post-cutting shelterbelt still had a positive effect on the adjacent farmland’s crop yield.

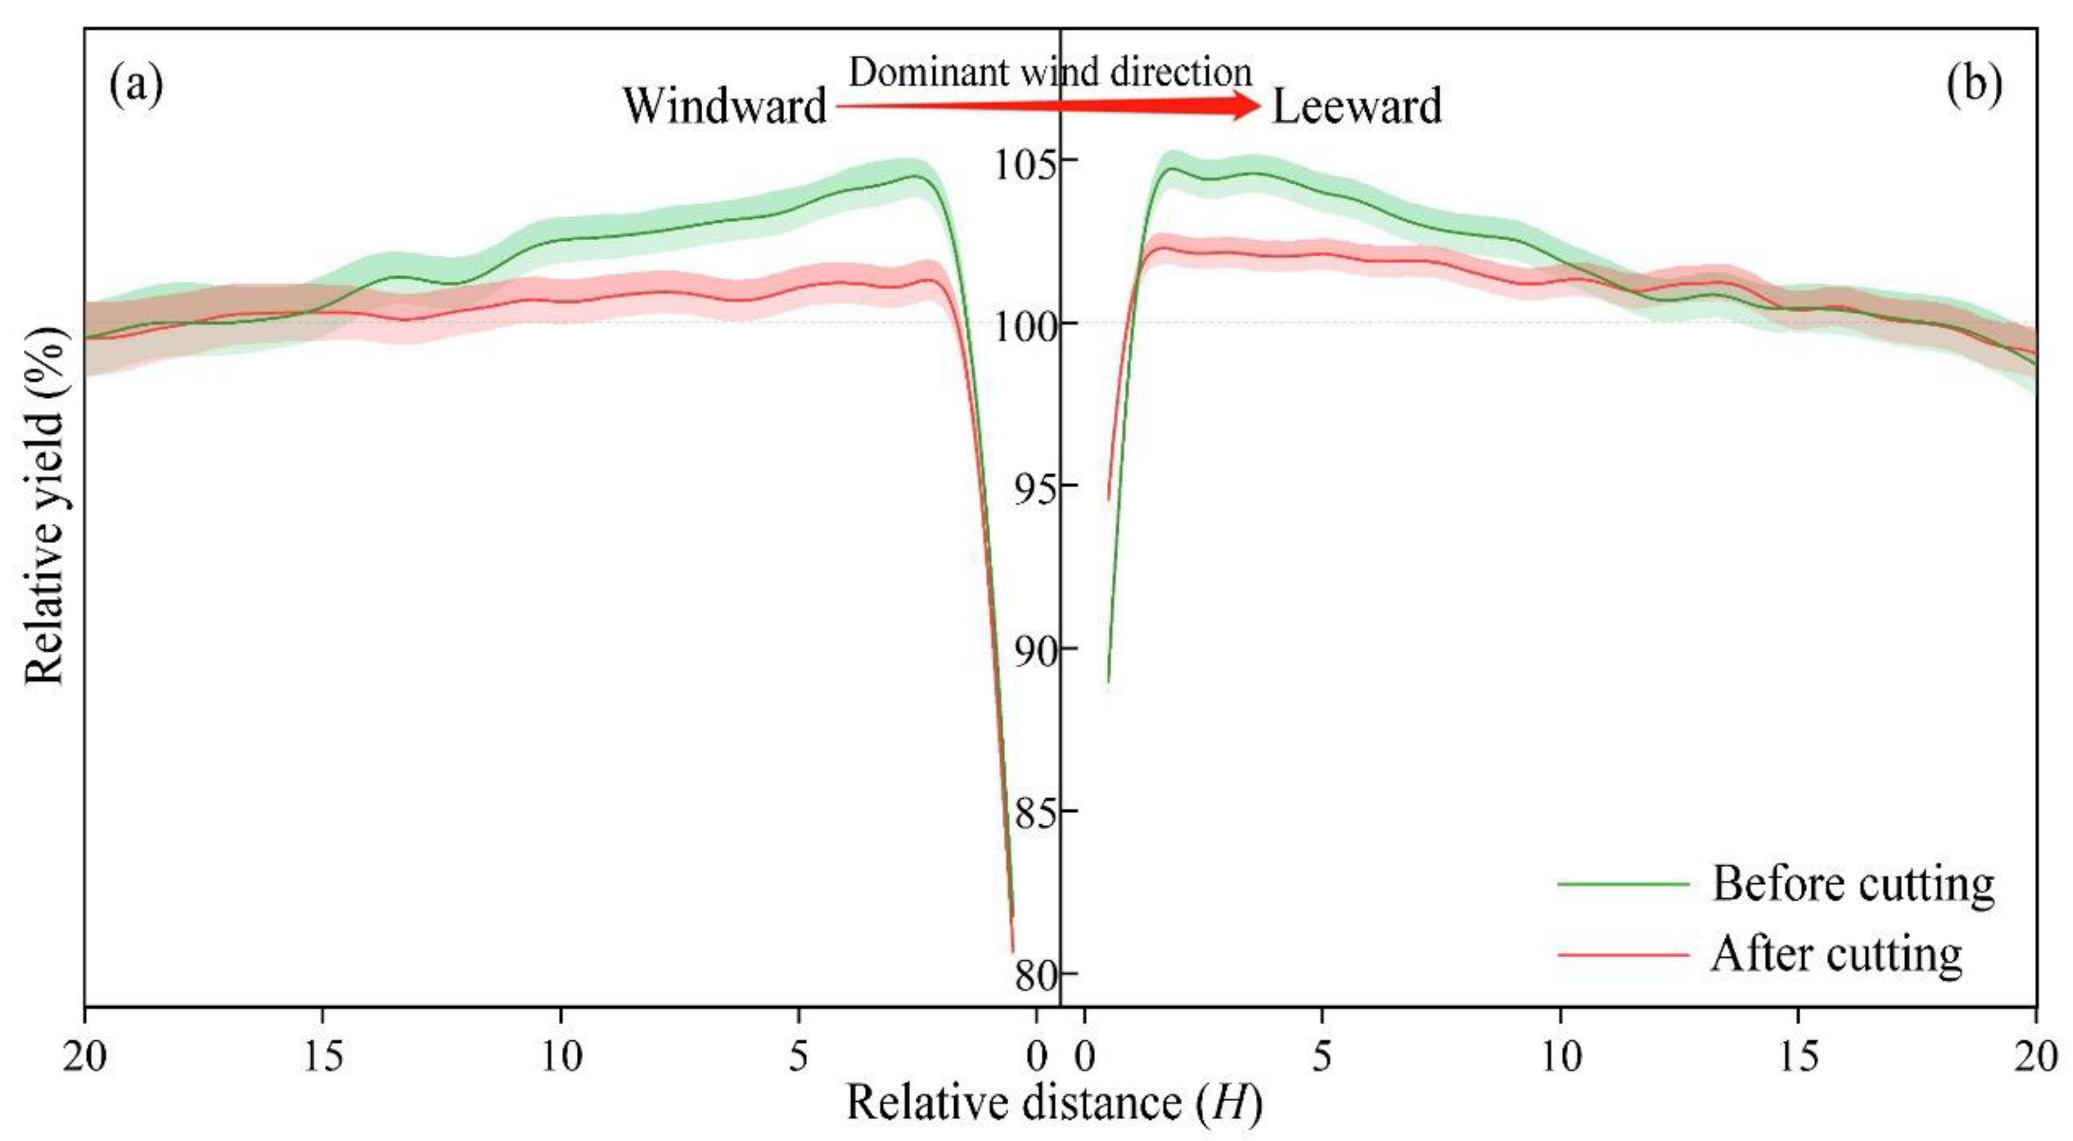
3.2. Stronger Legacy Effect on the Leeward Sides

The location between the shelterbelt and farmland relative to the main wind direction is an important factor affecting the yield increment and legacy effect of the shelterbelt (Figure 4). Before shelterbelt-cutting, the yield profiles on the leeward and windward sides are similar, but the magnitude of the yield increase on the leeward side (peak at 104.8% at 1.8 H) is slightly higher than the windward side (peak at 104.5% at 2.5 H). The minimum relative yield on the leeward side (89.0%) is higher than the windward side (81.8%). After shelterbelt-cutting, the yield increase effect on the leeward side is much larger than that on the windward side, namely a significant larger legacy effect on the leeward side. The relative yield on the leeward side reaches a higher peak of 102.4% at 1.7 H compared to that on the windward side (101.5% at 2.3 H), whereas the minimum relative yield on the leeward side (94.1%) is higher than the windward side (81.0%). On average, before shelterbelt-cutting, the yield increment on the leeward and windward strips are 2.39 ± 0.04% and 1.89 ± 0.06%, respectively. After the shelterbelt-cutting, the yield increase on the leeward side still increases by 1.52 ± 0.04%, presenting a stronger legacy effect compared to that from the windward side (0.01 ± 0.05%). Previous studies [63,64] found the soil environment on the leeward farmland was more conducive to crop growth, compared to windward farmland, mainly because the shelterbelt effectively reduced soil erosion on leeward farmland by blocking the wind-drift sand. This could explain the stronger legacy effect on the leeward farmland than the windward.

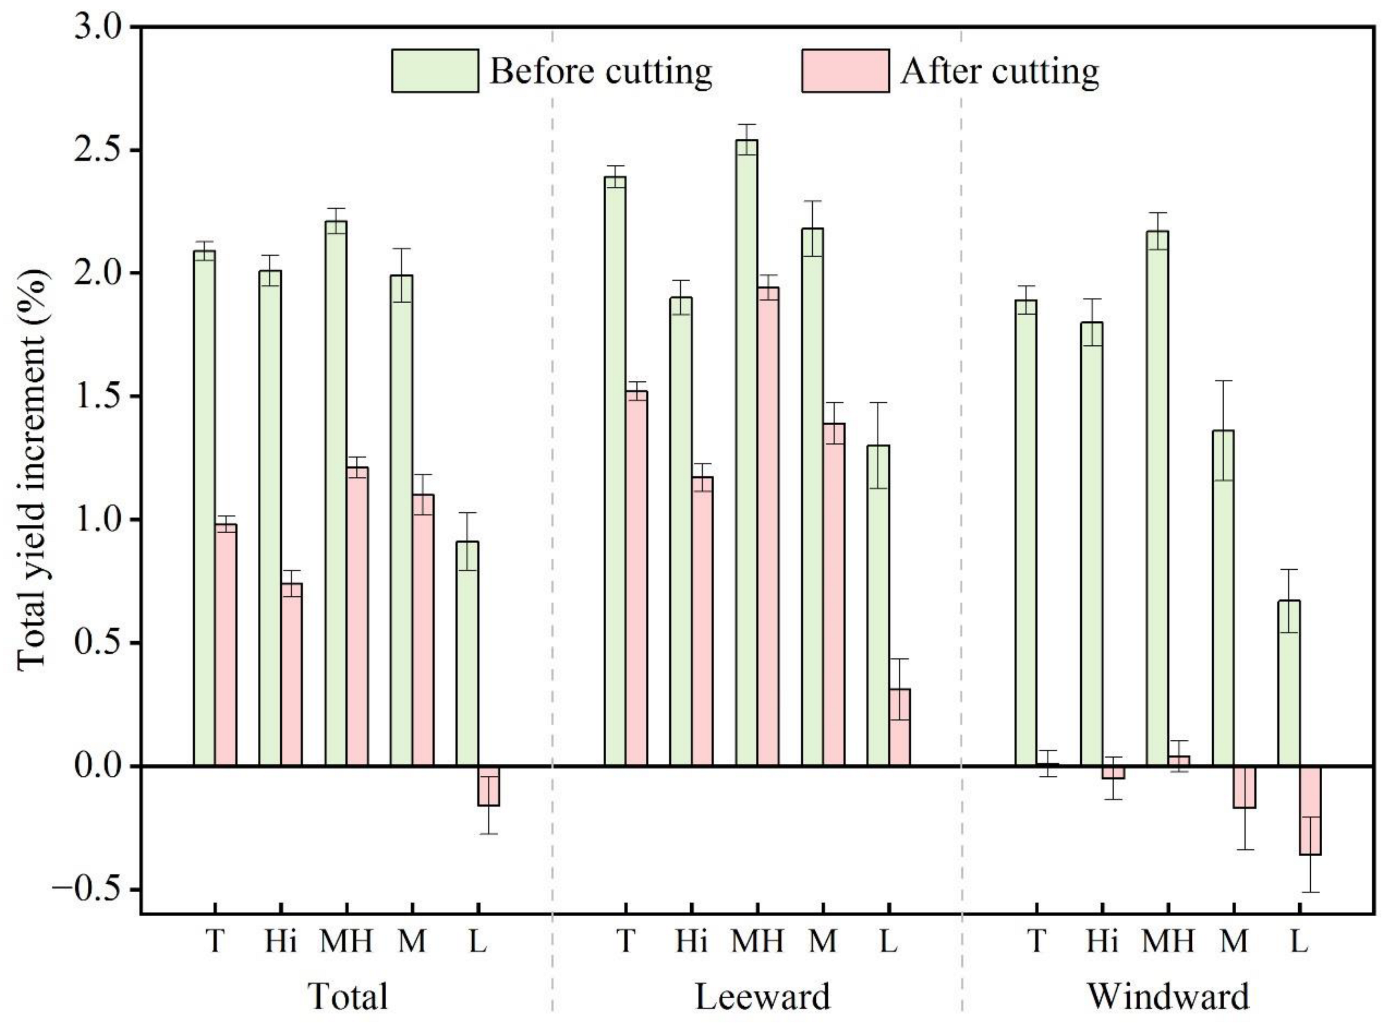
3.3. The Variation of Legacy Effect of Shelterbelt across Its Density

The yield increment and legacy effect induced by the shelterbelt are affected by its density (Figure 5). Before shelterbelt cutting, a shelterbelt with medium–high density has the highest yield increment (2.21 ± 0.05%), followed by high (2.01 ± 0.06%), medium (1.99 ± 0.11%), and low density (0.91 ± 0.12%). The legacy effect of the post-cutting shelterbelt has the same order as the yield increment with density. After shelterbelt-cutting, the medium-high density shelterbelt remains the class with the largest yield increment (1.21 ± 0.04%), followed by medium- (1.1 ± 0.08%) and high- (0.74 ± 0.05%) density. The influence of post-cutting low density shelterbelt on corn yield is not statistically significant (the results of the test for statistical significance among all groups are shown in Figure S1).
Shelterbelt density affected the yield increment and legacy effect on both the leeward and windward sides. Before shelterbelt-cutting, all densities of shelterbelts on both leeward and windward sides show significant yield increments. The yield increments under different shelterbelt densities are in the order of medium–high (2.54 ± 0.06%), medium (2.18 ± 0.11%), high (1.90 ± 0.07%), and low (1.30 ± 0.17%) on the leeward side, whereas the order is medium–high (2.17 ± 0.07%), high (1.80 ± 0.10%), medium (1.36 ± 0.20%), and low (0.67 ± 0.31%) on the windward side. After shelterbelt cutting, the leeward side still retains part of the yield increment with the order of medium–high (1.94 ± 0.05%), medium- (1.39 ± 0.08%), and high-density (1.17 ± 0.06%), but the legacy effect on low density shelterbelts is not significant. For the windward side, the yield increment across all densities is not significant (Figure S1). Overall, the legacy effect on the leeward side is stronger than on the windward for all shelterbelt densities. Shelterbelts with high-, medium–high, and medium densities have significant legacy effects, but the legacy effect of low-density shelterbelts is minor.
Shelterbelt density is closely related to wind speed, which could change crop evapotranspiration and farmland soil erosion and thus affect crop yield [20,65]. Many previous studies [16,56] had reported the significant impact of shelterbelt density on crop yield. Our results further indicated that the variation pattern of shelterbelt density on yield increase effect also applied to the legacy effect.

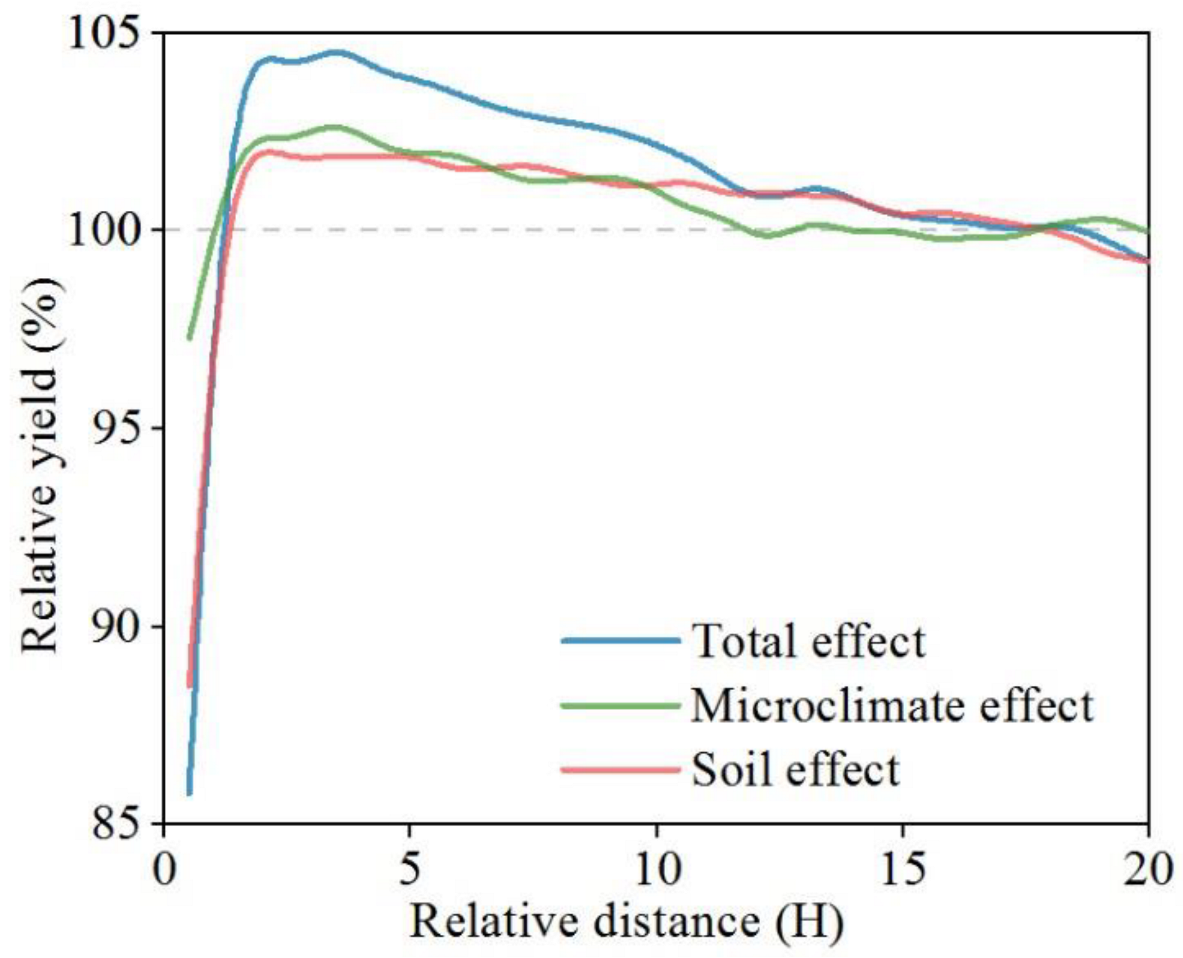
3.4. Decompose the Microclimate and Soil Effects from the Total Yield Effect

Our results quantified a significant legacy effect of post-cutting shelterbelts on crop yield. As was mentioned in the introduction, this legacy effect is likely the result of lingering effects on soil properties instead of the microclimate effect, which becomes homogenous after shelterbelt cutting [66,67,68,69]. The yield increment before shelterbelt cutting is the synergy of both the microclimate and soil effects of the shelterbelt (i.e., total yield effect). Thus, we can decompose the microclimate and soil yield effects from the total yield effect by comparing the yield profiles before and after shelterbelt cutting.
Figure 6 shows the comparison of the yield profiles of microclimate and soil effects after decomposition. In general, the contribution of the microclimate effect (53%) is slightly larger than the soil effect (47%). Both effects present a contrasting pattern before and after a certain distance from the shelterbelt, with suppression and conducive effects for the former and the latter, respectively. For the microclimate effect, the yield reduction within 1 H is likely caused by the shelterbelt shading [70]. In the distance range of 1–12 H, the reduced wind speed, reduced temperature, and increased humidity conditions mitigate crop evapotranspiration and thus increase the water use efficiency, contributing to the increase of crop yield [20]. For the soil effect, the decrease in crop yield within 1.2 H is likely caused by the root competition from the shelterbelt [71]. The increase in crop yield within 1.2–15 H is the result of the soil nutrient inheritance and the increase of soil microbial biomass [24,25,26,72].
These findings can help us to understand the shelterbelt–crop interaction and provide a new perspective on agroforestry ecosystem research. Although the soil effect was found to be an important mechanism for crop yield through the study of the legacy effect, investigations into the influence of shelterbelts on farmland soil properties are rare [23] compared to a large number of shelterbelt-induced microclimate observation studies [1,12,65]. The existing models [16,19,71] mainly consider the microclimate effect on crop yield but ignore the shelterbelt-induced soil effect and its impact on yield, leading to an underestimation. It is necessary to conduct the investigation of soil structure and composition on the shelterbelt-adjacent farmland so as to provide a soil parameterization scheme for the models. In addition, given the important influence of shelterbelt density on the yield increase effect (before shelterbelt cutting) and the yield legacy effect (after shelterbelt-cutting), it is necessary to take management measures to regulate the shelterbelt density (such as thinning the over-dense shelterbelt and replanting seedlings to fill the shelterbelt gap) to maximize the shelterbelt-induced yield increase effect [40,56].

4. Conclusions

This study revealed a strong legacy effect of post-cutting shelterbelt on corn yield through remote sensing data of 10 m and a decomposition of the shelterbelt-induced yield increase effect into microclimate and soil effects. On average, the post-cutting shelterbelt had a legacy effect with an intensity of 0.98 ± 0.03%. The legacy effect varied with the shelterbelt–farmland relative location and shelterbelt density. The legacy effect on the leeward side was higher than the windward side. Shelterbelts with medium–high density had the greatest legacy effect, which may be the optimum shelterbelt structure, followed by medium and high density. The contributions of microclimate and soil effects are comparable when it comes to increasing crop yield. Overall, our study verified the legacy effect of post-cutting shelterbelts at a regional scale, achieved the decomposition of microclimate effects and soil effects, and revealed the mechanism by which shelterbelts affect crop yield. It can guide the shelterbelt regeneration practice and development of shelterbelt–farmland models. In addition, our study mainly examines the legacy effect of the shelterbelt in the short period after shelterbelt removal. For accurate management of shelterbelt regeneration, it is also worth studying how long it takes for changes in the soil to occur and disappear.

Supplementary Materials

The following supporting information can be downloaded at: https://www.mdpi.com/article/10.3390/rs14195005/s1, Figure S1: The significant difference of yield increment of shelterbelt before (a) and after (b) cutting. The control group is the average relative yield within the distance of 15 to 20 H that is not affected by the shelterbelt. Error bar represent the standard error. The star symbol means the yield increment has significant difference (p < 0.05) from the control group. The x-axis represents the shelterbelt classification (T: all densities, Hi: high density, M-H: medium-high density, M: medium density, L: low density).

Author Contributions

Conceptualization, methodology, formal analysis, visualization, investigation, writing—original draft, Y.L.; conceptualization, methodology, writing—review and editing, H.L.; conceptualization, resources, writing—review and editing, M.W.; supervision, project administration, funding acquisition, writing—review and editing, A.W.; project administration, data curation, funding acquisition, writing—review and editing, J.W.; methodology, writing—review and editing, D.G. All authors have read and agreed to the published version of the manuscript.

Funding

This work was supported by the National Key Research and Development Program of China (2022YFF1300501), the Major Program of Institute of Applied Ecology, Chinese Academy of Sciences (Grant No. IAEMP202201), and the National Natural Science Foundation of China (32171873). M.W. is supported by the Swedish National Space Agency (SNSA) under grant Dnr 2021-00111.

Data Availability Statement

All the data supporting the conclusions of this article are included within the article and its additional files.

Conflicts of Interest

The authors declare no conflict of interest.

References

  1. Baker, T.P.; Moroni, M.T.; Hunt, M.A.; Worledge, D.; Mendham, D.S. Temporal, environmental and spatial changes in the effect of windbreaks on pasture microclimate. Agric. For. Meteorol. 2021, 297, 10. [Google Scholar] [CrossRef]
  2. Weninger, T.; Scheper, S.; Lackóová, L.; Kitzler, B.; Gartner, K.; King, N.W.; Cornelis, W.; Strauss, P.; Michel, K. Ecosystem services of tree windbreaks in rural landscapes—A systematic review. Environ. Res. Lett. 2021, 16, 103002. [Google Scholar] [CrossRef]
  3. Yuan, F.; Wu, J.; Wang, A.; Guan, D.; Zhang, Y.; Rajah-Boyer, K.I.; Xu, X. A semiempirical model for horizontal distribution of surface wind speed leeward windbreaks. Agrofor. Syst. 2020, 94, 499–516. [Google Scholar] [CrossRef]
  4. Grala, R.K.; Colletti, J.P. Estimates of additional Maize (Zea mays) yields required to offset costs of tree-windbreaks in Midwestern USA. Agrofor. Syst. 2003, 59, 11–20. [Google Scholar] [CrossRef]
  5. Osorio, R.J.; Barden, C.J.; Ciampitti, I.A. GIS approach to estimate windbreak crop yield effects in Kansas-Nebraska. Agrofor. Syst. 2019, 93, 1567. [Google Scholar] [CrossRef] [Green Version]
  6. Zheng, X.; Zhu, J.; Xing, Z. Assessment of the effects of shelterbelts on crop yields at the regional scale in Northeast China. Agric. Syst. 2016, 143, 49–60. [Google Scholar] [CrossRef]
  7. Li, T.S. Protecting the Breadbasket with Trees? The Effect of the Great Plains Shelterbelt Project on Agriculture. Land Econ. 2021, 97, 321–344. [Google Scholar] [CrossRef]
  8. Hoenig, B. In the name of the great work Stalin’s plan for the transformation of nature and its impact in eastern Europe. Rev. D Etudes Comp. Est-Ouest 2018, 49, 253–256. [Google Scholar] [CrossRef]
  9. Yu, K.J.; Li, D.H.; Li, N.Y. The evolution of Greenways in China. Landsc. Urban Plan. 2006, 76, 223–239. [Google Scholar] [CrossRef]
  10. Gardner, R. Trees as technology: Planting shelterbelts on the Great Plains. Hist. Technol. 2009, 25, 325–341. [Google Scholar] [CrossRef]
  11. Brain, S. The Great Stalin Plan for the transformation of nature. Environ. Hist. 2010, 15, 670–700. [Google Scholar] [CrossRef]
  12. Kanzler, M.; Bohm, C.; Mirck, J.; Schmitt, D.; Veste, M. Microclimate effects on evaporation and winter wheat (Triticum aestivum L.) yield within a temperate agroforestry system. Agrofor. Syst. 2019, 93, 1821–1841. [Google Scholar] [CrossRef]
  13. Smith, M.M.; Bentrup, G.; Kellerman, T.; MacFarland, K.; Straight, R.; Ameyaw, L. Windbreaks in the United States: A systematic review of producer-reported benefits, challenges, management activities and drivers of adoption. Agric. Syst. 2021, 187, 103032. [Google Scholar] [CrossRef]
  14. Guan, D.X.; Zhong, Y.; Jin, C.J.; Wang, A.Z.; Wu, J.B.; Shi, T.T.; Zhu, T.Y. Variation in wind speed and surface shear stress from open floor to porous parallel windbreaks: A wind tunnel study. J. Geophys. Res. Atmos. 2009, 114, 13. [Google Scholar] [CrossRef] [Green Version]
  15. Kuemmel, B. Theoretical investigation of the effects of field margin and hedges on crop yields. Agric. Ecosyst. Environ. 2003, 95, 387–392. [Google Scholar] [CrossRef]
  16. Iwasaki, K.; Torita, H.; Touze, M.; Wada, H.; Abe, T. Modeling optimal windbreak design in maise fields in cool humid climates: Balancing between positive and negative effects on yield. Agric. For. Meteorol. 2021, 308, 108552. [Google Scholar] [CrossRef]
  17. Arnaiz-Schmitz, C.; Herrero-Jauregui, C.; Schmitz, M.F. Losing a heritage hedgerow landscape. Biocultural diversity conservation in a changing social-ecological Mediterranean system. Sci. Total Environ. 2018, 637, 374–384. [Google Scholar] [CrossRef]
  18. Nelmes, S.; Belcher, R.E.; Wood, C.J. A method for routine characterisation of shelterbelts. Agric. For. Meteorol. 2001, 106, 303–315. [Google Scholar] [CrossRef]
  19. Peri, P.L.; Bloomberg, M. Windbreaks in southern Patagonia, Argentina: A review of research on growth models, windspeed reduction, and effects on crops. Agrofor. Syst. 2002, 56, 129–144. [Google Scholar] [CrossRef]
  20. Campi, P.; Palumbo, A.D.; Mastrorilli, M. Effects of tree windbreak on microclimate and wheat productivity in a Mediterranean environment. Eur. J. Agron. 2009, 30, 220–227. [Google Scholar] [CrossRef]
  21. Chendev, Y.G.; Gennadiev, A.N.; Lukin, S.V.; Sauer, T.J.; Zazdravnykh, E.A.; Belevantsev, V.G.; Smirnova, M.A. Change of Forest-Steppe Chernozems under the Influence of Shelterbelts in the South of the Central Russian Upland. Eurasian Soil Sci. 2020, 53, 1033–1045. [Google Scholar] [CrossRef]
  22. Amichev, B.Y.; Laroque, C.P.; Van Rees, K.C.J. Shelterbelt removals in Saskatchewan, Canada: Implications for long-term carbon sequestration. Agrofor. Syst. 2020, 94, 1665–1680. [Google Scholar] [CrossRef]
  23. Van Den Berge, S.; Vangansbeke, P.; Baeten, L.; Vanneste, T.; Vos, F.; Verheyen, K. Soil carbon of hedgerows and ‘ghost’ hedgerows. Agrofor. Syst. 2021, 95, 1087–1103. [Google Scholar] [CrossRef]
  24. Drexler, S.; Gensior, A.; Don, A. Carbon sequestration in hedgerow biomass and soil in the temperate climate zone. Reg. Environ. Change 2021, 21, 14. [Google Scholar] [CrossRef]
  25. Rivest, M.; Whalen, J.K.; Rivest, D. Variation of soil microbial and earthworm communities along an agricultural transect with tree windbreak. Agrofor. Syst. 2020, 94, 1639–1649. [Google Scholar] [CrossRef]
  26. Rudd, L.; Kulshreshtha, S.; Belcher, K.; Amichev, B. Carbon life cycle assessment of shelterbelts in Saskatchewan, Canada. J. Environ. Manag. 2021, 297, 11. [Google Scholar] [CrossRef]
  27. Karg, J.; Kajak, A.; Ryszkowski, L. Impact of young shelterbelts on organic matter content and development of microbial and faunal communities of adjacent fields. Pol. J. Ecol. 2003, 51, 283–290. [Google Scholar]
  28. Rivest, D.; Lorente, M.; Olivier, A.; Messier, C. Soil biochemical properties and microbial resilience in agroforestry systems: Effects on wheat growth under controlled drought and flooding conditions. Sci. Total Environ. 2013, 463, 51–60. [Google Scholar] [CrossRef]
  29. Canarini, A.; Schmidt, H.; Fuchslueger, L.; Martin, V.; Herbold, C.W.; Zezula, D.; Gundler, P.; Hasibeder, R.; Jecmenica, M.; Bahn, M.; et al. Ecological memory of recurrent drought modifies soil processes via changes in soil microbial community. Nat. Commun. 2021, 12, 5308. [Google Scholar] [CrossRef]
  30. Francis, J.L.; Andrew, F.O. Wheat yield and soil properties reveal legacy effects of artificial erosion and amendments on a dryland Dark Brown Chernozem. Can. J. Soil Sci. 2018, 98, 663–677. [Google Scholar] [CrossRef] [Green Version]
  31. Gabbarini, L.A.; Figuerola, E.; Frene, J.P.; Robledo, N.B.; Ibarbalz, F.M.; Babin, D.; Smalla, K.; Erijman, L.; Wall, L.G. Impacts of switching tillage to no-tillage and vice versa on soil structure, enzyme activities and prokaryotic community profiles in Argentinean semi-arid soils. FEMS Microbiol. Ecol. 2021, 97, fiab025. [Google Scholar] [CrossRef] [PubMed]
  32. Lapsansky, E.R.; Milroy, A.M.; Andales, M.J.; Vivanco, J.M. Soil memory as a potential mechanism for encouraging sustainable plant health and productivity. Curr. Opin. Biotechnol. 2016, 38, 137–142. [Google Scholar] [CrossRef] [PubMed]
  33. Cardinael, R.; Chevallier, T.; Cambou, A.; Beral, C.; Barthes, B.G.; Dupraz, C.; Durand, C.; Kouakoua, E.; Chenu, C. Increased soil organic carbon stocks under agroforestry: A survey of six different sites in France. Agric. Ecosyst. Environ. 2017, 236, 243–255. [Google Scholar] [CrossRef] [Green Version]
  34. Lorenz, K.; Lal, R. Soil organic carbon sequestration in agroforestry systems. A review. Agron. Sustain. Dev. 2014, 34, 443–454. [Google Scholar] [CrossRef] [Green Version]
  35. Smirnova, M.A.; Gennadiev, A.N.; Chendev, Y.G.; Kovach, R.G. Influence of Forest Shelterbelts on Local Pedodiversity (Belgorod Oblast). Eurasian Soil Sci. 2020, 53, 1195–1205. [Google Scholar] [CrossRef]
  36. Yu, T.; Liu, P.J.; Zhang, Q.; Ren, Y.; Yao, J.N. Detecting Forest Degradation in the Three-North Forest Shelterbelt in China from Multi-Scale Satellite Images. Remote Sens. 2021, 13, 1131. [Google Scholar] [CrossRef]
  37. Wang, H.; He, M.Y.; Ran, N.; Xie, D.; Wang, Q.; Teng, M.J.; Wang, P.C. China’s Key Forestry Ecological Development Programs: Implementation, Environmental Impact and Challenges. Forests 2021, 12, 101. [Google Scholar] [CrossRef]
  38. Wu, Z.; Yu, L.; Zhang, X.; Du, Z.; Zhang, H. Satellite-based large-scale vegetation dynamics in ecological restoration programmes of Northern China. Int. J. Remote Sens. 2019, 40, 2296–2312. [Google Scholar] [CrossRef]
  39. Zhu, J.J.; Zheng, X. The prospects of development of the Three-North Afforestation Program (TNAP): On the basis of the results of the 40-year construction general assessment of the TNAP. Chin. J. Ecol. 2019, 38, 1600–1610. [Google Scholar]
  40. Zhu, J.J.; Song, L.N. A review of ecological mechanisms for management practices of protective forests. J. For. Res. 2021, 32, 435–448. [Google Scholar] [CrossRef]
  41. Burke, M.W.V.; Rundquist, B.C.; Zheng, H.C. Detection of Shelterbelt Density Change Using Historic APFO and NAIP Aerial Imagery. Remote Sens. 2019, 11, 218. [Google Scholar] [CrossRef] [Green Version]
  42. Iwasaki, K.; Torita, H.; Abe, T.; Uraike, T.; Touze, M.; Fukuchi, M.; Sato, H.; Iijima, T.; Imaoka, K.; Igawa, H. Spatial pattern of windbreak effects on maize growth evaluated by an unmanned aerial vehicle in Hokkaido, northern Japan. Agrofor. Syst. 2019, 93, 1133–1145. [Google Scholar] [CrossRef]
  43. Deng, R.X.; Wang, W.J.; Li, Y.; Shi, X.L.; Wei, Y.C.; Hao, L.J.; Li, C.J.; Liu, W.Y. Analysis of changes in shelterbelt landscape in northeast China. Appl. Ecol. Environ. Res. 2019, 17, 11655–11668. [Google Scholar] [CrossRef]
  44. Niu, Q.; Li, X.; Huang, J.; Huang, H.; Huang, X.; Su, W.; Yuan, W. A 30-m annual maize phenology dataset from 1985 to 2020 in China. Earth Syst. Sci. Data Discuss. 2022, 14, 2851–2864. [Google Scholar] [CrossRef]
  45. Tang, X.P.; Xie, S.X.; Cui, W.S.; Wang, C.H.; Chen, Y.; Yuan, S.Q.; Wen, G.Q.; Zhou, J.M.; Chen, X.L.; Liu, J.J. Operational Regulation of Harvesting of Farmland Shelterbelt Forest; Standards Press of China: Beijing, China, 2008; Volume LY/T 1723–2008, pp. 1–16. [Google Scholar]
  46. Zhao, Q.; Yu, L.; Li, X.C.; Peng, D.L.; Zhang, Y.G.; Gong, P. Progress and Trends in the Application of Google Earth and Google Earth Engine. Remote Sens. 2021, 13, 3778. [Google Scholar] [CrossRef]
  47. Drusch, M.; Del Bello, U.; Carlier, S.; Colin, O.; Fernandez, V.; Gascon, F.; Hoersch, B.; Isola, C.; Laberinti, P.; Martimort, P.; et al. Sentinel-2: ESA’s Optical High-Resolution Mission for GMES Operational Services. Remote Sens. Environ. 2012, 120, 25–36. [Google Scholar] [CrossRef]
  48. Kayad, A.; Sozzi, M.; Gatto, S.; Marinello, F.; Pirotti, F. Monitoring Within-Field Variability of Corn Yield using Sentinel-2 and Machine Learning Techniques. Remote Sens. 2019, 11, 2873. [Google Scholar] [CrossRef] [Green Version]
  49. Tristan, A.C.; Cardenas, O.R.; Garza, E.J.T.; Alvarado, A.G.R.; Putri, R.F.; Thio, J. Catalogue of representative scales to visualize different coverages in Google Earth. In Proceedings of the International Conference on Smart and Innovative Agriculture (ICoSIA), Online, 3–4 November 2021; IOP Publishing Ltd.: Bristol, UK, 2021; Volume 686. [Google Scholar]
  50. Weiss, M.; Baret, F. S2ToolBox Level 2 Products: LAI, FAPAR, FCOVER, Version 1.1. In ESA Contract nr 4000110612/14/I-BG; INRA Avignon: Paris, France, 2016; p. 52. [Google Scholar]
  51. Endris, S. Combined Application of Phosphorus Fertilizer with Tithonia Biomass Improves Grain Yield and Agronomic Phosphorus Use Efficiency of Hybrid Maize. Int. J. Agron. 2019, 2019, 6167384. [Google Scholar] [CrossRef] [Green Version]
  52. Guindin-Garcia, N. Estimating Maize Grain Yield from Crop Biophysical Parameters Using Remote Sensing; The University of Nebraska-Lincoln: Lincoln, Nebraska, 2011. [Google Scholar]
  53. Lambert, M.J.; Traore, P.C.S.; Blaes, X.; Baret, P.; Defourny, P. Estimating smallholder crops production at village level from Sentinel-2 time series in Mali’s cotton belt. Remote Sens. Environ. 2018, 216, 647–657. [Google Scholar] [CrossRef]
  54. Jin, X.L.; Li, Z.H.; Feng, H.K.; Ren, Z.B.; Li, S.K. Deep neural network algorithm for estimating maize biomass based on simulated Sentinel 2A vegetation indices and leaf area index. Crop J. 2020, 8, 87–97. [Google Scholar] [CrossRef]
  55. Skakun, S.; Kalecinski, N.I.; Brown, M.G.L.; Johnson, D.M.; Vermote, E.F.; Roger, J.C.; Franch, B. Assessing within-Field Corn and Soybean Yield Variability from WorldView-3, Planet, Sentinel-2, and Landsat 8 Satellite Imagery. Remote Sens. 2021, 13, 872. [Google Scholar] [CrossRef]
  56. Liu, Y.; Li, H.; Yuan, F.; Shen, L.; Wu, M.; Li, W.; Wang, A.; Wu, J.; Guan, D. Estimating the impact of shelterbelt structure on corn yield at a large scale using Google Earth and Sentinel 2 data. Environ. Res. Lett. 2022, 17, 004060. [Google Scholar] [CrossRef]
  57. Kort, J. Benefits of windbreaks of windbreaks to field and forage crops. Agric. Ecosyst. Environ. 1988, 22–23, 165–190. [Google Scholar] [CrossRef]
  58. Brandle, J.R.; Hodges, L.; Zhou, X.H. Windbreaks in North American agricultural systems. In New Vistas in Agroforestry: A Compendium for 1st World Congress of Agroforestry; Nair, P.K.R., Rao, M.R., Buck, L.E., Eds.; Springer: Dordrecht, The Netherlands, 2004. [Google Scholar]
  59. Bao, Y.H.; Li, H.Y.; Zhao, H.F. Effect of shelterbelts on winter wheat yields in sanded farmland of north-western Shandong province, China. J. Food Agric. Environ. 2012, 10, 1399–1403. [Google Scholar]
  60. Sun, Q.M.; Zheng, B.; Liu, T.; Zhu, L.K.; Hao, X.R.; Han, Z.Q. The optimal spacing interval between principal shelterbelts of the farm-shelter forest network. Environ. Sci. Pollut. Res. 2022, 29, 12680–12693. [Google Scholar] [CrossRef]
  61. Zhu, J.J.; Matsuzaki, T.; Lee, F.Q.; Gonda, Y. Effect of gap size created by thinning on seedling emergency, survival and establishment in a coastal pine forest. For. Ecol. Manag. 2003, 182, 339–354. [Google Scholar] [CrossRef]
  62. Zhu, M.N.; Cao, X.D.; Guo, Y.F.; Shi, S.; Wang, W.J.; Wang, H.M. Soil P components and soil fungi community traits in poplar shelterbelts and neighboring farmlands in northeastern China: Total alterations and complex associations. Catena 2022, 218, 106531. [Google Scholar] [CrossRef]
  63. Li, F.R.; Zhang, H.; Zhao, L.Y.; Shirato, Y.; Wang, X.Z. Pedoecological effects of a sand-fixing poplar (Populus simonii Carr.) forest in a desertified sandy land of Inner Mongolia, China. Plant Soil 2003, 256, 431–442. [Google Scholar] [CrossRef]
  64. Nordstrom, K.F.; Hotta, S. Wind erosion from cropland solutions in the USA: A review of problems, and prospects. Geoderma 2004, 121, 157–167. [Google Scholar] [CrossRef]
  65. Barcic, D.; Habjanec, V.; Spanjol, Z.; Sango, M. Analysis of raising windbreaks on the mediterranean Karst of Croatia. Sumar. List. 2021, 145, 175–183. [Google Scholar] [CrossRef]
  66. Jonsson, P. Wind erosion on suger-beet fields in scania, southern sweden. Agric. For. Meteorol. 1992, 62, 141–157. [Google Scholar] [CrossRef]
  67. Li, H.D.; Claremar, B.; Wu, L.C.; Hallgren, C.; Kornich, H.; Ivanell, S.; Sahlee, E. A sensitivity study of the WRF model in offshore wind modeling over the Baltic Sea. Geosci. Front. 2021, 12, 14. [Google Scholar] [CrossRef]
  68. Meng, L.; Wang, C.Y.; Zhang, J.Q. Heat Injury Risk Assessment for Single-Cropping Rice in the Middle and Lower Reaches of the Yangtze River under Climate Change. J. Meteorol. Res. 2016, 30, 426–443. [Google Scholar] [CrossRef]
  69. Sanchez, I.A.; Lassaletta, L.; McCollin, D.; Bunce, R.G.H. The effect of hedgerow loss on microclimate in the Mediterranean region: An investigation in Central Spain. Agrofor. Syst. 2010, 78, 13–25. [Google Scholar] [CrossRef]
  70. Ding, S.; Su, P. Effects of tree shading on maize crop within a Poplar-maize compound system in Hexi Corridor oasis, northwestern China. Agrofor. Syst. 2010, 80, 117–129. [Google Scholar] [CrossRef]
  71. Carberry, P.S.; Meinke, H.; Poulton, P.L.; Hargreaves, J.N.G.; Snell, A.J.; Sudmeyer, R.A. Modelling crop growth and yield under the environmental changes induced by windbreaks. 2. Simulation of potential benefits at selected sites in Australia. Aust. J. Exp. Agric. 2002, 42, 887–900. [Google Scholar] [CrossRef]
  72. Kenney, W.A. The role of salicaceae species in windbreaks. For. Chron. 1992, 68, 209–213. [Google Scholar] [CrossRef]
Figure 1. The location of the study area (in red) (a) and the spatial distribution of target shelterbelts (b). Subplots (c) and (d) show an overview of a target shelterbelt (star in (b)) via Google Earth images before (Imagery Date: 18 July 2015) and after cutting (Imagery Date: 9 May 2018). The triangle in (b) represents the location of the field measurement.
Remotesensing 14 05005 g001
Figure 2. The schematic diagram for selecting the target shelterbelt (a) and the flowchart to quantify the legacy effect of post-cutting shelterbelt on crop yield (b).
Remotesensing 14 05005 g002
Figure 3. The relative yield profiles before (a) and after (b) shelterbelt cutting. Boxes show the quartile values from 25% to 75% of the relative yield with horizontal lines for the median. The shadow represents the 95% confidence interval.
Remotesensing 14 05005 g003
Figure 4. The relative yield profiles on the windward (a) and leeward (b) sides. The shaded parts represent the 95% confidence interval.
Remotesensing 14 05005 g004
Figure 5. Yield increment of shelterbelt with different densities before and after shelterbelt cutting. The total, leeward, and windward labels represent the all, leeward, and windward target shelterbelt groups, respectively. The x-axis represents the shelterbelt classification (T: all densities, Hi: high density, MH: medium–high density, M: medium density, L: low density).
Remotesensing 14 05005 g005
Figure 6. Decomposition of the total effect (blue line) into microclimate effect (green line) and soil effect (red line). The total effect and soil effect are represented by the yield profiles before and after shelterbelt cutting, respectively. The microclimate effect is represented by the difference between the yield profiles before and after shelterbelt cutting.
Remotesensing 14 05005 g006
Publisher’s Note: MDPI stays neutral with regard to jurisdictional claims in published maps and institutional affiliations.

