Socio-Ecological Predictors of Frequent Bike Share Trips: Do Purposes Matter?


Abstract
1. Introduction
2. Materials and Methods
2.1. Participants
2.2. Measures
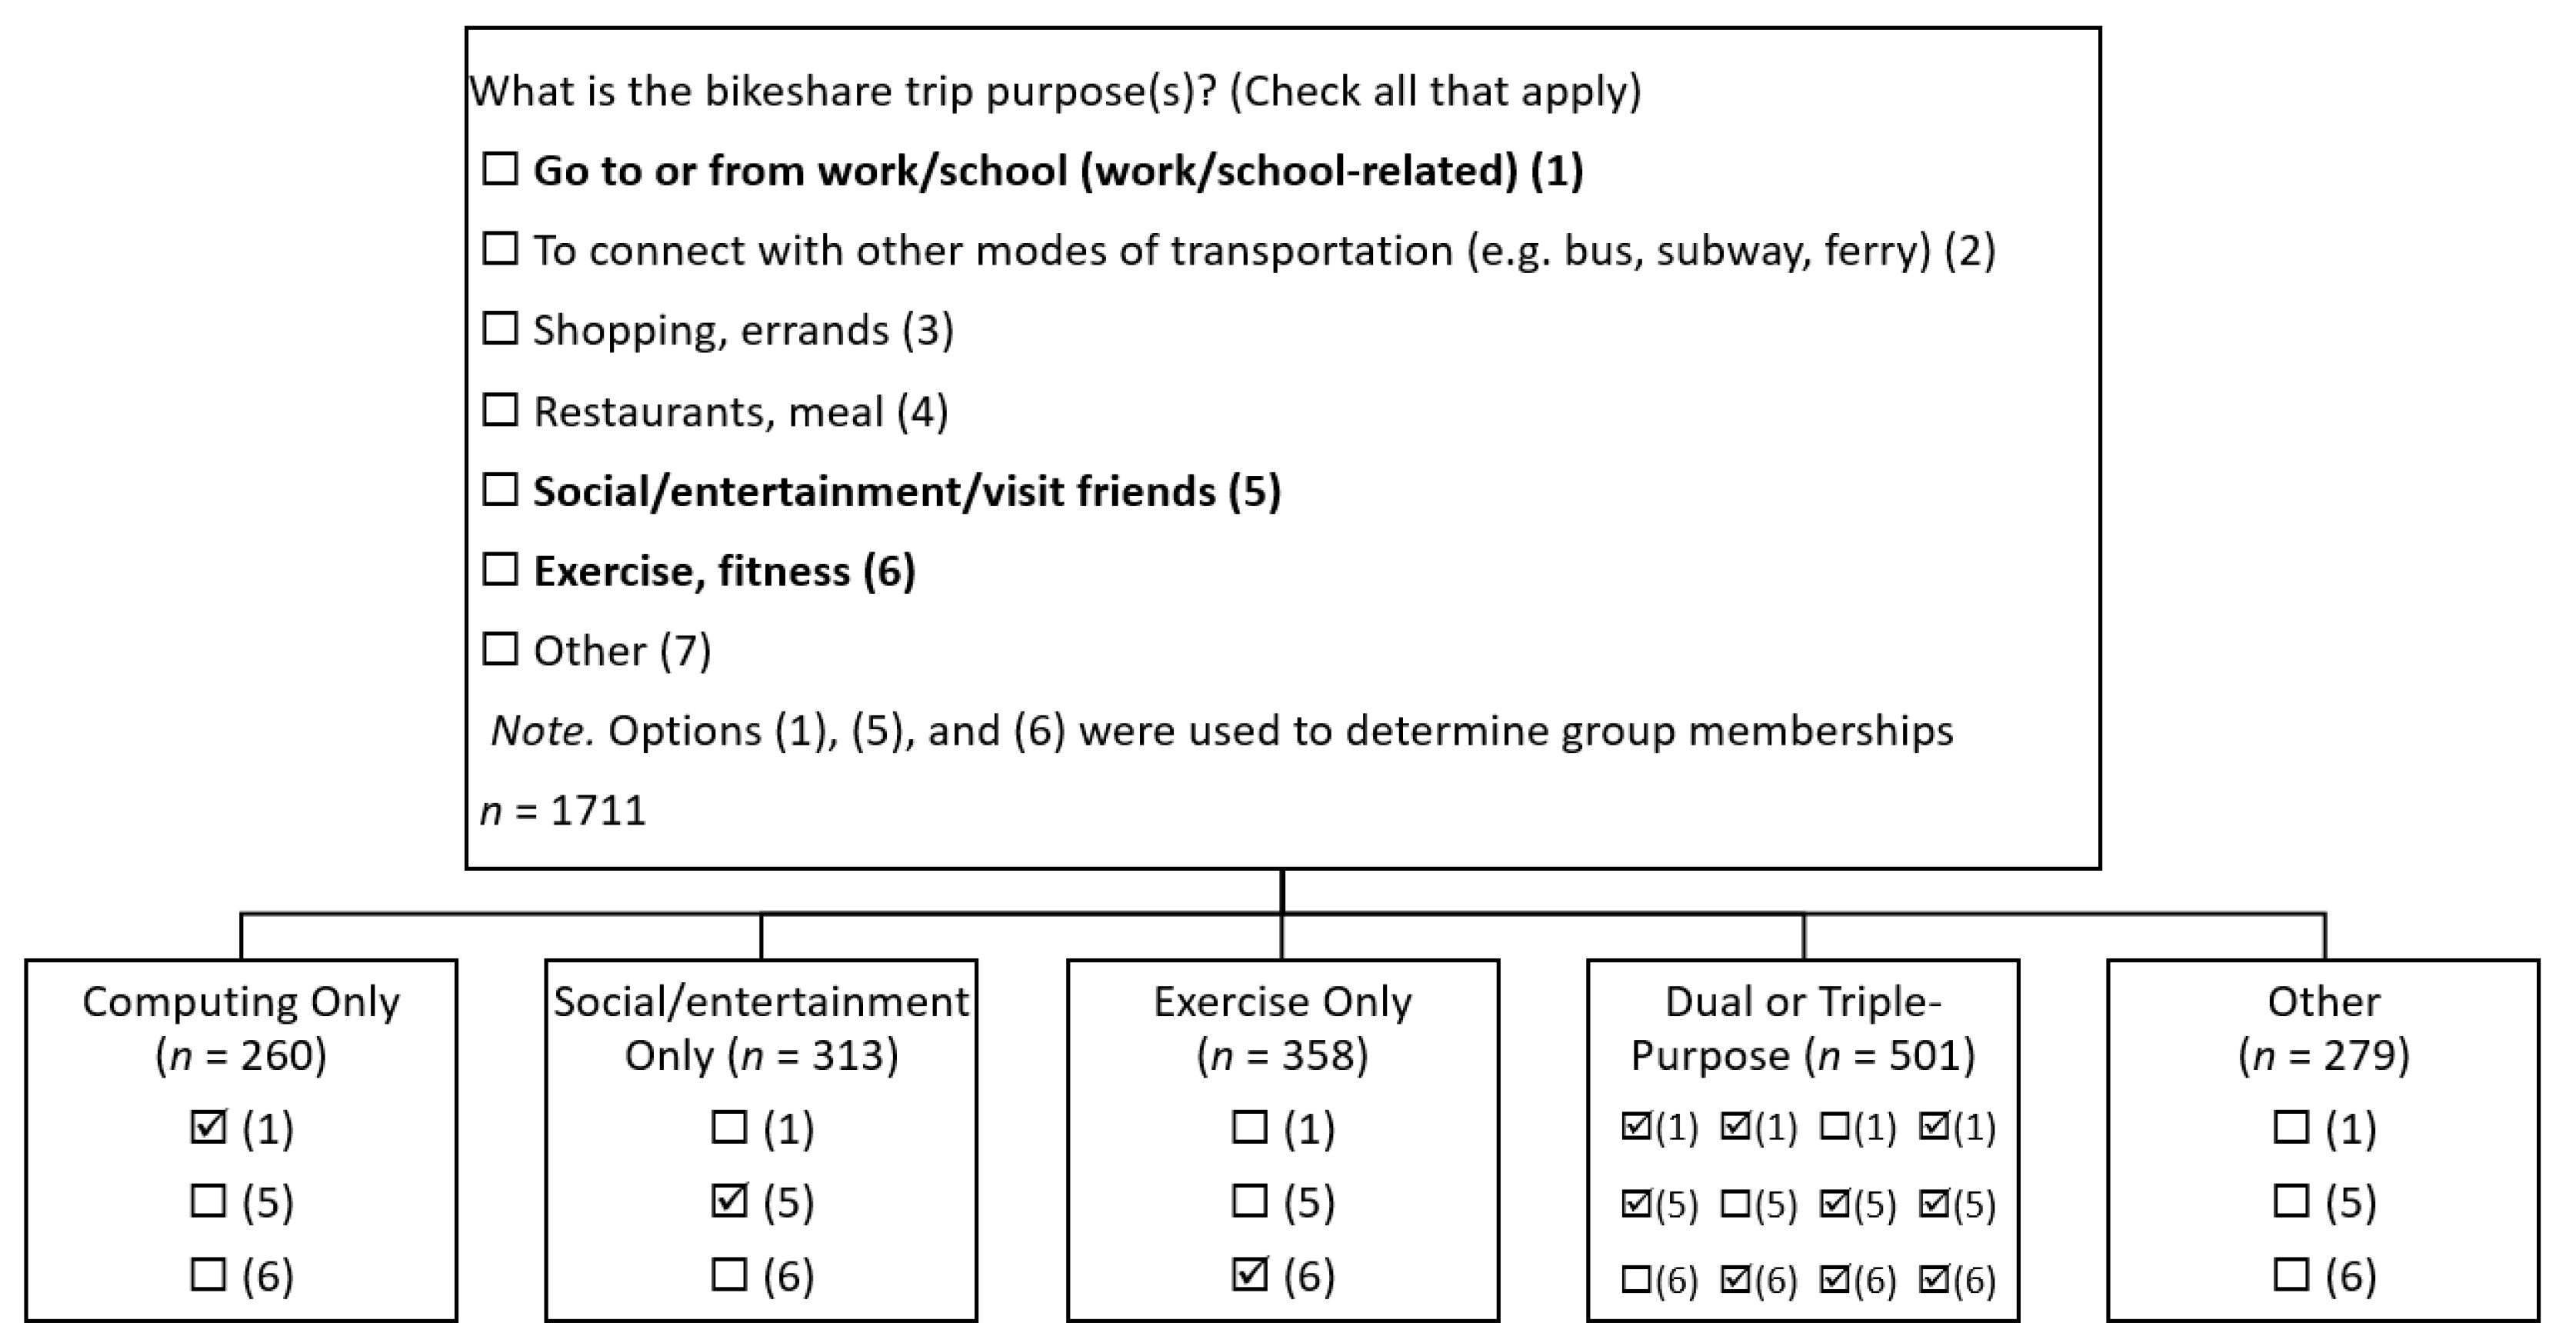
2.2.1. Bike Share Trips for Different Purposes
2.2.2. Socio-Demographic Variables
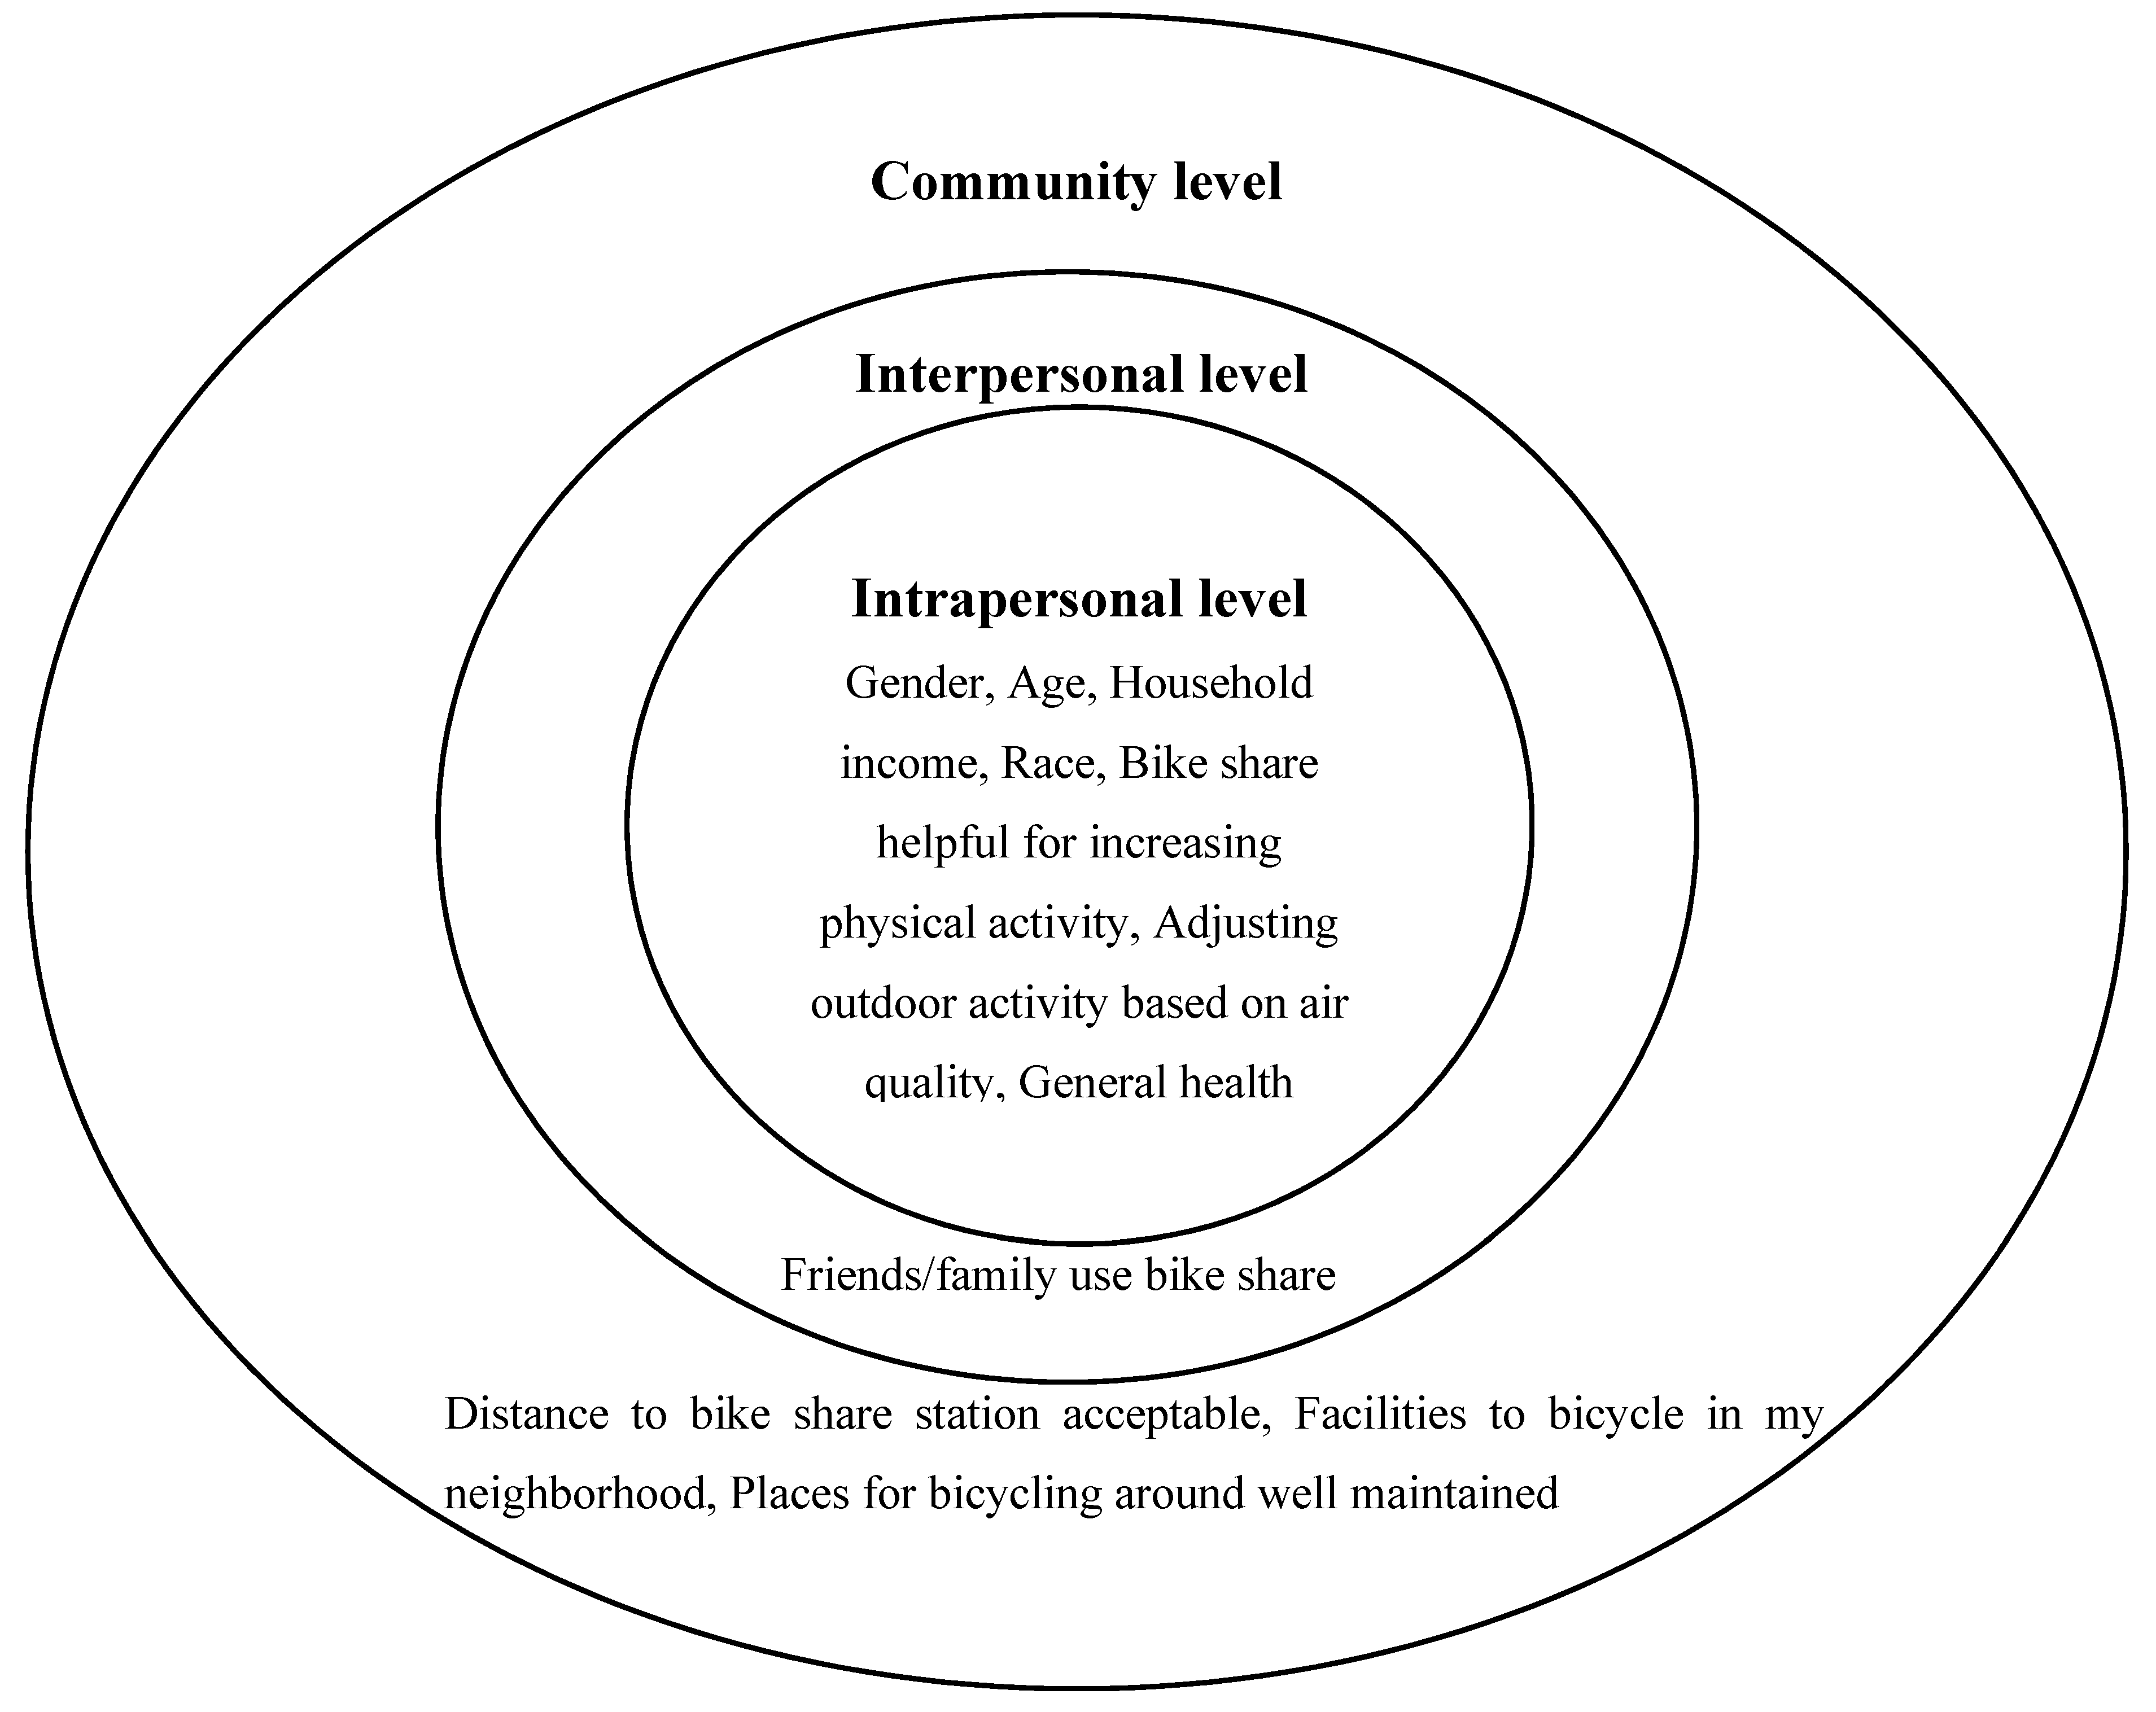
2.2.3. Socio-Ecological Predictors
2.2.4. Dependent Measure
2.3. Analyses
3. Results
3.1. Bike Share Trips for Commuting Only
3.2. Bike Share Trips for Social/Entertainment Only
3.3. Bike Share Trips for Exercise Only
3.4. Bike Share Trips for Dual or Triple-Purpose from Commuting, Social/Entertainment, and Exercise
3.5. Bike Share Trips for Purposes Other than Commuting, Social/Entertainment, and Exercise
4. Discussion
4.1. Summary of Results and Practical Implications
4.2. Limitations and Future Research Directions
5. Conclusions
Author Contributions
Funding
Conflicts of Interest
References
- Fishman, E. Bikeshare: A review of recent literature. Transp. Rev. 2016, 36, 92–113. [Google Scholar] [CrossRef]
- Shared Micromobility in the US. 2019. Available online: https://nacto.org/shared-micromobility-2019/ (accessed on 19 September 2020).
- Shaheen, S.A.; Guzman, S.; Zhang, H. Bikesharing in Europe, the Americas, and Asia: Past, present, and future. Transp. Res. Rec. 2010, 2143, 159–167. [Google Scholar] [CrossRef]
- Chen, Z.; van Lierop, D.; Ettema, D. Dockless bike-sharing systems: What are the implications? Transp. Rev. 2020, 40, 333–353. [Google Scholar] [CrossRef]
- US Department of Transportation, Bureau of Transportation Statistics. New BTS Interactive Map Shows Growth of Urban BikeShare/E-Scooter Systems. Available online: https://www.bts.gov/newsroom/new-bts-interactive-map-shows-growth-urban-bikesharee-scooter-systems (accessed on 7 October 2020).
- US Department of Transportation, Bureau of Transportation Statistics. Bikeshare and E-Scooters in the U.S. Available online: https://data.transportation.gov/stories/s/fwcs-jprj (accessed on 7 October 2020).
- US Department of Transportation, Bureau of Transportation Statistics. Bikeshare (Docked and Dockless) and E-Scooter Systems by Year and City Served. Available online: https://data.bts.gov/Bicycles-and-Pedestrians/Bikeshare-Docked-and-Dockless-and-E-scooter-System/cqdc-cm7d (accessed on 7 October 2020).
- Bauman, A.; Crane, M.; Drayton, B.A.; Titze, S. The unrealised potential of bike share schemes to influence population physical activity levels—A narrative review. Prev. Med. 2017, 103, S7–S14. [Google Scholar] [CrossRef]
- Otero, I.; Nieuwenhuijsen, M.J.; Rojas-Rueda, D. Health impacts of bike sharing systems in Europe. Environ. Int. 2018, 115, 387–394. [Google Scholar] [CrossRef]
- Woodcock, J.; Tainio, M.; Cheshire, J.; O’Brien, O. Goodman A. Health effects of the London bicycle sharing system: Health impact modelling study. BMJ 2014, 348, 425. [Google Scholar] [CrossRef]
- Ma, X.; Cao, R.; Wang, J. Effects of psychological factors on modal shift from car to dockless bike sharing: A case study of Nanjing, China. Int. J. Environ. Res. Public Health 2019, 16, 3420. [Google Scholar] [CrossRef]
- World Health Organization (WHO). Global Recommendations on Physical Activity for Health: 18–64 Years Old. Available online: https://www.who.int/dietphysicalactivity/physical-activity-recommendations-18-64years.pdf?ua=1 (accessed on 19 September 2020).
- Centers for Disease Control and Prevention. Early Release of Selected Estimates Based On Data from the 2018 National Health Interview Survey. Available online: https://public.tableau.com/profile/tina.norris#!/vizhome/FIGURE7_1/Dashboard7_1 (accessed on 19 September 2020).
- Donaire-Gonzalez, D.; de Nazelle, A.; Cole-Hunter, T.; Curto, A.; Rodriguez, D.A.; Mendez, M.A.; Garcia-Aymerich, J.; Basagaña, X.; Ambros, A.; Jerrett, M.; et al. The added benefit of bicycle commuting on the regular amount of physical activity performed. Am. J. Prev. Med. 2015, 49, 842–849. [Google Scholar] [CrossRef]
- Furie, G.L.; Desai, M.M. Active transportation and cardiovascular disease risk factors in US adults. Am. J. Prev. Med. 2012, 43, 621–628. [Google Scholar] [CrossRef]
- Anderson, E.; Durstine, J.L. Physical activity, exercise, and chronic diseases: A brief review. Sports Med. Health Sci. 2019, 1, 3–10. [Google Scholar] [CrossRef]
- Sallis, J.F.; Owen, N. Ecological models of health behavior. In Health Behavior: Theory, Research, and Practice, 5th ed.; Glanz, K., Rimer, B.K., Viswanath, K., Eds.; Wiley: San Francisco, CA, USA, 2015; Chapter 3; pp. 43–64. [Google Scholar]
- Ma, P.H.X.; Chan, Z.C.Y.; Loke, A.Y. The socio-ecological model approach to understanding barriers and facilitators to the accessing of health services by sex workers: A systematic review. AIDS Behav. 2017, 21, 2412–2438. [Google Scholar] [CrossRef]
- Shusted, C.S.; Kane, G.C. Linkage between poverty and smoking in Philadelphia and its impact on future directions for tobacco control in the city. Popul. Health Manag. 2020, 23, 68–77. [Google Scholar] [CrossRef]
- Grimes, A.; Chrisman, M.; Lightner, J. Barriers and motivators of bicycling by gender among older adults bicyclists in the Midwest. Health Educ. Behav. 2020, 47, 67–77. [Google Scholar] [CrossRef]
- Badland, H.; Knuiman, M.; Hopper, P.; Giles-Corti, B. Socio-ecological predictors of the uptake of cycling for recreation and transport in adults: Results from the RESIDE study. Prev. Med. 2013, 57, 396–399. [Google Scholar] [CrossRef] [PubMed]
- Goodman, A.; Sahlqvist, S.; Ogilvie, D. Who uses new walking and cycling infrastructure and how? Longitudinal results from the UK iConnect study. Prev. Med. 2013, 57, 518–524. [Google Scholar] [CrossRef] [PubMed]
- de Geus, B.; De Bourdeaudhuij, I.; Jannes, C.; Meeusen, R. Psychosocial and environmental factors associated with cycling for transport among a working population. Health Educ. Res. 2008, 23, 697–708. [Google Scholar] [CrossRef] [PubMed]
- Bigazzi, A.; Gehrke, S.R. Joint consideration of energy expenditure, air quality, and safety by cyclists. Transp. Res. Part F Traffic Psychol. Behav. 2018, 58, 652–664. [Google Scholar] [CrossRef]
- Titze, S.; Stronegger, W.J.; Janschitz, S.; Oja, P. Association of built-environment, social environment and personal factors with bicycling as a mode of transportation among Austrian city dwellers. Prev. Med. 2008, 47, 252–259. [Google Scholar] [CrossRef]
- Page, N.C.; Nilsson, V.O. Active commuting: Workplace health promotion for improved employee well-being and organizational behavior. Front. Psychol. 2017, 7, 1994. [Google Scholar] [CrossRef]
- Adams, E.J.; Goodman, A.; Sahlqvist, S.; Bull, F.C.; Ogilvie, D. Correlates of walking and cycling for transport and recreation: Factor structure, reliability and behavioral associations of the perceptions of the environment in the neighbourhood scale (PENS). Int. J. Behav. Nutr. Phys Act. 2013, 10, 87. [Google Scholar] [CrossRef]
- Pucher, J.; Buehler, R.; Seinen, M. Bicycling renaissance in North America? An update and re-appraisal of cycling trends and policies. Transp. Res. A-Pol. 2011, 45, 451–475. [Google Scholar] [CrossRef]
- Porter, A.K.; Kohl, H.W., III; Pérez, A.; Reininger, B.; Gabriel, K.P.; Salvo, D. Perceived social and built environment correlates of transportation and recreation-only bicycling among adults. Prev. Chronic. Dis. 2018, 15, E135. [Google Scholar] [CrossRef]
- Yang, Y.; Wu, X.; Zhou, P.; Gou, Z.; Lu, Y. Towards a cycling-friendly city: An updated review of the associations between built environment and cycling behaviors (2007–2017). J. Transp. Health. 2019, 14, 100613. [Google Scholar] [CrossRef]
- Buck, D.; Buehler, R.; Happ, P.; Rawls, B.; Chung, P.; Borecki, N. Are bikeshare users different from regular cyclists? A first look at short-term users, annual members, and area cyclists in the Washington, DC, Region. Transp. Res. Rec. 2013, 2387, 112–119. [Google Scholar] [CrossRef]
- Shaheen, S.A.; Martin, E.W.; Cohen, A.P.; Finson, R.S. Public Bikesharing in North America: Early Operator and User Understanding; Mineta Transportation Institute: San Jose, CA, USA, 2012; Available online: https://transweb.sjsu.edu/sites/default/files/1029-public-bikesharing-understanding-early-operators-users.pdf (accessed on 15 August 2020).
- Chandler, J.; Shapiro, D. Conducting clinical research using crowdsourced convenience samples. Annu. Rev. Clin. Psychol. 2016, 12, 53–81. [Google Scholar] [CrossRef]
- Follmer, D.J.; Sperling, R.A.; Suen, H.K. The role of MTurk in education research: Advantages, issues, and future directions. Educ. Res. 2017, 46, 329–334. [Google Scholar] [CrossRef]
- Robinson, J.; Rosenzweig, C.; Moss, A.J.; Litman, L. Tapped out or barely tapped? Recommendations for how to harness the vast and largely unused potential of the Mechanical Turk participant pool. PLoS ONE 2019, 14, e0226394. [Google Scholar] [CrossRef]
- Sallis, J.F.; Cervero, R.B.; Ascher, W.; Henderson, K.A.; Kraft, M.K.; Kerr, J. An ecological approach to creating active living communities. Annu Rev Public Health 2006, 27, 297–322. [Google Scholar] [CrossRef]
- Sallis, J.F.; Kerr, J.; Carlson, J.A.; Norman, G.J.; Saelens, B.E.; Durant, N.; Ainsworth, B.E. Evaluating a brief self-report measure of neighborhood environments for physical activity research and surveillance: Physical Activity Neighborhood Environment Scale (PANES). J. Phys. Act. Health 2010, 7, 533–540. [Google Scholar] [CrossRef]
- Fuller, D.; Gauvin, L.; Kestens, Y.; Daniel, M.; Fournier, M.; Morency, P.; Drouin, L. Use of a new public bicycle share program in Montreal, Canada. Am. J. Prev. Med. 2011, 41, 80–83. [Google Scholar] [CrossRef]
- LDA Consulting. Capital Bikeshare 2011 Member Survey Report; LDA Consulting: Washington, DC, USA, 2012; Available online: https://d21xlh2maitm24.cloudfront.net/wdc/Capital-Bikeshare-SurveyReport-Final.pdf?mtime=20161206135935 (accessed on 15 August 2020).
- Virginia Tech. Capital Bikeshare Study: A Closer Look at Casual Users and Operation; Virginia Tech.: Arlington, VA, USA, 2012; Available online: https://ralphbu.files.wordpress.com/2012/01/vt-bike-share-study-final3.pdf (accessed on 15 August 2020).
- Heinen, E.; Maat, K.; van Wee, B. The role of attitudes toward characteristics of bicycle commuting on the choice to cycle to work over various distances. Transp. Res. D 2011, 16, 102–109. [Google Scholar] [CrossRef]
- Kim, H. Seasonal impacts of particulate matter levels on bike sharing in Seoul, South Korea. Int. J. Environ. Res. Public Health 2020, 17, 3999. [Google Scholar] [CrossRef] [PubMed]
- An, R.; Zhang, S.; Ji, M.; Guan, C. Impact of ambient air pollution on physical activity among adults: A systematic review and meta-analysis. Perspect. In Public Health. 2018, 138, 111–121. [Google Scholar] [CrossRef] [PubMed]
- Nikitas, A. How to save bike-sharing: An evidence-based survival toolkit for policy-makers and mobility providers. Sustainability 2019, 11, 3206. [Google Scholar] [CrossRef]
- Biehl, A.; Ermagun, A.; Stathopoulos, A. Utilizing multi-stage behavior change theory to model the process of bike share adoption. Transp. Policy 2019, 77, 30–45. [Google Scholar] [CrossRef]
- Winters, M.; Hosford, K.; Javaheri, S. Who are the ‘super-users’ of public bike share? An analysis of public bike share members in Vancouver, BC. Prev. Med. Rep. 2019, 15, 100946. [Google Scholar] [CrossRef]
- Kellstedt, D.; Spengler, J.O.; Bradley, K.; Maddock, J.E. Evaluation of free-floating bike-share on a university campus using a multi-method approach. Prev. Med. Rep. 2019, 16, 100981. [Google Scholar] [CrossRef] [PubMed]
- Mooney, S.J.; Hosford, K.; Howe, B.; Yan, A.; Winters, M.; Bassok, A.; Hirsch, J.A. Freedom from the station: Spatial equity in access to dockless bike share. J. Transp. Geogr. 2019, 74, 91–96. [Google Scholar] [CrossRef]
- Ma, X.; Ji, Y.; Yuan, Y.; Van Oort, N.; Jin, Y.; Hoogendoorn, S. A comparison in travel patterns and determinants of user demand between docked and dockless bike-sharing systems using multi-sourced data. Transp. Res. A 2020, 139, 148–173. [Google Scholar] [CrossRef]


| Characteristics | Commuting, n = 260 | Social/Entertainment, n = 313 | Exercise, n = 358 | Dual or Triple-Purpose, n = 501 | Other, n = 279 |
|---|---|---|---|---|---|
| Gender | |||||
| Male | 164 (63.1%) | 172 (55.0%) | 199 (55.6%) | 292 (58.4%) | 160 (57.6%) |
| Female | 96 (36.9%) | 141 (45.0%) | 159 (44.4%) | 208 (41.6%) | 118 (42.4%) |
| Missing | 0 | 0 | 1 | 1 | 1 |
| χ2(p value) | 17.79 (<0.001) | 3.07 (0.080) | 4.47 (0.035) | 14.11 (<0.001) | 6.35 (0.012) |
| Age | |||||
| 20–29 | 116 (44.6%) | 118 (37.7%) | 108 (30.2%) | 211 (42.1%) | 102 (36.6%) |
| 30–39 | 104 (40.0%) | 129 (41.2%) | 154 (43.0%) | 207 (41.3%) | 115 (41.2%) |
| 40 and above | 40 (15.4%) | 66 (21.1%) | 96 (26.8%) | 83 (16.6%) | 62 (22.2%) |
| Missing | 0 | 0 | 0 | 0 | 0 |
| χ2(p value) | 38.52 (<0.001) | 21.71 (<0.001) | 15.71 (<0.001) | 63.43 (<0.001) | 16.41 (<0.001) |
| Race | |||||
| Caucasian | 165 (63.5%) | 208 (66.5%) | 232 (65.0%) | 316 (63.5%) | 182 (65.5%) |
| Hispanic | 15 (5.8%) | 32 (10.2%) | 33 (9.2%) | 49 (9.8%) | 19 (6.8%) |
| African American | 33 (12.7%) | 31 (9.9%) | 49 (13.7%) | 57 (11.4%) | 32 (11.5%) |
| Other | 47 (18.1%) | 42 (13.4%) | 43 (12.0%) | 76 (15.3%) | 45 (16.2) |
| Missing | 0 | 0 | 1 | 3 | 1 |
| χ2(p value) | 213.05 (<0.001) | 287.81 (<0.001) | 305.89 (<0.001) | 395.831 (<0.001) | 247.67 (<0.001) |
| Education | |||||
| <4-year college | 92 (35.4%) | 117 (37.4%) | 121 (33.8%) | 174 (34.8%) | 85 (30.6%) |
| ≥4-year college | 168 (64.6%) | 196 (62.6%) | 237 (66.2%) | 326 (65.2%) | 193 (69.4%) |
| Missing | 0 | 0 | 1 | 0 | 1 |
| χ2(p value) | 22.22 (<0.001) | 19.94 (<0.001) | 37.59 (<0.001) | 46.21 (<0.001) | 41.96 (<0.001) |
| BMI 1 | |||||
| Under/normal weight | 135 (52.5%) | 161 (52.3%) | 181 (51.9%) | 275 (55.9%) | 141 (51.8%) |
| Overweight | 67 (26.1%) | 94 (30.5%) | 113 (32.4%) | 153 (31.1%) | 80 (29.4%) |
| Obese | 55 (21.4%) | 53 (17.2%) | 55 (15.8%) | 64 (13.0%) | 51 (18.8%) |
| Missing | 3 | 5 | 9 | 9 | 7 |
| χ2(p value) | 43.46 (<0.001) | 57.90 (<0.001) | 68.38 (<0.001) | 136.84 (<0.001) | 46.55 (<0.001) |
| Household income (USD) | |||||
| ≤39,999 | 85 (32.7%) | 83 (26.5%) | 95 (26.5%) | 134 (26.8%) | 86 (30.9%) |
| 40,000–59,999 | 65 (25.0%) | 85 (27.2%) | 105 (29.3%) | 140 (28.0%) | 64 (23.0%) |
| 60,000–79,999 | 48 (18.5%) | 52 (16.6%) | 79 (22.1%) | 96 (19.2%) | 62 (22.3%) |
| ≥80,000 | 62 (23.8%) | 93 (29.7%) | 79 (22.1%) | 130 (26.0%) | 66 (23.7%) |
| Missing | 0 | 0 | 0 | 1 | 1 |
| χ2(p value) | 10.74 (0.013) | 12.46 (0.006) | 5.49 (0.139) | 9.38 (0.025) | 5.34 (0.149) |
| Children younger than 16 years | |||||
| No | 195 (75.0%) | 218 (69.6%) | 218 (60.9%) | 324 (64.8%) | 173 (62.2%) |
| Yes | 65 (25.0%) | 95 (30.4%) | 140 (39.1%) | 176 (35.2%) | 105 (37.8%) |
| Missing | 1 | 0 | 0 | 1 | 1 |
| χ2(p value) | 65.00 (<0.001) | 48.34 (<0.001) | 16.99 (<0.001) | 43.81 (<0.001) | 16.63 (<0.001) |
| Marital status | |||||
| Never been married | 163 (62.7%) | 182 (58.1%) | 163 (45.5%) | 261 (52.2%) | 137 (49.3%) |
| Married | 81 (31.2%) | 107 (34.2%) | 171 (47.8%) | 197 (39.4%) | 116 (41.7%) |
| Other 2 | 16 (6.2%) | 24 (7.7%) | 24 (6.7%) | 42 (8.4%) | 25 (9.0%) |
| Missing | 0 | 0 | 1 | 0 | 1 |
| χ2(p value) | 125.22 (<0.001) | 119.74 (<0.001) | 114.51 (<0.001) | 152.16 (<0.001) | 76.50 (<0.001) |
| Employment status | |||||
| Full-time employee | 204 (78.5%) | 242 (77.3%) | 298 (83.2%) | 421 (84.0%) | 223 (79.9%) |
| Other | 56 (21.5%) | 71 (22.7%) | 60 (16.8%) | 80 (16.0%) | 56 (20.1%) |
| Missing | 0 | 0 | 0 | 0 | 0 |
| χ2(p value) | 84.25 (<0.001) | 93.42 (<0.001) | 158.22 (<0.001) | 232.10 (<0.001) | 99.96 (<0.001) |
| Region 3 | |||||
| Northeast | 53 (20.4%) | 64 (20.4%) | 65 (18.2%) | 96 (19.2%) | 54 (19.4%) |
| Midwest | 50 (19.2%) | 58 (18.5%) | 73 (20.4%) | 102 (20.4%) | 45 (16.1%) |
| South | 80 (30.8%) | 110 (35.1%) | 133 (37.2%) | 182 (36.3%) | 92 (33.0%) |
| West | 77 (29.6%) | 81 (25.9%) | 87 (24.3%) | 121 (24.2%) | 88 (31.5%) |
| Missing | 0 | 0 | 0 | 0 | 0 |
| χ2(p value) | 11.35 (0.010) | 20.82 (<0.001) | 30.96 (<0.001) | 37.00 (<0.001) | 24.21 (<0.001) |
| Predictors | Two or More Trips for Commuting OR (95% CI) | Two or More Trips for Social/Entertainment OR (95% CI) | Two or More Trips for Exercise OR (95% CI) |
|---|---|---|---|
| Gender (female vs. male) | 0.59 (0.29–1.19); 0.138 | 0.91 (0.53–1.58); 0.742 | 0.80 (0.49–1.29); 0.356 |
| Age 30–39 vs. 20–29 | 1.20 (0.59–2.43); 0.614 | 0.76 (0.41–1.41); 0.379 | 0.47 (0.27–0.84); 0.011 |
| Age ≥40 vs. 20–29 | 0.59 (0.23–1.54); 0.280 | 1.08 (0.51–2.30); 0.845 | 0.39 (0.21–0.75); 0.004 |
| Household income $40,000–$59,999 vs. ≤$39,999 | 1.63 (0.65–4.07); 0.295 | 0.72 (0.35–1.50); 0.384 | 1.43 (0.76–2.69); 0.275 |
| Household income $60,000–$79,999 vs. ≤$39,999 | 0.83 (0.33–2.04); 0.679 | 0.40 (0.16–0.99); 0.048 | 1.32 (0.66–2.65); 0.428 |
| Household income ≥$80,000 vs. ≤$39,999 | 1.72 (0.69–4.30); 0.246 | 0.65 (0.31–1.35); 0.243 | 1.19 (0.59–2.40); 0.622 |
| Hispanic vs. Caucasian | 0.74 (0.20–2.77); 0.655 | 1.48 (0.63–3.50); 0.373 | 2.96 (1.20–7.30); 0.019 |
| African American vs. Caucasian | 6.17 (1.30–29.23); 0.022 | 0.97 (0.40–2.36); 0.948 | 1.69 (0.84–3.39); 0.143 |
| Other vs. Caucasian | 1.22 (0.53–2.79); 0.644 | 0.66 (0.27–1.59); 0.354 | 1.13 (0.52–2.47); 0.795 |
| Bike share moderately helpful for increasing physical activity vs. not at all/slightly helpful | 4.73 (1.98–11.34); <0.001 | 3.71 (1.80–7.64); <0.001 | 1.88 (0.86–4.12); 0.116 |
| Bike share very helpful for increasing physical activity vs. not at all/slightly helpful | 9.01 (3.74–21.72); <0.001 | 5.68 (2.62–12.33); <0.001 | 2.75 (1.28–5.93); 0.010 |
| Adjusting outdoor activity based on air quality sometimes to always vs. rarely | 0.96 (0.50–1.83); 0.893 | 1.49 (0.86–2.59); 0.157 | 1.15 (0.70–1.88); 0.580 |
| General health good vs. poor or fair | 0.82 (0.27–2.44); 0.720 | 1.87 (0.58–6.06); 0.298 | 1.52 (0.61–3.76); 0.366 |
| General health very good/excellent vs. poor or fair | 0.75 (0.25–2.21); 0.602 | 1.54 (0.48–4.90); 0.466 | 1.66 (0.69–3.99); 0.256 |
| 1–3 friends/family use bike share vs. 0 | 1.76 (0.81–3.80); 0.150 | 0.81 (0.24–2.71); 0.734 | 0.67 (0.34–1.33); 0.252 |
| ≥4 friends/family use bike share vs. 0 | 2.96 (0.85–10.32); 0.088 | 2.90 (0.82–10.22); 0.098 | 1.50 (0.63–3.60); 0.362 |
| Distance to bike share station acceptable (acceptable vs. unacceptable) | 0.50 (0.24–1.04); 0.063 | 2.18 (1.20–3.99); 0.011 | 1.38 (0.84–2.27); 0.205 |
| Bicycling around well maintained (agree vs. disagree) | 1.09 (0.50–2.35); 0.836 | 0.59 (0.31–1.15); 0.122 | 1.43 (0.74–2.76); 0.294 |
| Facilities to bicycle in my neighborhood (agree vs. disagree) | 1.90 (0.80–4.52); 0.147 | 2.08 (0.95–4.54); 0.066 | 0.82 (0.40–1.66); 0.571 |
| Predictors | Two or More Trips for Dual or Triple-Purpose OR (95% CI) | Two or More Trips for Other Purposes OR (95% CI) |
|---|---|---|
| Gender (female vs. male) | 0.82 (0.54–1.23); 0.331 | 1.36 (0.76–2.43); 0.294 |
| Age 30–39 vs. 20–29 | 1.16 (0.75–1.81); 0.512 | 0.84 (0.45–1.58); 0.596 |
| Age ≥40 vs. 20–29 | 0.84 (0.47–1.50); 0.553 | 0.91 (0.43–1.94); 0.807 |
| Household income $40,000–$59,999 vs. ≤$39,999 | 1.05 (0.61–1.81); 0.859 | 2.10 (0.93–4.73); 0.074 |
| Household income $60,000–$79,999 vs. ≤$39,999 | 1.61 (0.88–2.96); 0.122 | 1.00 (0.46–2.17); 1.000 |
| Household income ≥$80,000 vs. ≤$39,999 | 0.96 (0.54–1.69); 0.886 | 0.93 (0.44–2.00); 0.857 |
| Hispanic vs. Caucasian | 1.73 (0.84–3.54); 0.136 | 0.90 (0.29–2.81); 0.849 |
| African American vs. Caucasian | 2.17 (1.07–4.41); 0.032 | 4.03 (1.41–11.51); 0.009 |
| Other vs. Caucasian | 1.00 (0.56–1.77); 0.989 | 2.11 (0.96–4.67); 0.064 |
| Bike share moderately helpful for increasing physical activity vs. not at all/slightly helpful | 2.87 (1.42–5.81); 0.003 | 1.04 (0.49–2.19); 0.923 |
| Bike share very helpful for increasing physical activity vs. not at all/slightly helpful | 5.17 (2.62–10.20); <0.001 | 2.13 (0.96–4.75); 0.063 |
| Adjusting outdoor activity based on air quality sometimes to always vs. rarely | 1.67 (1.10–2.52); 0.015 | 1.31 (0.74–2.34); 0.354 |
| General health good vs. poor or fair | 1.80 (0.81–4.01); 0.150 | 1.09 (0.42–2.83); 0.858 |
| General health very good/excellent vs. poor or fair | 1.64 (0.75–3.61); 0.217 | 1.40 (0.58–3.39); 0.454 |
| 1–3 friends/family use bike share vs. 0 | 0.55 (0.24–1.28); 0.165 | 1.80 (0.88–3.69); 0.109 |
| ≥4 friends/family use bike share vs. 0 | 1.12 (0.46–2.73); 0.808 | 8.30 (2.89–23.88); <0.001 |
| Distance to bike share station acceptable (acceptable vs. unacceptable) | 1.77 (1.15–2.74); 0.010 | 1.45 (0.73–2.90); 0.291 |
| Bicycling around well maintained (agree vs. disagree) | 0.77 (0.45–1.32); 0.340 | 1.23 (0.58–2.62); 0.586 |
| Facilities to bicycle in my neighborhood (agree vs. disagree) | 1.30 (0.73–2.31); 0.369 | 1.40 (0.63–3.11); 0.410 |
Publisher’s Note: MDPI stays neutral with regard to jurisdictional claims in published maps and institutional affiliations. |
© 2020 by the authors. Licensee MDPI, Basel, Switzerland. This article is an open access article distributed under the terms and conditions of the Creative Commons Attribution (CC BY) license (http://creativecommons.org/licenses/by/4.0/).
Share and Cite
Chen, L.-T.; Hsu, Y.-W. Socio-Ecological Predictors of Frequent Bike Share Trips: Do Purposes Matter? Int. J. Environ. Res. Public Health 2020, 17, 7640. https://doi.org/10.3390/ijerph17207640
Chen L-T, Hsu Y-W. Socio-Ecological Predictors of Frequent Bike Share Trips: Do Purposes Matter? International Journal of Environmental Research and Public Health. 2020; 17(20):7640. https://doi.org/10.3390/ijerph17207640
Chicago/Turabian StyleChen, Li-Ting, and Ya-Wen Hsu. 2020. "Socio-Ecological Predictors of Frequent Bike Share Trips: Do Purposes Matter?" International Journal of Environmental Research and Public Health 17, no. 20: 7640. https://doi.org/10.3390/ijerph17207640
APA StyleChen, L.-T., & Hsu, Y.-W. (2020). Socio-Ecological Predictors of Frequent Bike Share Trips: Do Purposes Matter? International Journal of Environmental Research and Public Health, 17(20), 7640. https://doi.org/10.3390/ijerph17207640