Author Contributions
C.A., O.B.D., A.B.K., E.E., G.G. and A.M.O.: Conceptualization, Writing—Original Draft, Visualization. C.A., A.M.O., O.B.D., G.G., A.B.K. and E.E.: Formal Analysis, Data Curation, Methodology. F.G. and A.M.O.: Supervision, Project Administration, Validation. A.B.K., G.G., A.M.O., F.G., C.A., E.E. and O.B.D.: Writing—Review and Editing. All authors have read and agreed to the published version of the manuscript.
Figure 1.
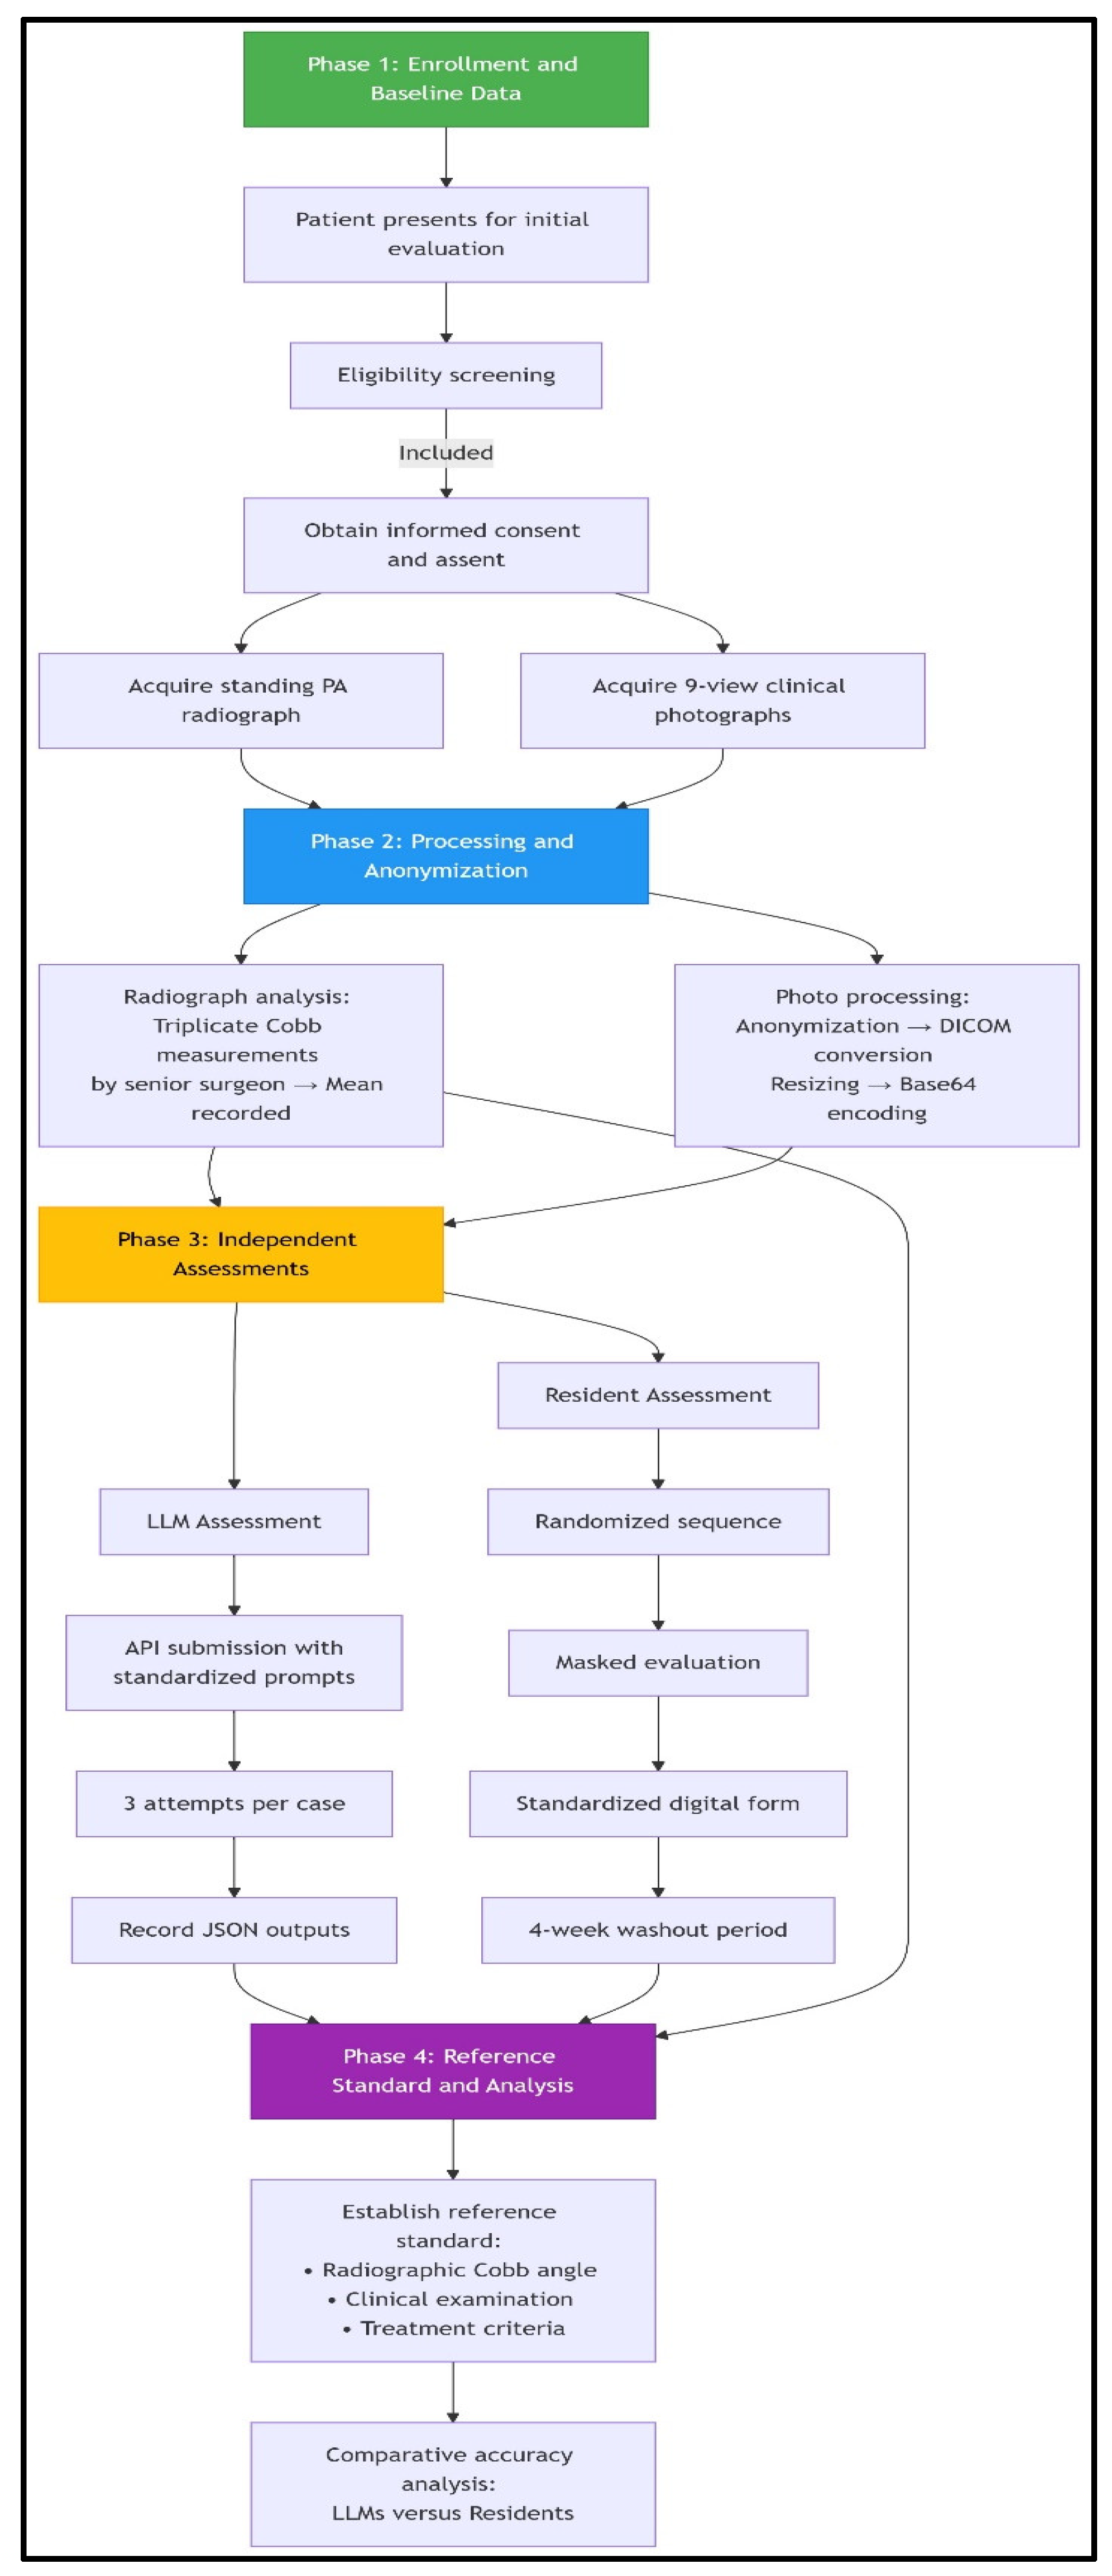
Patient workflow and assessment flowchart. The study employed a standardized four-phase workflow. Phase 1 involved consecutive enrollment of eligible adolescents presenting for initial scoliosis evaluation, with the acquisition of reference standard standing radiographs and a 9-view clinical photographic series following informed consent procedures. In Phase 2, radiographic Cobb angles were established through triplicate measurements by a senior spinal surgeon, while clinical photographs underwent systematic processing, including anonymization via facial blurring, DICOM conversion with protected health information scrubbing, resizing (512 × 512 pixels), and base64 encoding for LLM compatibility. Phase 3 featured parallel masked assessments: (1) LLMs received images via API with standardized prompts for feature identification, curve quantification, and treatment recommendation (three attempts per case), and (2) orthopedic residents independently evaluated randomized, anonymized photographs using digital forms with 4-week washout periods. Phase 4 integrated radiographic, clinical, and treatment criteria data to establish the reference standard, against which LLM and resident performance in diagnostic classification and Cobb angle precision were comparatively analyzed. This workflow incorporated bias mitigation through consecutive sampling, universal reference standard application, and assessment masking.
Figure 1.
Patient workflow and assessment flowchart. The study employed a standardized four-phase workflow. Phase 1 involved consecutive enrollment of eligible adolescents presenting for initial scoliosis evaluation, with the acquisition of reference standard standing radiographs and a 9-view clinical photographic series following informed consent procedures. In Phase 2, radiographic Cobb angles were established through triplicate measurements by a senior spinal surgeon, while clinical photographs underwent systematic processing, including anonymization via facial blurring, DICOM conversion with protected health information scrubbing, resizing (512 × 512 pixels), and base64 encoding for LLM compatibility. Phase 3 featured parallel masked assessments: (1) LLMs received images via API with standardized prompts for feature identification, curve quantification, and treatment recommendation (three attempts per case), and (2) orthopedic residents independently evaluated randomized, anonymized photographs using digital forms with 4-week washout periods. Phase 4 integrated radiographic, clinical, and treatment criteria data to establish the reference standard, against which LLM and resident performance in diagnostic classification and Cobb angle precision were comparatively analyzed. This workflow incorporated bias mitigation through consecutive sampling, universal reference standard application, and assessment masking.
![Medicina 61 01342 g001]()
Figure 2.
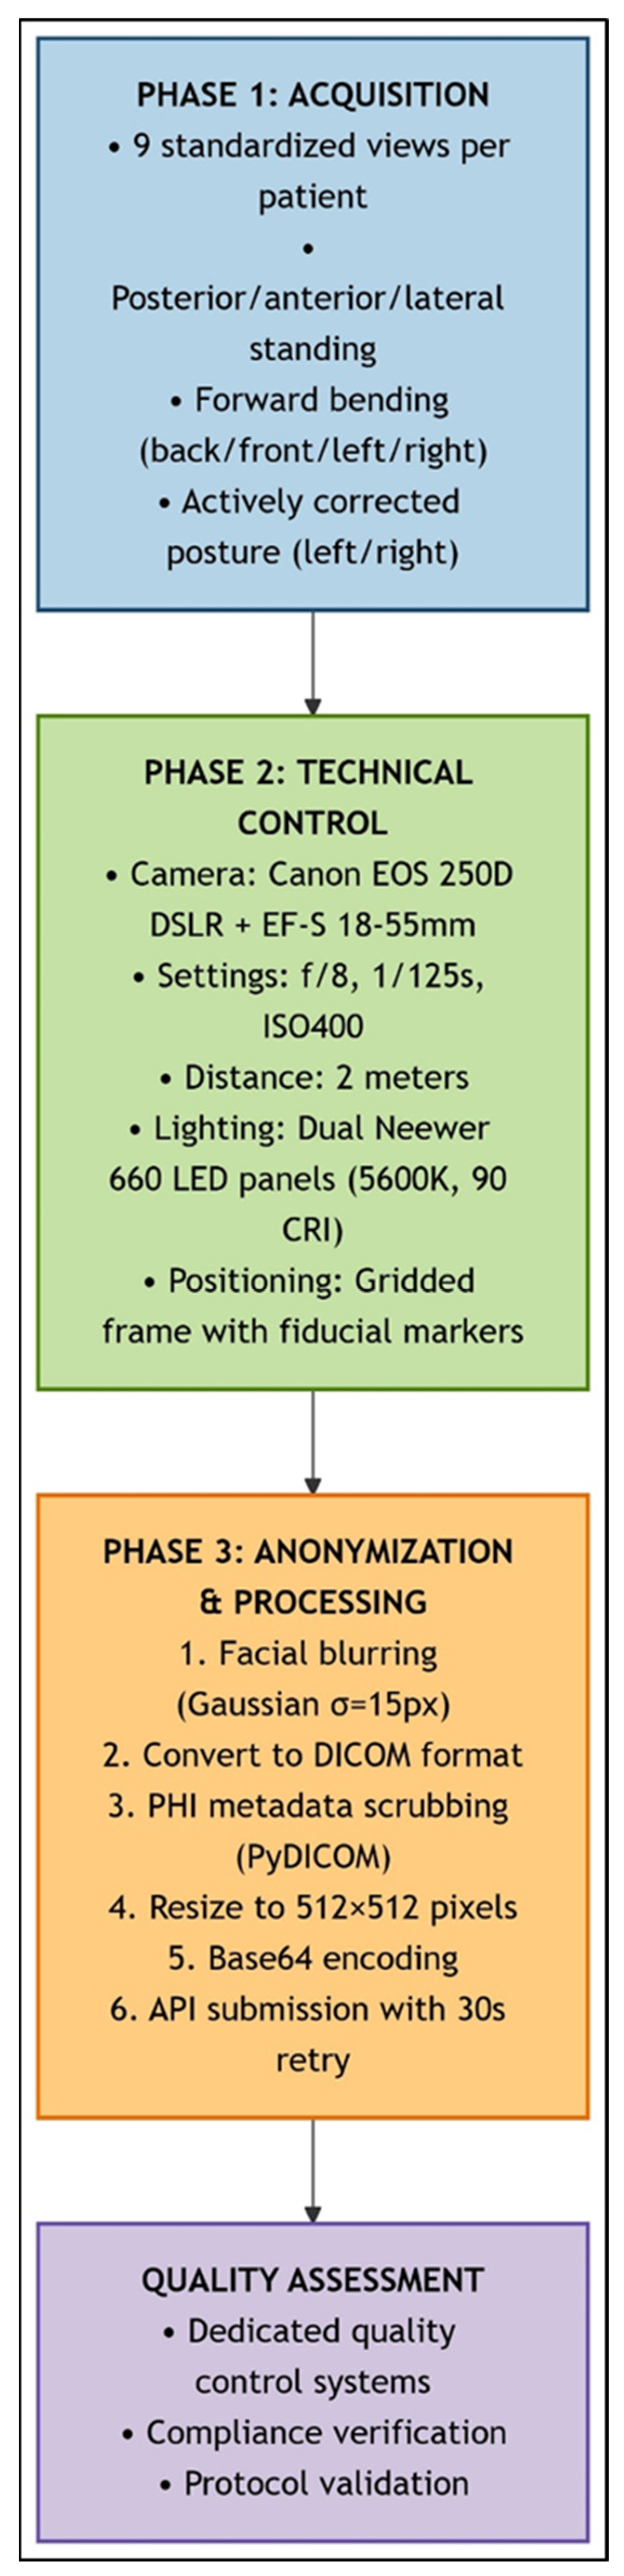
Standardized clinical photography workflow for scoliosis assessment. This schematic illustrates the sequential three-phase protocol for spinal deformity documentation: (1) Image Acquisition (blue): Nine standardized views were captured per patient (standing: posterior, anterior, lateral, and right/left bending; forward bending; and sitting: posterior, anterior, and lateral) using fiduci-al-marked positioning frame. (2) Technical Control (green): Standardized imaging parameters were maintained (Canon EOS 250D DSLR, f/8, 1/125 s, ISO 400, 2 m distance, and dual LED lighting at 45°). (3) Anonymization and Processing (orange): Facial Gaussian blur (σ = 15 px), DICOM conversion with PHI scrubbing, resizing (512 × 512 px), and Base64–encoding were carried out. API submission with 30 s retry logic was used. Quality verification systems ensured protocol compliance throughout the study.
Figure 2.
Standardized clinical photography workflow for scoliosis assessment. This schematic illustrates the sequential three-phase protocol for spinal deformity documentation: (1) Image Acquisition (blue): Nine standardized views were captured per patient (standing: posterior, anterior, lateral, and right/left bending; forward bending; and sitting: posterior, anterior, and lateral) using fiduci-al-marked positioning frame. (2) Technical Control (green): Standardized imaging parameters were maintained (Canon EOS 250D DSLR, f/8, 1/125 s, ISO 400, 2 m distance, and dual LED lighting at 45°). (3) Anonymization and Processing (orange): Facial Gaussian blur (σ = 15 px), DICOM conversion with PHI scrubbing, resizing (512 × 512 px), and Base64–encoding were carried out. API submission with 30 s retry logic was used. Quality verification systems ensured protocol compliance throughout the study.
Figure 3.
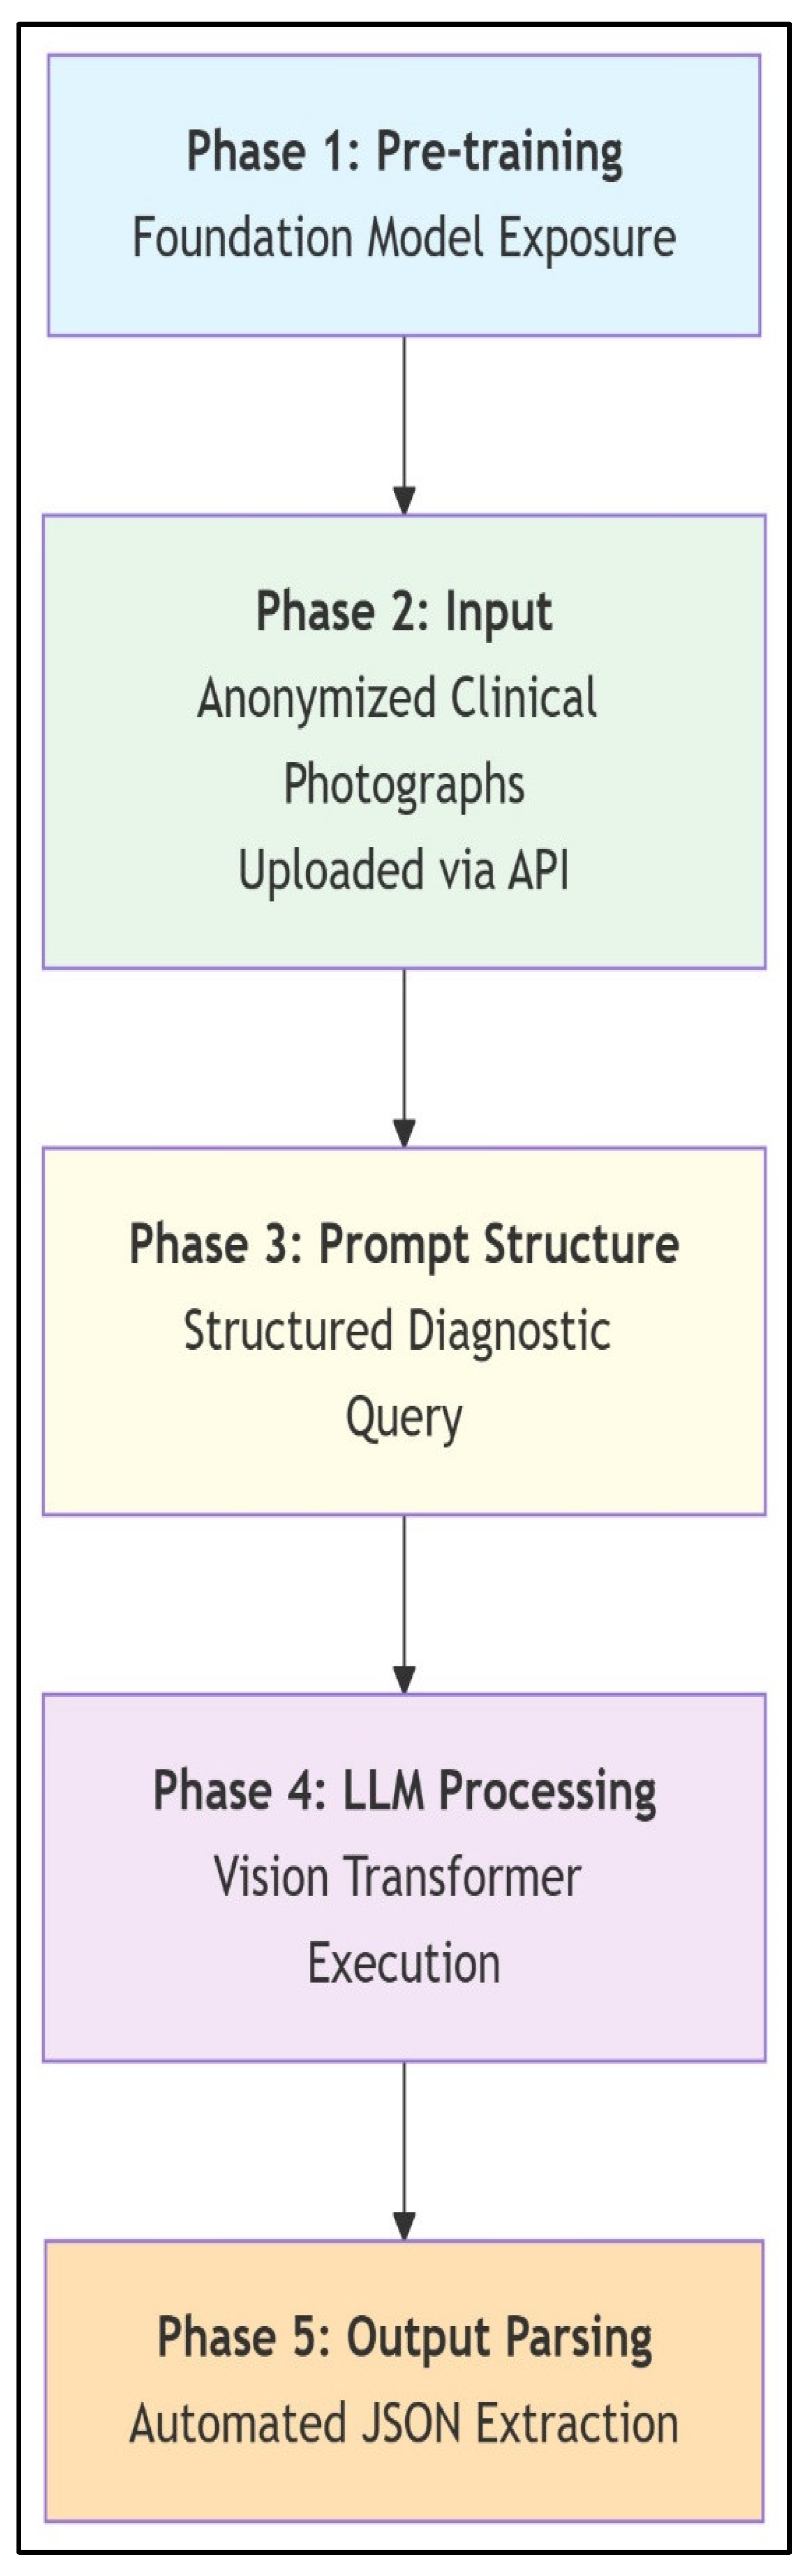
Scoliosis analysis workflow with multimodal LLMs. This schematic illustrates the LLM workflow for zero-shot scoliosis analysis. General-purpose foundation models leverage pre-training on broad internet image–text pairs, including incidental spinal imagery, without scoliosis-specific fine-tuning. Anonymized clinical photographs are submitted via API, followed by standardized diagnostic prompting that directs the LLM to classify AIS versus postural asymmetry; estimate major Cobb angles; localize curves (thoracic/lumbar/thoracolumbar); and provide stepwise reasoning. Vision transformers process images into token sequences correlated with textual concepts, enabling diagnostic inferences solely through architectural capabilities and prompted reasoning. Outputs are automatically parsed from JSON responses to extract clinical parameters. The workflow demonstrates how multimodal LLMs achieve specialized medical tasks via structured prompting and inherent pattern recognition, bypassing domain-specific training.
Figure 3.
Scoliosis analysis workflow with multimodal LLMs. This schematic illustrates the LLM workflow for zero-shot scoliosis analysis. General-purpose foundation models leverage pre-training on broad internet image–text pairs, including incidental spinal imagery, without scoliosis-specific fine-tuning. Anonymized clinical photographs are submitted via API, followed by standardized diagnostic prompting that directs the LLM to classify AIS versus postural asymmetry; estimate major Cobb angles; localize curves (thoracic/lumbar/thoracolumbar); and provide stepwise reasoning. Vision transformers process images into token sequences correlated with textual concepts, enabling diagnostic inferences solely through architectural capabilities and prompted reasoning. Outputs are automatically parsed from JSON responses to extract clinical parameters. The workflow demonstrates how multimodal LLMs achieve specialized medical tasks via structured prompting and inherent pattern recognition, bypassing domain-specific training.
![Medicina 61 01342 g003]()
Figure 4.
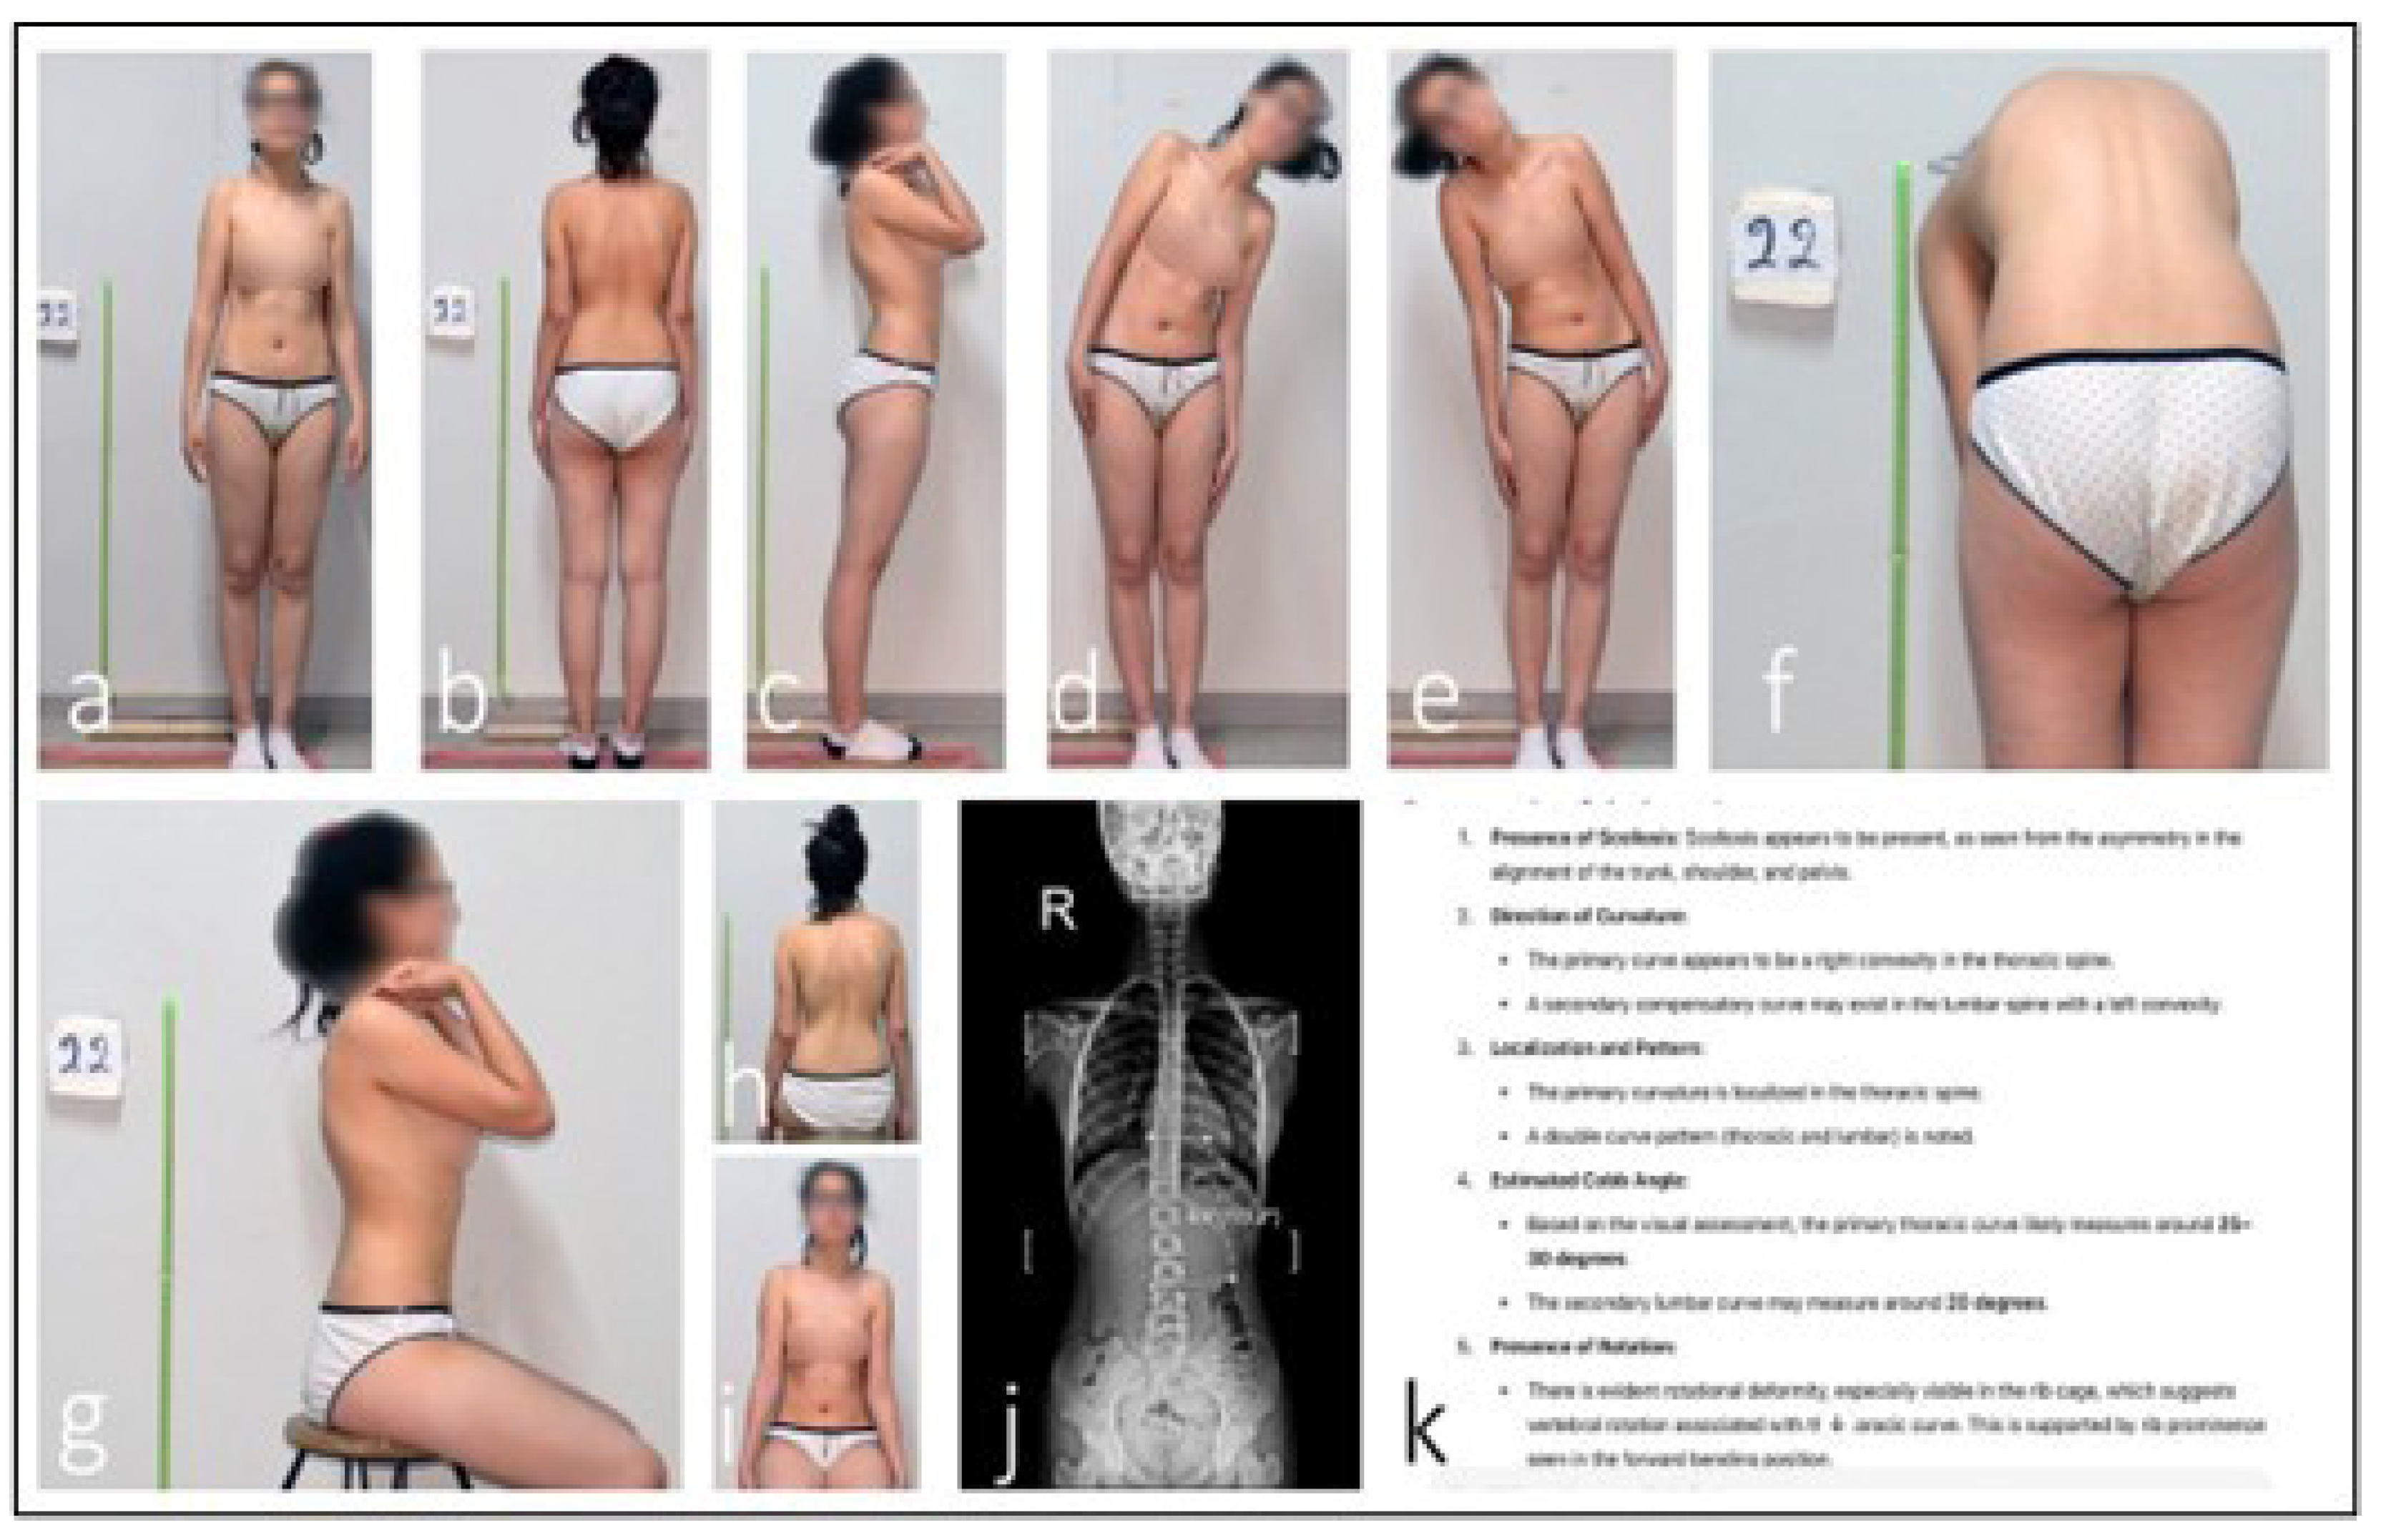
Discrepancy in ChatGPT AI-assisted scoliosis assessment. An analysis of the patient’s clinical photographs by the ChatGPT AI system identified an estimated 25–30° thoracic scoliosis with an interpreted 20° compensatory lumbar curvature (a–h,k). Seated anterior view with neutral shoulder position, used to assess trunk symmetry and anterior rib prominence (i). However, radiographic evaluation measured the lumbar Cobb angle at 6.8°. This discrepancy indicates that the AI system misclassified postural asymmetry as a structural thoracic curve (j).
Figure 4.
Discrepancy in ChatGPT AI-assisted scoliosis assessment. An analysis of the patient’s clinical photographs by the ChatGPT AI system identified an estimated 25–30° thoracic scoliosis with an interpreted 20° compensatory lumbar curvature (a–h,k). Seated anterior view with neutral shoulder position, used to assess trunk symmetry and anterior rib prominence (i). However, radiographic evaluation measured the lumbar Cobb angle at 6.8°. This discrepancy indicates that the AI system misclassified postural asymmetry as a structural thoracic curve (j).
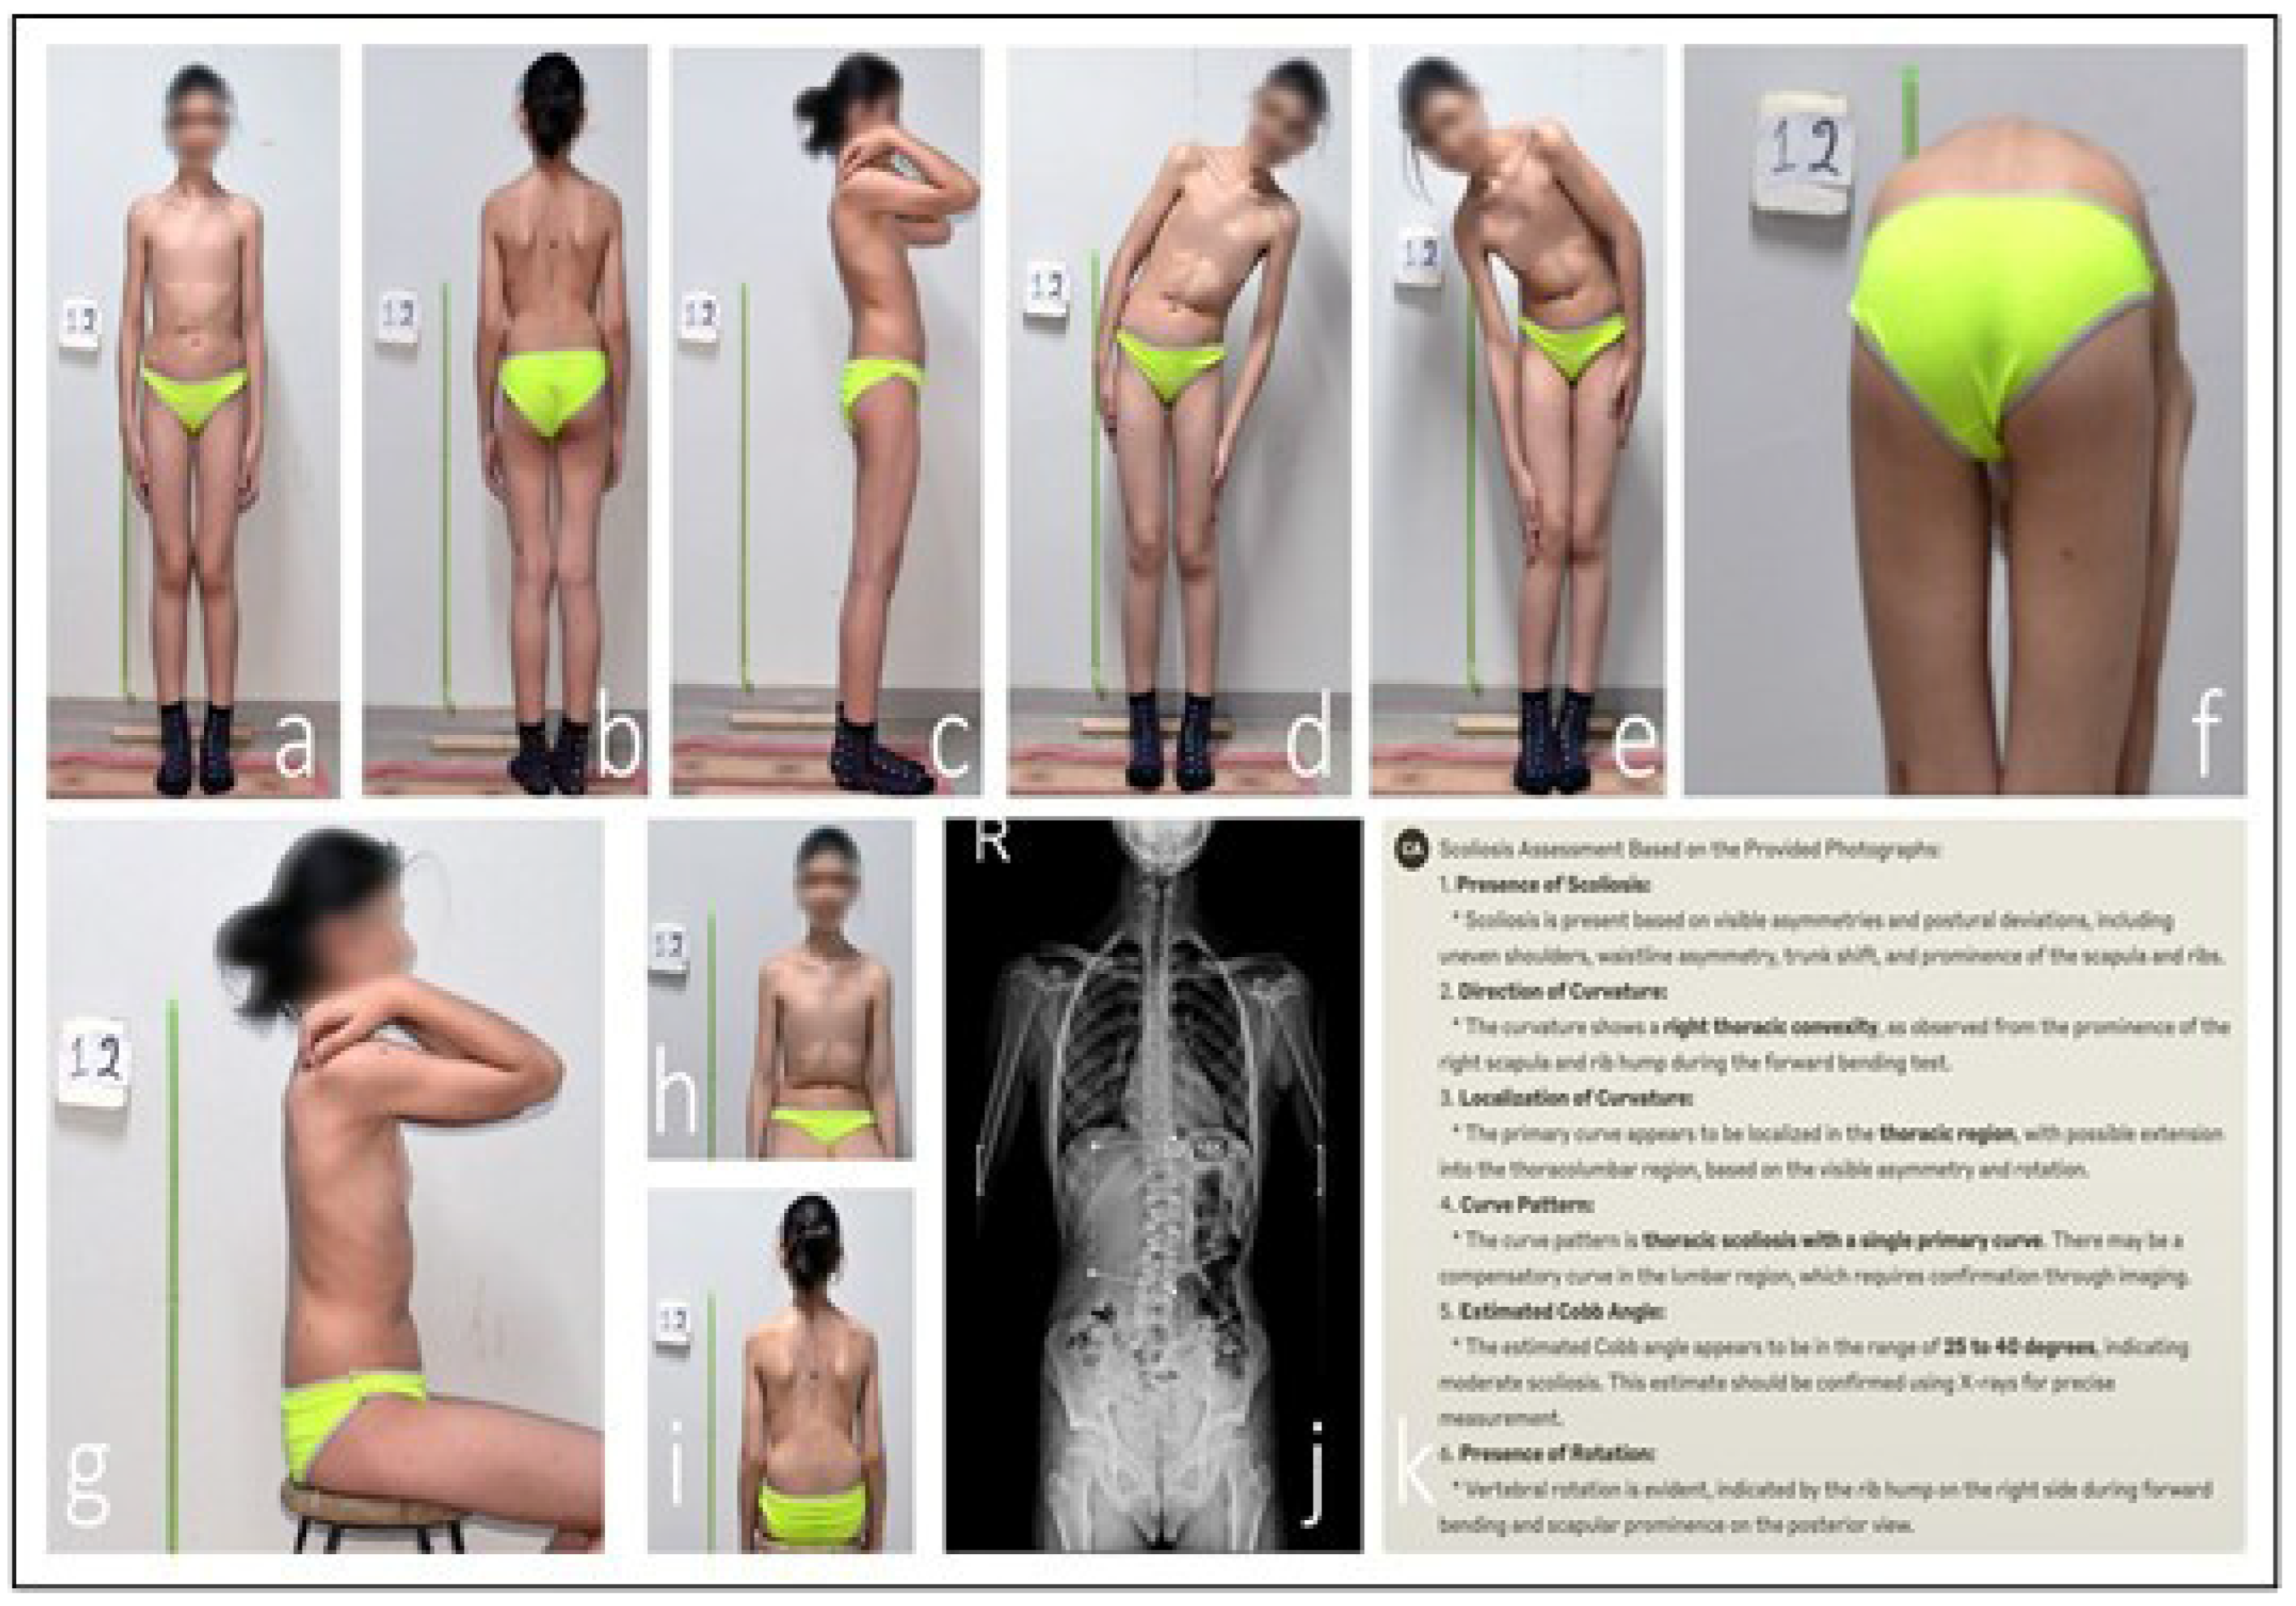
Figure 5.
Discrepancy in Claude AI-assisted scoliosis assessment. An analysis of the patient’s clinical photographs by the Claude AI system identified a single structural right-convex thoracic curve with an estimated Cobb angle of 25–40° (a–h,k). This view demonstrates spinal alignment and scapular symmetry while seated, helping differentiate structural curves from postural deviations (i). Radiographic evaluation, however, measured a lumbar Cobb angle of 15° (j). This discrepancy indicates that Claude misclassified the primary curve location and significantly overestimated its magnitude.
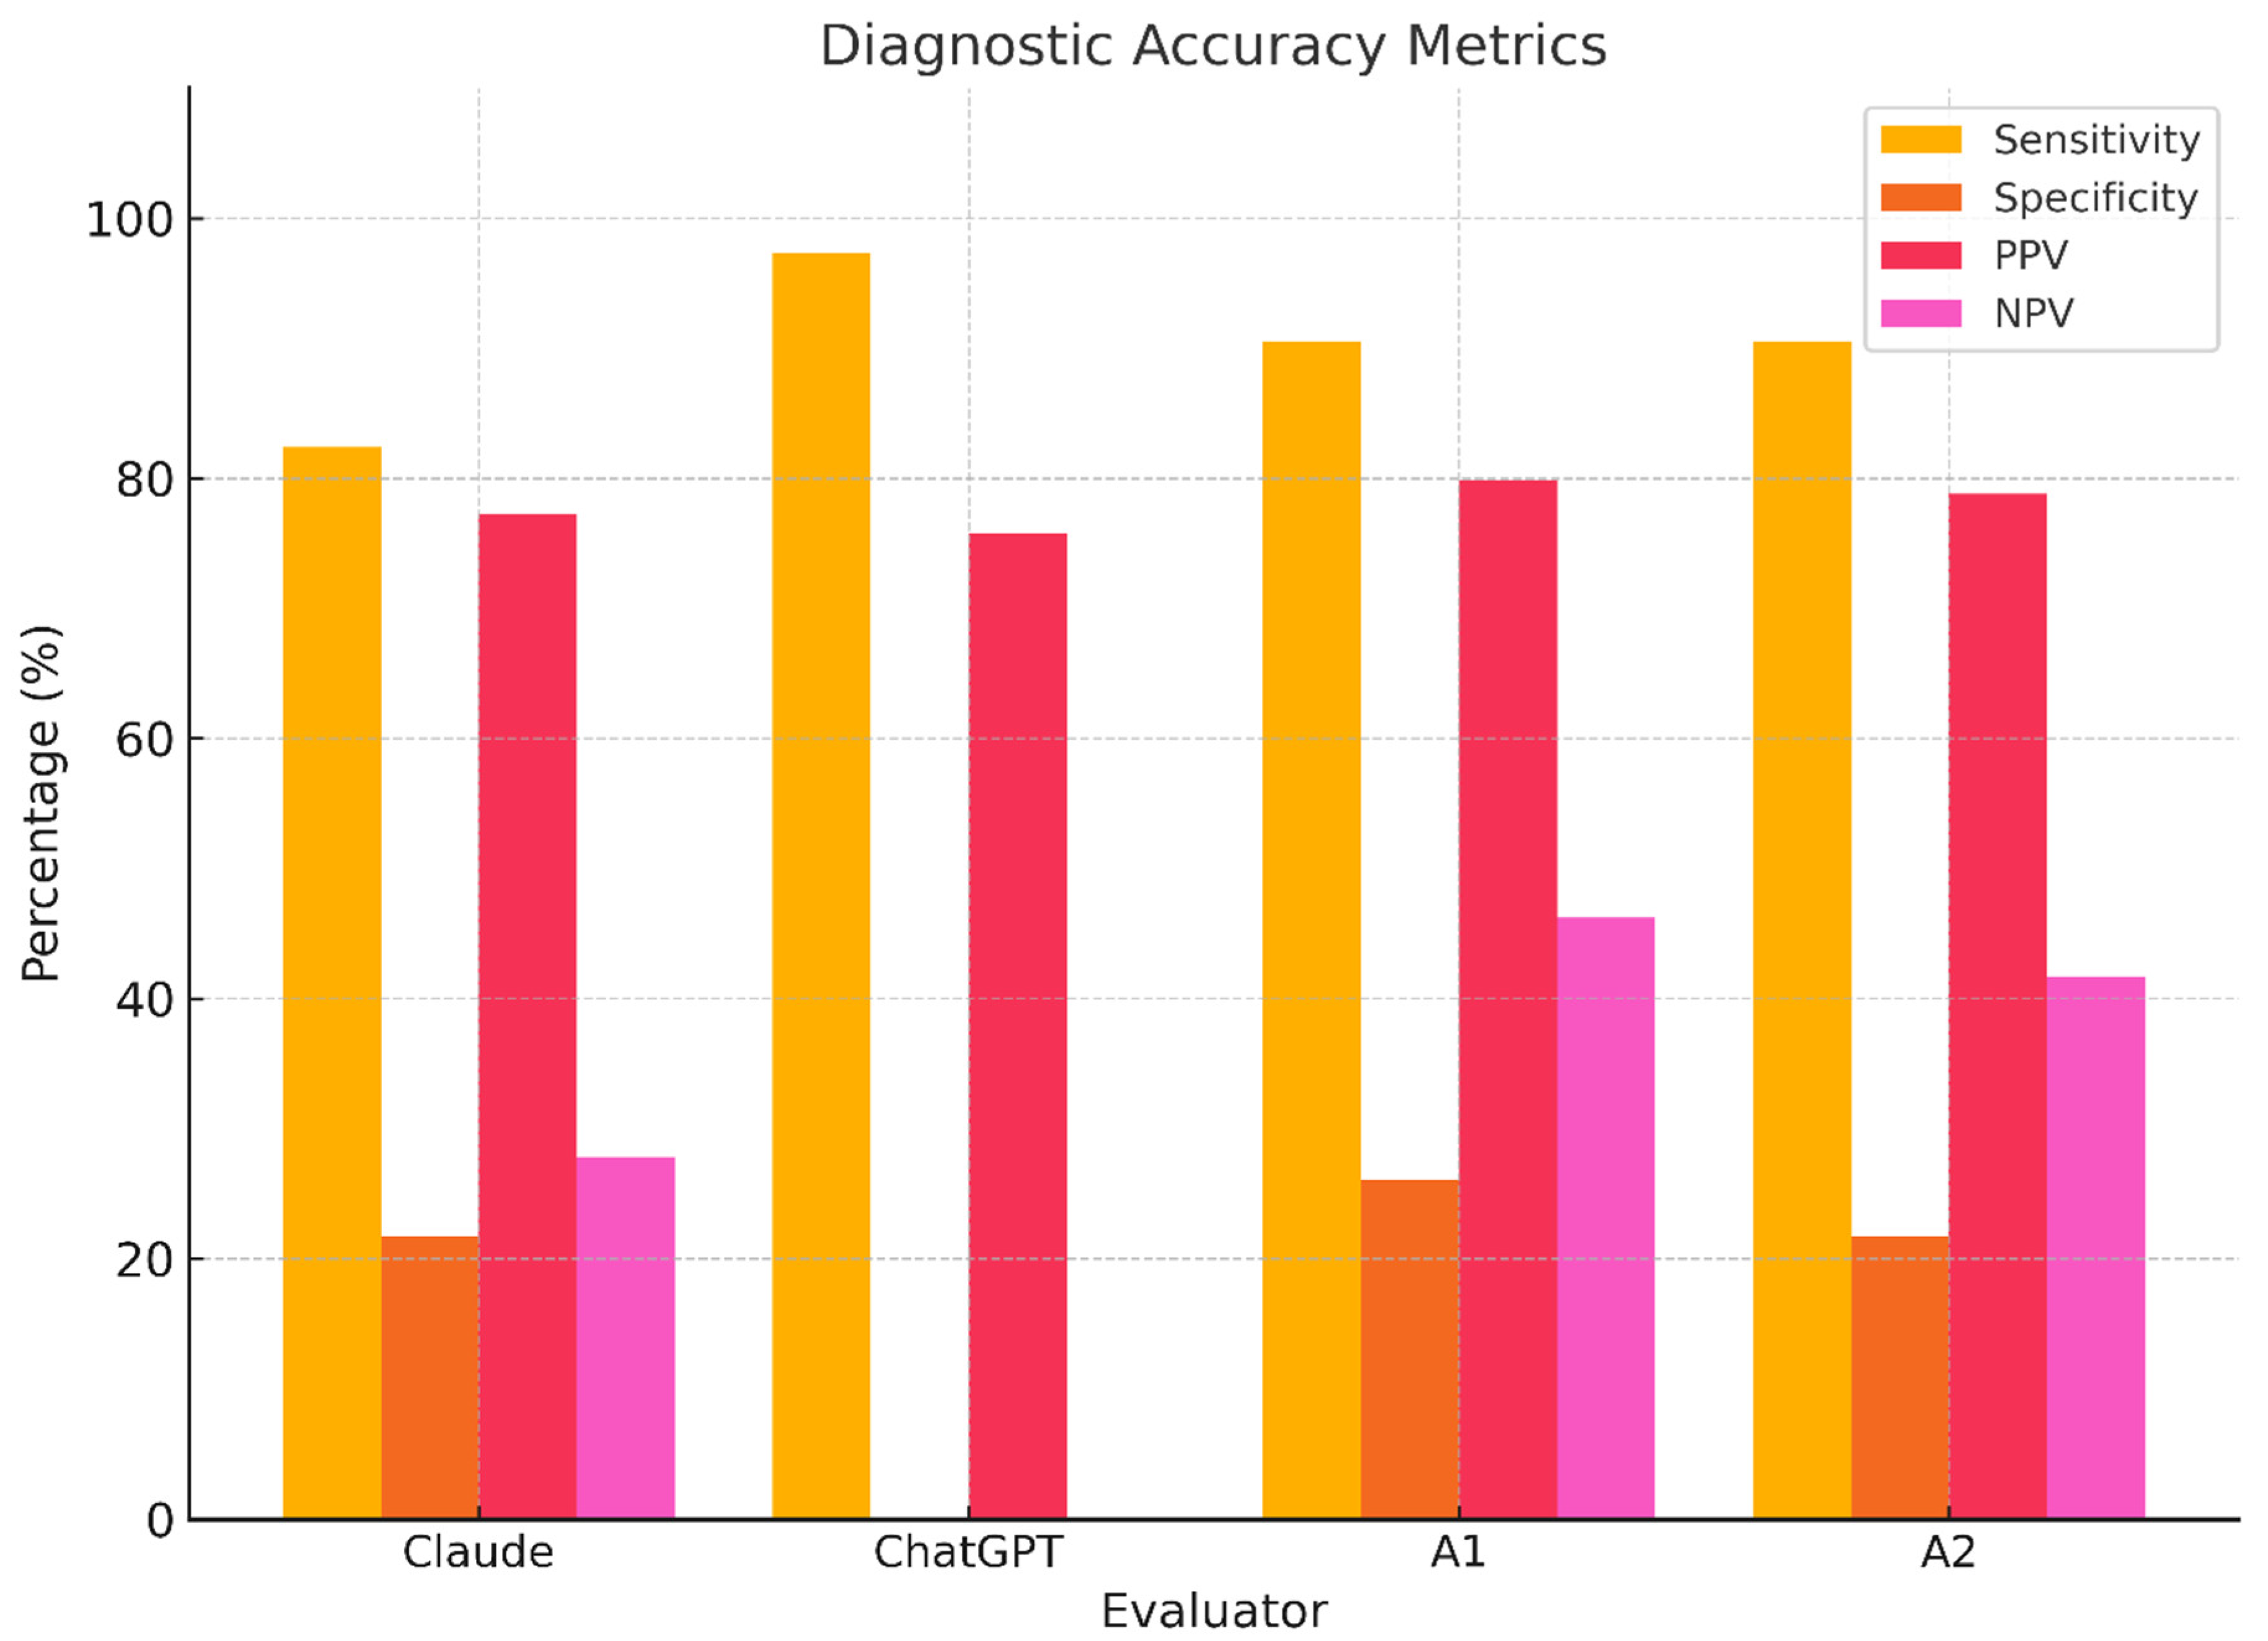
Figure 6.
Evaluator diagnostic performance metrics. Bar plots displaying sensitivity, specificity, positive predictive value (PPV), and negative predictive value (NPV) for each evaluator. ChatGPT shows catastrophic specificity loss; Claude and humans perform better but remain suboptimal.
Figure 6.
Evaluator diagnostic performance metrics. Bar plots displaying sensitivity, specificity, positive predictive value (PPV), and negative predictive value (NPV) for each evaluator. ChatGPT shows catastrophic specificity loss; Claude and humans perform better but remain suboptimal.
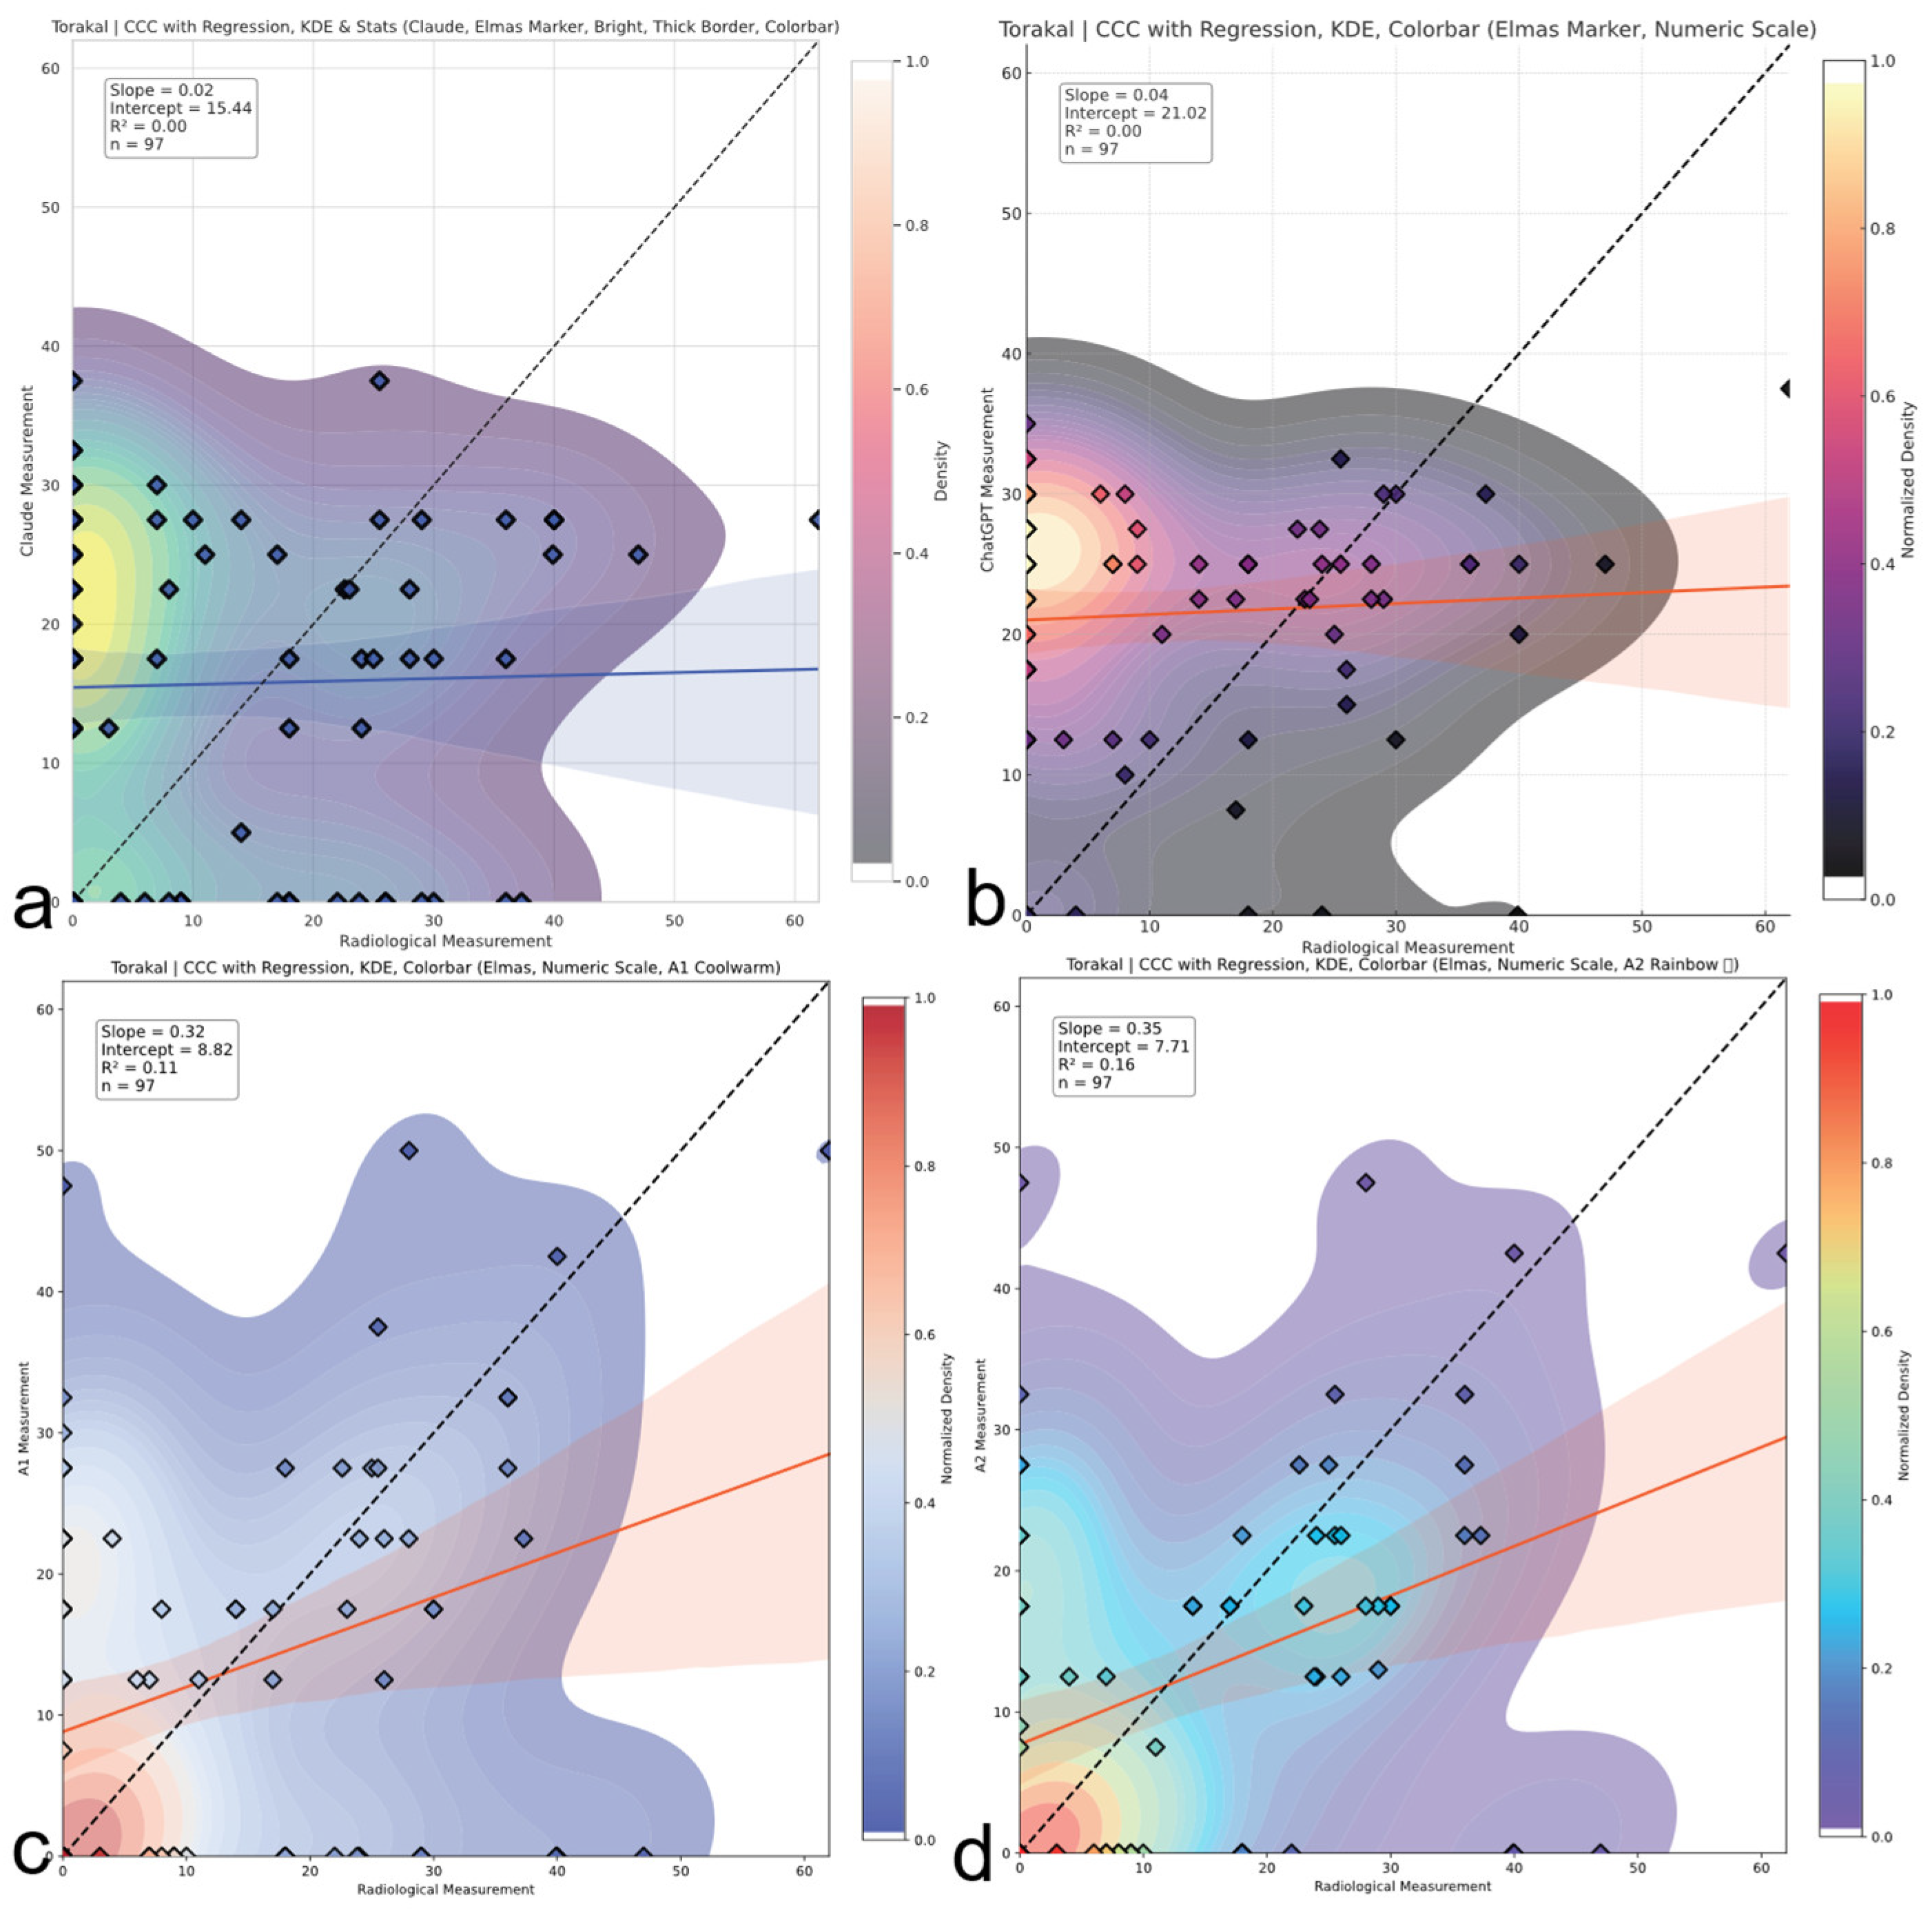
Figure 7.
Thoracic region CCC comparison. Concordance correlation coefficients (CCCs) across evaluators for thoracic Cobb angles. A2 shows weak to moderate agreement; AI models demonstrate negligible concordance with reference values. The red and blue line represents the linear regression line indicating the best-fit relationship between evaluators and radiological measurements. (a) Claude model output: CCC plot with regression, kernel density estimation (KDE), bright color theme, and thick borders. (b) ChatGPT model output: CCC plot with numeric colorbar and dark density-based colormap. (c) A1 output: CCC plot with KDE and regression using a warm colormap. (d) A2 output: CCC plot with KDE and regression using a rainbow colormap.
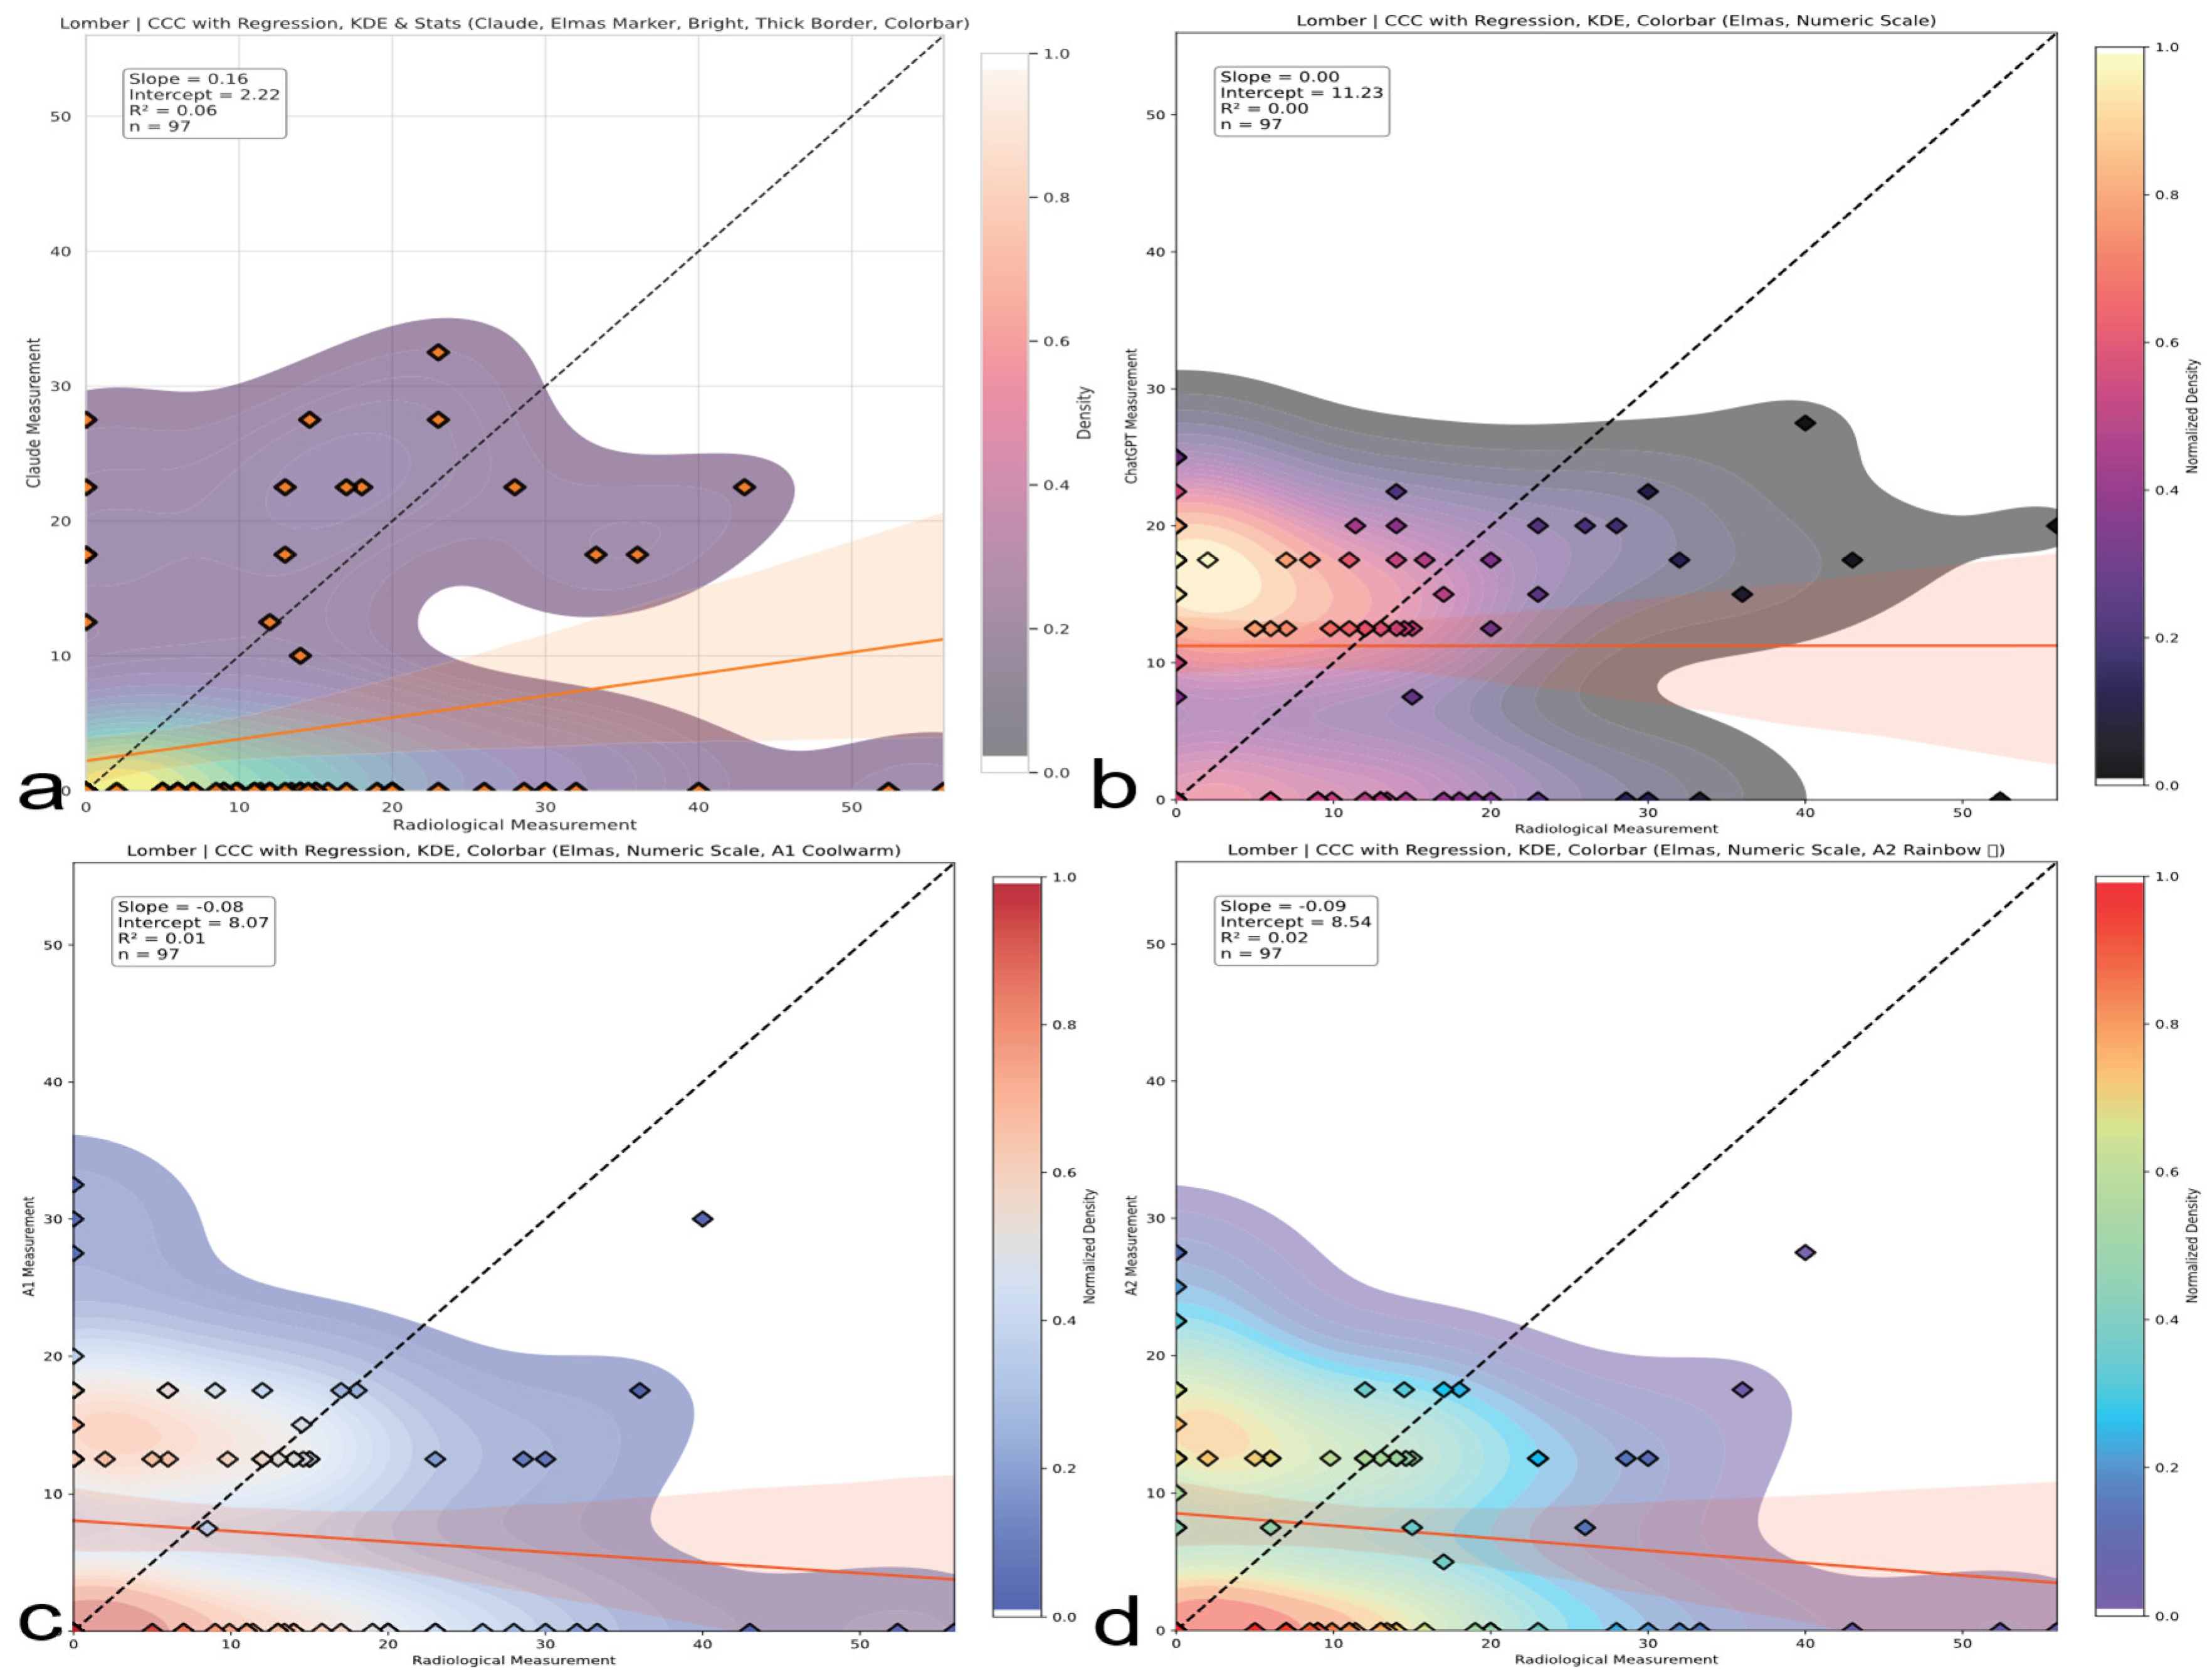
Figure 8.
Lumbar region CCC comparison. CCC analysis for lumbar curve assessments. Both human and AI evaluators show inverse or no agreement; AI models are particularly misaligned with radiographic standards. The red line represents the linear regression line indicating the best-fit relationship between evaluators and radiological measurements. (a) Claude model output: CCC plot with regression, kernel density estimation (KDE), bright color theme, and thick borders. (b) ChatGPT model output: CCC plot with numeric colorbar and dark density-based colormap. (c) A1 output: CCC plot with KDE and regression using a warm colormap. (d) A2 output: CCC plot with KDE and regression using a rainbow colormap.
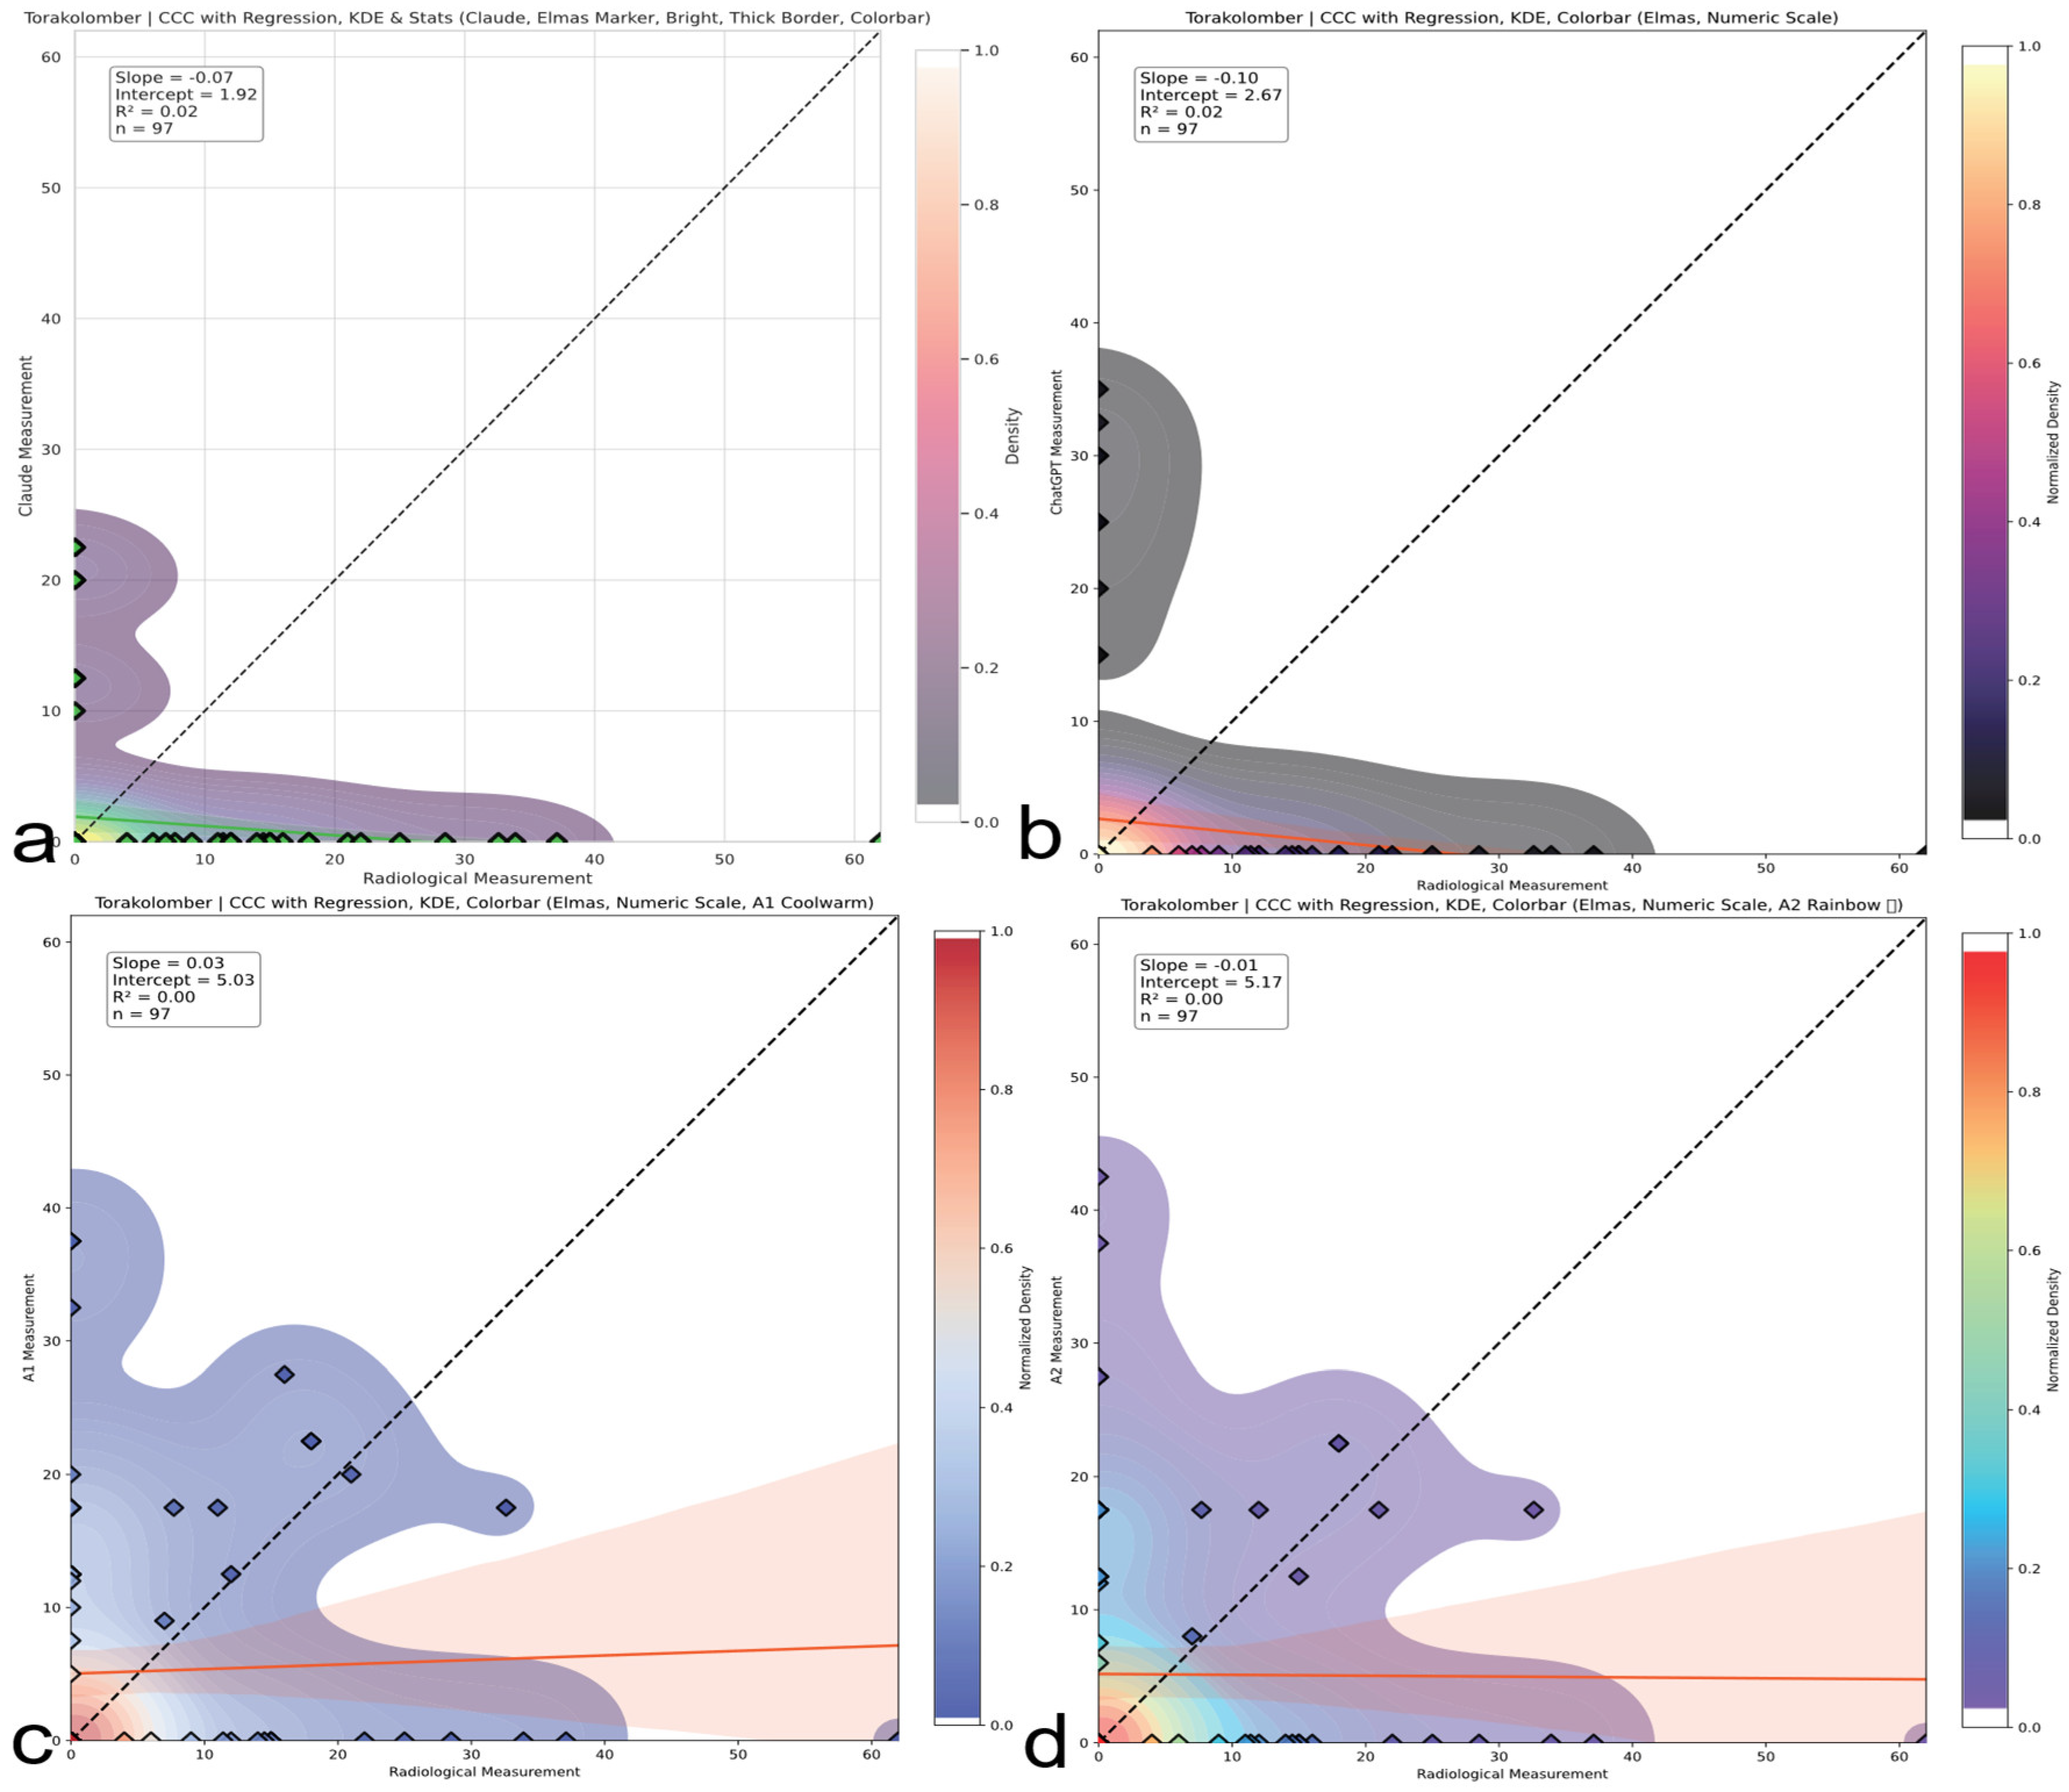
Figure 9.
Thoracolumbar region CCC comparison. CCC plots reveal systematic underestimation or overestimation in thoracolumbar curves. ChatGPT and Claude produce negative correlations; humans display minimal but unstable concordance. The red line represents the linear regression line indicating the best-fit relationship between evaluators and radiological measurements. (a) Claude model output: CCC plot with regression, kernel density estimation (KDE), bright color theme, and thick borders. (b) ChatGPT model output: CCC plot with numeric colorbar and dark density-based colormap. (c) A1 output: CCC plot with KDE and regression using a warm colormap. (d) A2 output: CCC plot with KDE and regression using a rainbow colormap.
Figure 10.
Bland–Altman plots (thoracic, lumbar, and thoracolumbar). Visual representation of bias and limits of agreement (LoAs) for thoracic (
Figure 10), lumbar (
Figure 11), and thoracolumbar (
Figure 12) regions. AI systems exhibit wide LoAs and systematic error patterns; human evaluators show narrower but still unacceptable dispersion. (
a) Bland–Altman plot for the Claude AI model, showing the differences between Claude and radiological measurements against their means. (
b) Bland–Altman plot for the ChatGPT AI model, showing the differences between ChatGPT and radiological measurements against their means. (
c) Bland–Altman plot for the A1 AI model, showing the differences between A1 and radiological measurements against their means. (
d) Bland–Altman plot for the A2 AI model, showing the differences between A2 and radiological measurements against their means.
Figure 11.
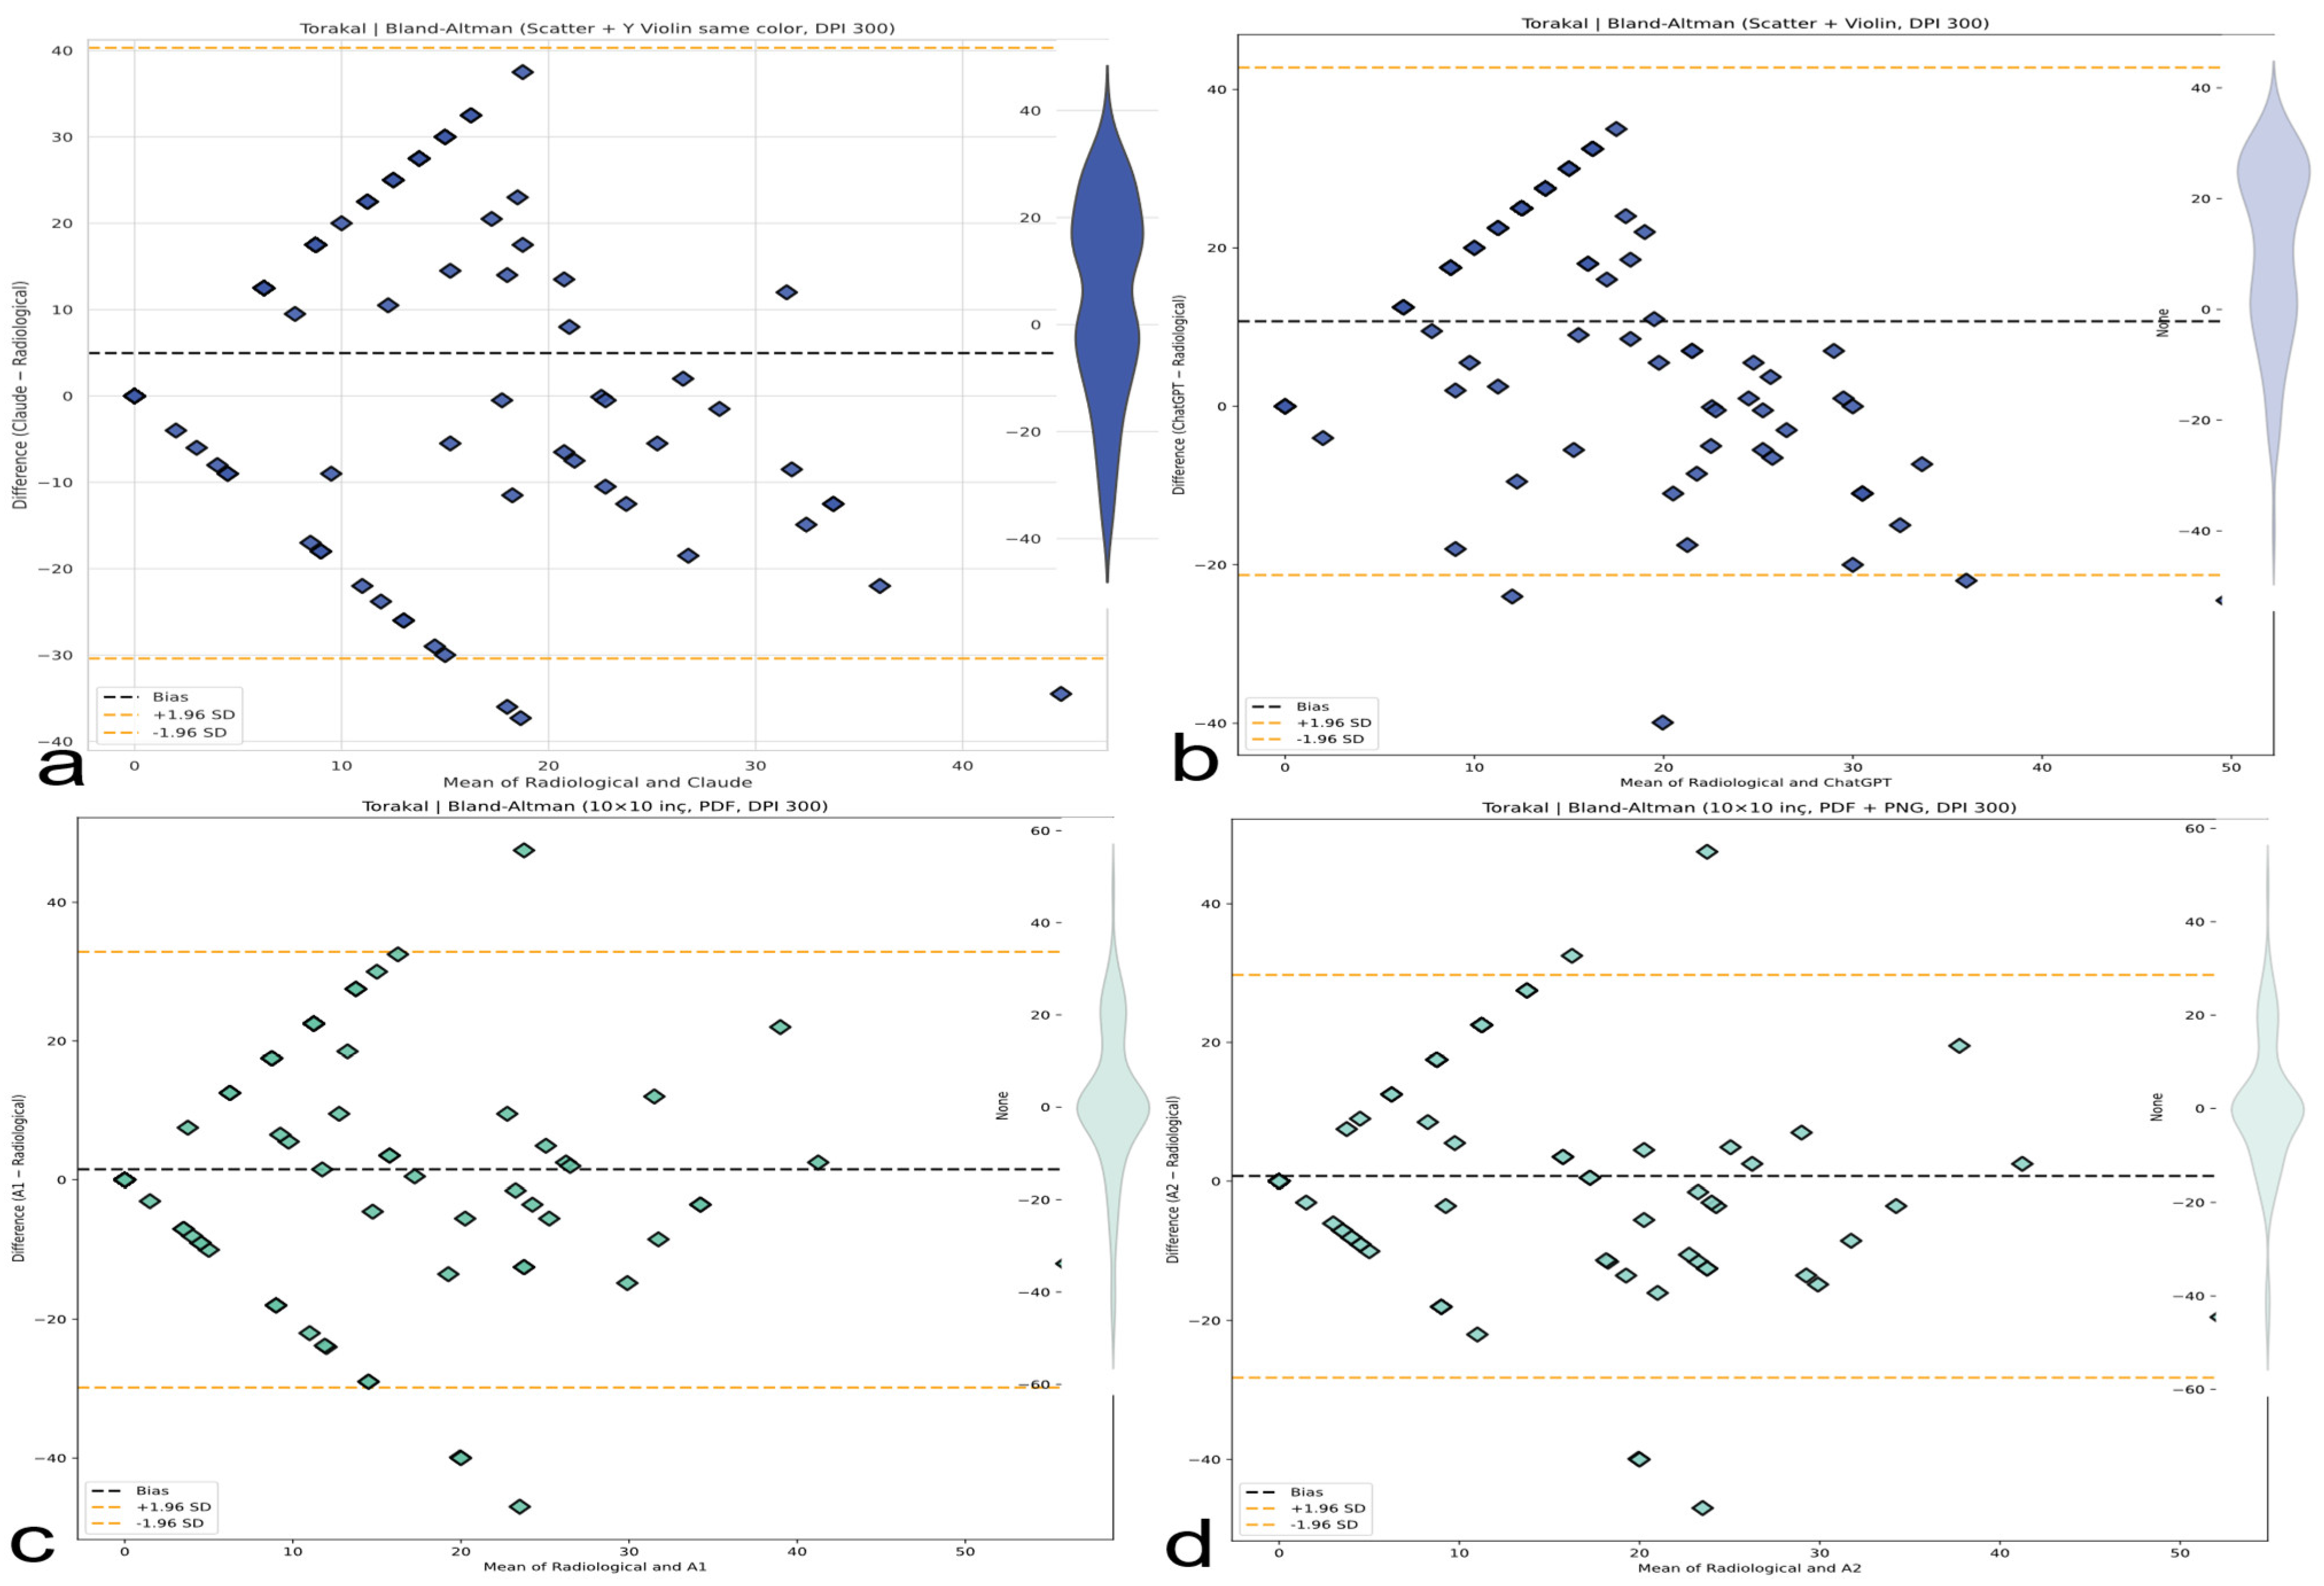
Bland–Altman analysis comparing AI-based thoracic scoliosis assessments with radiological measurements. Each subfigure presents the mean of paired measurements on the x-axis and their difference on the y-axis, with bias and ±1.96 SD limits indicated by dashed lines. Dashed black lines represent the bias, while dashed orange lines represent ±1.96 standard deviation limits. (a) Comparison between radiological measurements and the Claude model. The plot includes a blue violin plot indicating data distribution. (b) Comparison between radiological measurements and the ChatGPT model. A light blue violin plot visualizes the distribution of differences. (c) Comparison between radiological measurements and the A1 model. A green violin plot represents the data spread. (d) Comparison between radiological measurements and the A2 model. The accompanying violin plot indicates data dispersion in green.
Figure 11.
Bland–Altman analysis comparing AI-based thoracic scoliosis assessments with radiological measurements. Each subfigure presents the mean of paired measurements on the x-axis and their difference on the y-axis, with bias and ±1.96 SD limits indicated by dashed lines. Dashed black lines represent the bias, while dashed orange lines represent ±1.96 standard deviation limits. (a) Comparison between radiological measurements and the Claude model. The plot includes a blue violin plot indicating data distribution. (b) Comparison between radiological measurements and the ChatGPT model. A light blue violin plot visualizes the distribution of differences. (c) Comparison between radiological measurements and the A1 model. A green violin plot represents the data spread. (d) Comparison between radiological measurements and the A2 model. The accompanying violin plot indicates data dispersion in green.
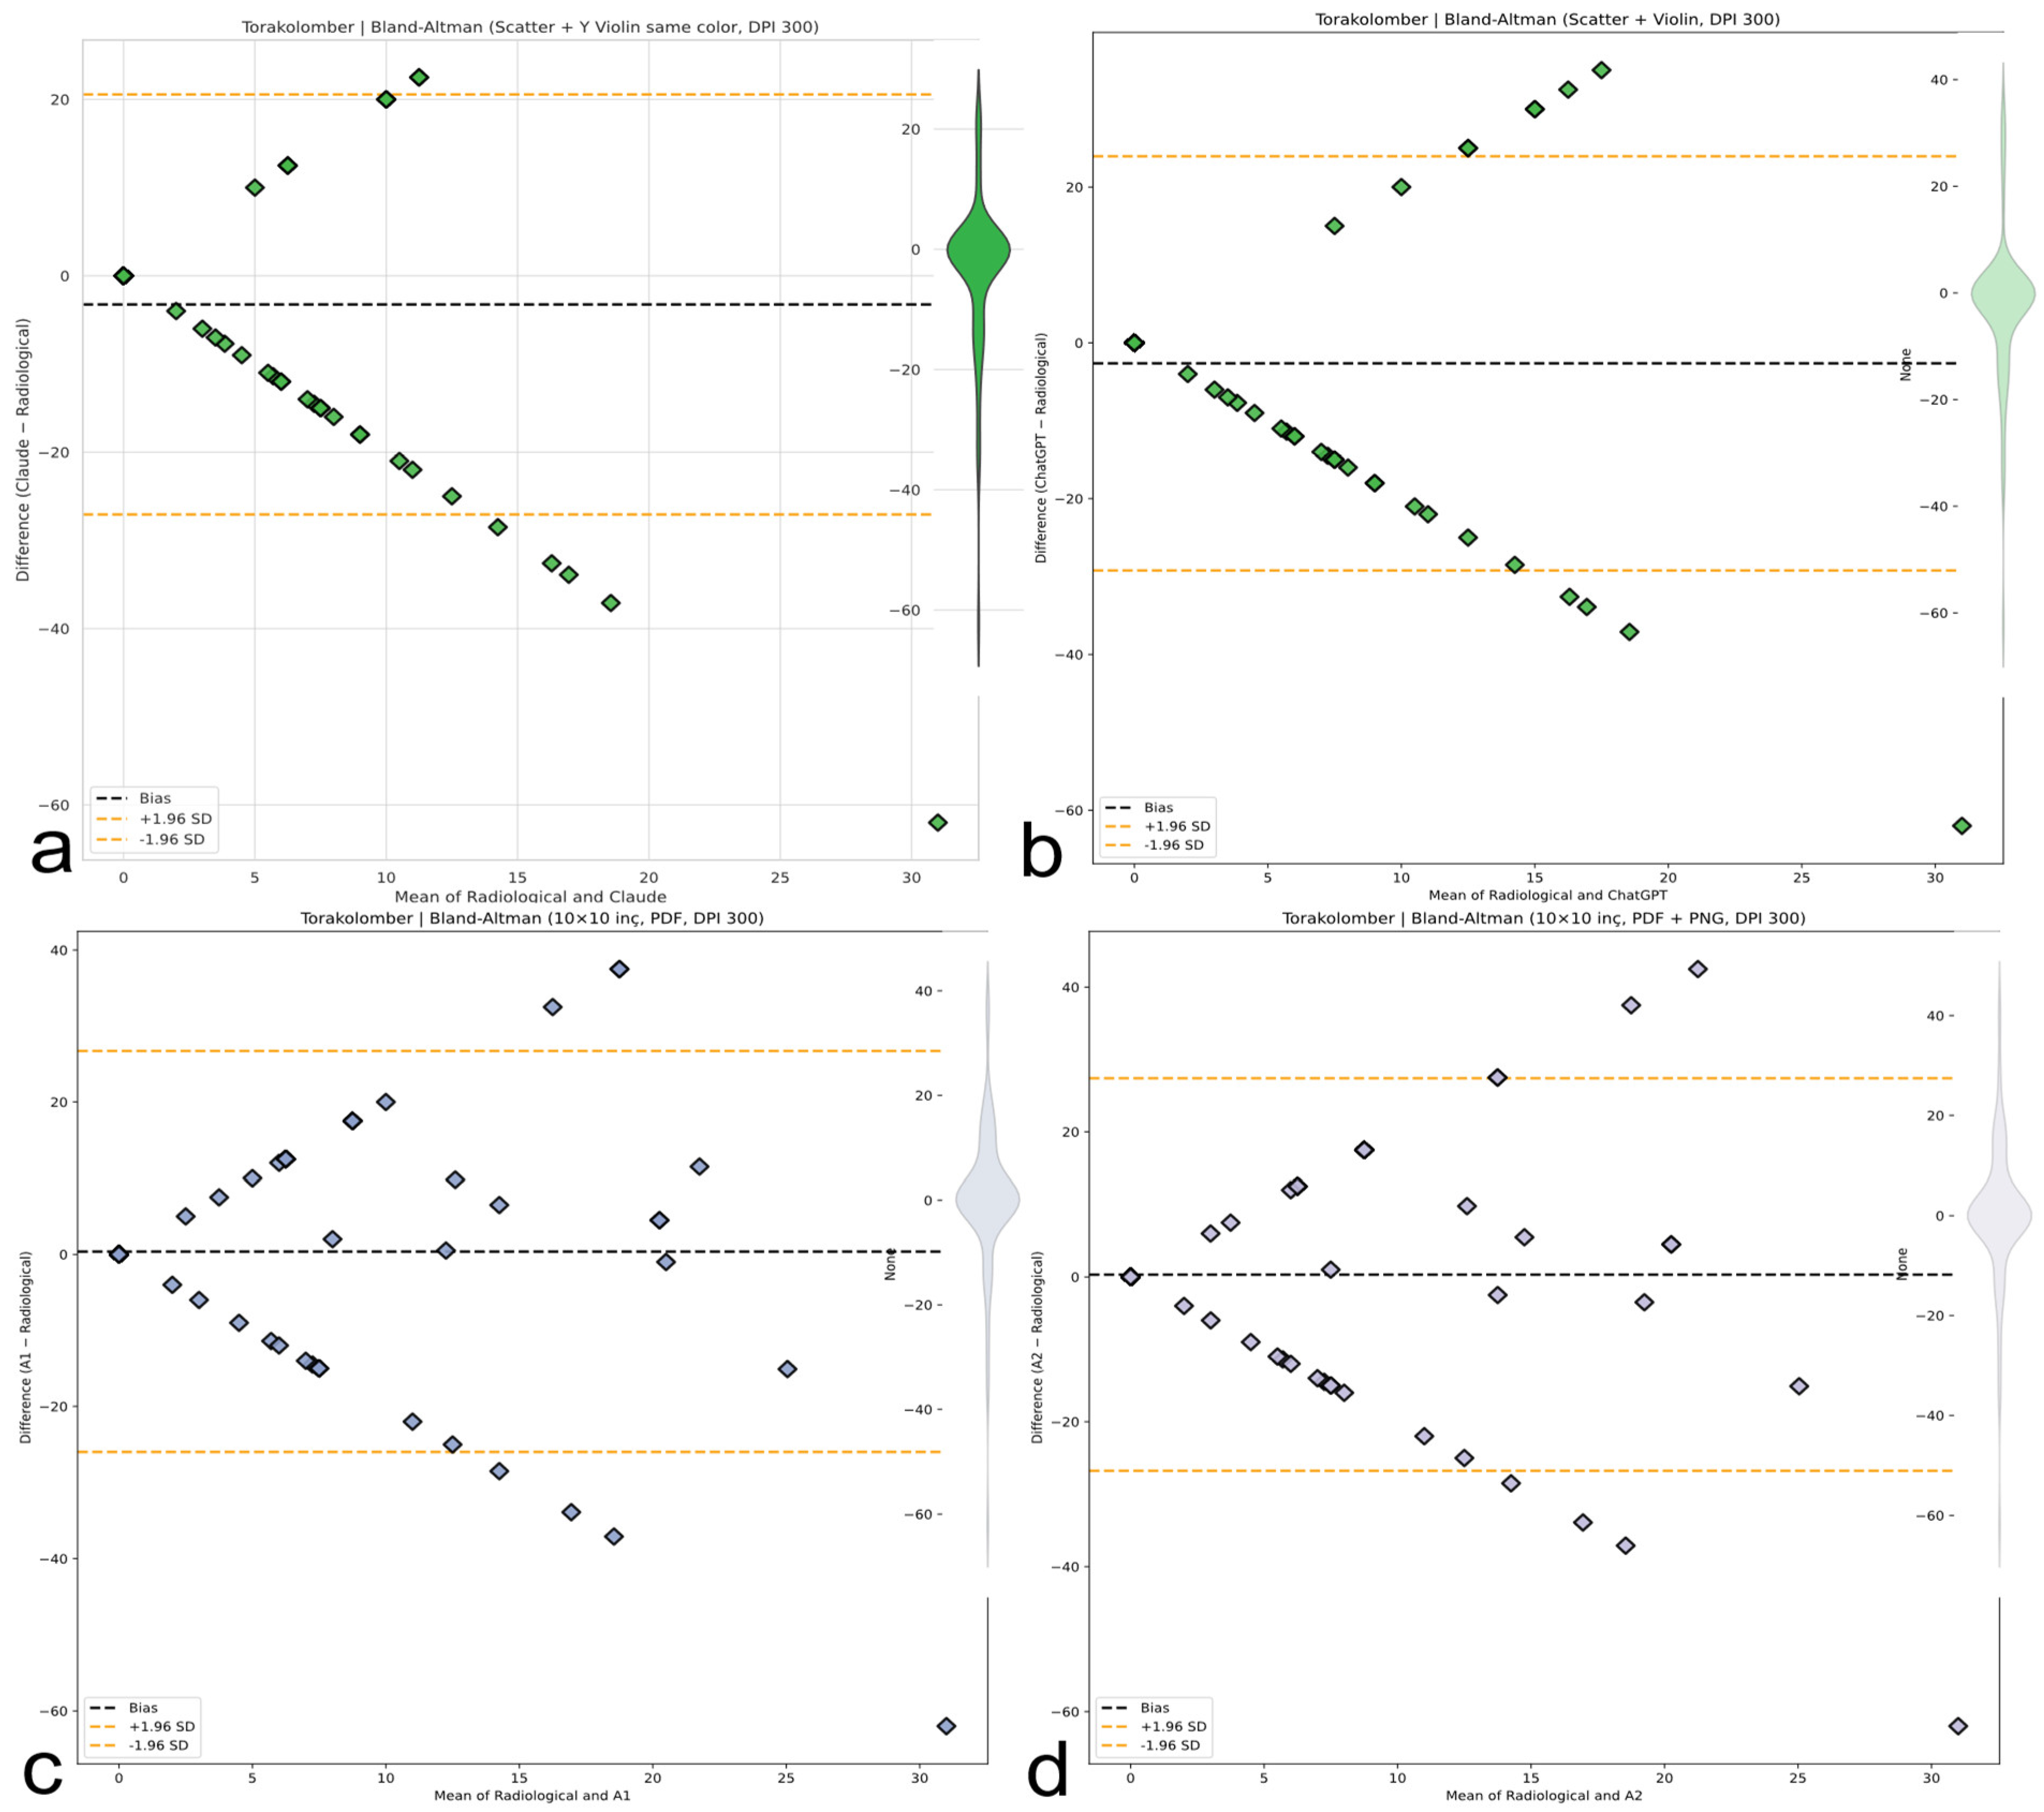
Figure 12.
Bland-Altman plots for thoracolumbar Cobb angle measurements comparing four methods with radiological ground truth. The plots display mean differences (bias, black dashed line) and 95% limits of agreement (±1.96 SD, orange dashed lines). Violin plots illustrate the distribution of measurement differences. (a) Claude AI: Consistently underestimates the thoracolumbar angle with a narrow distribution. (b) ChatGPT: Shows a similar underestimation trend as Claude, with minimal dispersion. (c) A1: Displays a wider spread of differences with moderate underestimation. (d) A2: Similar to A1, showing increased variability but with consistent bias.
Table 1.
Specialized AI vs. general-purpose AI for spine imaging.
Table 1.
Specialized AI vs. general-purpose AI for spine imaging.
| Feature | Specialized Convolutional Neural Networks (CNNs) | General-Purpose Multimodal LLMs |
|---|
| Design Purpose | Analyze medical images | Process text, images, and audio broadly |
| Validation | Often validated in specific medical tasks | Limited validation for medical diagnosis |
| Accessibility | Typically proprietary, clinic/hospital-based | Publicly accessible via web/apps |
| Example Use | Measuring Cobb angles from X-rays or surface scans | Answering general health questions |
Table 2.
Justification for the selection of ChatGPT and Claude in studying AI-assisted scoliosis assessment. ChatGPT and Claude were prioritized due to their public accessibility and multimodal capabilities, mirroring real-world consumer use for pre-clinical assessment. Their documented propensity for generating confidently unverified medical advice specifically addresses the study’s aim to evaluate high-impact risks in unregulated settings. Alternatives were excluded based on limited public availability, lack of image interfaces, or insufficient ecological validity for family use.
| Selection Criterion | ChatGPT and Claude | Excluded Alternatives | Methodological Imperative |
|---|
| 1. Public Accessibility and Real-World Relevance | | | Directly aligns with study goal: evaluating tools families actually use for initial pre-clinical assessment |
| 2. Multimodal Capability | | | Prerequisite for photographic assessment and real-world interaction paradigm |
| 3. Representation of “Confidently Unverified Advice” Risk | | | Addresses critical gap: high-risk outputs from high-use tools in unregulated settings |
| 4. Why Not Other LLMs? | | Gemini: Regional availability constraints/release timing issues Specialized medical LLMs (e.g., Med-PaLM): no public image–input interfaces Open-Source MLLMs (e.g., LLaVA): insufficient family adoption
| Ensures focus on high-impact, consumer-facing tools relevant to study scope |
Table 3.
Demographic and clinical profiles of the study cohort.
Table 3.
Demographic and clinical profiles of the study cohort.
| Characteristic | Value | Clinical Relevance |
|---|
| Participants (N) | 97 | Adequately powered cohort |
| Age (years) | 13.8 ± 2.4 | Peak AIS progression age |
| Female/Male ratio | 2.9/1 | Matches AIS epidemiology |
| Height (cm) | 157.3 ± 10.8 | Tanner stage-appropriate |
| BMI (kg/m2) | 19.57 ± 2.98 | Consistent with healthy adolescent norms |
| Diagnostic Groups | | |
| AIS (n = 74) | 76.3% | 40 thoracic, 22 lumbar, 12 thoracolumbar |
| Postural Asymmetry | 23.7% | Valid control group |
Table 4.
Diagnostic classification performance of AI models and human evaluators.
Table 4.
Diagnostic classification performance of AI models and human evaluators.
| Evaluator | Sensitivity (95% CI) | Specificity (95% CI) | PPV (95% CI) | NPV (95% CI) |
|---|
| Claude | 82.4% (71.8–90.3) | 21.7% (7.5–43.7) | 77.2% (66.4–85.8) | 27.8% (9.7–53.5) |
| ChatGPT | 97.3% (90.6–99.7) | 0.0% (0.0–14.8) | 75.8% (66.5–83.6) | 0.0% (0.0–84.2) |
| Asst. A1 | 90.5% (81.5–96.1) | 26.1% (10.2–48.4) | 79.8% (69.7–87.7) | 46.2% (19.2–74.9) |
| Asst. A2 | 90.5% (81.5–96.1) | 21.7% (7.5–43.7) | 78.8% (68.8–86.8) | 41.7% (15.2–72.3) |
Table 5.
Inter-rater agreement metrics for evaluators based on Cohen’s kappa (κ).
Table 5.
Inter-rater agreement metrics for evaluators based on Cohen’s kappa (κ).
| Evaluator | κ (95% CI) | Agreement Level | Clinical Interpretation |
|---|
| A1 | 0.196 (0.012–0.380) | Poor | Barely above chance |
| A2 | 0.147 (−0.038–0.332) | Very poor | Questionable reliability |
| Claude | 0.045 (−0.120–0.210) | None | Unacceptable for use |
| ChatGPT | −0.039 (−0.214–0.136) | Worse than chance | Hazardous systematic error |
Table 6.
Inter-method concordance for regional Cobb angle estimation (Lin’s Concordance Correlation Coefficient, CCC).
Table 6.
Inter-method concordance for regional Cobb angle estimation (Lin’s Concordance Correlation Coefficient, CCC).
| Region | Evaluator | CCC (95% CI) | Agreement Level | Clinical Meaning |
|---|
| Thoracic | Claude | 0.024 (−0.158–0.204) | None | Random fluctuation |
| | ChatGPT | 0.040 (−0.089–0.167) | None | No correlation |
| | A1 | 0.331 (0.144–0.496) | Poor | Minimally acceptable |
| | A2 | 0.350 (0.212–0.547) | Poor | Best human performance |
| Lumbar | Claude | 0.160 (0.032–0.337) | None | Unreliable |
| | ChatGPT | 0.0004 (−0.183–0.184) | None | Complete failure |
| | A1 | −0.080 | Discordant | Inversion tendency |
| | A2 | −0.090 | Discordant | Hazardous bias |
| Thoracolumbar | Claude | 0.030 (−0.249–0.042) | None | Near-zero agreement |
| | ChatGPT | 0.000 (−0.299–0.059) | None | Worst overall |
Table 7.
Global measurement agreement and clinical risk based on Bland–Altman analysis.
Table 7.
Global measurement agreement and clinical risk based on Bland–Altman analysis.
| Evaluator | Bias (°) | LoA Range (°) | 95% LoA (°) | Clinical Risk |
|---|
| Claude | +4.96 | 71.08 | −30.58 to +40.50 | Unacceptable |
| ChatGPT | +10.74 | 64.37 | −21.45 to +42.92 | Critical overestimation |
| Asst. A1 | +1.51 | 63.04 | −30.01 to +33.03 | Moderate risk |
| Asst. A2 | +0.76 | 58.25 | −28.37 to +29.88 | Least error |
Table 8.
Concordance Correlation Coefficients (CCCs) across curve subtypes.
Table 8.
Concordance Correlation Coefficients (CCCs) across curve subtypes.
| Curve Type | Best Evaluator | CCC | Worst Evaluator | CCC |
|---|
| Thoracic | A2 | 0.350 | ChatGPT | 0.040 |
| Double Major | A1 | 0.287 | Claude | −0.112 |
| Thoracolumbar | Gold Standard | N/A | ChatGPT | −0.100 |


 ,
, 

