
Phenotyping of Southern United States Soybean Cultivars for Potential Seed Weight and Seed Quality Compositions


1
Department of Plant and Soil Sciences, Mississippi State University, Starkville, MS 39762, USA
2
Field Crops Department, Tikrit University, Tikrit 009642, Iraq
*
Author to whom correspondence should be addressed.
Agronomy 2022, 12(4), 839; https://doi.org/10.3390/agronomy12040839
Submission received: 3 March 2022
/
Revised: 19 March 2022
/
Accepted: 25 March 2022
/
Published: 29 March 2022
(This article belongs to the Special Issue Effective Methods for Improving Seed Germination and Seed Quality)
Abstract
:Soybean Glycine max (L.) Merr. production trends have increased throughout the past century due to its versatile use in food, feed, and fuel industries. The selection of soybean cultivars with higher yields coupled with consumer-preferred seed quality has become a priority to sustain economic advantage. In this study, eighteen popular soybean cultivars from different maturity groups (MG III to V) were phenotyped for yield and quality traits under optimum water and nutrient conditions. Significant phenotypic variability was observed for days to flowering, yield, and seed quality traits. The late flowering soybean cultivars (MG V) recorded 14% lower seed weight than the early flowering (MG IV). Under optimum growing conditions, protein content increased with the MGs, but oil content decreased. Further, significant negative correlations between protein and yield, oil, and sucrose were observed. In contrast, the oil content was positively correlated with yield. Cultivars 539-T3 and GT-477CR2 were classified as high-yielding short-duration soybean cultivars. Based on the cultivar performance index, MS 4616 RXT and 7547XT were found to have a combination of desirable industry traits such as high protein, and oil content with high yield compared to other cultivars. The current research provides prospective benchmark seed weight and quality parameters under sunlit and temperature conditions with optimum water and nutrient conditions for many soybean cultivars grown in the US Mid-South. Furthermore, it can assist growers and breeders in selecting soybean cultivars with high protein and oil specific to their regional demand.
Keywords:
soybean; maturity group; flowering; yield; quality; fatty acids; sugars; performance indices1. Introduction
Soybean [Glycine max (L.) Merr.] is one of the leguminous oilseed crops considered a rich protein and oil source for humans and livestock. Currently, it occupies the largest cropping area in the world (over 126 million hectares) and the second-largest cropping area in the USA (33.3 million hectares) [1]. The top three (Brazil, USA, and Argentina) soybean-producing or exporting countries accounted for about 80% of total soybean production [2], corresponding to USD ~52 billion (26.1, 22.8, and 3 billion, respectively) in value in 2017. In 2020, the USA produced 3.0 million metric tons of soybeans, with yields breaking records in many soybean-growing regions such as Illinois, Indiana, Nebraska, Kentucky, and Mississippi [3].
Soybean has the highest total protein (up to 42%) and oil content (up to 22%) compared to other food crops [4]. Soybean seed protein comprises 18 amino acids, and its oil is high in unsaturated fatty acids. Thus, the composition and content of seed quality traits significantly influence the food and byproduct industry. Protein sources are used to make soy milk, soy meal, snaps, tofu, and other foods, while soybean oil is used to manufacture cooking oil, margarine, cosmetics, biofuels, etc. Many nutritionists and medical specialists suggest that soy foods (soymilk, tofu, and natto) are crucial for a healthy diet [5]. With the expansion of soybean use in multiple industries, animal feed, beverages, personal care, nutritional supplements, medicines, and biomaterials, including biofuels [2], the demand for high-quality soybean is predicted to increase over the coming years due to the wide range of soybean products and byproducts applications [6].
Genetic variability in yield-related characteristics has been explored and used in different breeding programs [7]. As the demand for soybeans relies heavily on their nutritional value, there is an increasing need for high-yielding soybean cultivars without compromising the quality. Over the years, breeding for yield-related traits, seed weight and seed number has effectively increased soybeans’ genetic gain and production [8]. However, the genetic enhancement of seed quality traits has often been overlooked due to a lack of high throughput screening tools. Laboratory-based destructive seed quality traits like protein, oil, sugar, and other measurements are laborious, expensive, and time-consuming; this has been one of the major bottlenecks for breeding quality traits in soybean. Advancements in near-infrared spectroscopy (NIRS) aided the phenotyping of many samples without complicated sample preparations. Recently, the phenotyping of soybeans for seed quality composition, oil, and protein using non-destructive tools has become an essential breeding priority [9].
Soybean yield and quality traits have been reported to be affected by genotype (G), environment (E; rainfall, temperature, and solar radiation), and management (M; planting date, nutrient application, crop rotation, no-till, and others) [10]. On the other hand, soybean production experiences in-season weather or disease pressure during cropping, affecting the soybean yield and seed quality [11,12]. Besides environment and management-induced changes in yield and quality, the genetic potential of soybean seed quality composition has not received similar attention as yield under non-stress and optimum nutrient conditions. Limited studies have examined the influence of flowering on seed weight and quality. Understanding the relationship between the days to fifty percent flowering, yield, and quality-related traits assists in selecting suitable soybean cultivar for the US Mid-South climatic conditions. High-yielding and short-duration varieties are becoming an option to sustain maximum yield and quality potential under various environments in field crops. Therefore, we attempted to identify short-duration high-yielding soybean cultivars with better seed quality (high protein and oil) composition under US Mid-South growing region conditions. This study explores the genetic variability in yield and quality traits, using three maturity groups under resource-sufficient conditions. The specific objectives of the study were to: (1) evaluate the genetic potential of soybean cultivars for yield traits under non-stress conditions; (2) assess the variability of seed quality composition using non-destructive NIRS analysis; (3) determine the underlying tradeoff between yield and quality traits; and (4) identify short-duration high yielding soybean with high protein or oil.
2. Materials and Methods
2.1. Plant Material and Growing Condition
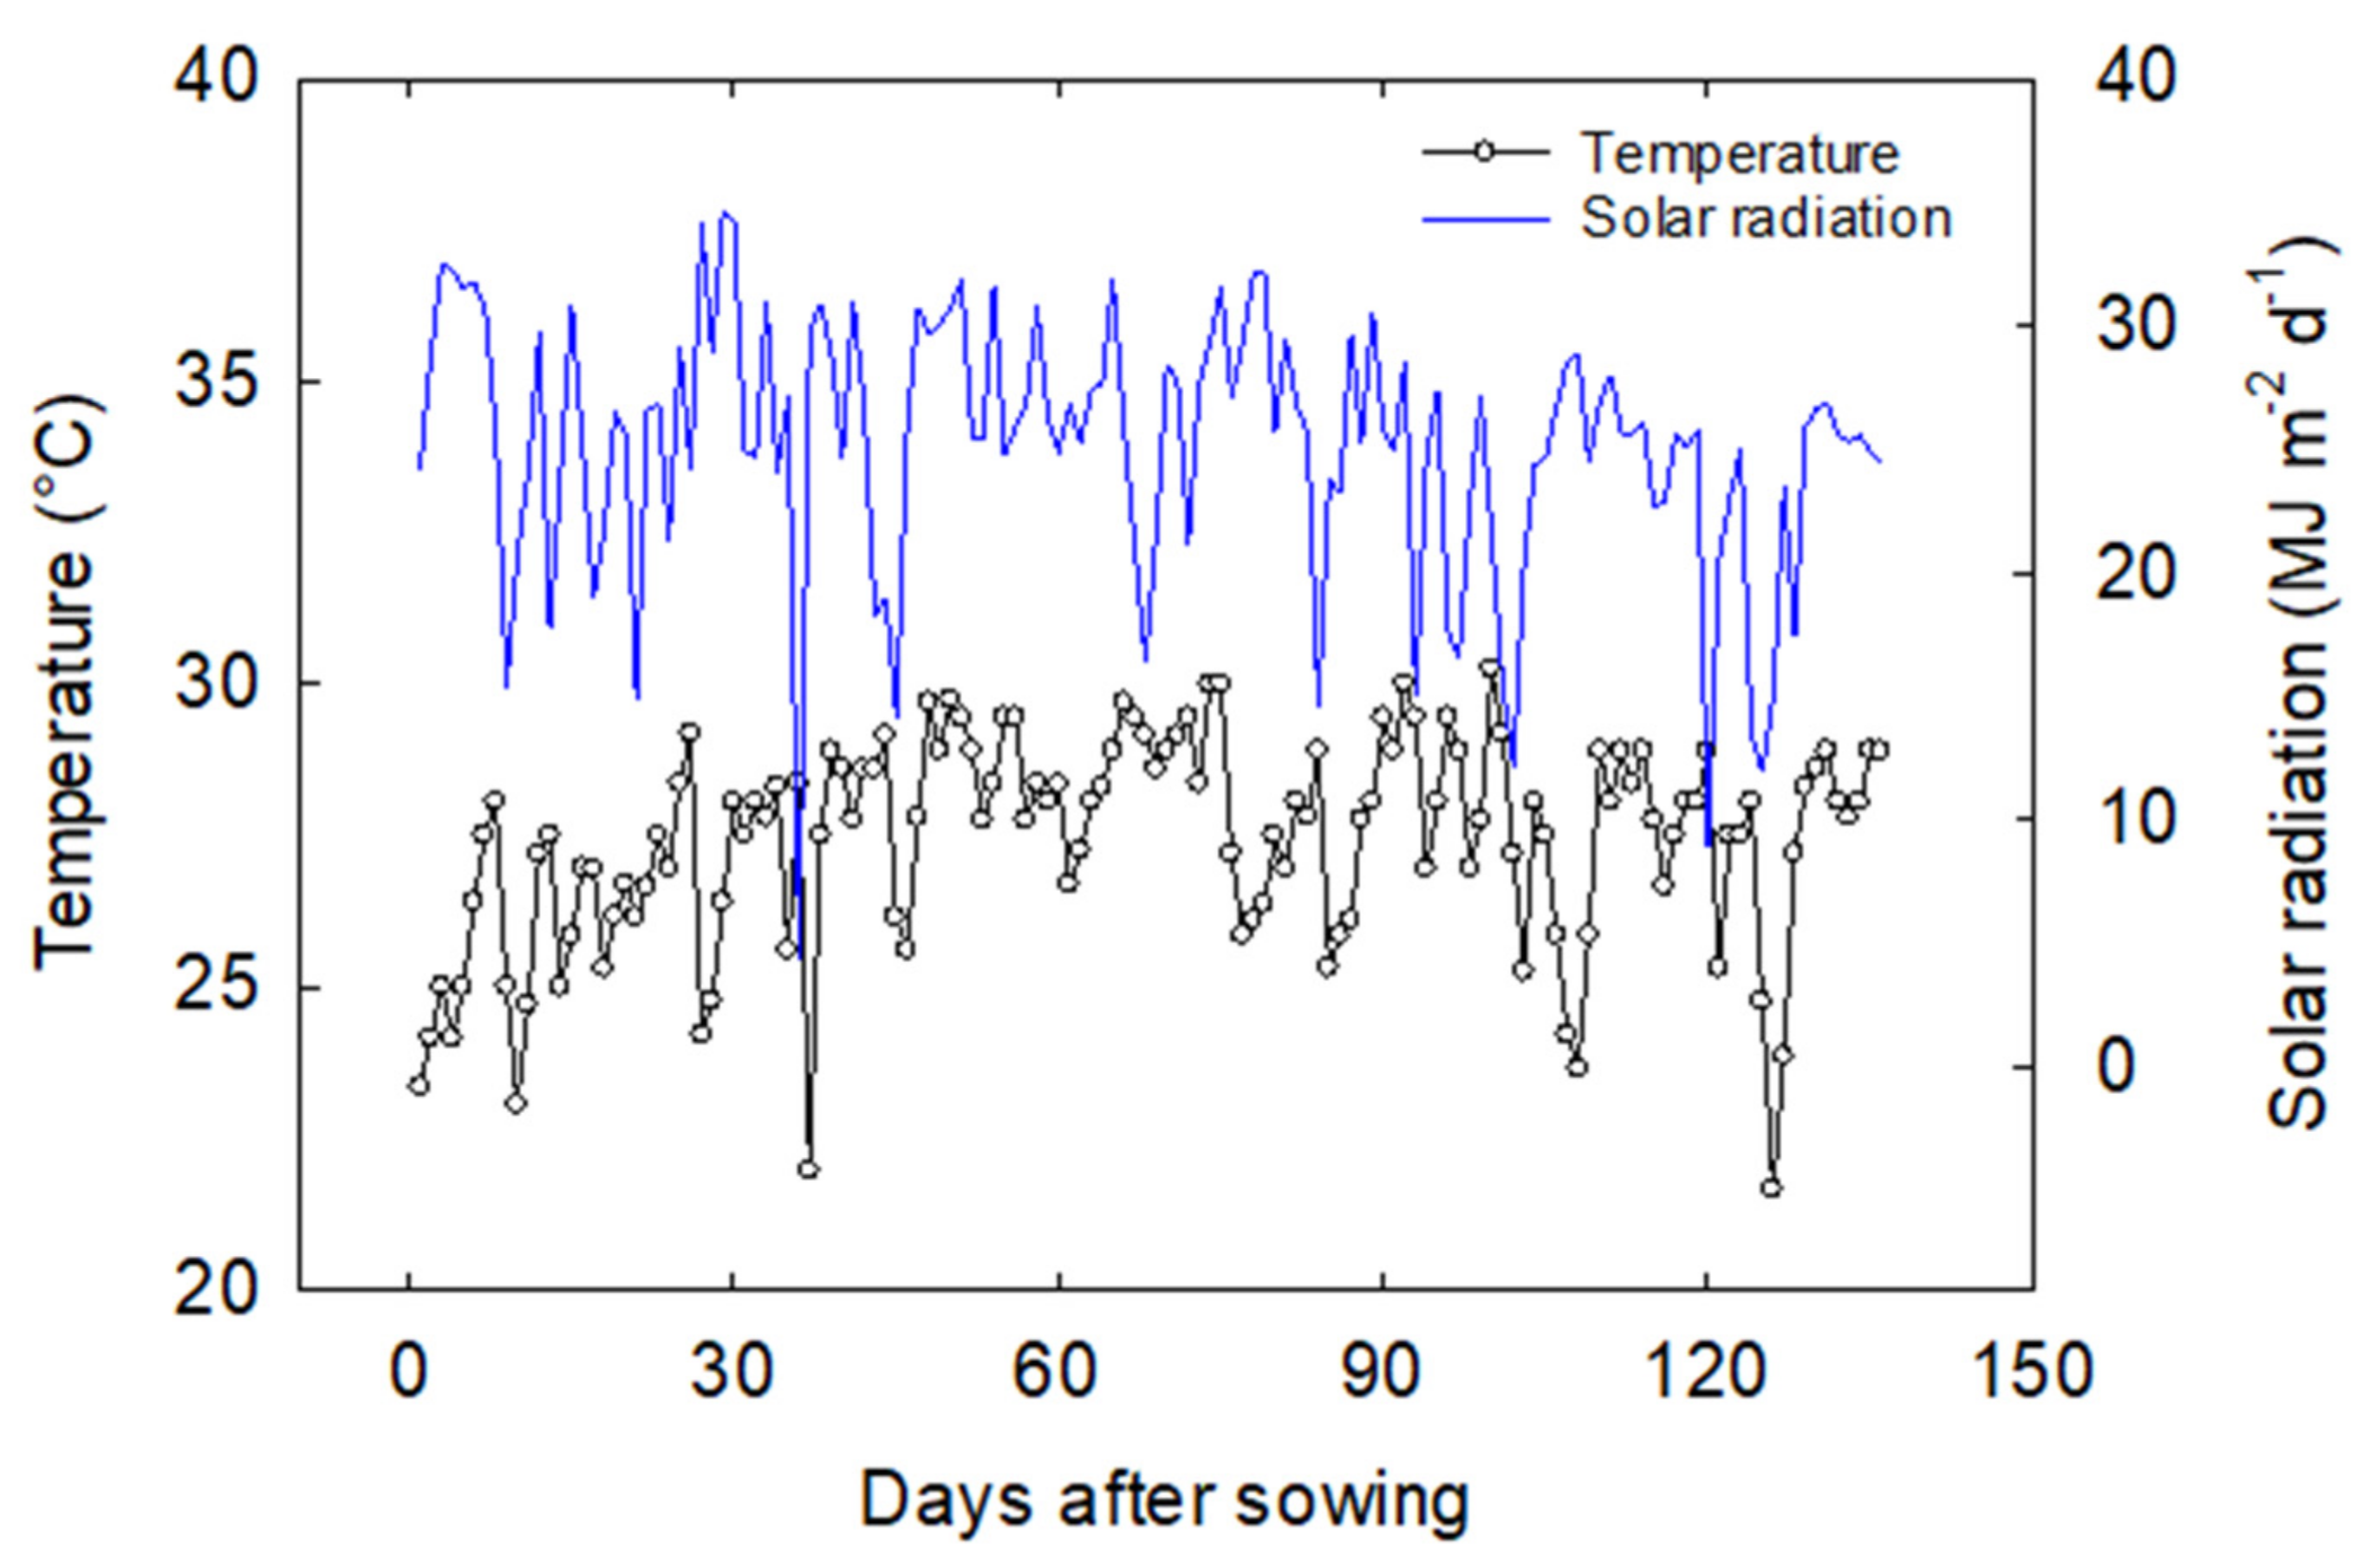
The study was conducted at the Environmental Plant Physiology Laboratory, Mississippi State University, Mississippi State (lat. 33° 28′ N, long. 88° 47′ W) in a randomized complete block design (RCBD) with five replications using the pot culture facility. Plant material comprising 18 soybean cultivars belonging to different maturity groups (MG III, IV, and V) were used in the study. A total of 90 PVC pots (15.24-cm in diameter and 61-cm in height) were filled with soil: sand as a growing medium. Four seeds per pot were initially sown for each cultivar and thinned to one seedling per pot 12 after days of sowing. A drip irrigation system was installed to irrigate the experiment with freshwater until seedlings emergence; once seedlings emerged, they were supplied with Hoagland nutrition solution three times daily (8:00 a.m., 12:00 p.m. 5:00 p.m.) to maintain optimal irrigation and nutrient conditions. The average temperature was 27.41 (SD ± 1.75), relative humidity was 85.9% (SD ± 3.4), and solar radiation was 25.12 MJ m−2 d−1 (SD ± 5.3 MJ m−2 d−1) during the cropping season (Figure 1).
2.2. Flowering and Yield Components
Days to 50% flowering was visually noted for all the cultivars by observing every plant. The experiment was terminated at physiological maturity (R8 stage). The pods from each plant were collected and threshed manually to obtain seed weight per plant. The 100-seed count was obtained using a seed counter (NP5056-Model 850–2, LI-COR, Lincoln, NE, USA), and the 100-seed weight was determined.
2.3. Seed Quality Using NIR Scanning
Soybean seed quality traits (protein, oil, and others) were measured using a Perten DA7250 spectrometer (Perten Instruments, IL, USA). For phenotyping soybean cultivars for quality parameters, the calibrations developed by the DA 7250 manufacturer were used with the default setting proposed by the developer. The calibrations used in this study were developed and updated by the manufacturer for soybean seed samples, having a determination coefficient of 0.97 for protein, 0.92 for oil, 0.85 for oleic acid, 0.84 for linoleic acid, 0.92 for linolenic acid, 0.88 for palmitic acid, and 0.76 for stearic acid (source: manufacturer calibration manual for oilseeds). However, recent studies have reported that the DA 7250 instrument has limitations in precisely predicting the sugars [13], but the detection level between the scans or replications remains unbiased [14]. The plastic cup was filled with seeds, that could hold about 500–600 seeds and excess samples were removed using the striker following company instructions. Each sample was scanned five times by repacking in reflectance mode using a rotating plastic cup. These observations were averaged per replication, and then the percentage values were converted into grams per kilogram.
2.4. Statistical Analysis
ANOVA was performed to estimate the significance of genetic variability among the 18 soybean cultivars for all measured traits- using the library (“agricolae”) in RStudio 3.6.1 (https://www.R-project.org/; accessed on 15 November 2021). Means of maturity groups or cultivars were separated using LSD at p < 0.05. The individual cultivar performance index was determined as the ratio between the value of each soybean cultivar (Cx) and the cultivar with maximum value (Cm) for all cultivars, following the approach described by [15]. A bubble plot was generated using the library (“ggpubr”) to display the overall performance of the cultivars. Furthermore, the standardized Z-distribution scores [16] for each cultivar were estimated for total seed weight, seed protein, and oil to identify promising high-yield soybeans with better seed quality. The computed values were used to categorize cultivars recording high yield and protein or oil. The Z scores for individual cultivars were estimated using the formula given below:
The computed Z scores were used to group soybean cultivars into highly desirable ones (high yield with high protein or oil) and undesirable ones (low yield with low protein or oil). Graphs were generated using Sigma Plot 14.5 (Systat Software, San Jose, CA, USA).
3. Results and Discussion
Phenology, seed weight, and seed quality compositions of soybean are highly influenced by the G, E, and M practices and their interactions [10]. Among these factors, E can significantly cause up to 80% changes in yield and quality, depending on the duration and intensity of stress [10]. In this study, all the cultivars were grown in the common environment and managed with optimum irrigation and fertilizers throughout the growing season. The observed average temperature during the experiment was around the optimum temperature (27.4 °C) required for soybean growth and development [12,17] (Figure 1). Therefore, the observed difference in yield and quality traits could only be caused by the genetic variation (G), or genetic potential of cultivars used in the study, with no confounding effect or influence of E and M. This signifies the potential for selecting soybean cultivars with a combination of traits under optimum water and nutrient conditions.
3.1. Variations in Flowering, Total Seed Weight, and 100-Seed Weight
Evaluation of soybean cultivars for days to 50% flowering showed significant variability (p ≤ 0.001) among all cultivars under optimum water and nutrient conditions (Table 1). Under non-stress conditions, the average days to 50% flowering varied from 30 (GT-477CR2) to 53 days (MS 5607 RXT) among the 18 cultivars (Table 1, Figure 2A), indicating the sensitivity of cultivars to the photoperiod and temperature. Soybean is a short-day plant and highly sensitive to photoperiod and temperature. Thus, these environmental factors influence the phenology by regulating the transition timing from the vegetative to the reproductive phase [12,18]. The soybean cultivars belonging to MG 000 are earlier maturing, and MG X comprises the late-maturing cultivars with a difference of 10–15 days of growth duration [19]. MG III and IV soybean cultivars reached 50% flowering earlier than MG V (Figure 2A). The late-maturing cultivars spent more days in the vegetative phase due to their photoperiod sensitivity, which delayed flowering and maturity. Furthermore, in late-maturing cultivars, approximately 70% of vegetative growth occurs after the opening of flowers, delaying pod set and pod development and resulting in lower seed yield and quality [20]. Early flowering or maturing cultivars were found to have a minimum risk of drought and high-temperature stress during the late flowering and early seed filling compared to late-maturing cultivars [18]. Early flowering cultivars complete their life cycle or mature earlier and help growers achieve the harvesting before the beginning of winter weather in the southern United States. An early flowering trait has recently gained attention in ‘climate smart’ crop breeding programs and assists in developing short-duration cultivars [8].
Statistical analysis showed a significant difference among the cultivar and the maturity groups for seed weight and 100-seed weight under well-watered and fertilized conditions (Table 1). About 50% of the soybean cultivars had seed weight above the grand mean of 18 cultivars (Figure 2B). The soybeans’ total seed weight ranged from 59.5 to 165.6 g plant−1, with the mean seed weight being 103 g plant−1 (Table 1, Figure 2B). Cultivars 539-T3 and MS 4616 RXT recorded the highest seed yield among all soybean cultivars (Figure 2B). The 100-seed weight is one of the key quality components of soybean and is positively related to yield [21]. Seed size is reported to have a positive association with next-generation seed germination and vigor depending on the growing conditions [10]. Large-sized seeds are preferred for vegetables and tofu in the food industry, whereas small seeds are used for soy sprouts and natto. The ANOVA showed a significant variation among maturity groups and cultivars for the 100-seed weight (Table 1). There was a considerable variation in 100-seed weight among 18 soybean cultivars, ranging from 7 g to 11.5 g based on the 13% adjusted moisture content (Table 1).
The maturity group showed a negative relationship between total seed weight and 100-seed weight, suggesting opportunities to select high-yielding short-duration soybean cultivars (Figure 2A–C). These observations support the hypothesis that the early-maturing (MG III and IV) cultivars will have yield advantages over late-maturing varieties under non-stress and stressful environments [22]. The selection of early-maturing cultivars over late-maturing cultivars in the US Midwest resulted in an average increase in yield by 29 kg ha−1 per year [23]. At the same time, the average yield increase for MG V was 13.7 kg ha−1 per year [24]. Interestingly, long-duration cultivars (MG V) showed 16% and 12% lower seed weight (Figure 2B) and 100-seed weight than MG IV (Figure 2C). Observed genetic variation in yield and 100-seed weight among cultivars suggested that Mid-South soybean growers have an option to choose cultivars depending on growing environments and end-user preferences to enhance revenue. Breeders are not always interested in increasing seed size but require optimized yield and quality for better returns. The current study also explored variation in seed quality to help choose high-yielding soybeans cultivars with better quality.
3.2. Phenotypic Variations of Soybean Seed Quality Compositions
3.2.1. Soybean Seed Protein and Oil
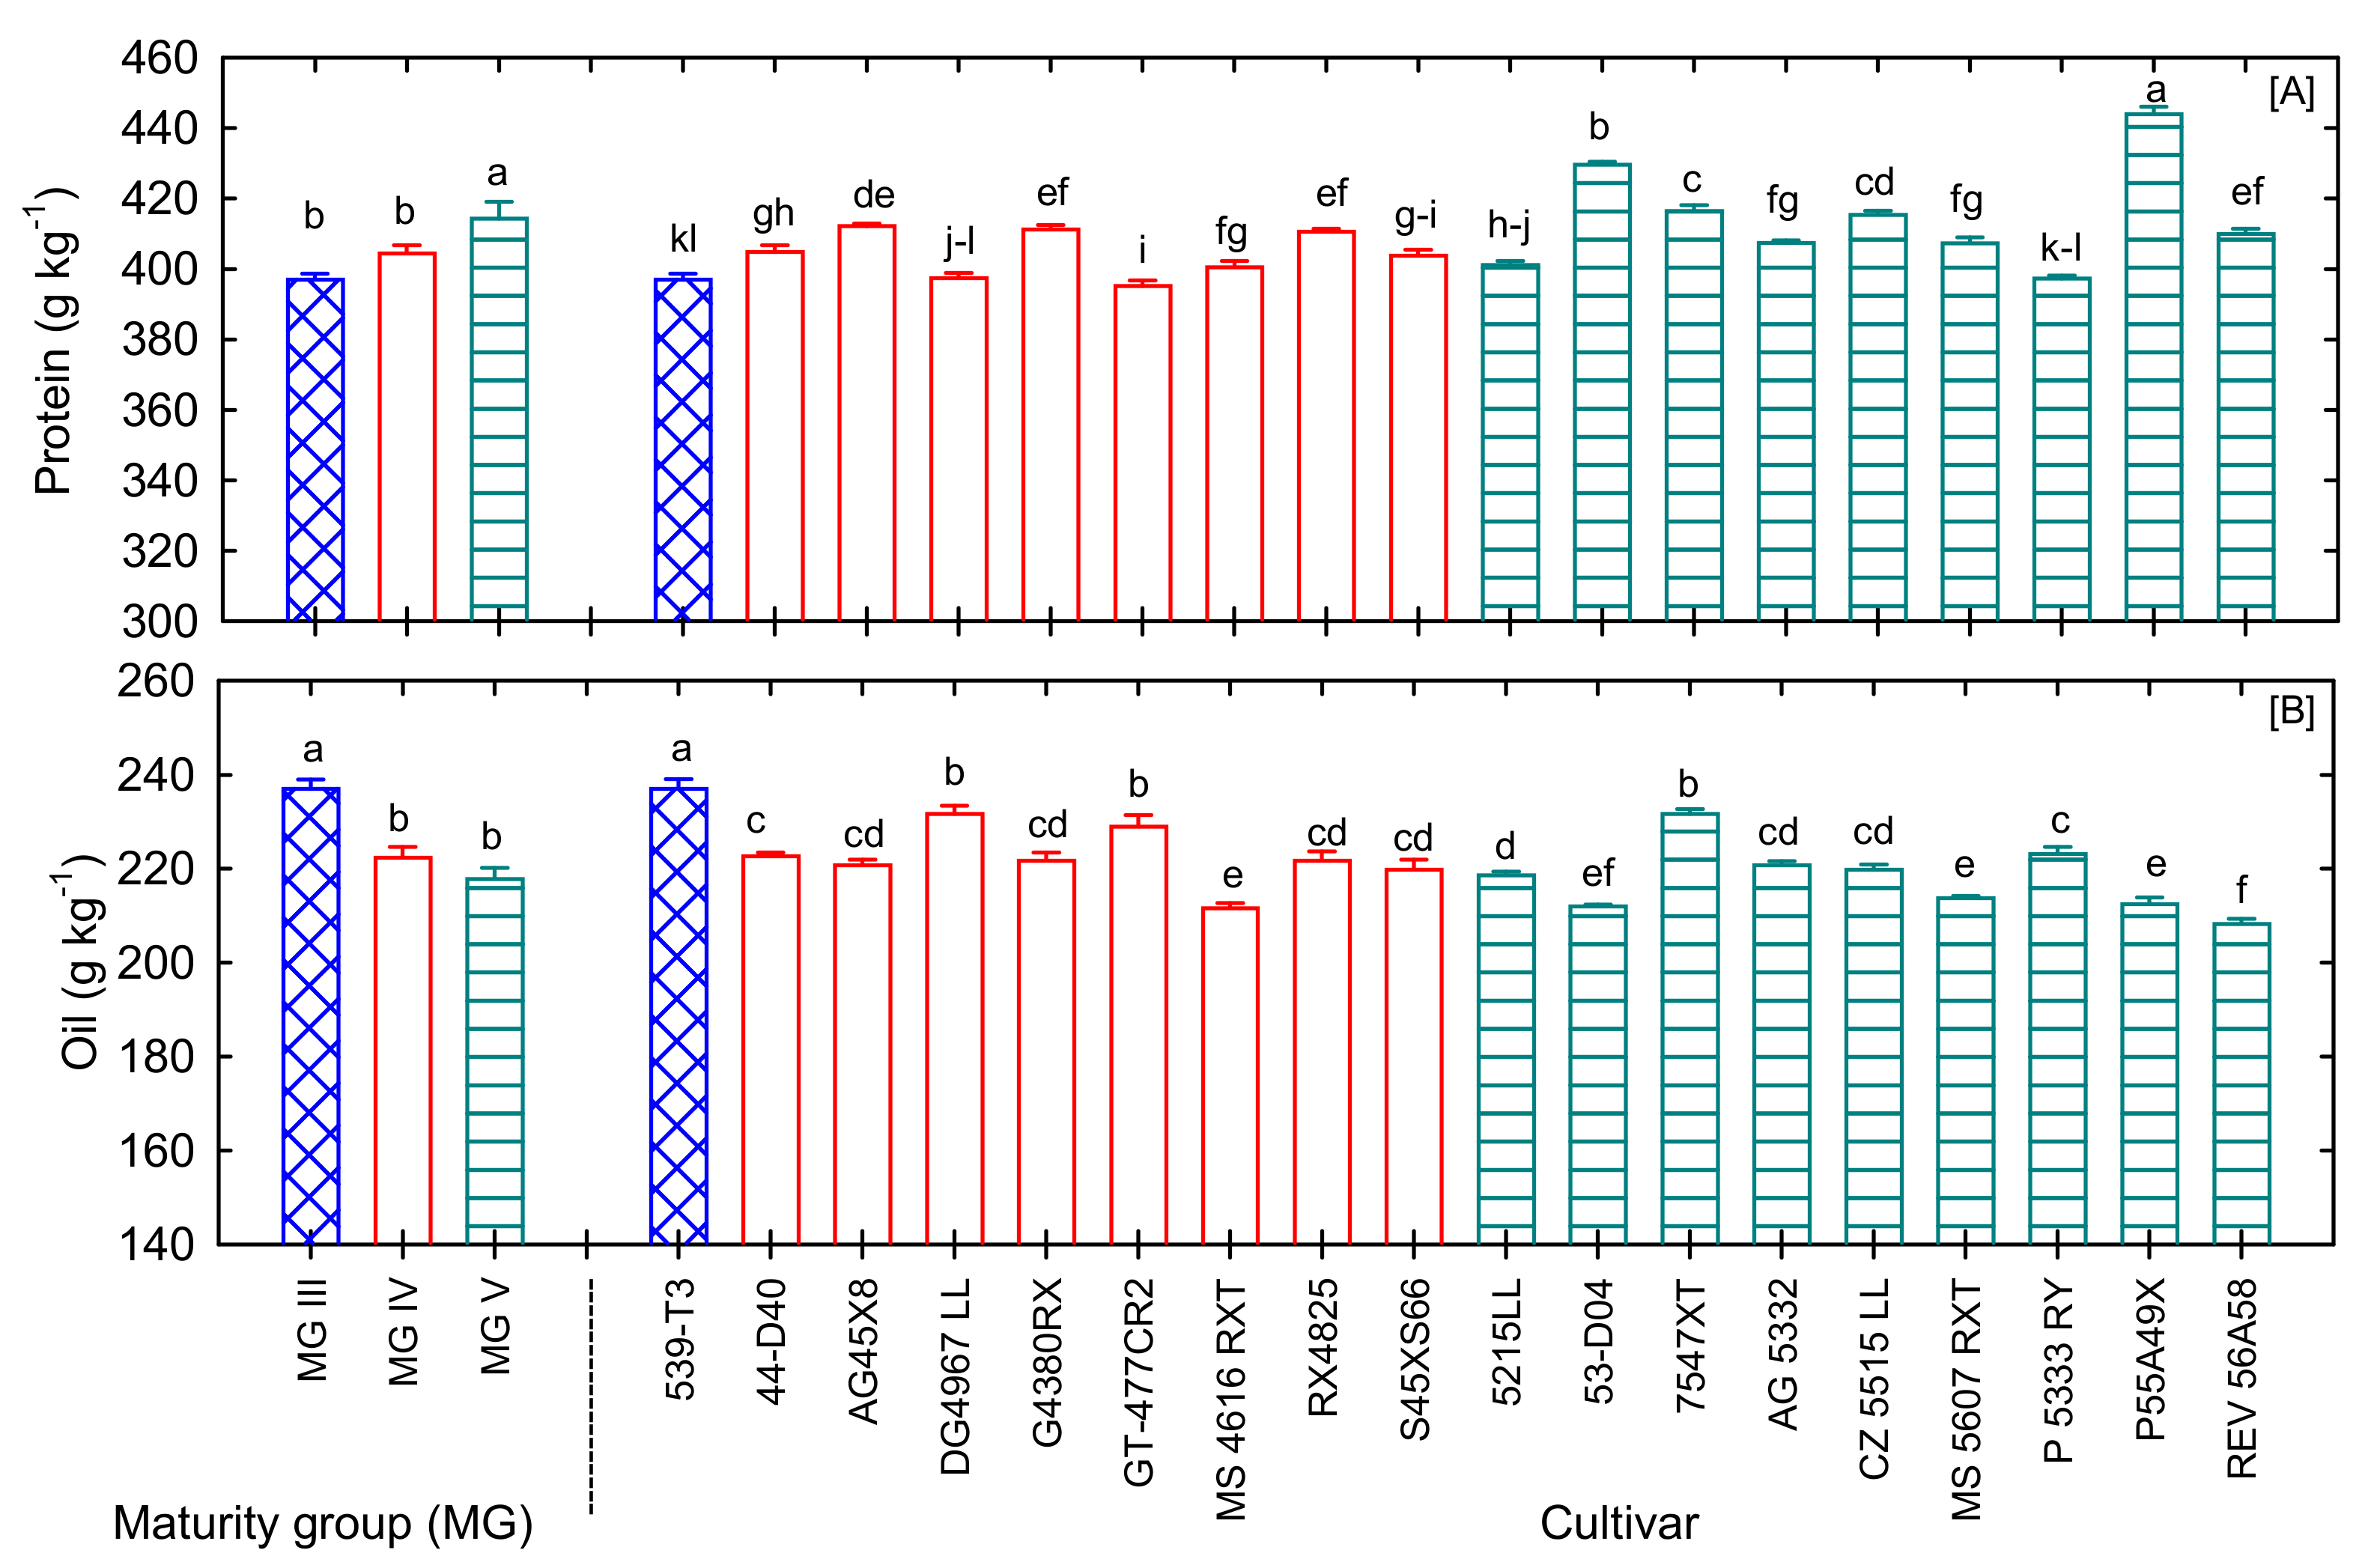
Most seed quality compositions showed a significant difference in maturity, except for a few unsaturated fatty acids (Table 1). Among all the plant-based protein sources, protein from soybean is considered to have a higher biological value. Soybean is a substantial driver of soymilk output and soymilk solid content [25]. In addition, soy products, mostly soymilk, and tofu, serve as essential protein sources for a vegetarian diet. Soybean meal is a typical feedstuff for non-ruminants, ruminants, and catfish farming, as it is rich in protein and highly palatable [26]. In the USA, 20.2 million metric tons of soybean are used for poultry feed and 6.3 million metric tons for swine feed [3]. The seed protein content varied significantly among cultivars and maturity groups (Table 1). Seed protein varied from 395.2 g kg−1 to 444.0 g kg−1 with a mean of 409 g kg−1 (Table 1, Figure 3A). Compared to our study, the seed protein content of soybean grown under field conditions was found to be lower (330–390 g kg−1) [10], which could be due to changes in management practices and irrigation. Significantly higher protein content was recorded in MG V (P55A49X), whereas the lowest protein content was observed in MG IV (GT-477CR2), Figure 3A. Previous studies showed a decline in protein content for the early MG (II–V) as planting was delayed, but it remained similar for the late MG (VI-VII) with different planting dates [27].
Soybean oil is used as a feedstock for biodiesel manufacturing, making it a renewable alternative to petroleum diesel. Soybean oil is the primary feedstock for biofuel production; approximately one bushel of soybeans can yield up to 1.5 gallons of biodiesel. Furthermore, soybeans are the necessary raw material for vegetable oil production, accounting for 57.2 million metric tons globally and 55 % (10.1 million metric tons) of soybean output in the US [28]. In the present study, seed oil content varied from 208 g kg−1 to 237 g kg−1 with a mean of 221 g kg−1 (Figure 3B). Observed oil content values in the current study were on par with previous soybean reports [29]. In our study, early flowering cultivars had higher oil content than other flowering groups (Figure 3B), with cultivar 539-T3 recording ~30 g kg−1 higher oil content than minimum REV56A58 (208 g kg−1) (Figure 3B). In general, soybean oil content increases when grown or exposed to hotter and drier or low rainfall environments. A long-term study showed lower oil concentrations of soybean in the northern region compared to the southern areas of the United States [30], which could be due to a relatively hotter climate in the US Mid-South during the pod-filling stage. The selection of high-yielding cultivars with higher oil content would increase per unit land area’s oil and biofuel yield.
3.2.2. Soybean Seed Fatty Acids
Soybean oil contains saturated (palmitic acid and stearic acid) and unsaturated (oleic acid, linoleic acid, linolenic acid) fatty acids. Soybean contains a low amount of saturated fatty acids (palmitic acid (11%), and stearic acid (4%)) compared to unsaturated fatty acids (oleic acid (25%), linoleic acid (52%), linolenic acid (8%)) in seeds [31]. It has been reported that diets rich in unsaturated fatty acids are beneficial to human health. Despite the benefits and risks of fatty acids, little is known about the variation in Mid-South soybean fatty acid composition under non-stress conditions. Our study explored seed-saturated and unsaturated fatty acid composition using soybean cultivars adapted to the southern climate. Soybean unsaturated fatty acids (oleic acid, linoleic acid, and linolenic acid) showed no significant difference among the maturity groups (Table 1). However, cultivars differed significantly for these fatty acid contents (Table 1). The oleic acid ranged from 183.2 g kg−1 to 256.7 g kg−1. High oleic acid was observed in MG V (5215LL) (Table 1 and Table 2). Schnebly and Fehr [29] reported a slightly higher oleic acid under field conditions with an average of 240 g kg−1. Oleic acid has been reported to increase under higher temperatures and soil moisture content, resulting in slightly different oleic acid ranges for soybean grown under other environmental conditions [12,29]. Linoleic acid ranged from 501.7 to 557.7 g kg−1 with a mean of 532.5 g kg−1. Linolenic acid ranged from 64.7 g kg−1 to 91.7 g kg−1. High linoleic and linolenic acid were observed in MG V (53-D04 and MS 5607 RXT, respectively), with 30 to 40 g kg−1 oleic acid, 480 to 580 g kg−1 linoleic acid, and 50 to 80 g kg−1 linolenic acid (Table 1 and Table 2). Oleic acid is a monosaturated fatty acid popular among consumers due to its cardiovascular health benefits; it increases the shelf life of oil and improves the functional and nutritional characteristics of both oil and protein [31]. Cultivars with high oleic acid had greater oil and protein contents than normal, with such a combination known to enhance soybean’s market value [32].
A higher amount of saturated fatty acids in human diets elevates the risk of blood serum cholesterol [33]. On the other hand, a high level of saturated fatty acid is found to be suitable for various cooking applications, as it increases the oxidation stability of the oil [31]. The chemical hydrogenation of soybean oil to increase its shelf life and stability produces trans fatty acid, which is not beneficial for human health. Increasing oleic acid and reducing linoleic and linolenic acid eliminates the need for chemical hydrogenation, increases the shelf-life, oxidative stability, reduces rancidity, and is desirable for human health [31]. Palmitic acid and stearic acid showed significant differences among all three maturity groups and cultivars. Palmitic acid ranged from 119.1 g kg−1 to 131.9 g kg−1 with a mean of 127.0 g kg−1, consistent with the range (120–130 g kg−1) [34]. Steric acid ranged from 38.1 g kg−1 to 47.7 g kg−1 (Table 1 and Table 2). In a previous study performed under field conditions by [35], stearic acid ranged from 22 g kg−1 to 72 g kg−1. Palmitic acid increases low-density lipoprotein cholesterol resulting in cardiovascular complications in humans [36]. Reduced palmitic acid and stearic acid are preferred in soybean oil as they lower saturated fatty acids, improving cardiovascular function in humans.
3.2.3. Soybean Seed Sugars
Soybean seed contains up to 17% of soluble sugars [37]. Among routinely used soluble sugars (glucose, fructose, raffinose, stachyose, and sucrose), sucrose affects soy food’s flavor, digestibility, nutritional quality, and feed [34]. It is the primary energy source for fermentation and contributes to the sweetness of soymilk and tofu. Sugars such as starch, raffinose, stachyose, and sucrose exhibited significant (p < 0.001) variation among cultivars and maturity groups (p < 0.05 to p < 0.01) (Table 1). Starch ranged from a minimum of 26.5 to a maximum of 42.3 g kg−1, and sucrose concentration in soybean varied between flowering groups (p < 0.05) and cultivars (p < 0.001), ranging from 38.9 g kg−1 (P55A49X) to 57.9 g kg−1 (MS 4616 RXT) (Table 2).
Ten out of 18 cultivars had sucrose content above 52.5 g kg−1 (Table 2). Soybean grown under low temperature is reported to have a higher sucrose content, up to 59 g kg−1, whereas it is reduced under drought conditions [12,29]. On average, soybean cultivars from MG IV had a 5% higher sucrose content than MG V (Table 2); similar findings were reported in randomly selected soybeans from MGs III to V [37]. Other oligosaccharides, including raffinose and stachyose, showed significant variability among cultivars (Table 2). A minor sugar, raffinose content ranged from 8.7 to 10.7 g kg−1, with a mean of 9.9 g kg−1. The second major sugar after sucrose, stachyose, ranged from 32.9 g kg−1 to 43.9 g kg−1, with a mean of 39 g kg−1 (Table 2). High sucrose with low stachyose and raffinose in soybean seed is beneficial for human and animal consumption, contributing to enhanced taste and reducing flatulence and diarrhea in monogastric animals [38]. Based on the results, cultivars MS 4616 RXT and CZ 5515 LL could be used for future soybean breeding for manipulating soybean sugar compositions. Earlier reports showed a weaker correlation between predicted NIRS and the wet-chemistry values for sugars than protein or oil [13,14]. Nonetheless, we used the Perten Instruments’ calibrations and did not compare our predicted values with wet chemistry. Therefore, the development of accurate calibrations for sugars or validation using diverse germplasm lines would help quantify soybean sugar compositions precisely and reduce the time required for phenotyping.
3.3. Correlations between Yield and Quality Composition Traits
Days to 50% flowering was negatively correlated with seed weight (r = −0.57, p < 0.05) and 100-seed weight (r = −0.72, p < 0.001), which suggests that early flowering or maturing cultivars would yield better in the US Mid-South than the late-maturing cultivars. However, contrasting results were found in the other studies [5], where days to 50% flowering had a weak relationship (r = 0.18) with the number of seeds per plant. The vegetative or reproductive phases’ response to a given environment determines the fitness of cultivars. In the current study, cultivars that flowered a week early (MG III and IV) took advantage of growing conditions compared to late-flowering cultivars. However, the reasons for lower seed weight and 100-seed weight in MG V could be a valid question to investigate under different production settings and stress conditions.
Strong and positive correlations were observed between seed weight and 100-seed weight (r = 0.79, p < 0.001), 100-seed weight and stachyose (r = 0.43, p < 0.05), 100-seed weight and sucrose (r = 0.40, p < 0.05), linoleic acid and raffinose (r = 0.41, p < 0.05), linoleic acid and stachyose (r = 0.53, p < 0.05), linolenic acid and palmitic acid (r = 0.56, p < 0.01), raffinose and stachyose (r = 0.61, p < 0.01), palmitic acid and stearic acid (r = 0.65, p < 0.01) palmitic acid and starch (r = 0.43, p < 0.05), palmitic acid and sucrose (r = 0.47, p < 0.05), stearic acid and sucrose (r = 0.41, p < 0.05), and raffinose and stachyose (r = 0.61, p < 0.01), as shown in Figure 4. If two desirable features have a significant positive association, it helps both traits to improve simultaneously. Similar to other studies [10], the oil content was positively correlated with the seed weight (r = 0.44, p < 0.05) and 100-seed weight (0.36, p < 0.05). At the same time, negative correlations between two traits results in a tradeoff similar to yield and quality [5,12]. Under the optimum growing conditions, protein content was negatively correlated with seed weight (r = −0.47) and 100-seed weight (r = −0.36) [10]. On the other hand, a significant negative correlation was observed between protein and oil content (r = −0.47; p < 0.05). Numerous researchers have demonstrated that developing cultivars with higher oil and protein contents have been ineffective due to the complex molecular regulations between yield and quality traits [12,29,39].
Negative relationships were observed between seed weight and protein (r = −0.47, p < 0.05; Figure 4), 100-seed weight and protein (r = −0.36, p > 0.05), oil and palmitic acid (r = −0.62, p < 0.01), linoleic acid and oleic acid (r = −0.65, p < 0.01), and linolenic acid and stachyose (r = −0.48, p < 0.05), see Figure 4. Moreover, [31] reported a strong inverse relation between oleic acid and linoleic acid. Similarly, palmitic acid was reported to be negatively correlated with oil (r = −0.84), oleic acid (r = −0.94), and linoleic acid (r = −0.96). The study suggested that breeding for increased oleic acid is the same as breeding for reduced linoleic and palmitic acid, which is desirable for increasing soybean oil stability and shelf life. The total sugar content of soybean was shown to have a significant positive relationship (r = 0.81) with the protein and oil [40]. According to [41], total sugar and oil content in soybean seeds were positively correlated (r = 0.26), although both were inversely associated with protein (r = 0.19 and r = 0.63, respectively). Soybean breeders could take advantage of these relationships to manipulate quality traits while improving yield.
3.4. Variability Assessment and Selection of Promising High Yielding Soybean Cultivars with High Protein and Oil
A comprehensive understanding of growing environmental factors and the end-use preference are the main driving factors for selecting soybean cultivars. The individual cultivar performance index was calculated as the ratio between the value of cultivar (Cx) and the cultivar with maximum value (Cm) for a given parameter under non-stressed conditions (Figure 5). Our findings revealed the strong and negative relationships between high protein and yields (Figure 4), even under non-stress conditions. Cultivar 539T3 had a higher yield and oil content. Cultivar P55A49X reported poor yield components and quality parameters but had maximum protein content (Figure 5).
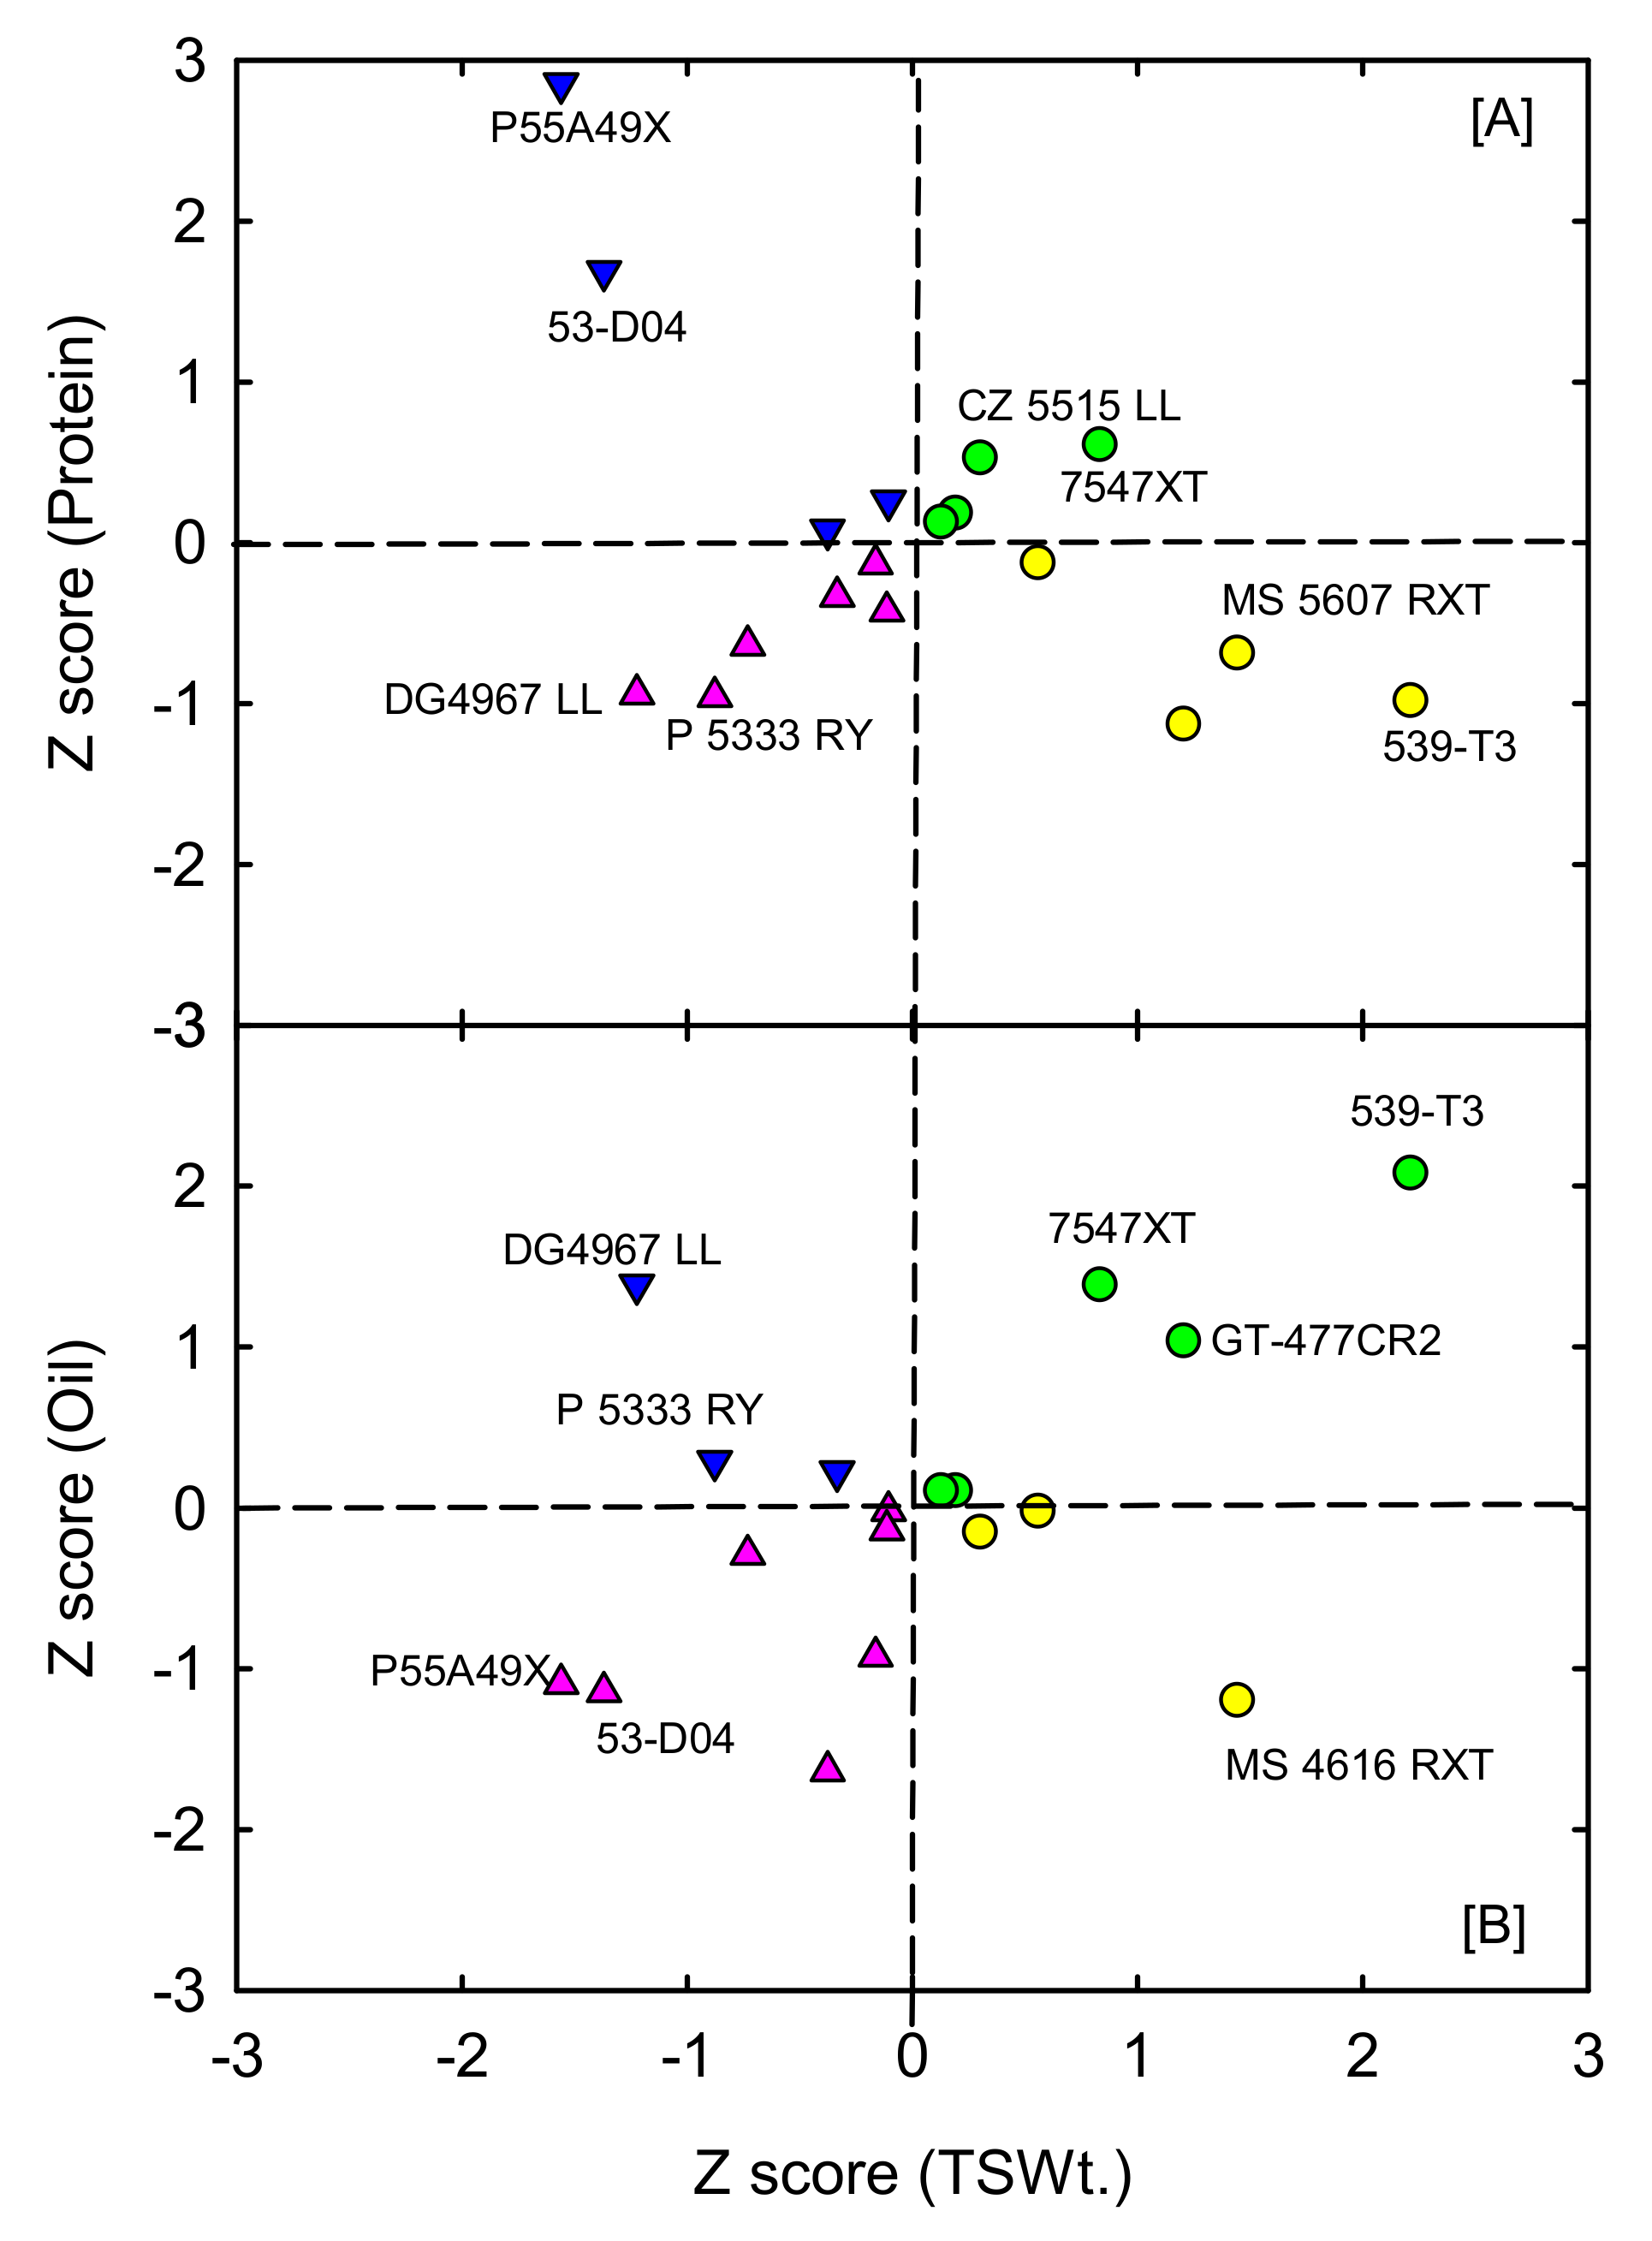
A short-duration soybean cultivar may have the potential to overcome adverse growing season variabilities by utilizing resources under favorable conditions. Thus, soybean cultivars with a shorter crop duration linked with high yield and quality (for example, high protein) might help produce high-quality beans. Under a favorable environment, 539-T3 (MG III) and MS 4616 RXT (MG IV) had the highest total seed weight in a shorter duration to flowering (Figure 5). Selected cultivars, GT-477CR2, MS 4616 RXT, and 539-T3, characterized a short growing cycle with a higher 100-seed weight. Cultivars, P55A49X and 53-D04, which took longer to reach 50% flowering, also had high seed protein (Figure 5). These results indicated that selection for higher protein cannot always increase grain yield; this could be due to the tight and negative genetic linkage between yield and protein, controlled by a complex genetic network [42]. Furthermore, the Z score method was adopted to select promising high-yielding soybean cultivars with high protein or oil (Figure 6). The average seed weight, protein content, and oil content of all 18 cultivars were standardized using the normalized Z-distribution procedure [16]. The Z score of total seed weight was plotted against the Z-score of protein (Figure 6A) and oil content (Figure 6B). Regardless of maturity groups, cultivars 7547XT and CZ 5515 LL had high seed weight and protein content (Figure 6A). Cultivars 539-T3, 7547XT, and GT-477CR2 showed high seed weight and oil content (Figure 6B). Moreover, 7547XT recorded reasonably high yield, protein, and oil content among all cultivars. We identified cultivars (539-T3 and GT-477CR2) with higher seed yield and oil content with a short duration to flowering, which provides the possibility of improving yield and quality traits under non-stress conditions.
4. Conclusions
Our study showed considerable genetic variability among 18 soybean cultivars for yield and quality traits under optimum water and nutrient conditions and diurnally and temporally varying temperature and radiation environments in Mississippi. In addition, this is the first study to report the potential benchmark seed weight and quality parameters for many soybean cultivars grown in the US Mid-South under sunlit and temperature conditions with optimum water and nutrient conditions. The long-duration cultivars (MG V) showed 14% lower seed weight than early flowering cultivars (MG IV), due to poor source-to-sink ratio later in the growing season. The late flowering cultivars had lower oil content and higher protein content. In addition, cultivars with high seed weight recorded poor seed quality (protein). We hypothesized that short-duration cultivars with high photosynthetic capacities and translocation efficiency during the pod-filling stage could provide ways to address the complex interaction between yield and quality in soybean and other legumes. 539-T3 and GT-477CR2 were identified as high-yielding short-duration soybean cultivars. Regardless of the maturity group, 7547XT recorded desirable industry traits such as high protein and high oil content. A strong negative correlation of protein with yield, oil, and sucrose could affect the breeding efforts towards developing soybean with higher yield and quality parameters. Further breeding programs are necessary for breaking the complex tradeoff between yield and quality to increase revenue for growers. Nonetheless, earlier reports suggest that the NIRS predicted values and the wet-chemistry values for protein and oil were found to have a high correlation; however, further development of the accurate calibration for sugars using diverse germplasm is required for the precise quantification of soybean sugar compositions. Our results can help growers and breeders to select the soybean cultivars with high yield and quality content under natural growing conditions of the US Mid-South.
Author Contributions
R.B. and K.R.R. conceptualization, project administration, methodology, supervision, funding acquisition, review, co-writing original draft, editing and review, and data analysis; S.P. seed quality data collection and co-writing the initial draft; F.A.A. flowering and yield data collection. All authors have read and agreed to the published version of the manuscript.
Funding
This research was funded by the Mississippi Soybean Promotion Board, USDA Agricultural Research Service, Grant/Award Number: 58-6064-9-007 and MIS 043050.
Institutional Review Board Statement
Not applicable.
Informed Consent Statement
Not applicable.
Data Availability Statement
Not applicable.
Acknowledgments
We thank David Brand for technical assistance and graduate students at the Environmental Plant Physiology Laboratory for help during data collection. Mention of trade names or commercial products in this publication solely provides specific information and does not imply recommendation or endorsement.
Conflicts of Interest
The authors declare no conflict of interest.
References
- FAOSTAT. Available online: https://www.fao.org/faostat/en/#data/QCL (accessed on 1 March 2022).
- Voora, V.; Larrea, C.; Bermúdez, S. Global Market Report: Soybeans Sustainable Commodities Marketplace Series 2019. Available online: https://www.iisd.org/system/files/2020-10/ssi-global-market-report-soybean.pdf (accessed on 29 November 2021).
- Annual Soy Stats Results. Available online: https://soygrowers.com/education-resources/publications/soy-stats/ (accessed on 29 November 2021).
- Robert, J.W. The Soybean Solution: Meeting World Food Needs; NIT-College of Agriculture, University of Illinois at Urbana: Champaign, IL, USA, 1986; pp. 4–27. [Google Scholar]
- Painkra, P.; Shrivatava, R.; Nag, S.K.; Kute, I. Correlation analysis for seed yield and its attributing traits in soybean (Glycine Max L. Merrill). Int. J. Curr. Microbiol. Appl. Sci. 2018, 7, 2034–2040. [Google Scholar] [CrossRef]
- Lee, T.; Tran, A.; Hansen, J.; Ash, M. Major Factors Affecting Global Soybean and Products Trade Projections. Available online: https://ageconsearch.umn.edu/record/244273?ln=en (accessed on 28 November 2021).
- Vogel, J.T.; Liu, W.; Olhoft, P.; Crafts-Brandner, S.J.; Pennycooke, J.C.; Christiansen, N. Soybean yield formation physiology—A foundation for precision breeding based improvement. Front. Plant Sci. 2021, 12, 719706. [Google Scholar] [CrossRef] [PubMed]
- Todeschini, M.H.; Milioli, A.S.; Rosa, A.C.; Dallacorte, L.V.; Panho, M.C.; Marchese, J.A.; Benin, G. Soybean genetic progress in South Brazil: Physiological, phenological and agronomic traits. Euphytica 2019, 215, 124. [Google Scholar] [CrossRef]
- Chiorato, A.F.; Carbonell, S.A.M.; Vencovsky, R.; Fonseca Júnior, N.D.S.; Pinheiro, J.B. Genetic gain in the breeding program of common beans at IAC from 1989 to 2007. Crop Breed. Appl. Biotechnol. 2010, 10, 329–336. [Google Scholar] [CrossRef] [Green Version]
- Assefa, Y.; Purcell, L.C.; Salmeron, M.; Naeve, S.; Casteel, S.N.; Kovács, P.; Archontoulis, S.; Licht, M.; Below, F.; Kandel, H.; et al. Assessing variation in us soybean seed composition (Protein and Oil). Front. Plant Sci. 2019, 10, 298. [Google Scholar] [CrossRef]
- Reddy, K.R.; Patro, H.; Lokhande, S.; Bellaloui, N.; Gao, W. Ultraviolet-B radiation alters soybean growth and seed quality. Food Nutr. Sci. 2016, 7, 55–66. [Google Scholar] [CrossRef] [Green Version]
- Alsajri, F.A.; Wijewardana, C.; Irby, J.T.; Bellaloui, N.; Krutz, L.J.; Golden, B.; Gao, W.; Reddy, K.R. Developing functional relationships between temperature and soybean yield and seed quality. Agron. J. 2020, 112, 194–204. [Google Scholar] [CrossRef] [Green Version]
- Lord, N.; Shang, C.; Rosso, L.; Zhang, B. Development of near-infrared reflectance spectroscopy calibration for sugar content in ground soybean seed using Perten DA7250 analyzer. Crop Sci. 2021, 61, 966–975. [Google Scholar] [CrossRef]
- Ficht, A.; Bruce, R.; Torkamaneh, D.; Grainger, C.M.; Eskandari, M.; Rajcan, I. Genetic analysis of sucrose concentration in soybean seeds using a historical soybean genomic panel. Theor. Appl. Genet. 2022. [Google Scholar] [CrossRef]
- Kakar, N.; Bheemanahalli, R.; Jumaa, S.; Redoña, E.; Warburton, M.L.; Reddy, K.R. Assessment of agro-morphological, physiological and yield traits diversity among tropical rice. PeerJ 2021, 9, e11752. [Google Scholar] [CrossRef]
- Bheemanahalli, R.; Sunoj, V.S.J.; Saripalli, G.; Prasad, P.V.V.; Balyan, H.S.; Gupta, P.K.; Grant, N.; Gill, K.S.; Jagadish, S.V.K. Quantifying the impact of heat stress on pollen germination, seed set, and grain filling in spring wheat. Crop Sci. 2019, 59, 684–696. [Google Scholar] [CrossRef]
- Hatfield, J.L.; Boote, K.J.; Kimball, B.A.; Ziska, L.H.; Izaurralde, R.C.; Ort, D.; Thomson, A.M.; Wolfe, D. Climate impacts on agriculture: Implications for crop production. Agron. J. 2011, 103, 351–370. [Google Scholar] [CrossRef] [Green Version]
- Yang, W.; Wu, T.; Zhang, X.; Song, W.; Xu, C.; Sun, S.; Hou, W.; Jiang, B.; Han, T.; Wu, C. Critical photoperiod measurement of soybean genotypes in different maturity groups. Crop Sci. 2019, 59, 2055–2061. [Google Scholar] [CrossRef]
- Song, W.; Sun, S.; Ibrahim, S.E.; Xu, Z.; Wu, H.; Hu, X.; Jia, H.; Cheng, Y.; Yang, Z.; Jiang, S.; et al. Standard cultivar selection and digital quantification for precise classification of maturity groups in soybean. Crop Sci. 2019, 59, 1997–2006. [Google Scholar] [CrossRef] [Green Version]
- Zheng, S.H. Physiological and ecological characteristics of late maturing soybean [Glycine max] in northern Kyushu of Japan. Coast. Bioenviron. Saga Univ. Jpn. 2005, 4, 29–36. [Google Scholar]
- Zhang, Y.; He, J.; Wang, Y.; Xing, G.; Zhao, J.; Li, Y.; Yang, S.; Palmer, R.G.; Zhao, T.; Gai, J. Establishment of a 100-seed weight quantitative trait locus–allele matrix of the germplasm population for optimal recombination design in soybean breeding programmes. J. Exp. Bot. 2015, 66, 6311–6325. [Google Scholar] [CrossRef] [Green Version]
- Vann, R. North Carolina Soybean Yield Contest. Available online: https://soybeans.ces.ncsu.edu/north-carolina-soybean-contest/ (accessed on 1 March 2022).
- Rincker, K.; Nelson, R.; Specht, J.; Sleper, D.; Cary, T.; Cianzio, S.R.; Casteel, S.; Conley, S.; Chen, P.; Davis, V.; et al. Genetic improvement of U.S. soybean in maturity groups II, III, and IV. Crop Sci. 2014, 54, 1419–1432. [Google Scholar] [CrossRef]
- Boehm, J.D.; Abdel-Haleem, H.; Schapaugh, W.T.; Rainey, K.; Pantalone, V.R.; Shannon, G.; Klein, J.; Carter, T.E.; Cardinal, A.J.; Shipe, E.R.; et al. Genetic improvement of US soybean in maturity groups V, VI, and VII. Crop Sci. 2019, 59, 1838–1852. [Google Scholar] [CrossRef]
- Poysa, V.; Woodrow, L. Stability of soybean seed composition and its effect on soymilk and tofu yield and quality. Food Res. Int. 2002, 35, 337–345. [Google Scholar] [CrossRef]
- Robinson, E.H.; Li, M.H. Plant-based catfish feeds. Miss. Agric. For. Exp. Stn. Res. Rep. 2014, 24, 4. [Google Scholar]
- Morris, T.C. Optimizing Soybean Yield and Quality Through Planting Date and Maturity Group Selection in North Carolina; North Carolina State University: Raleigh, NC, USA, 2021. [Google Scholar]
- USDA/NASS 2021 State Agriculture Overview for Mississippi. Available online: https://www.nass.usda.gov/Quick_Stats/Ag_Overview/stateOverview.php?state=MISSISSIPPI (accessed on 1 March 2022).
- Wijewardana, C.; Reddy, K.R.; Bellaloui, N. Soybean seed physiology, quality, and chemical composition under soil moisture stress. Food Chem. 2019, 278, 92–100. [Google Scholar] [CrossRef] [PubMed]
- Yaklich, R.W.; Vinyard, B.; Camp, M.; Douglass, S. Analysis of seed protein and oil from soybean northern and southern region uniform tests. Crop Sci. 2002, 42, 1504–1515. [Google Scholar] [CrossRef]
- Fehr, W.R. Breeding for modified fatty acid composition in soybean. Crop Sci. 2007, 47, S-72–S-87. [Google Scholar] [CrossRef]
- La, T.C.; Pathan, S.M.; Vuong, T.; Lee, J.-D.; Scaboo, A.M.; Smith, J.R.; Gillen, A.M.; Gillman, J.; Ellersieck, M.R.; Nguyen, H.T.; et al. Effect of high-oleic acid soybean on seed oil, protein concentration, and yield. Crop Sci. 2014, 54, 2054–2062. [Google Scholar] [CrossRef]
- Siri-Tarino, P.W.; Sun, Q.; Hu, F.B.; Krauss, R.M. Saturated fatty acids and risk of coronary heart disease: Modulation by replacement nutrients. Curr. Atheroscler. Rep. 2010, 12, 384–390. [Google Scholar] [CrossRef] [Green Version]
- Bellaloui, N.; Bruns, H.A.; Abbas, H.K.; Mengistu, A.; Fisher, D.K.; Reddy, K.N. Agricultural practices altered soybean seed protein, oil, fatty acids, sugars, and minerals in the midsouth USA. Front. Plant Sci. 2015, 6, 31. [Google Scholar] [CrossRef]
- Cherry, J.H.; Bishop, L.; Hasegawa, P.M.; Lefflert, H.R. Differences in the fatty acid composition of soybean seed produced in northern and southern areas of the U.S.A. Phytochemistry 1985, 24, 237–241. [Google Scholar] [CrossRef]
- Hu, F.B.; Stampfer, M.J.; Manson, J.E.; Rimm, E.; Colditz, G.A.; Rosner, B.A.; Hennekens, C.H.; Willett, W.C. Dietary fat intake and the risk of coronary heart disease in women. N. Engl. J. Med. 1997, 337, 1491–1499. [Google Scholar] [CrossRef]
- Hou, A.; Chen, P.; Shi, A.; Zhang, B.; Wang, Y.-J. Sugar variation in soybean seed assessed with a rapid extraction and quantification method. Int. J. Agron. 2009, 2009, 484571. [Google Scholar] [CrossRef] [Green Version]
- Liu, K. Chemistry and nutritional value of soybean components. In Soybeans: Chemistry, Technology, and Utilization; Liu, K., Ed.; Springer US: Boston, MA, USA, 1997; pp. 25–113. ISBN 978-1-4615-1763-4. [Google Scholar]
- Burton, J.W. Quantitative genetics: Results relevant to soybean breeding. Agron. USA 1987, 16, 211–247. [Google Scholar]
- Geater, C.W.; Fehr, W.R. Association of total sugar content with other seed traits of diverse soybean cultivars. Crop Sci. 2000, 40, 1552–1555. [Google Scholar] [CrossRef]
- Hymowitz, T.; Collins, F.I.; Panczner, J.; Walker, W.M. Relationship between the content of oil, protein, and sugar in soybean seed. Agron. J. 1972, 64, 613–616. [Google Scholar] [CrossRef]
- Halloran, G.M. Grain yield and protein relationships in a wheat cross. Crop Sci. 1981, 21, 699–701. [Google Scholar] [CrossRef]
Figure 1.
Temporal trends in average air temperature and daily solar radiation during the experimental period.
Figure 1.
Temporal trends in average air temperature and daily solar radiation during the experimental period.

Figure 2.
Variations in yield components of 18 soybean cultivars under well-watered and fertilized conditions: (A) days to 50% flowering (DTF), (B) total seed weight (TSWt., g plant−1), and (C) 100-seed weight (HWt., g). Bars denote mean ± SE (n = 5). Bars with the same letter(s) indicate no significant differences among maturity groups (MG) or cultivars at p < 0.05 LSD.
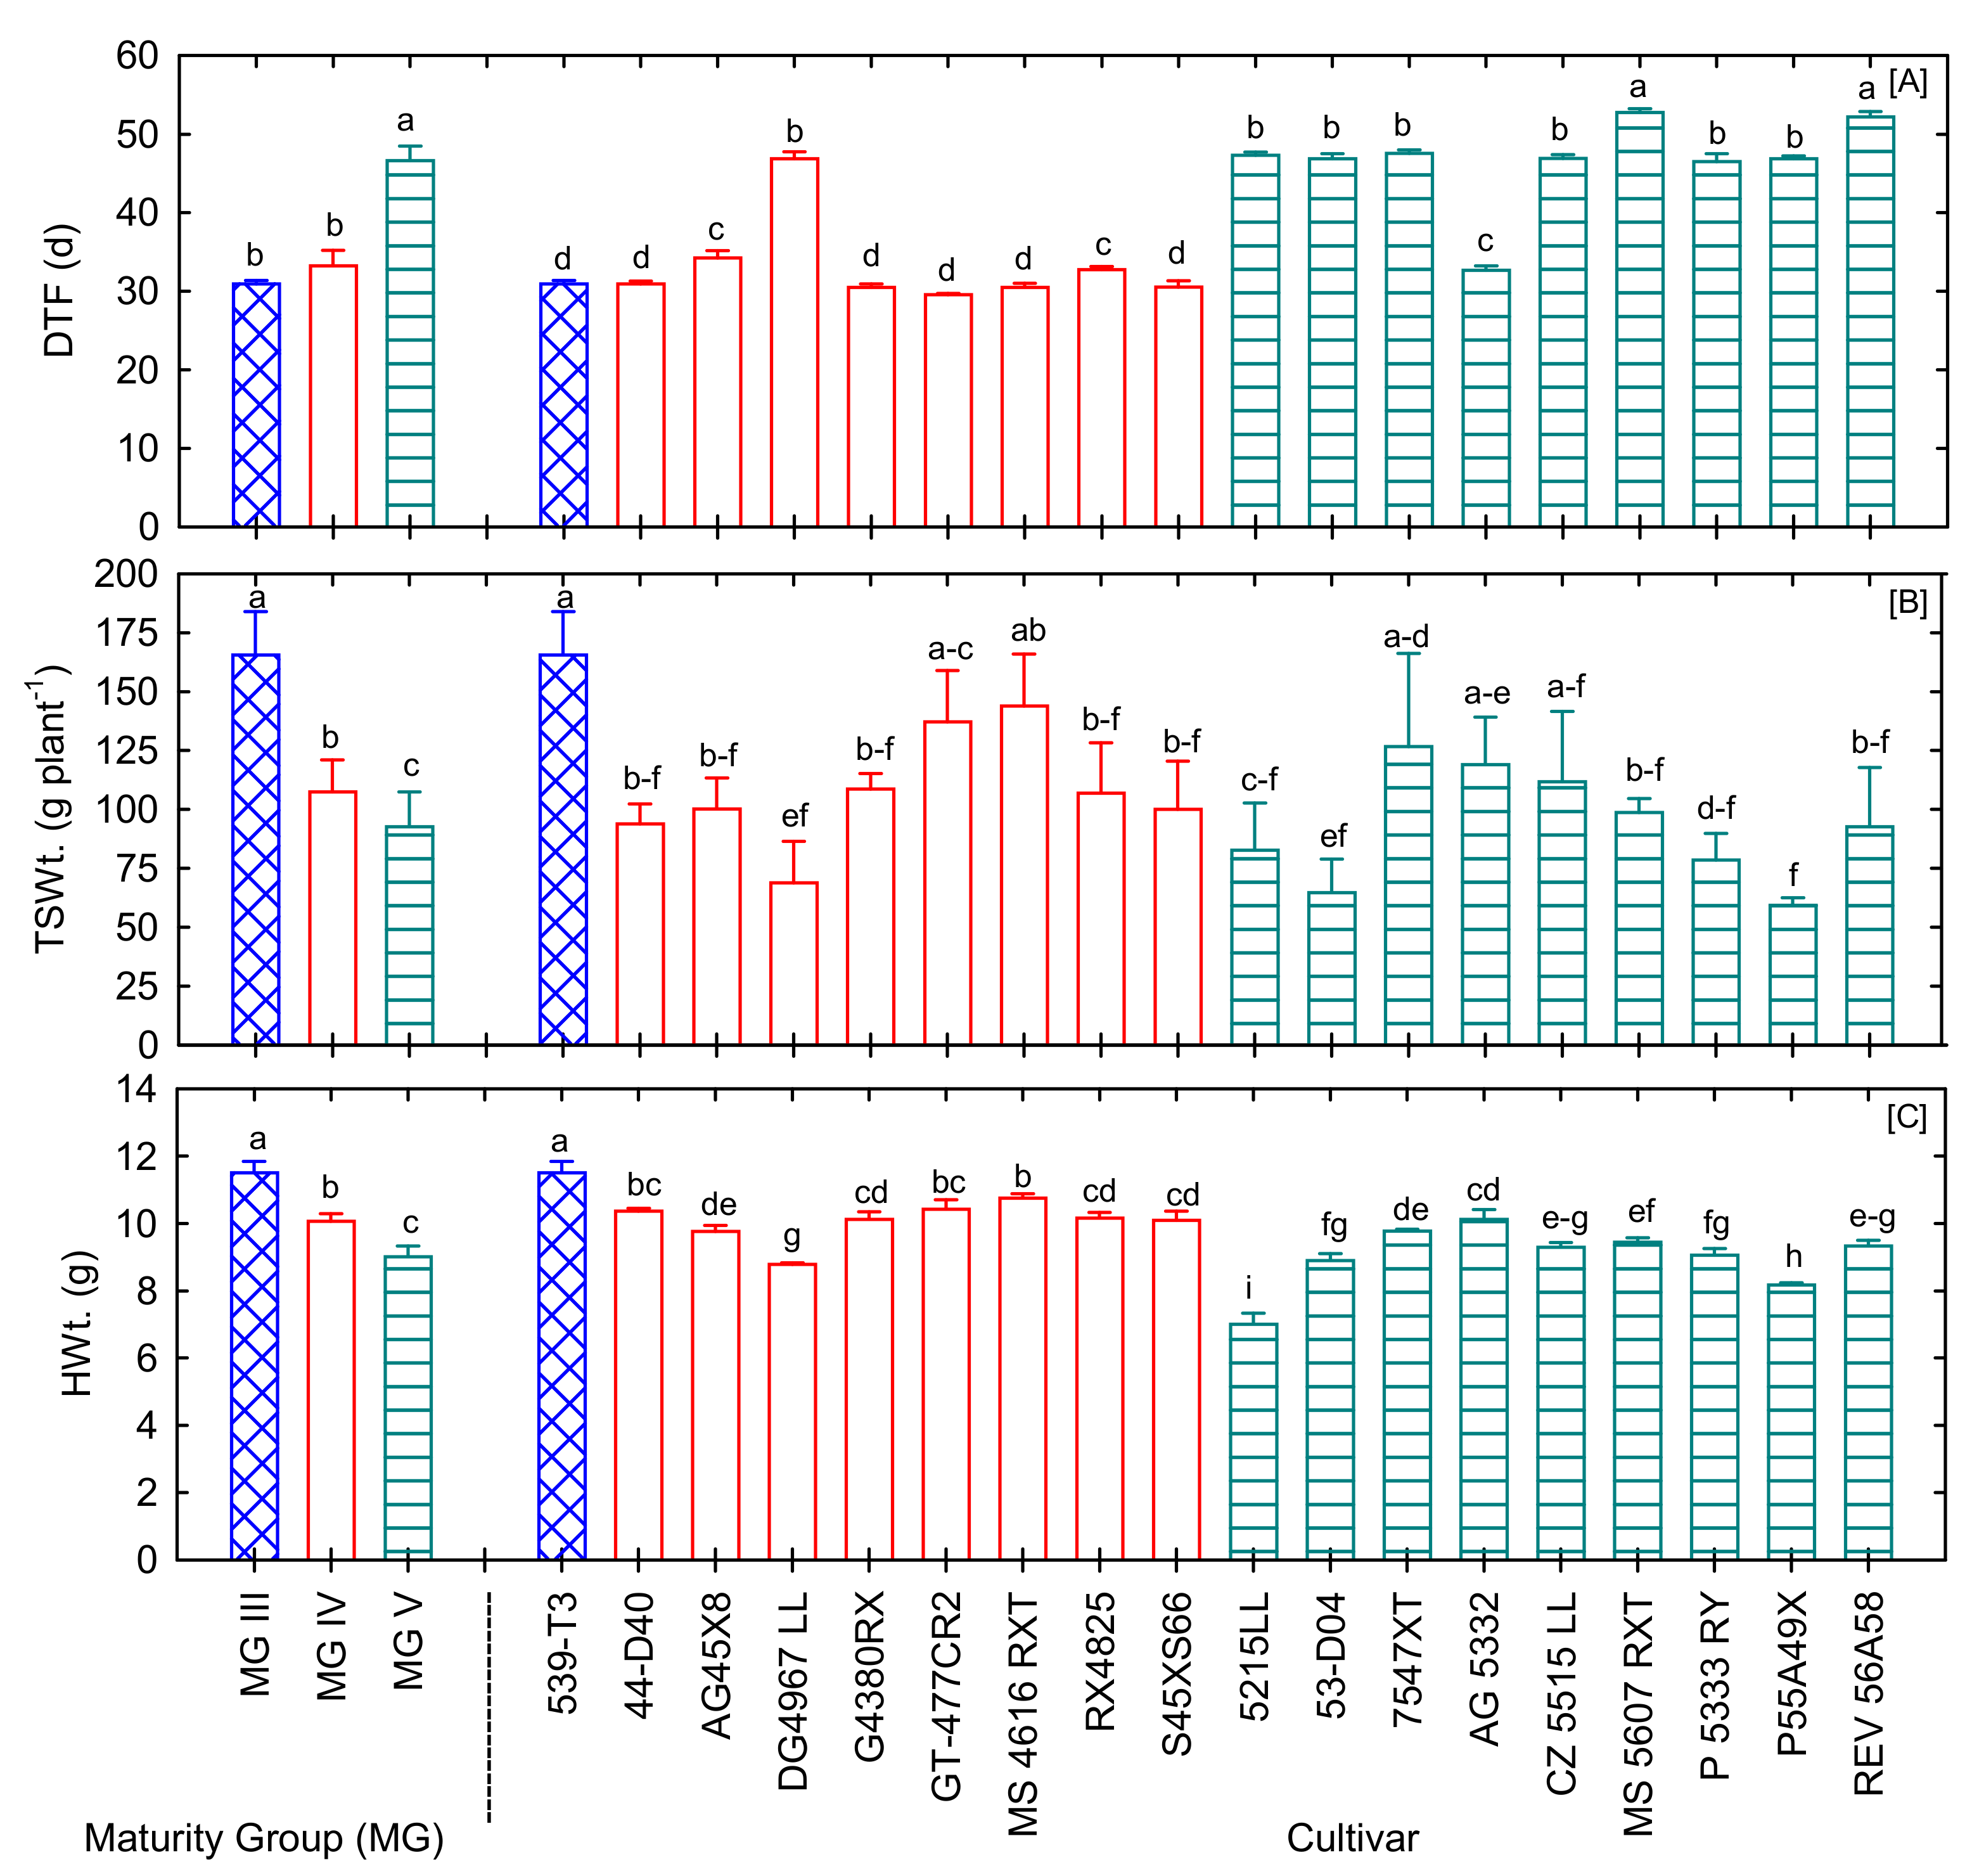
Figure 3.
Variations in (A) protein and (B) oil composition of 18 soybean cultivars under well-watered and fertilized conditions. Bars denote mean ± SE (n = 5). Bars with the same letter(s) indicate no significant difference among maturity groups (MG) or cultivars at p < 0.05 LSD.
Figure 3.
Variations in (A) protein and (B) oil composition of 18 soybean cultivars under well-watered and fertilized conditions. Bars denote mean ± SE (n = 5). Bars with the same letter(s) indicate no significant difference among maturity groups (MG) or cultivars at p < 0.05 LSD.

Figure 4.
Pearson’s correlation coefficients between soybean yield and quality parameters. The high and low intensity of color represent strong and weak relationships (blue for positive and red for negative) between a pair of parameters, respectively. Values closer to one indicate a strong correlation, and a value closer to zero indicates a weaker relationship between the two variables. * p < 0.05, ** p < 0.01, *** p < 0.001 indicate significant correlation between pair of traits. TSWt.—total seed weight plant−1; HWt.—100-seed weight.
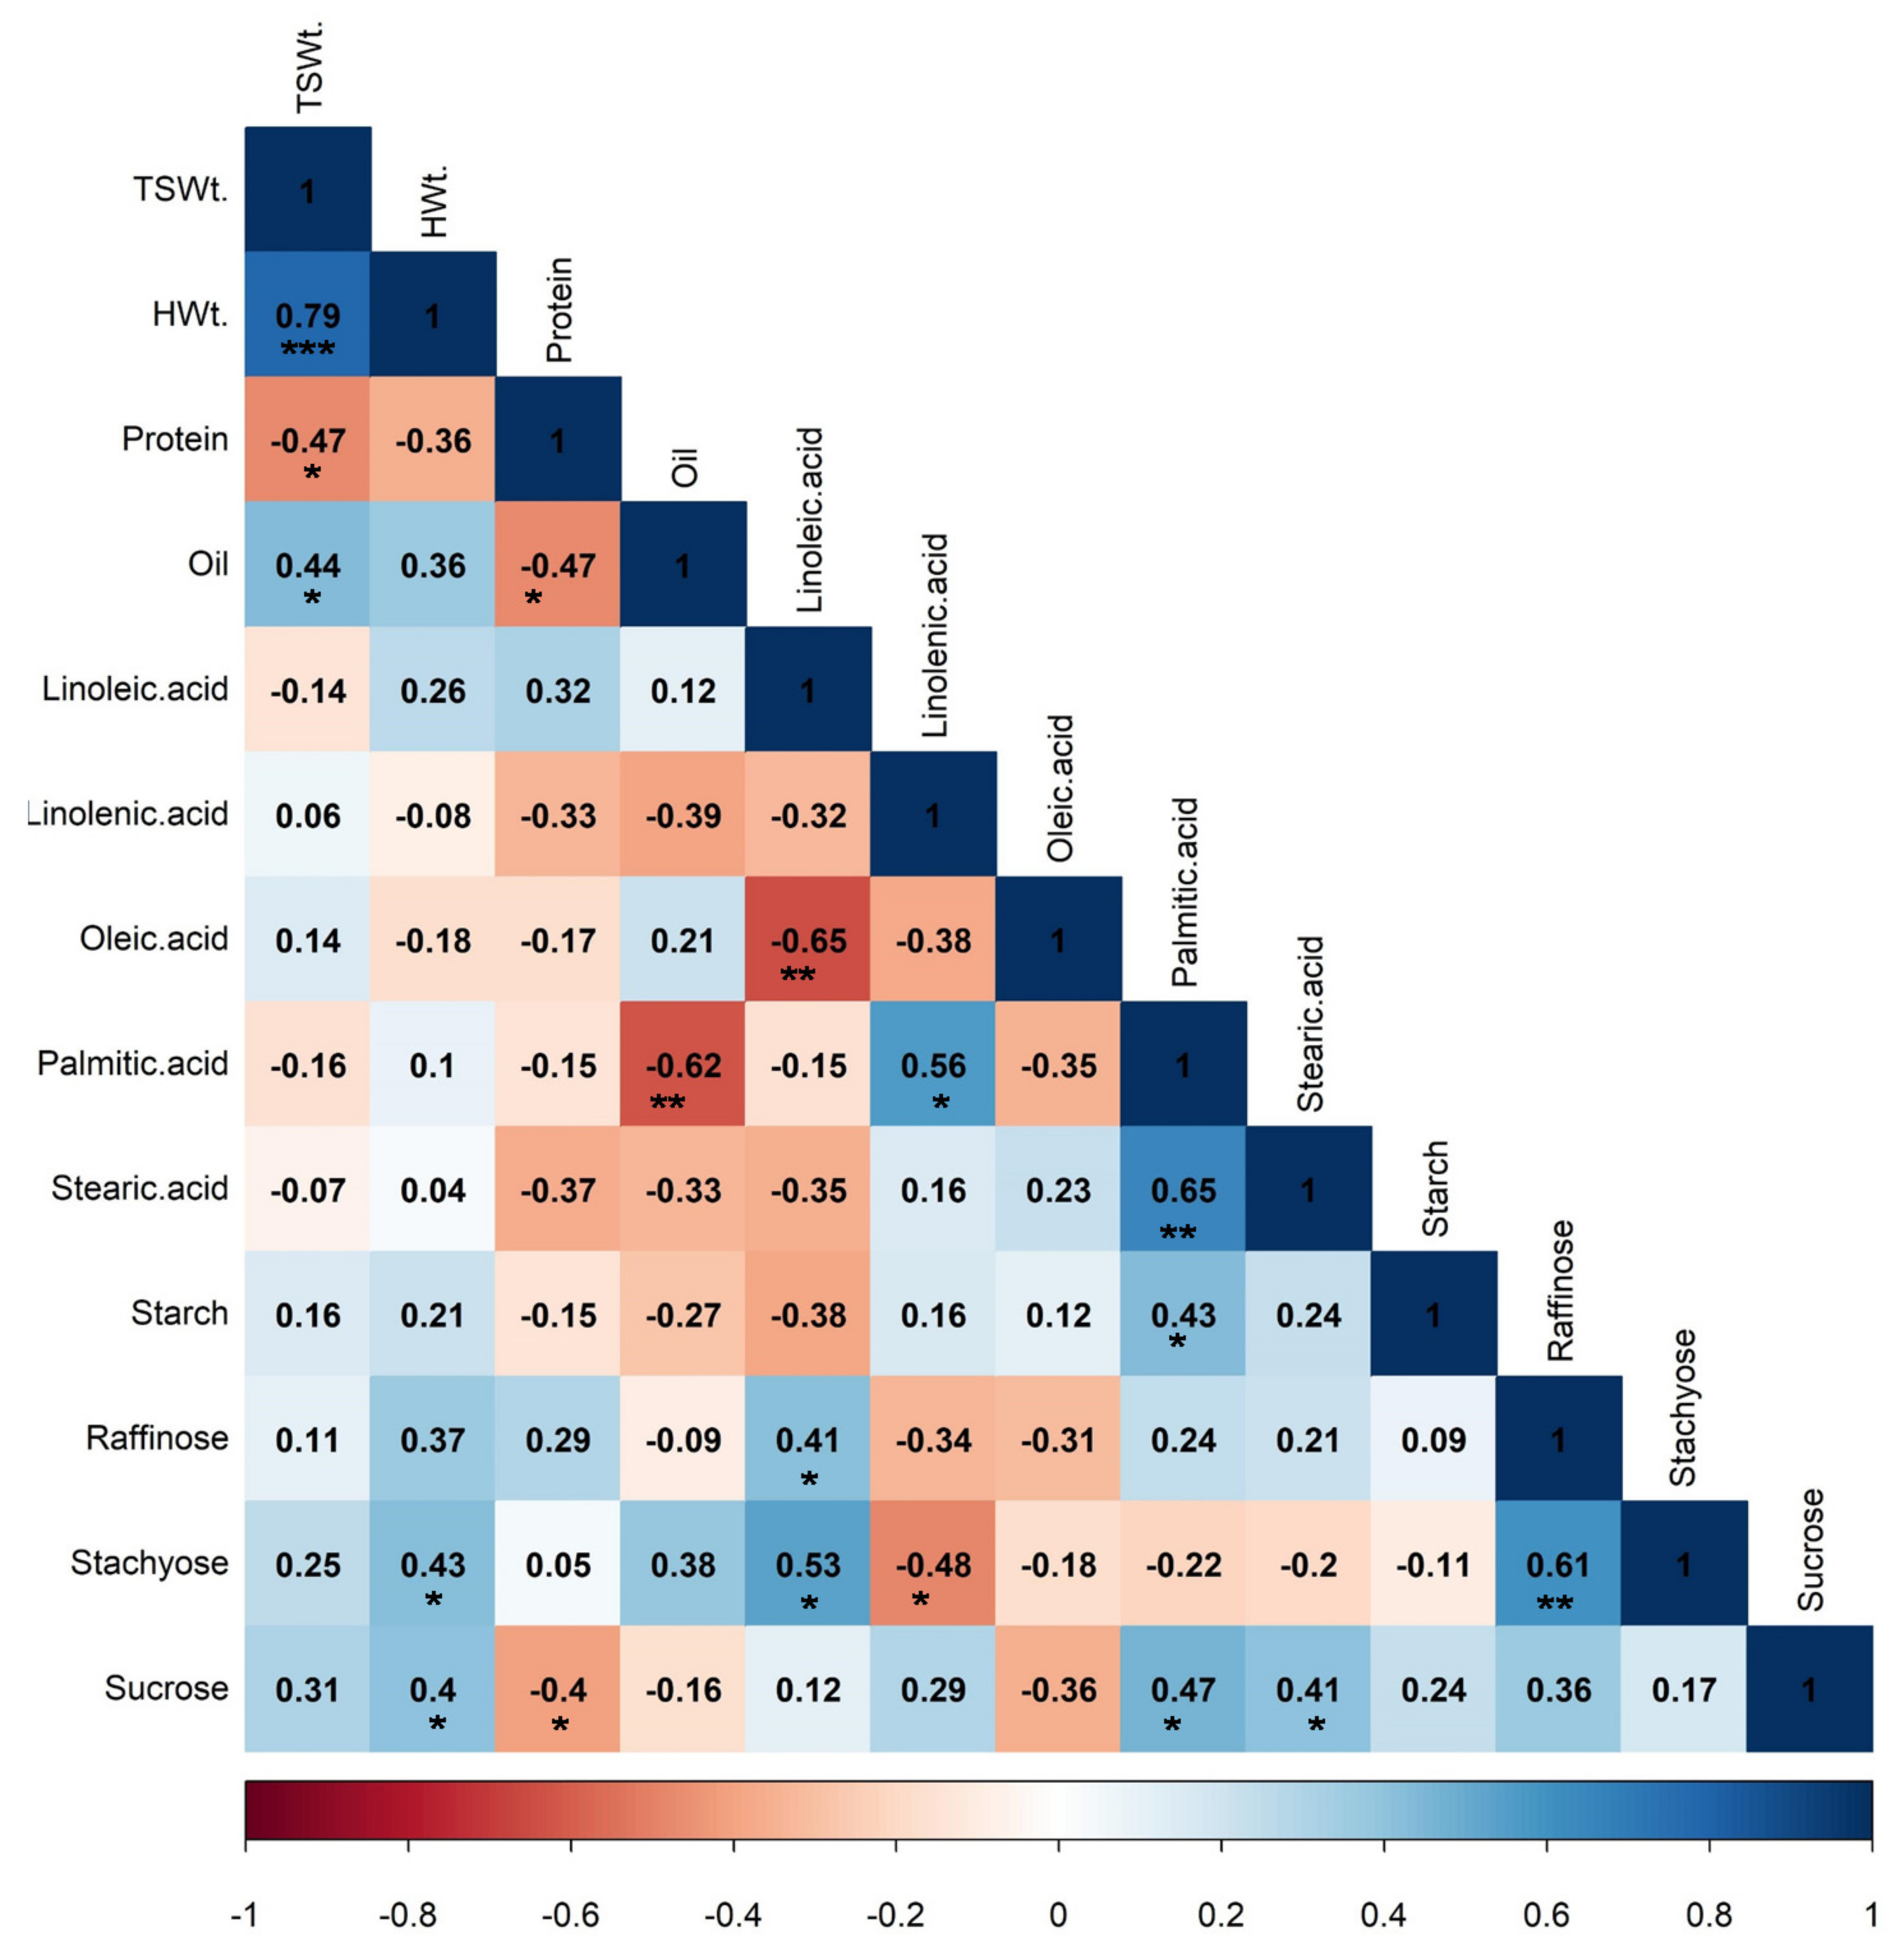
Figure 5.
Bubble plot of the cultivar’s relative values in percentage, calculated from the yield and seed quality parameters of 18 soybean cultivars grown under non-stressed conditions. The size and values of the bubble designated to each cultivar indicate the level of performance for a given parameter or overall cultivar performance (higher value signifies better performance and vice versa). DTF—days to 50% flowering, TSWt.—total seed weight plant−1; HWt.—100-seed weight.
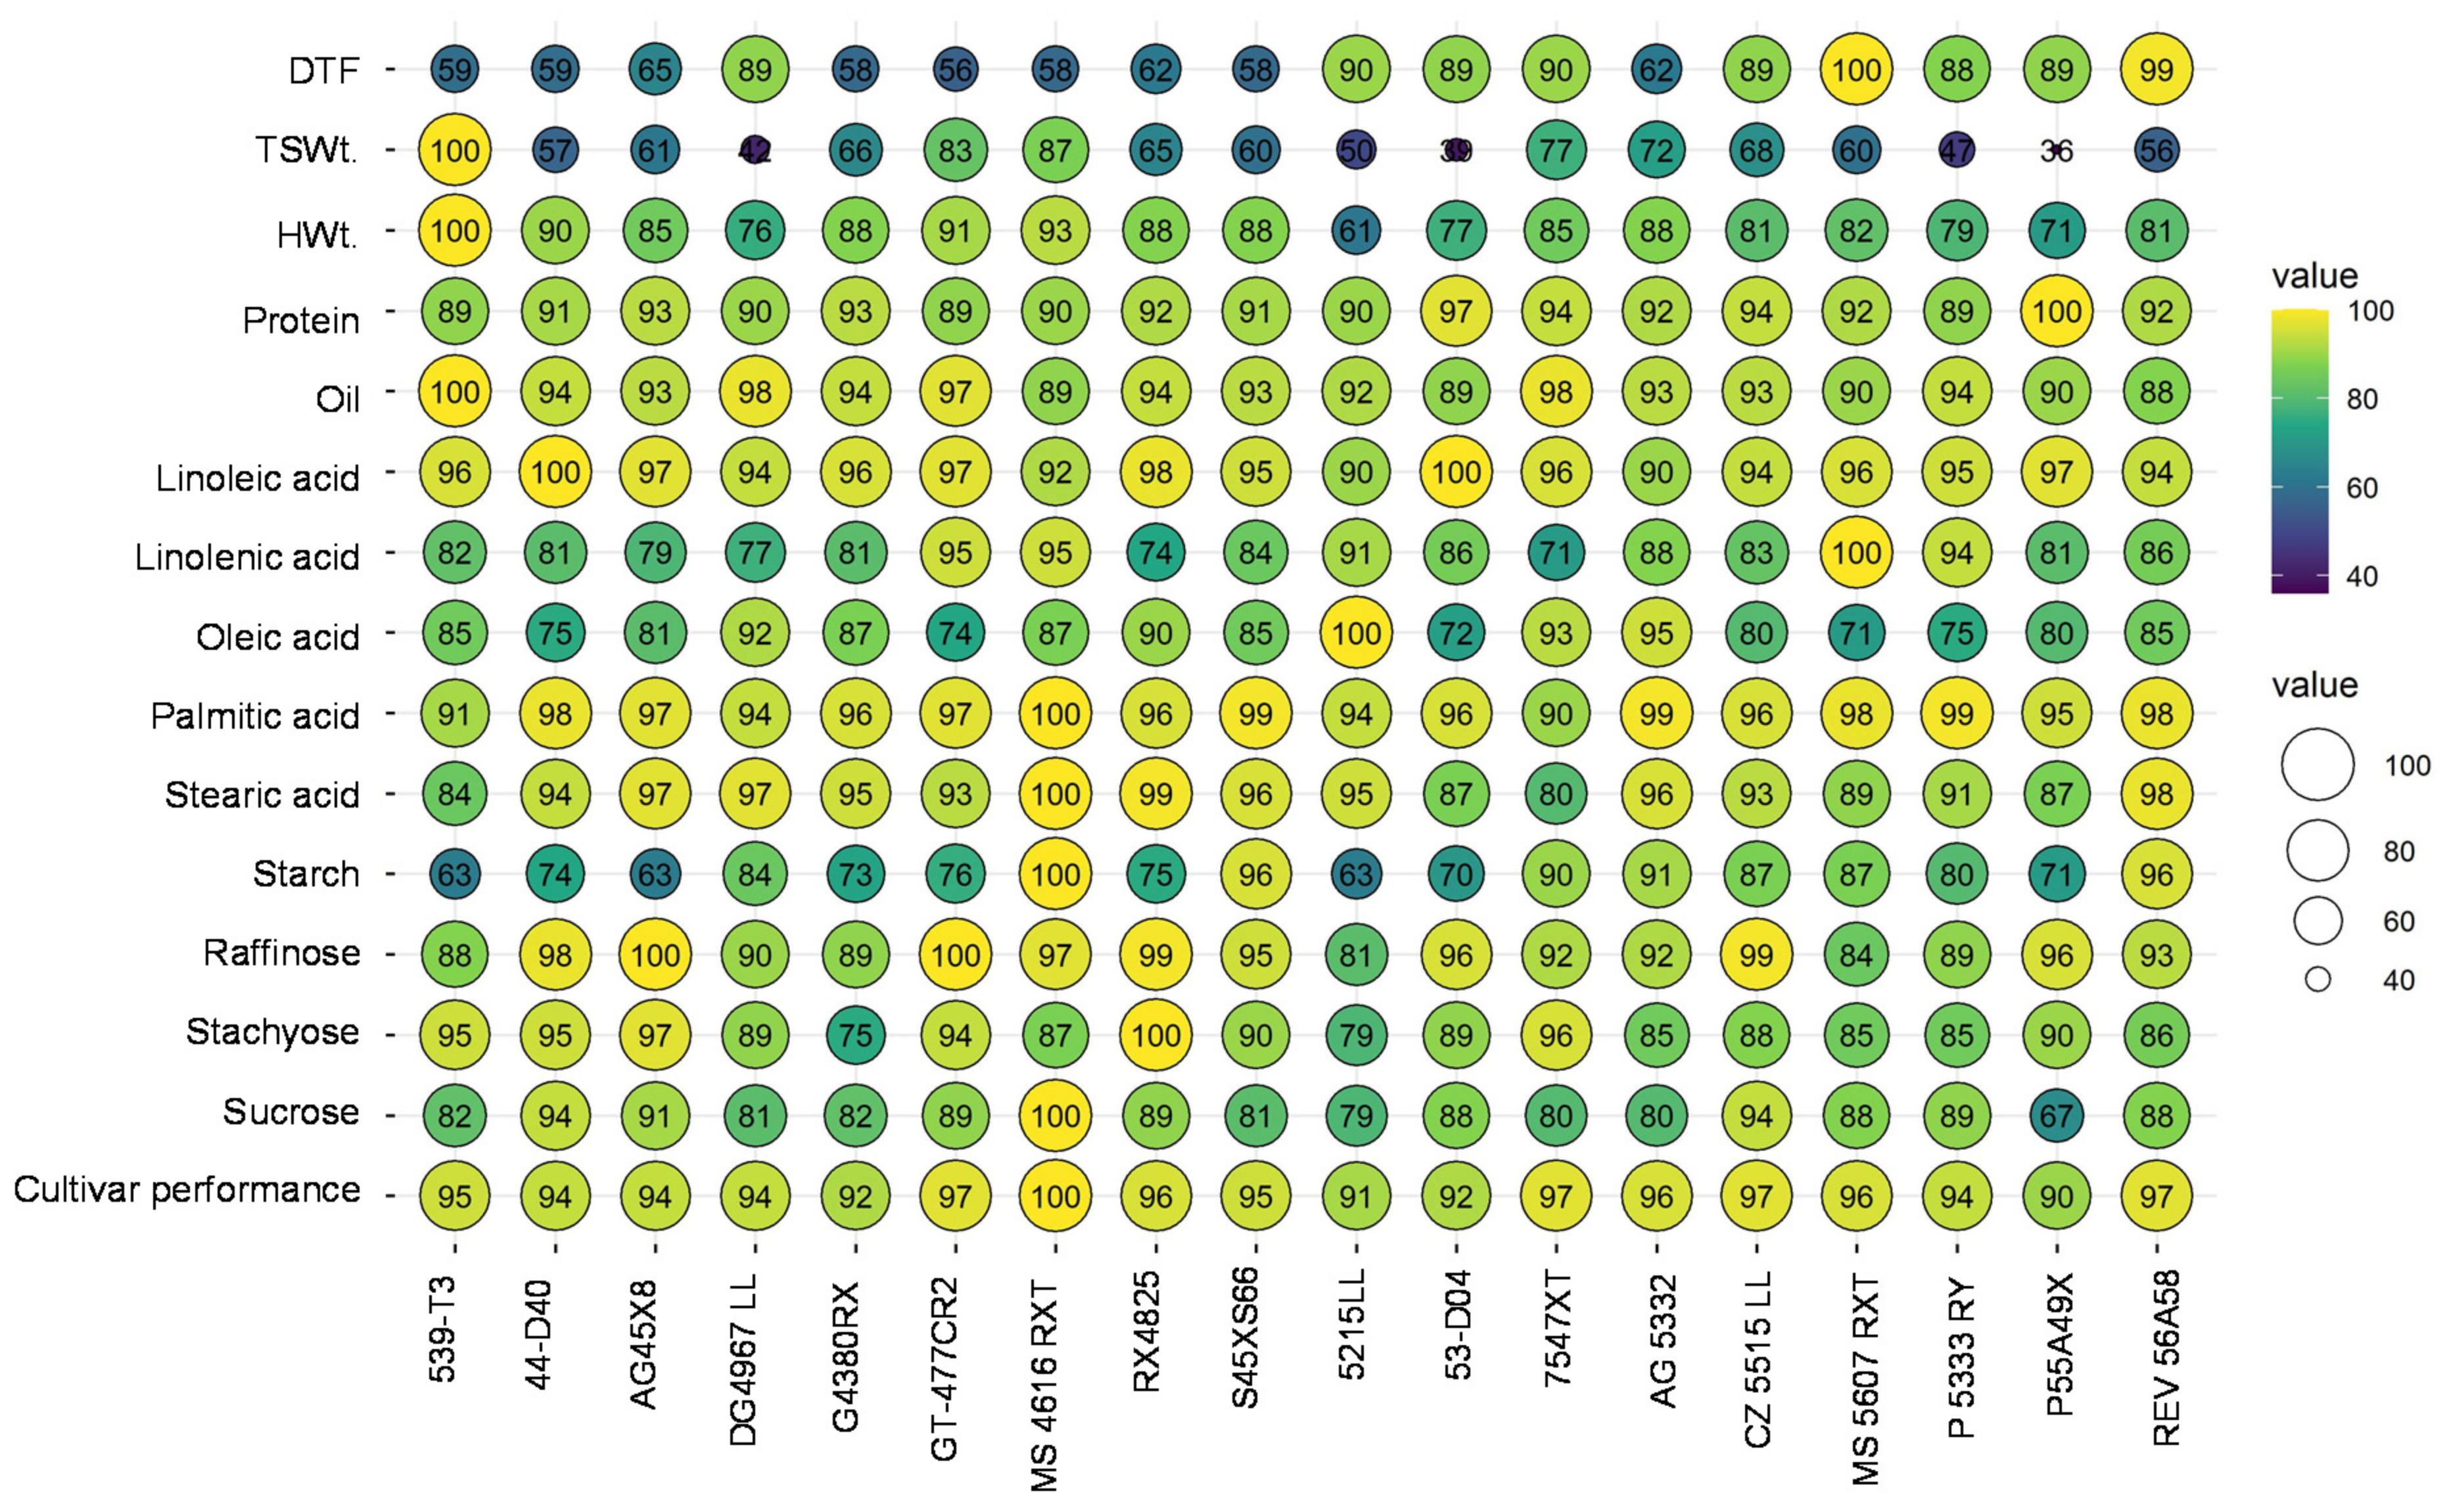
Figure 6.
Selection of high-yielding and high-quality soybean cultivars based on seed weight (TSWt.) and protein (A) or oil (B). Normalized Z scores were estimated for seed weight, protein, and oil for each cultivar, and the computed scores were used to select soybean cultivars with a combination of desirable traits. The figure also shows the selected set of contrasting cultivars for total seed weight and protein (A) or oil (B).


Table 1.
Summary of 18 soybean cultivars yield components and quality parameters grown under well-watered and fertilized conditions.
Table 1.
Summary of 18 soybean cultivars yield components and quality parameters grown under well-watered and fertilized conditions.
| Trait | Cultivar | MG | Minimum | Maximum | Mean |
|---|---|---|---|---|---|
| Yield components | |||||
| Days to fifty flowering (%) | *** | *** | 29.6 | 52.6 | 39.8 |
| Total seed weight (g plant−1) | * | ** | 59.5 | 165.6 | 103.4 |
| 100-seed weight (g) | *** | *** | 7.01 | 11.5 | 9.6 |
| Seed quality compositions | |||||
| Protein (g kg−1) | *** | *** | 395.2 | 444.0 | 409.0 |
| Oil (g kg−1) | *** | *** | 208.3 | 237.1 | 221.0 |
| Linoleic acid (g kg−1) | *** | ns | 501.7 | 557.7 | 532.5 |
| Linolenic acid (g kg−1) | *** | ns | 64.7 | 91.7 | 77.8 |
| Oleic acid (g kg−1) | *** | ns | 183.2 | 256.7 | 214.8 |
| Palmitic acid (g kg−1) | *** | *** | 119.1 | 131.9 | 127.0 |
| Stearic acid (g kg−1) | *** | *** | 38.1 | 47.7 | 44.4 |
| Starch (g kg−1) | *** | * | 26.5 | 42.3 | 33.9 |
| Raffinose (g kg−1) | *** | ** | 8.7 | 10.7 | 9.9 |
| Stachyose (g kg−1) | *** | * | 32.9 | 43.9 | 39.0 |
| Sucrose (g kg−1) | *** | * | 38.9 | 57.9 | 49.7 |
*, **, and *** indicate significance levels at p < 0.05, p < 0.01, p < 0.001, respectively. ‘ns’ indicates nonsignificant. ‘MG’ indicates maturity group.
Table 2.
Variations in linoleic acid, linolenic acid, oleic acid, palmitic acid, stearic acid, starch, raffinose, sucrose, and stachyose (g per kg) of 18 soybean cultivars grown under nonstress conditions.
Table 2.
Variations in linoleic acid, linolenic acid, oleic acid, palmitic acid, stearic acid, starch, raffinose, sucrose, and stachyose (g per kg) of 18 soybean cultivars grown under nonstress conditions.
| Cultivar | Brand | MG | Linoleic Acid | Linolenic Acid | Oleic Acid | Palmitic Acid | Stearic Acid | Starch | Raffinose | Sucrose | Stachyose |
|---|---|---|---|---|---|---|---|---|---|---|---|
| 539-T3 | NK | III | 537.9 (c–e) | 75.6 (e–h) | 217.2 (ef) | 119.7 (i) | 40.2 (i) | 26.8 (g) | 9.4 (fg) | 47.3 (d) | 41.5 (b) |
| 44-D40 | Armor | IV | 556.0 (ab) | 74.1 (f–h) | 192.5 (g–i) | 128.8 (b–e) | 45.1 (d–f) | 31.4 (d–g) | 10.4 (a–c) | 54.7 (b) | 41.7 (ab) |
| AG45X8 | Asgrow | IV | 539.4 (b–e) | 72.4 (g–i) | 207.5 (fg) | 128.4 (c–f) | 46.5 (a–d) | 26.8 (g) | 10.7 (a) | 52.4 (bc) | 42.3 (ab) |
| DG4967 LL | Delta Grow | IV | 527.0 (d–f) | 70.3 (h–j) | 236.8 (b–d) | 123.5 (h) | 46.2 (a–e) | 35.7 (b–e) | 9.6 (d–g) | 47.0 (d) | 39.1 (cd) |
| G4380RX | AgriGold | IV | 537.6 (c–e) | 74.4 (f–h) | 222.2 (c–f) | 126.1 (f–h) | 45.6 (b–e) | 30.9 (e–g) | 9.5 (e–g) | 47.6 (d) | 32.9 (e) |
| GT-477CR2 | Great Heart Seed | IV | 541.8 (a–d) | 86.8 (ab) | 189.1 (g–i) | 127.9 (d–f) | 44.4 (ef) | 32.4 (d–f) | 10.6 (a) | 51.6 (c) | 41.1 (bc) |
| MS 4616 RXT | MorSoy | IV | 515.5 (fg) | 86.7 (ab) | 222.1 (c–f) | 131.9 (a) | 47.7 (a) | 42.3 (a) | 10.3 (a–c) | 57.9 (a) | 38.2 (d) |
| RX4825 | Croplan | IV | 547.6 (a–c) | 67.9 (ij) | 230.1 (b–e) | 126.9 (e–g) | 47.3 (ab) | 31.7 (d–g) | 10.6 (ab) | 51.7 (c) | 43.9 (a) |
| S45XS66 | Dyna-Gro | IV | 529.1 (d–f) | 76.8 (e–g) | 217.9 (d–f) | 131.2 (ab) | 46.0 (a–e) | 40.7 (ab) | 10.1 (a–e) | 47.0 (d) | 39.3 (cd) |
| 5215LL | Go Soy | V | 503.3 (g) | 83.9 (b–d) | 256.7 (a) | 124.1 (h) | 45.4 (c–e) | 26.5 (g) | 8.7 (h) | 46.1 (d) | 34.4 (e) |
| 53-D04 | Armor | V | 557.7 (a) | 79.2 (d–f) | 186.0 (hi) | 126.9 (e–g) | 41.6 (hi) | 29.7 (fg) | 10.2 (a–d) | 51.2 (c) | 38.8 (d) |
| 7547XT | USG | V | 537.2 (c–e) | 64.7 (j) | 239.1 (a–c) | 119.1 (i) | 38.1 (j) | 38.2 (a–c) | 9.8 (c–f) | 46.6 (d) | 42.3 (ab) |
| AG 5332 | Asgrow | V | 501.7 (g) | 80.7 (c–e) | 244.3 (ab) | 130.3 (a–d) | 46.0 (a–e) | 38.6 (a–c) | 9.8 (c–f) | 46.4 (d) | 37.1 (d) |
| CZ 5515 LL | Credenz | V | 521.8 (ef) | 76.2 (e–g) | 205.9 (fg) | 126.1 (f–h) | 44.4 (ef) | 36.8 (b–d) | 10.6 (a) | 54.7 (b) | 38.6 (d) |
| MS 5607 RXT | Morsoy | V | 536.4 (c–e) | 91.7 (a) | 183.2 (i) | 129.3 (b–e) | 42.5 (gh) | 36.7 (b–d) | 8.9 (gh) | 51.2 (c) | 37.4 (d) |
| P 5333 RY | Progeny | V | 530.5 (c–f) | 86.2 (a–c) | 191.6 (g–i) | 130.9 (a–c) | 43.6 (fg) | 33.7 (c–f) | 9.5 (e–g) | 51.4 (c) | 37.4 (d) |
| P55A49X | Pioneer | V | 540.1 (a–d) | 73.8 (f–h) | 204.5 (f–h) | 125.1 (gh) | 41.3 (hi) | 30.1 (fg) | 10.3 (a–c) | 39.0 (e) | 39.3 (cd) |
| REV 56A58 | Terral | V | 524.4 (d–f) | 79.1 (d–f) | 219.4 (d–f) | 129.8 (a–d) | 46.8 (a–c) | 40.8 (ab) | 9.9 (b–f) | 51.0 (c) | 37.5 (d) |
Means followed by a common letter(s) in parenthesis are not significantly different at the 5% level of significance.
Publisher’s Note: MDPI stays neutral with regard to jurisdictional claims in published maps and institutional affiliations. |
© 2022 by the authors. Licensee MDPI, Basel, Switzerland. This article is an open access article distributed under the terms and conditions of the Creative Commons Attribution (CC BY) license (https://creativecommons.org/licenses/by/4.0/).
Share and Cite
MDPI and ACS Style
Bheemanahalli, R.; Poudel, S.; Alsajri, F.A.; Reddy, K.R. Phenotyping of Southern United States Soybean Cultivars for Potential Seed Weight and Seed Quality Compositions. Agronomy 2022, 12, 839. https://doi.org/10.3390/agronomy12040839
AMA Style
Bheemanahalli R, Poudel S, Alsajri FA, Reddy KR. Phenotyping of Southern United States Soybean Cultivars for Potential Seed Weight and Seed Quality Compositions. Agronomy. 2022; 12(4):839. https://doi.org/10.3390/agronomy12040839
Chicago/Turabian StyleBheemanahalli, Raju, Sadikshya Poudel, Firas A. Alsajri, and Kambham Raja Reddy. 2022. "Phenotyping of Southern United States Soybean Cultivars for Potential Seed Weight and Seed Quality Compositions" Agronomy 12, no. 4: 839. https://doi.org/10.3390/agronomy12040839
Note that from the first issue of 2016, this journal uses article numbers instead of page numbers. See further details here.