Article

Bioelectrical Impedance Vector and Creatine Phosphokinase Changes Induced by a High-Intensity Training Session in Rink Hockey Players

by
Álex Cebrián-Ponce
1,2,
Manuel V. Garnacho-Castaño
3,
Mercè Castellano-Fàbrega
4,
Jorge Castizo-Olier
5,
Marta Carrasco-Marginet
1,2,
Noemí Serra-Paya
5 and
Alfredo Irurtia
1,2,*
1
INEFC-Barcelona Sports Sciences Research Group, Institut Nacional d’Educació Física de Catalunya (INEFC), University of Barcelona (UB), 08038 Barcelona, Spain
2
Catalan School of Kinanthropometry, National Institute of Physical Education of Catalonia (INEFC), University of Barcelona (UB), 08038 Barcelona, Spain
3
Campus Docente Sant Joan de Déu., University of Barcelona (UB), 08034 Barcelona, Spain
4
Fisiomèdic Group SLP, 17003 Girona, Spain
5
School of Health Sciences, TecnoCampus, Pompeu Fabra University, Mataró, 08302 Barcelona, Spain
*
Author to whom correspondence should be addressed.
Appl. Sci. 2022, 12(2), 751; https://doi.org/10.3390/app12020751
Submission received: 27 November 2021 / Revised: 29 December 2021 / Accepted: 6 January 2022 / Published: 12 January 2022

Abstract

:
This study aimed to analyze anthropometric and whole-body/muscle-localized bioelectrical impedance vector analysis (BIVA) adaptations and their relation to creatine kinase (CK) as a biomarker of muscle damage in a group of seven male players in the maximum category of professional rink hockey. There were three checkpoint assessments in relation to a high-intensity training session: pre-session (PRE), post-session (POST), and 24 h-post-session (POST24H). The resistance, reactance, and impedance module were adjusted by height (R/h, Xc/h, and Z/h, respectively). The Wilcoxon signed-rank test was used to compare the data at baseline and follow-up, while Spearman correlation was used to explore the relationship between CK and the rest of the parameters. The results registered a decrease in body mass at POST (p = 0.03) and a reestablishment at POST24H (p = 0.02). Whole-body BIVA registered a significant increase in R/h between PRE–to–POST (p = 0.02) and returned to baseline values at POST24H (p = 0.02), which was expected since this parameter is related to hydration processes. Muscle-localized BIVA in the rectus femoris muscle showed an increase in both Xc/h and phase angle in POST (p = 0.04 and p = 0.03, respectively) and a decrease in Xc/h at POST24H (p = 0.02). CK correlated with R/h in the rectus femoris at all the checkpoints (PRE–to–POST: r = 0.75, p = 0.05; PRE–to–POST24H: r = 0.81, p = 0.03; POST–to–POST24H: r = 0.82, p = 0.02). Our results indicate that BIVA is a sensitive methodology to assess general and muscle-localized hydration induced by a high-intensity training session in rink hockey players. A correlation between BIVA and CK was also reported.

1. Introduction

Rink hockey, also known as roller hockey, is a sport in which two teams of five players (four players and a goalkeeper) use curve-shaped wooden sticks to try to score more goals than the opponent with a rubber ball on a rectangular closed pitch. Each match consists of two periods of 25 min each, separated by a resting period of 15 min [1].
The contribution of the scientific literature regarding the physiological and bioenergetic knowledge of this sport is scarce [2,3] compared to other popular sports. However, it is well known that the character or specificity of physical effort in rink hockey is highly complex, mainly because the technical and tactical actions are subject to a significantly higher rate than in other sports [4], requiring both high intensity short and long-duration efforts [2] without being able to fully recover [3].
This type of training generates physiological changes in the players, producing an adaptation according to the stimulus and the workload. An adequate control of this workload is important since it allows for the optimization of sports performance, reduces the risk of injury, and prevents overtraining. In this regard, creatine phosphokinase (CK) can be described as a marker that assesses the responses provoked by exercise, since it is considered a marker of muscle damage in the sports field [5]. It has been reported that an increase in serum CK concentrations combined with a reduced exercise tolerance is a critical overtraining marker [6,7]. Strenuous exercise damages the skeletal muscle cell structure, causing a substantial increase in total CK in blood in the following hours and days after the exercise is performed [6,8]. Trained subjects present higher resting values of CK compared to untrained subjects [9] and subjects with a higher fat percentage reach higher CK levels [10]. Interestingly, serum CK levels in the hours and days following a high-intensity session in professional rink hockey players are unknown.
Bioelectrical impedance analysis (BIA) is as a relatively new technique based on the opposition of the body tissues to the flow of an introduced electrical current. BIA is capable of assessing the state of body composition, nutrition, hydration, and cellular integrity in an economic, easy, fast, and non-invasive way, through the use of different multiple regression equations [11,12]. The resulting bioimpedance parameters are the resistance (R, the major resistance to the current through intra- and extracellular ionic fluids), reactance (Xc, the additional opposition due to the capacitive elements, such as cell membranes, tissue interfaces, and non-ionic substances), impedance (Z, the tissues’ opposition to the electric current flow), and phase angle (PhA, the geometric relationship between R and Xc) [13]. However, the great limitation of this technique is that its accuracy is compromised because the regression equations derived from a population group may not match the targeted specific group, and assumptions such as constant tissue hydration or constant tissue isotropy are not frequently suitable [14,15].
In order to overcome the mentioned limitations of BIA, bioelectrical impedance vector analysis (BIVA) emerged, solving these problems by using raw impedance parameters instead of using the regression equations. BIVA can be performed through different protocols depending on the distribution and the number of the electrodes [16]. To date, the reference method is the foot-to-hand tetrapolar electrode arrangement at a 50 kHz single frequency to measure whole-body BIVA [11,12]. Low frequencies (<5 kHz) cannot penetrate the cell membrane, while high frequency (>200 kHz) current can flow through intra- and extracellular compartments. However, there is a poor reproducibility in both low and high frequencies; hence, the most commonly used frequency is 50 kHz, which is an intermediate frequency [16]. Whole-body BIVA has been studied in different sports, which has allowed for the elucidation of the body composition characteristics of each specific sport [13]. Furthermore, this knowledge of body composition has been suggested to discriminate athletes of different performance levels [17].
If the four electrodes are located on a specific muscle, it can be named both as muscle-localized BIVA (ML-BIVA) and electrical impedance myography (EIM). There is less consensus about the exact location of the electrodes regarding ML-BIVA, since the scientific literature is scarce and heterogeneous. ML-BIVA has mainly been studied in medicine in a wide range of different clinical conditions [18,19]. However, in recent years there has been growing interest in its applicability in the high-performance sports field [19], and in the assessment and follow-up of muscle injuries [20,21,22,23,24]. The most analyzed muscles are the quadriceps, hamstrings, and calves, as they are long muscles that allow an easier assessment than others. The information provided by this method could help technical and medical staff to make decisions about their athletes.
Unlike BIA, BIVA does not provide a quantitative evaluation of the outcomes; thus, making a single measurement may be inefficient, since one of the main strengths of BIVA is to analyze how the vector changes over a given period of time and under previously established circumstances, e.g., comparing impedance values before and after intense physical exercise. Another interesting aspect of BIVA is its ability to make a comparison of bioelectrical data, without the need to perform a PRE–to–POST comparison, based on specific sectors of the population that may be different (e.g., healthy adult reference population) or similar than the subject under analysis. Furthermore, BIVA may be of great use in the assessment of body composition, considering that this issue is important since the physical stress imposed during exercise may lead to body composition alterations causing a poorer performance [25]. In addition, dehydration can also impair performance [26,27] and increase the risk of injury [28], thus monitoring body fluid can assist in prescribing water intake and mitigating dehydration effects. Lastly, one of the main interests regarding BIVA and sport lies in the analysis of how the impedance parameters correlate to other indicators that also serve as exercise response markers. Some of the pioneers of this possible application were Nescolarde et al. [29], who reported that whole-body vector displacement could be correlated with some biomarkers of renal damage at 24–48 h post-race but not with CK.
Thus, this study aimed to analyze the kinetics of BIVA parameters (global and muscle-localized), which can provide information about the degree of dehydration, the physiological training effects, and the cellular integrity of muscle induced by a session of high-intensity training in rink hockey players. Furthermore, we also aimed to analyze if some of these BIVA parameters are correlated to CK changes, since both are markers of adaptation to exercise that may indicate that muscle damage has occurred after training. In this sense, it is now recognized that the evaluation of body water is a dynamic and complex process, and that no measure is valid for all situations [30,31]. It is for this reason that BIVA emerges as a precise, accurate, reliable, non-invasive, portable, cheap, and safe method that can easily be used to assess hydration status in real time [32]. These properties are particularly interesting for the evaluation of sport for both the training process as well as in competitive events. The present study analyses anthropometric adaptations, bioelectrical data (global and localized), and their relation to the behavior of CK, beforehand, afterwards, and 24 h after a high-intensity rink hockey training session.

2. Materials and Methods

2.1. Participants

This study was conducted on 7 top-level male professional rink hockey players from the same team throughout the same season (mean ± SD: age 26.3 ± 5.4 years; height 177.0 ± 6.2 cm; body mass (BM) 79.0 ± 9 8 kg; body mass index (BMI) 25.1 ± 2.1 kg/m2). All players voluntarily participated in the study and delivered written informed consent prior to their participation. The inclusion criteria were as follows: (1) participants must be older than 18 years old; (2) must not present injuries or any clinical condition at the time of the study; and (3) are not taking any medication at the time of the study.
The study was conducted following the Helsinki Declaration Statement [33]. The protocol and procedures were approved by the Ethics Committee for Clinical Sport Research of Catalonia (Ethical Approval Code: 19/CEICGC/2020).

2.2. Study Design

This pre–post quasi-experimental study was both descriptive and correlational and aimed to approach the topic from an ecological perspective. The study analyzed the acute adaptations induced by a rink hockey training session on anthropometric variables, bioelectrical whole-body and muscle-localized vector displacement (resistance (R, Ω), resistance adjusted by height (R/h, Ω/m), reactance (Xc, Ω), reactance adjusted by height (Xc/h, Ω/m), impedance module (Z, Ω), impedance module adjusted by height (Z/h, Ω/m), and phase angle (PhA, °)), and other markers related to adaptations to exercise (CK, rate of perceived exertion, and HR) that were obtained from the same subjects at three checkpoints: before the training session (PRE), after finishing the training session (POST), and 24 h after POST measurements (POST24H). Using the resistance (Ω) and reactance (Ω), we derived the module bioimpedance (Ω) ( | Z | = ( R 2 + X c 2 ) ) and the phase angle (°), since it is the geometric relationship between these two parameters in degrees ( P h A = tan 1 X c R × 180 ° π ).

2.3. Procedures

From just before the first assessment, the subjects were not allowed to urinate or eat solid food until the end of the second assessment, and fluid intake was monitored during training. In addition, the players had not trained during the previous 48 h. The players were measured wearing only underwear. Initially, the measurements of size, weight, and body temperature were performed.
After the measurement of the anthropometric, bioelectrical, and hematological values, all the players together took part in a training session, which consisted of a warming up phase, a block of technical and tactical tasks with skates at a high intensity, and a cooling down phase, for a total time of approximately 2.5 h (Table 1). The specific details of the training session can be found in the Supplementary Material. Two more assessments were performed under the same conditions, the first after finishing the training and the other 24 h later.
The heart rate (HR) of each player throughout 2.5 h training session was monitored individually and the percentual amount of time in each intensity zone was classified. HR was monitored by a Polar RS800CX HR sensor (Polar Electro Oy Inc., Kempele, Finland) with the Polar ProTrainer 5 software (measuring range for HR: 5–95%; accuracy: ±3% between 15% and 90%).
The individual session rate of perceived exertion (RPE) was quantified during training. The 15-graded RPE scale [34] was shown to the players immediately after the training was completed. As shown in Table 1, the mean RPE of the players was 14.7 ± 1.7, which implies that the training session was hard.
The blood collections for CK measurements were carried out by a qualified practitioner at PRE, POST, and POST24H and the subsequent analyses were conducted according to the procedures established in previous studies [7].

2.3.1. Anthropometric Assessment

The anthropometric measurements were performed according to the standard criteria of the International Society for the Advancement of Kinanthropometry (ISAK) [35]. The following anthropometric material was used: (A) a telescopic measuring rod (Seca 220®, Birmingham, UK, measuring range: 85–200 cm; accuracy: 1 mm) to measure the height; (B) a scale (Seca 710®, Birmingham, UK previously calibrated, capacity: 200 kg; accuracy: 50 g) to measure weight; and (C) anthropometric tape (Lufkin Executive®, Lufkin, TX, USA, accuracy 1 mm) to place the electrodes and to measure the perimeters. To measure the perimeter of the thigh, the anthropometric tape was positioned perpendicular to the center of the long axis of the thigh, running from the inguinal crease to the superior part of the patella, while subjects were seated on anthropometric boxes. Body mass index (BMI) was calculated as body mass/height2 (kg/m2).

2.3.2. Bioimpedance Assessment

R and Xc were measured using a BIA 101 Anniversary Sport Edition analyzer (Akern Srl, Florence, Italy) that emitted a 400 μA alternating sinusoidal current at 50 kHz [36]. This device was previously calibrated with a known impedance circuit provided by the manufacturer. The system measurement errors were determined by an accuracy resistor (0.1% tolerance) and capacitor (tolerance 1%), where <1 Ω for R and <2% for Xc. The repeatability and accuracy of the real-time measurements of R and Xc allowed the smallest changes to be recorded, with 1 Ω accuracy for R and Xc.
All players were instructed to take a cold shower (as cold as tolerable) for 10–15 min post-training, in order to reduce cutaneous blood flow and temperature and remove accumulated electrolytes [37], reducing a possible bias in the analysis caused by a change in body temperature. Body temperature was measured just before the BIA measurements; this verified the return to temperatures close to the pre-training values, thus no significant differences were recorded between individual body temperatures of each player (PRE: 37.1 ± 0.2 °C; POST: 37.3 ± 0.5 °C; POST24H: 37.2 ± 0.3 °C). The measurements of body temperature before and after the training session were performed with a tympanic thermometer in the right ear (Genius 1000, Sherwood, Nottingham, UK, measuring range: −25 + 55 °C, accuracy: 0.1 °C) connected to a “data logger” Squirrel 2010 model (Grant Instruments Ltd., Cambridge, UK). Ambient temperature and relative humidity were recorded every 30 min during the total duration of the training by a portable weather station (Kestrel Weather K4500, TEquipment, USA, temperature measurement range: −29 + 70 °C; accuracy: ±1 °C), and the average was 22.3 ± 0.4 °C for room temperature and 55.2 ± 1.5% for relative humidity.
The bioelectrical measurements were conducted under controlled conditions through the 50 kHz single frequency tetrapolar technique [32]. The subjects were measured lying on a stretcher in the supine position with their arms separated from their body by 30 degrees and their legs apart from each other at 45 degrees to avoid adduction or crossing of limbs, which would shorten the circuit and reduce the impedance values [38]. The electrodes were placed using the anatomical landmarks identified by palpation and reference distances with the anthropometric tape, to measure localized spots of the selected muscles. Pre-gelled electrodes (Red Dot™ 2660-5, 3M Corporate Headquarters, St. Paul, MN, USA) with low impedance were used to minimize the measurement error produced by the bioimpedance between the electrodes and skin. The area where the electrodes were placed was shaved and cleaned with alcohol. The points at which they were placed were labelled with permanent marker to ensure that the location was identical before and after training. The bioelectrical measurements were recorded after a stabilization period of 5 min, in which the players remained lying motionless. From the 5 min mark, three measurements were performed every 60 s to ensure proper distribution of body fluids. Subsequently, the average value for the three measurements was used for the final calculations.
-
Whole-body assessment: The proximal electrode (sensor) of the arm was placed on the dorsal surface of the right wrist, between the ulna and radius. The proximal leg electrode was placed on the anterior surface of the right ankle, between the protruding portions of the bones. The distal electrodes (nozzles) were placed on the dorsal surface of the third proximal phalanx of the right hand and foot [16]. The proximal electrodes were spaced 5 cm from the distal to prevent interaction between electric fields, which could lead to an overestimation of the impedance values.
-
Rectus femoris muscle-localized assessment: The electrode placement procedures followed the recommendations of the Surface Electromyography for the Non-Invasive Assessment of Muscles (SENIAM) guidelines for the rectus femoris [39] and the ISAK standards and measurement protocol [35], as follows: 1. Locate the anterosuperior iliac spine (sartorius insertion), assuming that a more inferior (anteroinferior iliac spine) rectus femoris origin, and mark with a point; 2. Locate the superior pole of the patella with the knee in unforced extension, and mark with a point; 3. Connect both mark points with an anthropometric tape (running in a straight line along the immediately upper anterior thigh). Note the distance, in cm, between the two points and mark at 50% of this distance with a dot; 4. Placement of the electrodes: divide the distance between the origin and insertion by three. At one third of the origin (proximal) and one third of the insertion (distal), place the BIA sensor electrodes at a fixed distance of 5 cm (from the center of the electrodes) between the BIA injector electrodes (Figure 1).

2.4. Statistical Analysis

The statistical values were expressed as mean ± standard deviation. After testing each variable for the normality of the distribution (Shapiro–Wilks test), the differences in anthropometric (BM and circumference of the thigh), bioelectrical (R, Xc, Z, R/h, Xc/h, Z/h, and PhA) and hematological data (CK) at PRE, POST, and POST24H were analyzed through the non-parametric Friedman test and, in the case of differences, the Wilcoxon test. The magnitude of ratio changes was computed as delta percent values (∆%). Following this, the correlation was analyzed (Spearman coefficient) between increments or decrements (delta values) of BM, whole-body and localized R/h, Xc/h, and PhA, against CK. Whole-body individual bioimpedance vectors were analyzed by the standard reference RXc score graph, according to a healthy Italian reference population [40]. The RXc mean graph was performed to compare the whole-body mean vector of hockey players to the reference population. One and two-sample Hotelling’s T2 tests were used to determine the BIA vector differences between checkpoints and between hockey players vs. the reference population, respectively. An alpha value of 0.05 for statistical significance was set. IBM SPSS Statistics software v.20 was used for data management and statistical analysis.

3. Results

The BIVA mean graph (Figure 2) showed the mean hockey players’ vector before training shifted to the left and upwards (T2 = 32.2; p = 0.0001), and therefore had a greater PhA, in comparison with the reference population.
Anthropometric, bioelectrical, and CK data changes are reported at Table 2.
A significant decrease (−1.1 ± 0.6%) was recorded between the PRE weight (79.0 ± 9.8 kg) and POST weight (78.1 ± 9.7 kg), regardless of the 1.7 ± 0.4 l of water ingested during training. At POST24H, weight significantly increased to similar values to PRE (79 ± 9.9 kg). The perimeter of the thigh was significantly increased by 1.5 ± 0.4%, and significantly decreased to 59.1 ± 4.5 at POST24H.
The whole-body bioelectrical analysis recorded a significant increase (9.7 ± 5.8%) between R/h PRE (236.8 ± 34.5 Ω) and R/h POST (259.1 ± 34.7 Ω). At POST24H (246.3 ± 30 Ω), the R/h values diminished significantly compared to POST R/h (Figure 3). No significant differences were registered in the kinetics of whole-body Xc/h. In the case of PhA, there was a significant reduction between PRE and POST24H (−5.8 ± 5.0%) but not between PRE and POST or POST and POST24H. The impedance module significantly increased by 9.6 ± 5.7% at POST and decreased by 4.8 ± 3.2% at POST24H.
No significant changes were recorded in R/h in the localized analysis of the rectus femoris muscle. On the other hand, significant changes occurred in Xc/h in each of the three control points used in this study (PRE–to–POST: 38.47 ± 44.7%; POST–to–POST24H: −30.8 ± 24.6%; PRE–to–POST24H: −12.4 ± 12.3%) (Figure 4). In the case of PhA, statistically significant differences were recorded between PRE and POST (48.1 ± 49.2%).
The bioimpedance vector analysis, analyzed together ( R / h X c / h ), showed a significant vector shift in the whole-body analysis in both PRE–to–POST (T2 = 25.7; p = 0.0001) and PRE–to–POST24H (T2 = 14.8; p = 0.0001), but not from POST–to–POST24H (T2 = 12.7; p = 0.1) (Figure 3). Non-significant rectus femoris muscle-localized displacement vectors were recorded (PRE–to–POST: T2 = 6.7, p = 0.2; PRE–to–POST24h: T2 = 7.3, p = 0.1; POST–to–POST24H: T2 = 14.8, p = 0.1) (Figure 4).
The graphical bioelectrical whole-body adaptations are represented by the BIVA score graph from PRE–to–POST (Figure 5a), from POST–to–POST24H (Figure 5b), and from PRE–to–POST24H (Figure 5c).
CK significantly increased from PRE–to–POST (53.4 ± 29.8%), from POST–to–POST24H (34.9 ± 29.5%), and from PRE–to–POST24H (109.2 ± 76.4%). Furthermore, CK was correlated with R/h localized at the rectus femoris muscle in all the cases (Figure 6): PRE–to–POST: r = 0.75, p = 0.05; PRE–to–POST24H = 0.81, p = 0.03; POST–to–POST24H: r = 0.82, p = 0.02. No correlation was found between Xc/h, Z/h, or PhA with respect to CK.

4. Discussion

The present study showed that professional rink hockey players experienced a significant vector displacement after an intense training session and during the recovery period due to physiological adaptations, that was detected by whole-body and localized BIVA. The changes produced in the bioimpedance vector were different for the whole-body analysis than for the rectus femoris localized analysis. While the whole-body BIVA provides more focused information on hydration status, muscle-localized BIVA seems to be more appropriate for the analysis of cellular integrity.
In addition, we reported a correlation between the variation of the localized resistance in the rectus femoris muscle with the variation of CK, which is considered as a muscle damage marker. This novel correlation could help trainers to assess an optimal training load without the need to extract blood to obtain internal information.

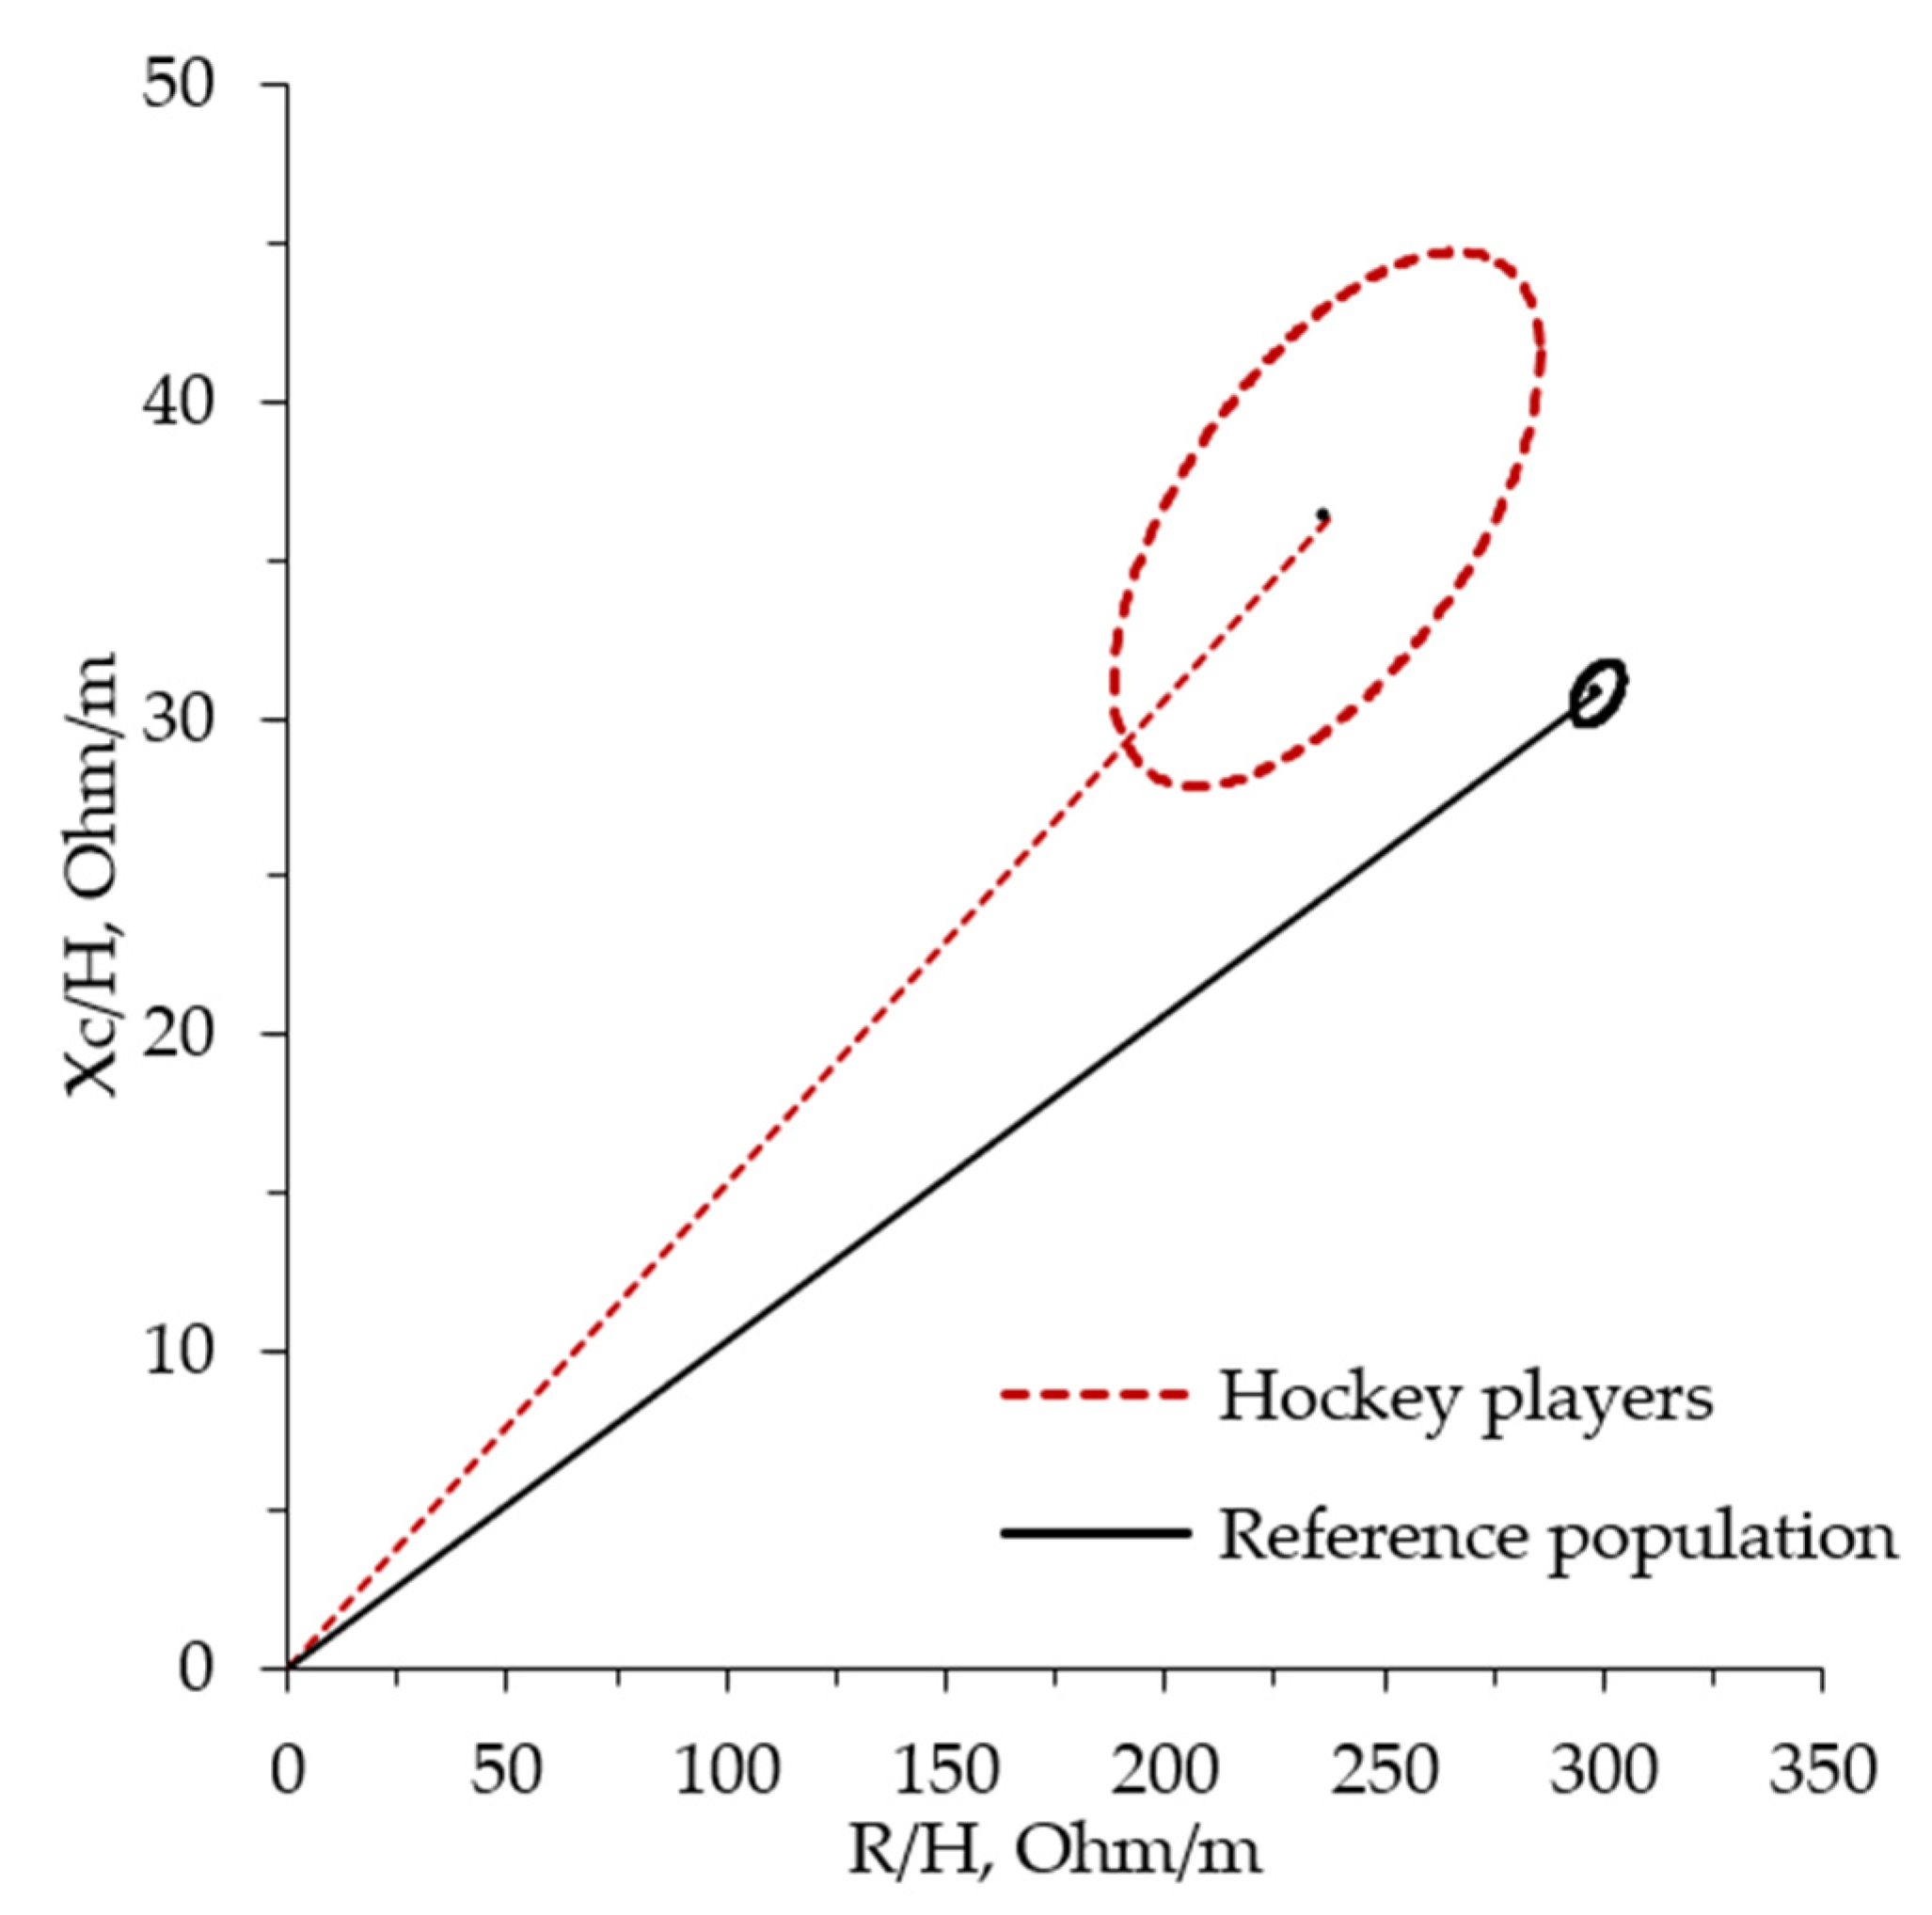
4.1. Bioelectrical Patterns in the Rink Hockey Players

The BIVA score graph (Figure 5) showed that the hockey players’ vector fell mostly outside the 75% tolerance ellipse in all three checkpoints and occupied a position more to the left of the major axis compared with the reference population. This location in the graph indicated a higher density of body cell mass than the reference population. Furthermore, the location of the subjects outside the 75% tolerance ellipse could mean an abnormal hydration state; however, no analysis was carried out before, during, or after the intervention to check the actual state of hydration. Castizo et al. [41] also plotted a group of triathletes outside the 50% of the tolerance ellipse in comparison with a healthy adult reference population [40]; however, in this case, urine testing was performed before training that showed the subjects were in a normal state of hydration. These results could indicate that the distribution of body fluids in athletes differs from that of the reference population, for example, through a higher concentration of intracellular water [42] due to the hypertrophy of muscle fibers [17].
The BIVA mean graph was also shifted to the left and upwards in comparison with the reference population (Figure 2), similar to other studies with athletes of different sports [17,41,43,44,45]; thus, this fact could provide information about the performance level of the athletes based on the position of the vector.

4.2. Anthropometrical Changes Evoked by Training

As was expected, a significant decrease in BM was recorded pre and post-training (−1.1 ± 0.6%) due to the overall dehydration induced by the training session, despite the fact that players were hydrating (+1.7 ± 0.4 l) during the training session. The record of the BM loss was similar to that of other team sports [46].
The changes of hydration status may suppose variations in the RXc score graph, since the fluid loss leads the body to become less conductive; therefore, a greater resistance to the electrical current it is to be expected [47,48]. However, single bioelectrical assessments obtained by BIVA do not currently allow one to identify the type and magnitude of fluid loss, probably because the range of “normal hydration” comprised by the ellipses is wider than a hydration status/change considered as “dehydration” through other methodologies [41,48]. Therefore, the appropriate analysis of the hydration status in athletes with BIVA should be through the analysis of the vector length changes with a series of assessments. Twenty-four hours after the training session was completed, the players returned to their initial BM values.
There was a significant increase of 1.5 ± 0.4% in the perimeter of the thigh at the end of the training, due to the alteration of the intracellular and extracellular water balance induced by increased vascular permeability that produced a muscle swelling [49]. Similar to BM, the perimeter of the thigh returned to the initial values at POST24H.

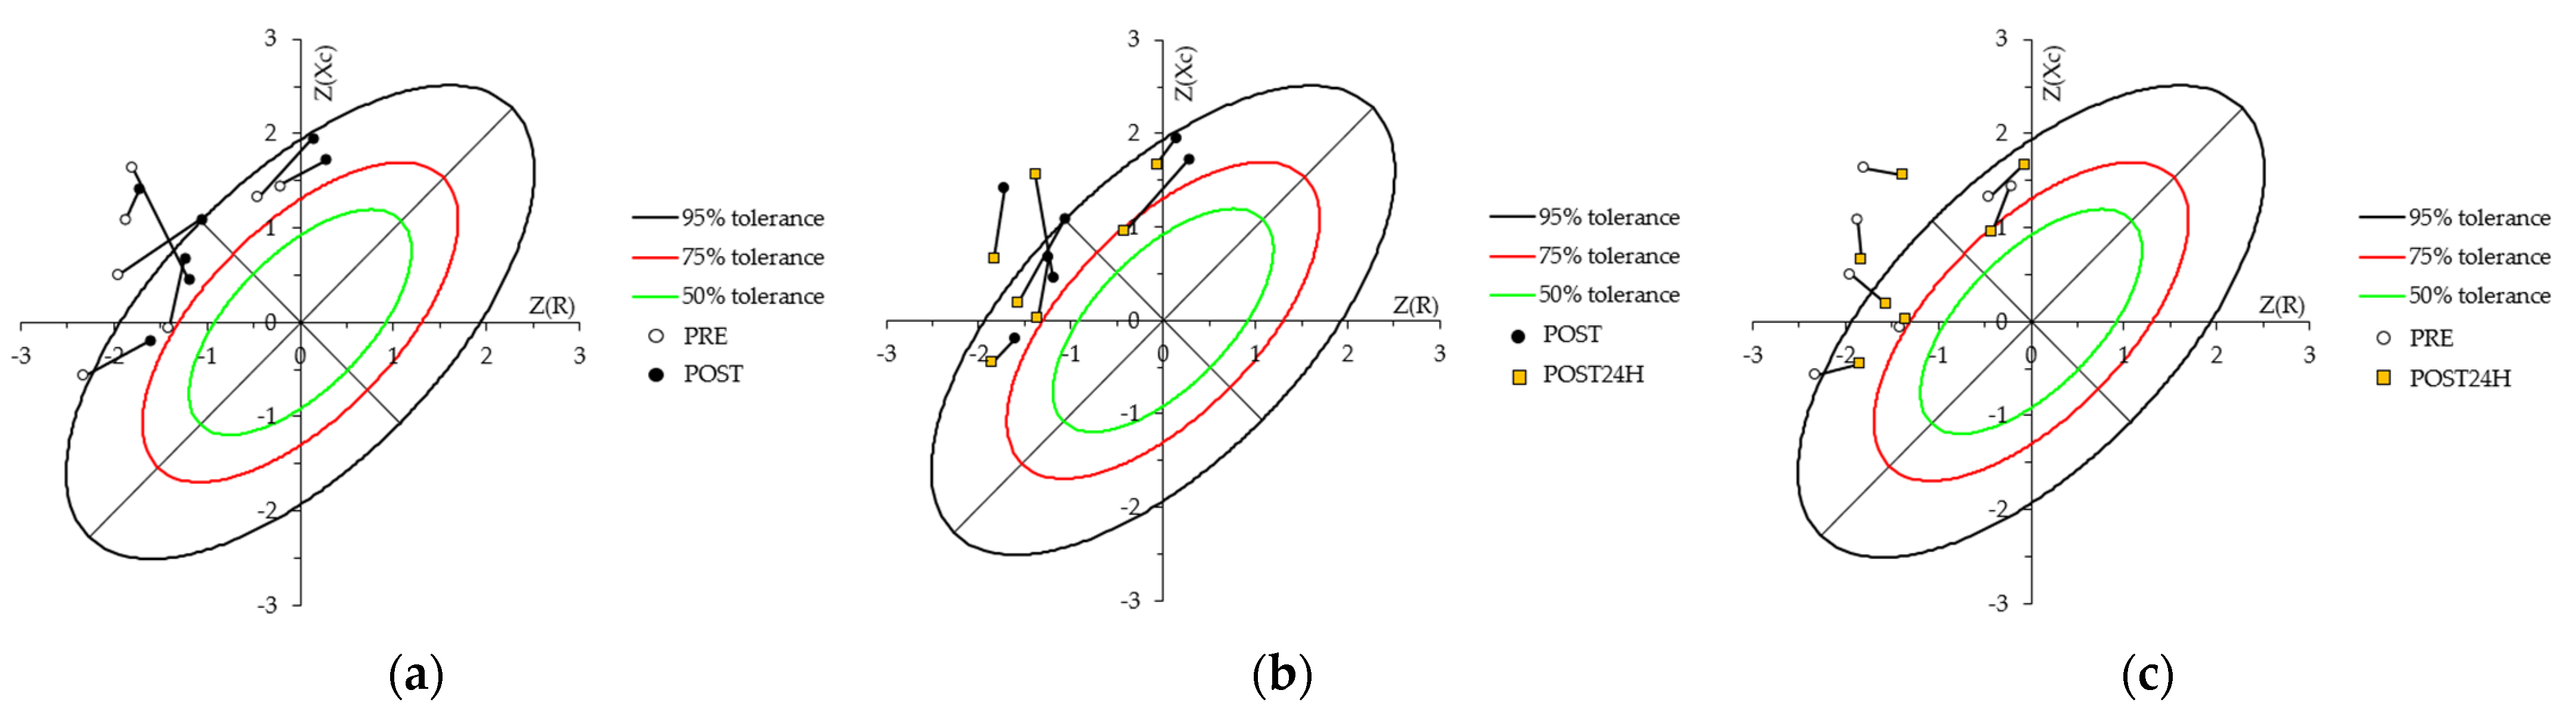
4.3. Whole-Body Bioelectrical Changes Evoked by Training

Several studies analyzing whole-body BIVA show same impedance patterns as in the present study, reporting an increase in R/h and Xc/h parameters, as well as a vector migration along the major axis induced by short-term physical exercise [41,43,48,50]. The increase in R/h can be easily explained by the body fluid loss previously mentioned, since R is the opposition of the conductor to the current flow [41]. The loss of body fluid triggers a decrease in BM and a decrease in the percentage of total amount of body water.
Contrary to R/h, the changes of Xc/h were not significant, although a similar tendency of the kinetic of this parameter to other studies was clearly seen [41,43], increasing at POST and decreasing at the recovery period (POST24H). However, the kinetic of Xc is not as easy to explain, and Castizo-Olier and Carrasco-Marginet in the book of Marini and Toselli [51] indicated that the variation of this parameter may be produced as a consequence of two different but related cellular adaptations. The first is fluid shifts between intracellular and extracellular compartments. Regarding this topic, Gatterer et al. [50] observed that changes in Xc/h were negatively related to plasma osmolarity changes; therefore, lower intracellular fluid losses mean greater plasma osmolality increases. The second is modifications in cell size affecting dielectric mass (cell membrane and tissue interfaces), as physical exercise generates acute processes that modify the characteristics of muscle cells, as the cell membrane becomes thinner, the cell swells, and capacitance increases, and the opposite happens as the cell shrinks, thus affecting Xc [41]. However, this kinetic needs to be studied further since multiple factors may affect Xc changes after performing exercise [13] and, as we previously mentioned, BIVA at 50 kHz does not penetrate inside the membrane cell and non-intracellular information is obtained [41]. Furthermore, as shown in Figure 5, six of the subjects reported the same pattern throughout the intervention; however, there was one subject for which the Xc/h kinetic was different from the rest at POST. There is not enough information to determine what happened to this specific subject, since he followed the same protocol and the same training session as the rest of the analyzed subjects.
A significant increase in the vector length (9.6 ± 5.7%) was observed, which, according to the body weight change, confirmed a loss of fluid since the length of the vector is inversely related to total body water (TBW) [32]. In fact, Campa et al. [52] reported that subjects who realized a cycling test to exhaustion on a cycle ergometer without dehydration through drinking during the training did not have a significantly altered vector length, as opposed to those who did not drink and became dehydrated. Furthermore, the cyclists in a state of dehydration had a worse performance, since hypohydration states attenuate strength by approximately 2% and power by approximately 3% [53].
At POST24, R/h significantly decreased by 4.8 ± 3.1%, a fact that, in conjunction with the recovery of body weight and the shortening of the length vector (−4.8 ± 3.2%), indicated that the players were not dehydrated anymore and had recovered the fluid lost during training. Still, there were no significant changes regarding Xc/h at POST24H. However, regarding PRE, the direction of the vector changed since there was a significant difference between the PRE and POST24H PhA; hence, it was supposed that the ICW/ECW ratio had changed. In the sports field, a decrease in PhA can mean conditions of fatigue [54] or cell damage [20,21,22,23,24], thus this information could help physical trainers to assess the workload in their players.

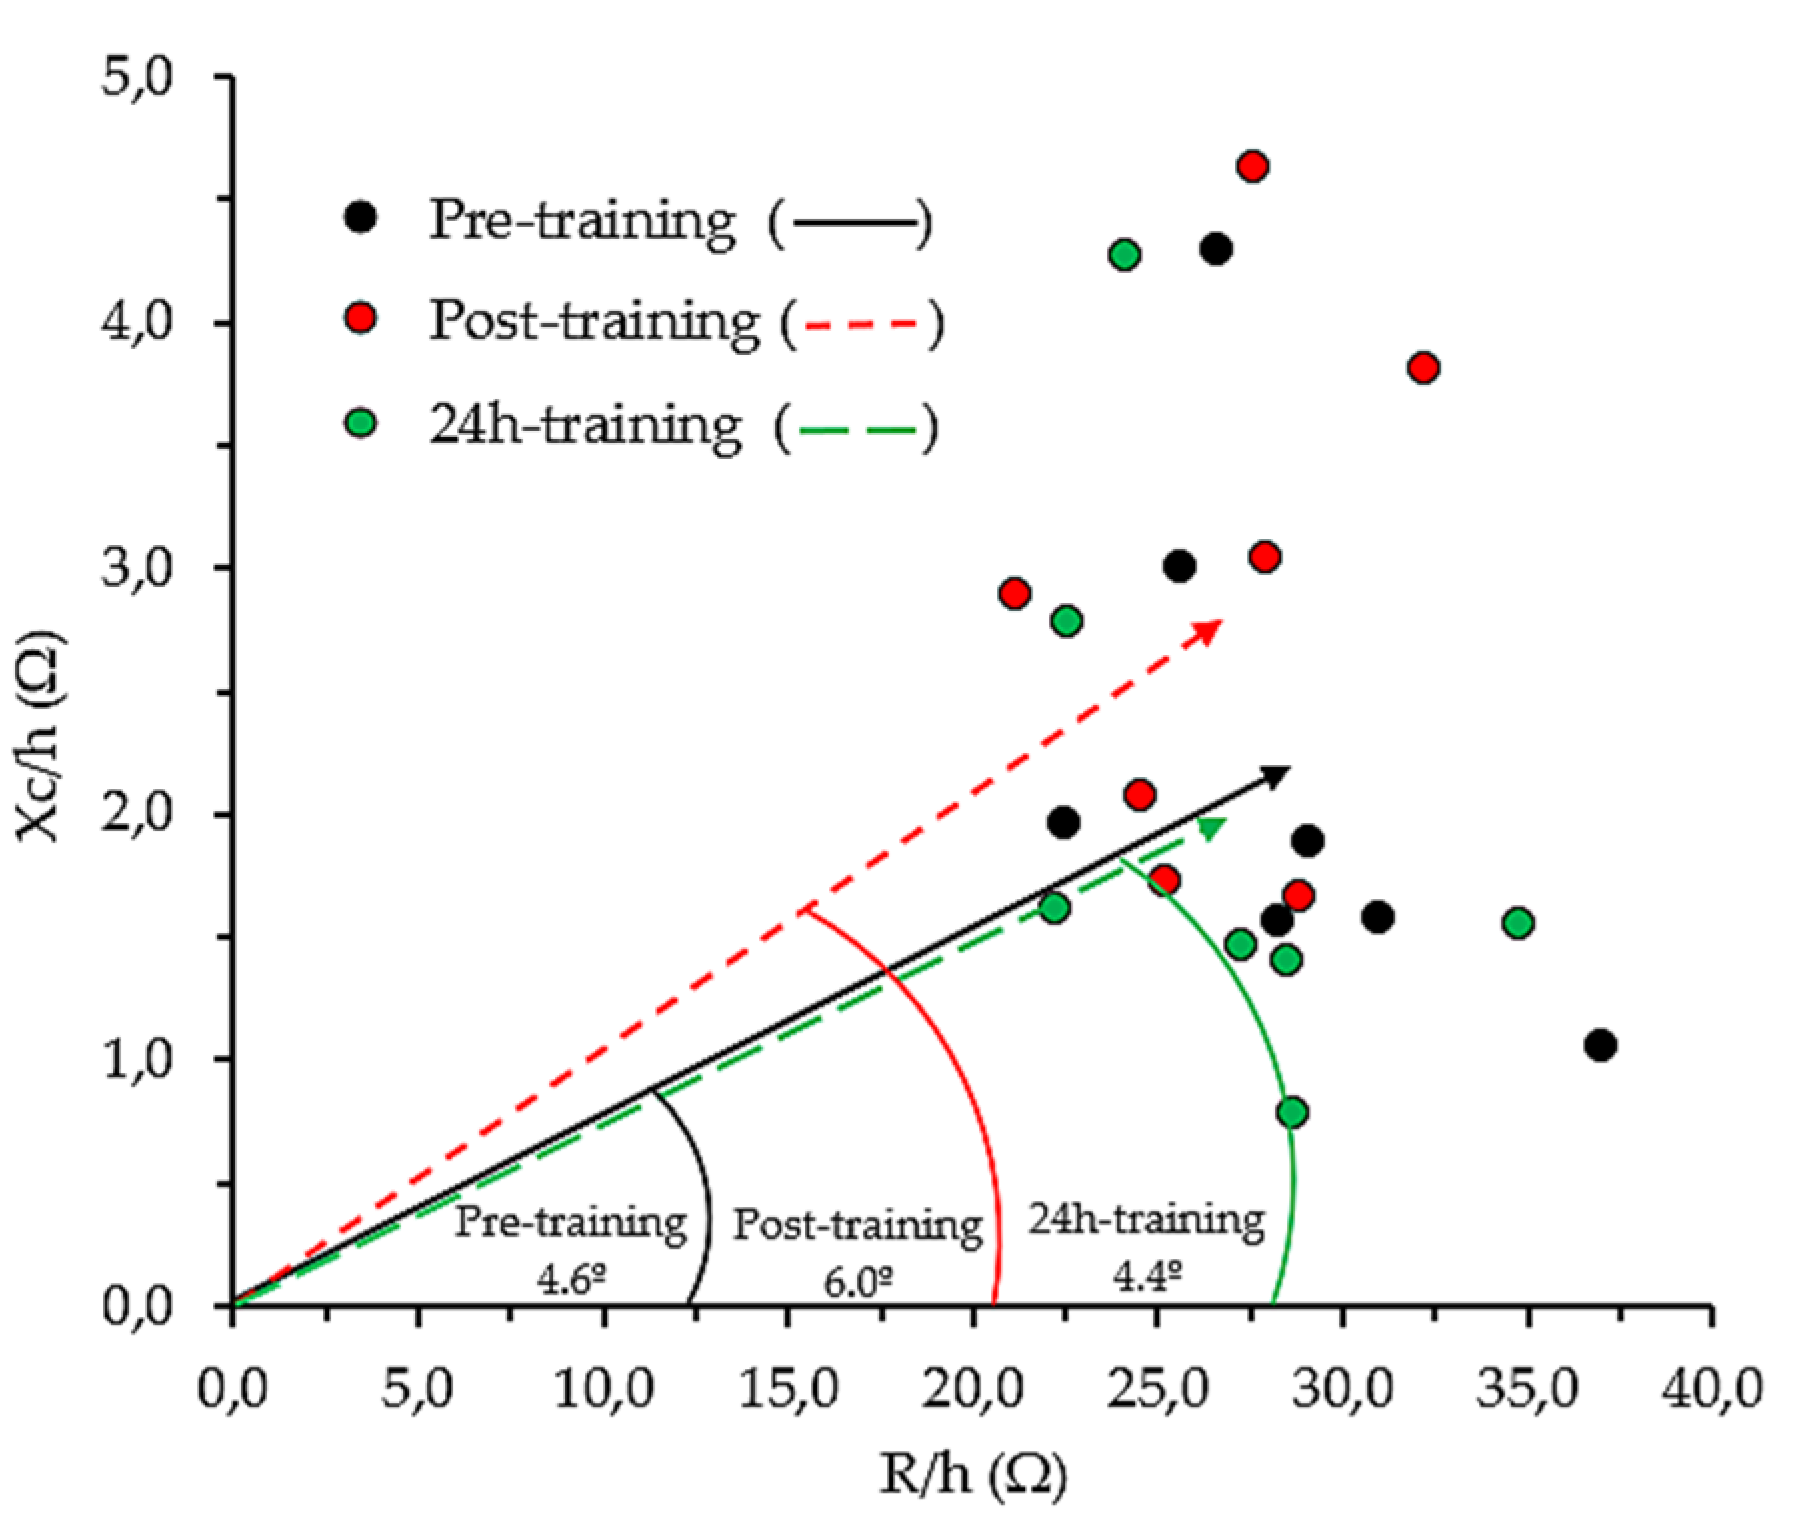
4.4. Localized Bioelectrical Changes Evoked by Training

There were important pattern differences in the impedance vector changes analyzed in the rectus femoris muscle compared to those of the whole-body. To date, the studies analyzing muscle-localized BIVA short-term changes are completely different from the present study, and they analyze the impedance behavior in the biceps brachii during a fatiguing protocol exercise with resistances [55,56,57,58]; thus, there are no localized BIVA assessment studies focused on short-term adaptations in team sports training. This matter is important since the nature of the exercise is different and the muscle impedance adaptations can also be different; therefore, this should be considered when making comparisons.
According to muscle-localized BIVA studies, the kinetic of R is expected to decrease at the end of the training. Freeborn et al. [58] attributes three main reasons to explain this phenomenon: an increase in muscle blood flow, an increase in vasodilation, and an increase in muscular electrical conductivity due to an increase in metabolites. In this study, an increase in R/h was also reported; however, these differences were not significant despite the fact that a clear tendency was observed. Another matter of interest was the possible correlation between R/h and muscle swelling, since muscle swelling is mainly due to fluid accumulation in the region and reduces the tissue resistance [57]. Freeborn et al. [58] reported significant impedance adaptations, both in R and Xc, at the maximum muscle swelling post-training. In the present study, such a correlation was not found, since non-significant adaptations were registered for localized R/h. A possible explanation for this lack of significance was that the fluid accumulation in the thigh was not as pronounced as that produced by resistance training. Additionally, a slight dehydration of the entire body renders R/h as a less appropriate parameter for evaluating the adaptations of this type of training exercise.
The Xc/h PRE–to–POST changes reported a significant increase (38.7 ± 44.7%), which was surprising since these results do not match with most previous localized-muscle studies [56,57,58]. The kinetic of Xc has yet to be clarified; however, it seems clear that is related to cell integrity, as it is not only altered as a consequence of muscle damage produced by strenuous exercise, but also when an injury occurs. In this regard, several studies show that the more severe the muscle injury is, the greater the reduction in the reactance component, which returns progressively to its pre-injury values while the subject recovers from the injury [20,21,22,23,24]. At POST24H, Xc/h significantly decreased beyond PRE-values, which could imply that muscles were not yet fully recovered. The characteristics of the sample, the type of training load, the assessment conditions, and the total workout time could have influenced these values. A possible hypothesis for this fact is related to cell adaptations, since after the dehydration produced by exercise, the main effect of losing extracellular fluid is to expel water from the interior of the cell such that the membrane thickens and the capacitance decreases, thus increasing Xc. In contrary to the aforementioned localized BIVA studies on biceps [55,56,57,58], there were no dehydration processes and the type of exercise promoted the accumulation of fluids in the exercised muscles, and the reverse mechanism could have occurred, hence the increasing Xc. This hypothesis cannot be demonstrated in the present paper as we lack the information on the adaptations occurring at intracellular level; thus, future studies could be targeted to this topic. Li et al. [59] analyzed the impedance impact of botulinum toxin injections on spastic muscles and reported a significant decrease in resistance, while no change was reported for reactance. This finding may suggest that localized muscle fluids do not necessarily modify reactance as occurs with resistance, and it is actually the biological tissue modifications (due to an injury or training) that cause this response.
The length of the vector decreased non-significantly, which means that the hydration status at thigh did not experience any great modification—at the extracellular level at least—as was expected since R/h also did not significantly change. However, the direction of the vector did change since PhA significantly increased by 48.1 ± 49.2% at POST. Regarding POST24H, there was a clear tendency of decrease; however, it did not become significant. The possible explanations for the behavior at POST were not consistent with the current knowledge and further study should be carried out. PhA in the sport field has become a promising tool to assess muscle quality and quantity, since an increase in PhA is associated with more active or younger subjects [51]; however, none of these studies analyze PhA through ML-BIVA after a sport team training, and the only study that analyze PhA through muscle-localized bioimpedance reported a significant reduction in PhA after a fatiguing exercise of different sets of bicep curls with repetition until task failure [57], thus neither the type of training nor the results are similar. These authors declared that monitoring R and Xc independently could provide more insights in relation to exercise.

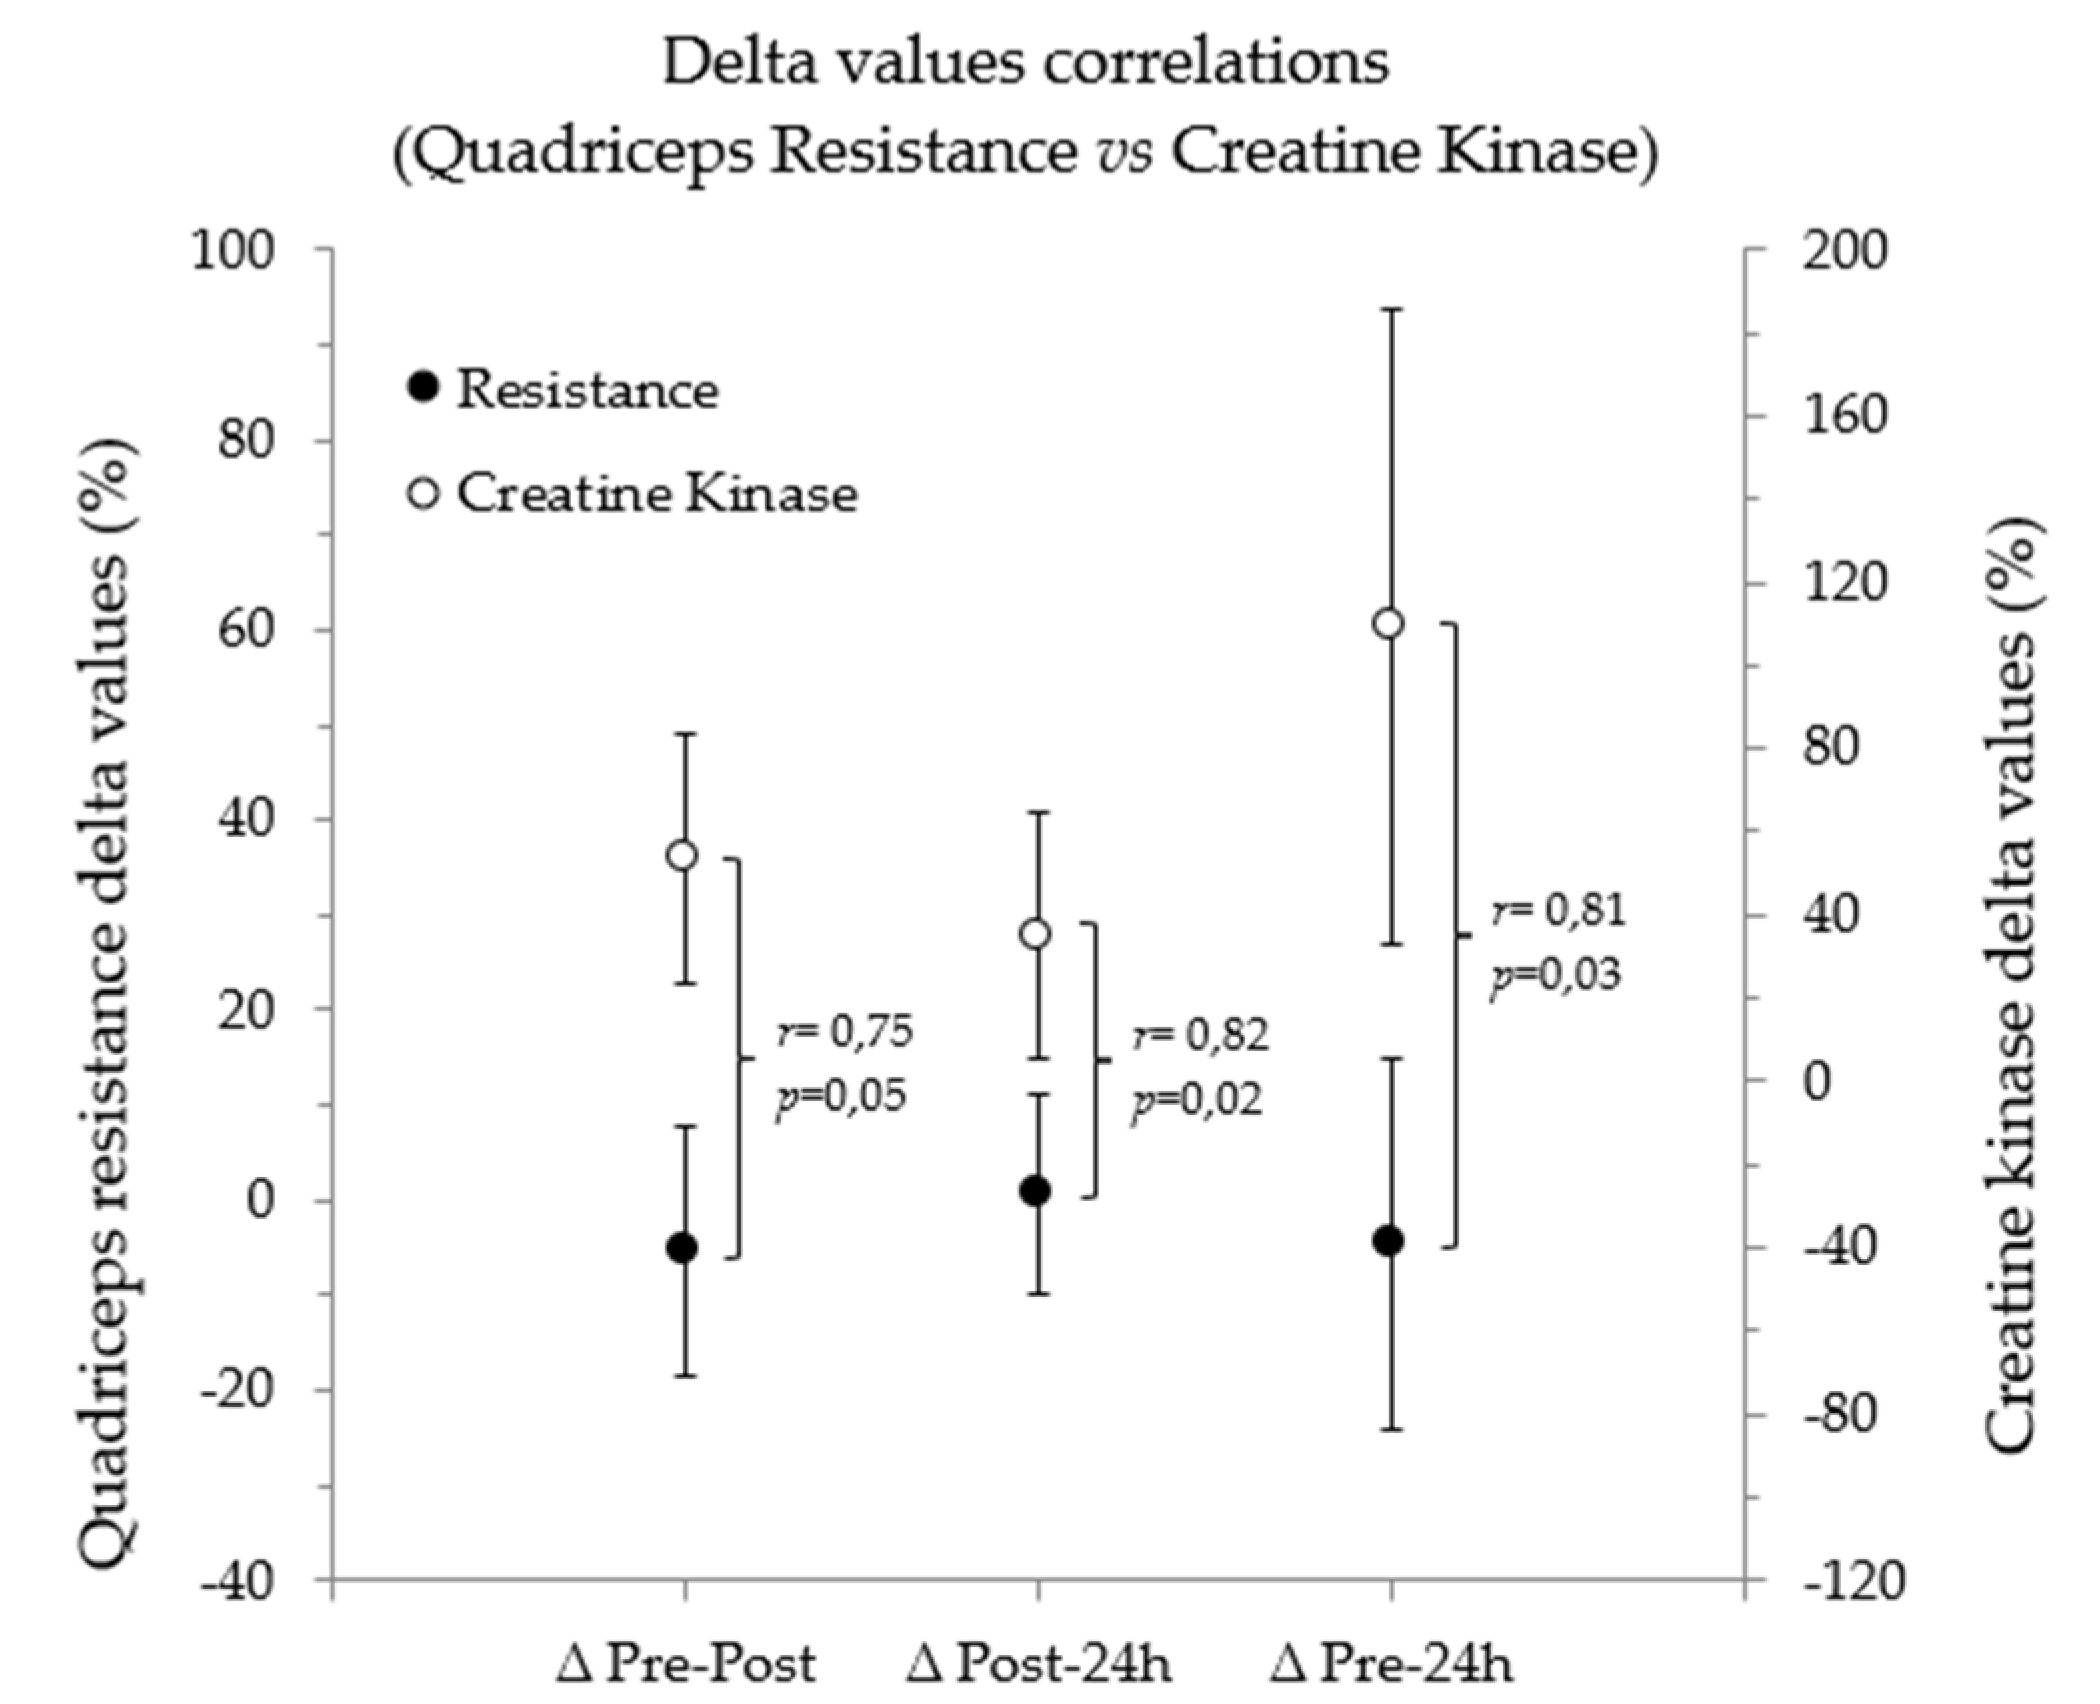
4.5. Relationship between BIA Vector Changes and CK

As shown in Figure 6, there was a high correlation between the kinetic of the CK and the kinetic of muscle-localized R/h, which opens a new line of pioneering research in sports science.
Regarding CK, not only was there a significant increment at POST (53.4 ± 29%), but also at POST24H compared to POST (34.9 ± 29.5%) and to PRE (109.2 ± 76.4%), which would indicate that the muscles were not fully recovered and that the levels of CK were still increasing during the 24 h after the training ended, as seen in other studies [7].
A possible explanation for this correlation may be that the intracellular water is expelled from the inside of the cell due to the muscle damage caused by training, which would cause an increase in extracellular water and a reduction in the localized resistance, while the levels of CK in the blood increase during the high-intensity exercise.
However, it is important to be cautious with this correlation since, as was previously mentioned, the muscle-localized R/h changes were not significant. Therefore, we must ask ourselves to what extent the correlation between a significant change and a non-significant change is reliable. It could be possible in the case of athletes who were more sensitive to CK than R/h adaptations.
No correlation with localized reactance was obtained, which is surprising considering it is a parameter related to cell integrity that is affected by muscle damage and it would have made more sense to have a relation to CK rather than localized resistance.
The lack of studies published in the scientific literature that apply BIVA to assess changes in muscle hydration and CK induced by a training session prevent the present findings from being currently reliable in practice.

5. Limitations of the Study

At the time of assessing BIVA, some factors should be controlled in order to prevent measurement errors and provide accurate and reliable results [13]. This study attempted to control all these factors respecting the ecological design, which also implies certain limitations. For example, the players followed individual uncontrolled POST–to–POST24H recovery strategies (i.e., nutrition, hydration, physical activity, environmental conditions, etc.).
As BIVA at 50 kHz cannot penetrate inside the cell, we did not obtain any intracellular information; thus, some of the hypotheses presented in this study cannot be confirmed by this technique. However, this limitation may open up new lines of research in the future.
A 15-graded RPE scale was used instead of a category-ratio 10-scale (CR10), which could be a limitation as CR10 is commonly adopted for intermittent sports, such as rink hockey, and it might have been more suitable.
The last assessment was made 24 h after finishing the training, and it would have been more appropriate to have made a further assessment at 48 or 72 h, since CK may have still been rising when the last assessment was made.
Another limitation was the fact that the sample size was scarce, which implies the possibility of some bias presentation in the reported results.
Finally, there was also a lack of studies with which to compare the sample regarding rectus femoris muscle-localized assessments. Therefore, our results could not be compared with a reference population since there are no existing data, and the studies cited here to compare our results to used other types of BIVA protocols.

6. Practical Applications and Future Perspectives

The present study opened up some hypotheses that could not be answered using this method. For example, what causes the kinetic of Xc/h after a team sports training session, or why it seems that CK is correlated with R/h and not with Xc/h.
Despite these hypotheses, and more focused on the real applicability of BIVA in the sports field, we observed how the patterns of change in the whole-body analysis and in the muscle-localized analysis were completely different. On the one hand, whole-body BIVA is especially sensitive to changes in body hydration, which is important in high performance since a significant loss of body water means lower performance. On the other hand, the strength of ML-BIVA lies in the information that it provides on muscle cellular health and integrity, although the kinetics of some parameters are unclear and need to be further studied. The correlation between R/h and CK could help physical trainers to control training load, for example, by establishing thresholds that could determine the intra-session intensity.
Regarding whole-body BIVA protocols, the foot-to-hand tetrapolar technique at 50 kHz is commonly used. However, with muscle-localized BIVA it is not clear where the electrodes should be placed on each muscle, and it is imperative to standardize a protocol. For this reason, we propose to follow the SENIAM project guidelines [39], that were designed initially for surface electromyography but can also be used in ML-BIVA.
In the present study, we only analyzed the bioelectrical values of the right thigh; however, it may also be interesting for future studies to address the possibility of analyzing both thighs and checking the possible differences between them, such that ML-BIVA could also become a method to assess asymmetries, as was shown by Stagi et al. [60] with segmental specific BIVA.
Finally, the muscle-localized data were normalized by the subject’s height, because this is the predominant method in the current ML-BIVA studies; however, we believe that normalizing by muscle length would be more appropriate, as was executed by Mascherini et al. [61].

7. Conclusions

Despite the need for further research, the bioimpedance vector analysis based on variables of direct measurement, such as the resistance, reactance, or phase angle, emerges as a sensitive method to discriminate the adaptations in body water and cellular integrity induced by a high-intensity training session in professional rink hockey players.
Whole-body BIVA is more sensitive to body composition changes, while ML-BIVA may be a good method to control training load due to the correlation reported between CK and the significant Xc/h changes at all checkpoints.
The presented results suggest that BIVA may be a powerful tool in the exercise and sports field and could help trainers to optimize training and obtain information about body status and the body adaptations that are produced by exercise.

Supplementary Materials

The following are available online at https://www.mdpi.com/article/10.3390/app12020751/s1, Details of the high-intensity training session.

Author Contributions

Conceptualization, Á.C.-P., A.I. and M.C.-M.; methodology, Á.C.-P., A.I. and J.C.-O.; data curation, Á.C.-P. and M.C.-M.; formal analysis, Á.C.-P., M.C.-F. and N.S.-P.; investigation, Á.C.-P., A.I., M.V.G.-C. and J.C.-O.; writing-original draft preparation, Á.C.-P.; writing-review and editing: A.I., J.C.-O., M.C.-F. and M.V.G.-C.; supervision: A.I., M.C.-M. and N.S.-P. All authors have read and agreed to the published version of the manuscript.

Funding

Á.C.-P. is a pre-doctoral researcher supported by a grant within the field of physical education, physical activity, and sports and its applied sciences given to the National Institute of Physical Education of Catalonia (INEFC), University of Barcelona (UB) (2019 PINEFC 00001). The funders had no role in the design of the study; in the collection, analyses, or interpretation of data; in the writing of the manuscript, or in the decision to publish the results.

Institutional Review Board Statement

The study was conducted in accordance with the Declaration of Helsinki, and approved by the Ethics Committee for Clinical Sport Research of Catalonia (Ethical Approval Code: 19/CEICGC/2020).

Informed Consent Statement

Informed consent was obtained from all subjects involved in the study.

Data Availability Statement

All data generated analyzed during the current study are available from the corresponding author on reasonable request.

Conflicts of Interest

The authors declare no conflict of interest.

References

  1. World Skate Rink Hockey Technical Comission—Official Regulation. Available online: http://www.worldskate.org/rink-hockey/about/regulations.html (accessed on 26 November 2021).
  2. Ferraz, A.; Valente-Dos-santos, J.; Sarmento, H.; Duarte-Mendes, P.; Travassos, B. A Review of Players’ Characterization and Game Performance on Male Rink-Hockey. Int. J. Environ. Res. Public Health 2020, 17, 4259. [Google Scholar] [CrossRef] [PubMed]
  3. Yagüe Ares, P.L. Hockey Sobre Patines: Estudio de Las Demandas Fisiológicas en Competición, Análisis del Perfil Fisiológico Funcional, Desarrollo y Validación de un Modelo de Valoración Funcional Específica Orientado Al Jugador de Campo; University of Oviedo: Asturias, Spain, 2005. [Google Scholar]
  4. Hernández Mendo, A.; Anguera Argilaga, M.T. Behavioral Structure in Sociomotor Sports: Roller-Hockey. Qual. Quant. 2002, 36, 347–378. [Google Scholar] [CrossRef]
  5. Barranco, T.; Tvarijonaviciute, A.; Tecles, F.; Carrillo, J.M.; Sánchez-Resalt, C.; Jimenez-Reyes, P.; Rubio, M.; García-Balletbó, M.; Cerón, J.J.; Cugat, R. Changes in Creatine Kinase, Lactate Dehydrogenase and Aspartate Aminotransferase in Saliva Samples after an Intense Exercise: A Pilot Study. J. Sports Med. Phys. Fit. 2018, 58, 910–916. [Google Scholar] [CrossRef] [PubMed]
  6. Brancaccio, P.; Maffulli, N.; Limongelli, F.M. Creatine Kinase Monitoring in Sport Medicine. Br. Med. Bull. 2007, 81–82, 209–230. [Google Scholar] [CrossRef]
  7. Baird, M.F.; Graham, S.M.; Baker, J.S.; Bickerstaff, G.F. Creatine-Kinase- and Exercise-Related Muscle Damage Implications for Muscle Performance and Recovery. J. Nutr. Metab. 2012, 2012, 960363. [Google Scholar] [CrossRef] [PubMed] [Green Version]
  8. Silva, J.R.; Rumpf, M.C.; Hertzog, M.; Castagna, C.; Farooq, A.; Girard, O.; Hader, K. Acute and Residual Soccer Match-Related Fatigue: A Systematic Review and Meta-Analysis. Sport. Med. 2018, 48, 539–583. [Google Scholar] [CrossRef]
  9. Koutedakis, Y.; Raafat, A.; Sharp, N.C.; Rosmarin, M.N.; Beard, M.J.; Robbins, S.W. Serum Enzyme Activities in Individuals with Different Levels of Physical Fitness. J. Sports Med. Phys. Fit. 1993, 33, 252–257. [Google Scholar]
  10. Kim, J.; Lee, J. The Relationship of Creatine Kinase Variability with Body Composition and Muscle Damage Markers Following Eccentric Muscle Contractions. J. Exerc. Nutr. Biochem. 2015, 19, 123–129. [Google Scholar] [CrossRef] [PubMed] [Green Version]
  11. Kyle, U.G.; Bosaeus, I.; De Lorenzo, A.D.; Deurenberg, P.; Elia, M.; Gómez, J.M.; Heitmann, B.L.; Kent-Smith, L.; Melchior, J.C.; Pirlich, M.; et al. Bioelectrical Impedance Analysis—Part I: Review of Principles and Methods. Clin. Nutr. 2004, 23, 1226–1243. [Google Scholar] [CrossRef]
  12. Kyle, U.G.; Bosaeus, I.; De Lorenzo, A.D.; Deurenberg, P.; Elia, M.; Gómez, J.M.; Heitmann, B.L.; Kent-Smith, L.; Melchior, J.C.; Pirlich, M.; et al. Bioelectrical Impedance Analysis—Part II: Utilization in Clinical Practice. Clin. Nutr. 2004, 23, 1430–1453. [Google Scholar] [CrossRef] [PubMed]
  13. Castizo-Olier, J.; Irurtia, A.; Jemni, M.; Carrasco-Marginet, M.; Fernández-García, R.; Rodríguez, F.A. Bioelectrical Impedance Vector Analysis (BIVA) in Sport and Exercise: Systematic Review and Future Perspectives. PLoS ONE 2018, 13, e0197957. [Google Scholar] [CrossRef]
  14. Norman, K.; Stobäus, N.; Pirlich, M.; Bosy-Westphal, A. Bioelectrical Phase Angle and Impedance Vector Analysis—Clinical Relevance and Applicability of Impedance Parameters. Clin. Nutr. 2012, 31, 854–861. [Google Scholar] [CrossRef]
  15. Moon, J.R. Body Composition in Athletes and Sports Nutrition: An Examination of the Bioimpedance Analysis Technique. Eur. J. Clin. Nutr. 2013, 67, S54–S59. [Google Scholar] [CrossRef] [PubMed] [Green Version]
  16. Campa, F.; Toselli, S.; Mazzilli, M.; Gobbo, L.A.; Coratella, G. Assessment of Body Composition in Athletes: A Narrative Review of Available Methods with Special Reference to Quantitative and Qualitative Bioimpedance Analysis. Nutrients 2021, 13, 1620. [Google Scholar] [CrossRef]
  17. Micheli, M.L.; Pagani, L.; Marella, M.; Gulisano, M.; Piccoli, A.; Angelini, F.; Burtscher, M.; Gatterer, H. Bioimpedance and Impedance Vector Patterns as Predictors of League Level in Male Soccer Players. Int. J. Sports Physiol. Perform. 2014, 9, 532–539. [Google Scholar] [CrossRef] [PubMed]
  18. Sanchez, B.; Rutkove, S.B. Present Uses, Future Applications, and Technical Underpinnings of Electrical Impedance Myography. Curr. Neurol. Neurosci. Rep. 2017, 17, 86. [Google Scholar] [CrossRef]
  19. Cebrián-Ponce, Á.; Irurtia, A.; Carrasco-Marginet, M.; Saco-Ledo, G.; Girabent-Farrés, M.; Castizo-Olier, J. Electrical Impedance Myography in Health and Physical Exercise: A Systematic Review and Future Perspectives. Front. Physiol. 2021, 12, 740877. [Google Scholar] [CrossRef]
  20. Nescolarde, L.; Yanguas, J.; Lukaski, H.; Alomar, X.; Rosell-Ferrer, J.; Rodas, G. Localized Bioimpedance to Assess Muscle Injury. Physiol. Meas. 2013, 34, 237–245. [Google Scholar] [CrossRef]
  21. Nescolarde, L.; Yanguas, J.; Lukaski, H.; Alomar, X.; Rosell-Ferrer, J.; Rodas, G. Effects of Muscle Injury Severity on Localized Bioimpedance Measurements. Physiol. Meas. 2015, 36, 27–42. [Google Scholar] [CrossRef]
  22. Nescolarde, L.; Yanguas, J.; Terricabras, J.; Lukaski, H.; Alomar, X.; Rosell-Ferrer, J.; Rodas, G. Detection of Muscle Gap by L-BIA in Muscle Injuries: Clinical Prognosis. Physiol. Meas. 2017, 38, L1–L9. [Google Scholar] [CrossRef] [PubMed]
  23. Nescolarde, L.; Terricabras, J.; Mechó, S.; Rodas, G.; Yanguas, J. Differentiation Between Tendinous, Myotendinous and Myofascial Injuries by L-BIA in Professional Football Players. Front. Physiol. 2020, 11, 574124. [Google Scholar] [CrossRef] [PubMed]
  24. Francavilla, V.C.; Bongiovanni, T.; Genovesi, F.; Minafra, P.; Francavilla, G. Localized Bioelectrical Impedance Analysis: How Useful Is It in the Folow-up of Muscle Injury? A Case Report. Med. Sport 2015, 68, 323–334. [Google Scholar]
  25. Silvestre, R.; West, C.; Maresh, C.M.; Kraemer, W.J. Body Composition and Physical Performance in Men’s Soccer: A Study of a National Collegiate Athletic Association Division I Team. J. Strength Cond. Res. 2006, 20, 177–183. [Google Scholar] [CrossRef]
  26. Cian, C.; Barraud, P.A.; Melin, B.; Raphel, C. Effects of Fluid Ingestion on Cognitive Function after Heat Stress or Exercise-Induced Dehydration. Int. J. Psychophysiol. 2001, 42, 243–251. [Google Scholar] [CrossRef]
  27. Maughan, R.J. Impact of Mild Dehydration on Wellness and on Exercise Performance. Eur. J. Clin. Nutr. 2003, 57, S19–S23. [Google Scholar] [CrossRef] [PubMed] [Green Version]
  28. Oppliger, R.A.; Bartok, C. Hydration Testing of Athletes. Sport. Med. 2002, 32, 959–971. [Google Scholar] [CrossRef] [PubMed]
  29. Nescolarde, L.; Roca, E.; Bogónez-Franco, P.; Hernández-Hermoso, J.; Bayes-Genis, A.; Ara, J. Relationship Between Bioimpedance Vector Displacement and Renal Function After a Marathon in Non-Elite Runners. Front. Physiol. 2020, 11, 352. [Google Scholar] [CrossRef]
  30. Armstrong, L.E. Assessing Hydration Status: The Elusive Gold Standard. J. Am. Coll. Nutr. 2007, 26, 575S–584S. [Google Scholar] [CrossRef] [PubMed]
  31. McGarvey, J.; Thompson, J.; Hanna, C.; Noakes, T.D.; Stewart, J.; Speedy, D. Sensitivity and Specificity of Clinical Signs for Assessment of Dehydration in Endurance Athletes. Br. J. Sports Med. 2010, 44, 716–719. [Google Scholar] [CrossRef]
  32. Lukaski, H.C.; Piccoli, A. Bioelectrical Impedance Vector Analysis for Assessment of Hydration in Physiological States and Clinical Conditions. In Handbook of Anthropometry: Physical Measures of Human Form in Health and Disease; Springer: Berlin/Heidelberg, Germany, 2012; pp. 287–305. ISBN 9781441917881. [Google Scholar]
  33. World Medical Association. WMA World Medical Association Declaration of Helsinki: Ethical Principles for Medical Research Involving Human Subjects. JAMA 2013, 310, 2191–2194. [Google Scholar] [CrossRef] [Green Version]
  34. Borg, G. Perceived Exertion as an Indicator of Somatic Stress. Scand. J. Rehabil. Med. 1970, 2, 92–98. [Google Scholar] [PubMed]
  35. Marfell-Jones, M.; Esparza-Ros, F.; Vaquero-Cristóbal, R. ISAK Accreditation Handbook; International Society for the Advancement of Kinanthropometry, ISAK: Murcia, Spain, 2019; ISBN 9788416045259. [Google Scholar]
  36. Piccoli, A. Bioelectric Impedance Measurement for Fluid Status Assessment. Fluid Overload 2010, 164, 143–152. [Google Scholar] [CrossRef]
  37. Campa, F.; Gatterer, H.; Lukaski, H.; Toselli, S. Stabilizing Bioimpedance-Vector-Analysis Measures with a 10-Minute Cold Shower after Running Exercise to Enable Assessment of Body Hydration. Int. J. Sports Physiol. Perform. 2019, 14, 1006–1009. [Google Scholar] [CrossRef]
  38. Kushner, R.F.; Gudivaka, R.; Schoeller, D.A. Clinical Characteristics Influencing Bioelectrical Impedance Analysis Measurements. Am. J. Clin. Nutr. 1996, 64, 423S–427S. [Google Scholar] [CrossRef] [Green Version]
  39. Hermens, H.; Freriks, B.; Desselhorst-Klug, C.; Rau, G. Development of Recommendations for SEMG Sensors and Sensor Placement Procedures. J. Electromyogr. Kinesiol. 2000, 10, 361–374. [Google Scholar] [CrossRef]
  40. Piccoli, A.; Nigrelli, S.; Caberlotto, A.; Bottazzo, S.; Rossi, B.; Pillon, L.; Maggiore, Q. Bivariate Normal Values of the Bioelectrical Impedance Vector in Adult and Elderly Populations. Am. J. Clin. Nutr. 1995, 61, 269–270. [Google Scholar] [CrossRef]
  41. Castizo-Olier, J.; Carrasco-Marginet, M.; Roy, A.; Chaverri, D.; Iglesias, X.; Pérez-Chirinos, C.; Rodríguez, F.; Irurtia, A. Bioelectrical Impedance Vector Analysis (BIVA) and Body Mass Changes in an Ultra-Endurance Triathlon Event. J. Sport. Sci. Med. 2018, 17, 571–579. [Google Scholar]
  42. Chertow, G.M.; Lowrie, E.G.; Wilmore, D.W.; Gonzalez, J.; Lew, N.L.; Ling, J.; Leboff, M.S.; Gottlieb, M.N.; Huang, W.; Zebrowski, B.; et al. Nutritional Assessment with Bioelectrical Impedance Analysis in Maintenance Hemodialysis Patients. J. Am. Soc. Nephrol. 1995, 6, 75–81. [Google Scholar] [CrossRef] [PubMed]
  43. Carrasco-Marginet, M.; Castizo-Olier, J.; Rodríguez-Zamora, L.; Iglesias, X.; Rodríguez, F.A.; Chaverri, D.; Brotons, D.; Irurtia, A. Bioelectrical Impedance Vector Analysis (BIVA) for Measuring the Hydration Status in Young Elite Synchronized Swimmers. PLoS ONE 2017, 12, e0178819. [Google Scholar] [CrossRef] [PubMed] [Green Version]
  44. Giorgi, A.; Vicini, M.; Pollastri, L.; Lombardi, E.; Magni, E.; Andreazzoli, A.; Orsini, M.; Bonifazi, M.; Lukaski, H.; Gatterer, H. Bioimpedance Patterns and Bioelectrical Impedance Vector Analysis (BIVA) of Road Cyclists. J. Sports Sci. 2018, 36, 2608–2613. [Google Scholar] [CrossRef] [PubMed]
  45. Campa, F.; Matias, C.; Gatterer, H.; Toselli, S.; Koury, J.C.; Andreoli, A.; Melchiorri, G.; Sardinha, L.B.; Silva, A.M. Classic Bioelectrical Impedance Vector Reference Values for Assessing Body Composition in Male and Female Athletes. Int. J. Environ. Res. Public Health 2019, 16, 5066. [Google Scholar] [CrossRef] [PubMed] [Green Version]
  46. Nuccio, R.P.; Barnes, K.A.; Carter, J.M.; Baker, L.B. Fluid Balance in Team Sport Athletes and the Effect of Hypohydration on Cognitive, Technical, and Physical Performance. Sport. Med. 2017, 47, 1951–1982. [Google Scholar] [CrossRef] [PubMed] [Green Version]
  47. O’Brien, C.; Young, A.J.; Sawka, M.N. Bioelectrical Impedance to Estimate Changes in Hydration Status. Int. J. Sports Med. 2002, 23, 361–366. [Google Scholar] [CrossRef] [PubMed]
  48. Heavens, K.R.; Charkoudian, N.; O’Brien, C.; Kenefick, R.W.; Cheuvront, S.N. Noninvasive Assessment of Extracellular and Intracellular Dehydration in Healthy Humans Using the Resistance-Reactance-Score Graph Method. Am. J. Clin. Nutr. 2016, 103, 724–729. [Google Scholar] [CrossRef] [PubMed] [Green Version]
  49. Hirono, T.; Ikezoe, T.; Taniguchi, M.; Tanaka, H.; Saeki, J.; Yagi, M.; Umehara, J.; Ichihashi, N. Relationship Between Muscle Swelling and Hypertrophy Induced by Resistance Training. J. Strength Cond. Res. 2020. [Google Scholar] [CrossRef]
  50. Gatterer, H.; Schenk, K.; Laninschegg, L.; Schlemmer, P.; Lukaski, H.; Burtscher, M. Bioimpedance Identifies Body Fluid Loss after Exercise in the Heat: A Pilot Study with Body Cooling. PLoS ONE 2014, 9, e109729. [Google Scholar] [CrossRef] [PubMed]
  51. Marini, E.; Toselli, S. Bioelectrical Impedance Analysis of Body Composition-Applications in Sports Science; UNICApress: Cagliari, Italy, 2021; ISBN 9788833120324. [Google Scholar]
  52. Campa, F.; Piras, A.; Raffi, M.; Trofè, A.; Perazzolo, M.; Mascherini, G.; Toselli, S. The Effects of Dehydration on Metabolic and Neuromuscular Functionality during Cycling. Int. J. Environ. Res. Public Health 2020, 17, 1161. [Google Scholar] [CrossRef] [Green Version]
  53. Judelson, D.A.; Maresh, C.M.; Anderson, J.M.; Armstrong, L.E.; Casa, D.J.; Kraemer, W.J.; Volek, J.S. Hydration and Muscular Performance: Does Fluid Balance Affect Strength, Power and High-Intensity Endurance? Sport. Med. 2007, 37, 907–921. [Google Scholar] [CrossRef]
  54. Nabuco, H.C.G.; Silva, A.M.; Sardinha, L.B.; Rodrigues, F.B.; Tomeleri, C.M.; Ravagnani, F.C.P.; Cyrino, E.S.; Ravagnani, C.F.C. Phase Angle Is Moderately Associated with Short-Term Maximal Intensity Efforts in Soccer Players. Int. J. Sports Med. 2019, 40, 739–743. [Google Scholar] [CrossRef]
  55. Li, L.; Shin, H.; Li, X.; Li, S.; Zhou, P. Localized Electrical Impedance Myography of the Biceps Brachii Muscle during Different Levels of Isometric Contraction and Fatigue. Sensors 2016, 16, 581. [Google Scholar] [CrossRef] [Green Version]
  56. Fu, B.; Freeborn, T.J. Biceps Tissue Bioimpedance Changes from Isotonic Exercise-Induced Fatigue at Different Intensities. Biomed. Phys. Eng. Express 2018, 4, 025037. [Google Scholar] [CrossRef]
  57. Freeborn, T.J.; Fu, B. Time-Course Bicep Tissue Bio-Impedance Changes throughout a Fatiguing Exercise Protocol. Med. Eng. Phys. 2019, 69, 109–115. [Google Scholar] [CrossRef] [PubMed]
  58. Freeborn, T.J.; Regard, G.; Fu, B. Localized Bicep Tissue Bioimpedance Alterations Following Eccentric Exercise in Healthy Young Adults. IEEE Access 2020, 8, 23100–23109. [Google Scholar] [CrossRef]
  59. Li, X.; Shin, H.; Li, L.; Magat, E.; Li, S.; Zhou, P. Assessing the Immediate Impact of Botulinum Toxin Injection on Impedance of Spastic Muscle. Med. Eng. Phys. 2017, 43, 97–102. [Google Scholar] [CrossRef] [PubMed] [Green Version]
  60. Stagi, S.; Moroni, A.; Micheletti Cremasco, M.; Marini, E. Body Composition Symmetry in Long-Term Active Middle-Aged and Older Individuals. Int. J. Environ. Res. Public Health 2021, 18, 5956. [Google Scholar] [CrossRef]
  61. Mascherini, G.; Petri, C.; Galanti, G. Integrated Total Body Composition and Localized Fat-Free Mass Assessment. Sport Sci. Health 2015, 11, 217–225. [Google Scholar] [CrossRef]
Figure 1. Rectus femoris muscle-localized BIA electrode placement example for 36 cm between anterosuperior spine and patella.
Applsci 12 00751 g001
Figure 2. RXc mean graph. The 95% confidence ellipses for the mean impedance global vectors of hockey players (dotted line ellipse) and the healthy male reference population (solid line ellipse with vector) obtained from Piccoli et al. [40] are shown.
Applsci 12 00751 g002
Figure 3. Displacement (PRE–POST–POST24H) bioimpedance global vector.
Applsci 12 00751 g003
Figure 4. Displacement (PRE–POST–POST24H) rectus femoris localized bioimpedance vector.
Applsci 12 00751 g004
Figure 5. Individual global vector score values for the RXc score graph with 50%, 75%, and 95% tolerance ellipses of the male healthy reference population [40] plotted for: (a) PRE–to–POST, (b) POST–to–POST24H, and (c) PRE–to–POST24H. Z(R), resistance Z score; Z(Xc), reactance Z score.
Applsci 12 00751 g005
Figure 6. Delta value correlations of rectus femoris-localized BIVA (adjusted by height) and creatine kinase.
Applsci 12 00751 g006
Table 1. Individual values of training session details.
SubjectsHR (b/min)HR Intensity Zones (min and %)Total Session Time (Hours)RPE—15-Point Borg ScaleWater Intake (L)
HRrestHRminHRmeanHRmaxVery LightLightModerateHighVery HighMaximum
(Min–80 b/min)(81–100 b/min)(101–120 b/min)(121–140 b/min)(141–160 b/min)(161–Max b/min)
Hours%Hours%Hours%Hours%Hours%Hours%
161721321890:3019.90:3221.20:2415.90:2717.90:2919.20:096.02:3115.01.40
256711341900:1912.60:4932.50:3523.20:2013.20:1610.60:127.92:3116.01.20
352631291830:1610.70:3322.00:3523.30:2315.30:3020.00:138.72:3015.01.50
456681281900:2215.30:4027.80:2920.10:1913.20:2316.00:117.62:2417.02.25
553611171800:127.90:2717.80:2717.80:3321.70:3523.00:1811.82:3212.02.25
655651221770:106.80:1510.20:2416.30:3624.50:3725.20:2517.02:2713.01.60
758661291840:2013.20:3019.90:3321.90:2415.90:2818.50:1610.62:3115.01.60
Average55.966.6127.3184.70:1812.30:3221.60:2919.80:2617.40:2818.90:1410.02:2914.71.7
SD3.04.05.95.20:064.50:107.10:043.20:064.30:074.70:053.70:021.70.4
HR, heart rate; RPE, rate of perceived exertion.
Table 2. Anthropometric, bioelectrical (whole-body and localized), and CK values of the training session from the seven players analyzed PRE, POST and POST24H.
ANTHROPOMETRIC
PREPOSTPOST24HΔ PRE-to-POST (%)pΔ POST-to-POST24H (%)pΔ PRE-to-POST24H (%)p
BM (kg)79 ± 9.878.1 ± 9.779 ± 9.9−1.1 ± 0.6 *0.021.2 ± 0.8 *0.020.1 ± 0.60.73
P thigh (cm)59 ± 4.459.9 ± 4.459.1 ± 4.51.5 ± 0.4 *0.02−1.4 ± 0.6 *0.020.1 ± 0.30.39
BIOELECTRICAL
PREPOSTPOST24HΔ PRE-to-POST (%)pΔ POST-to-POST24H (%)pΔ PRE-to-POST24H (%)p
WBLOCWBLOCWBLOCWBLOCWBLOCWBLOCWBLOCWBLOCWBLOC
R (Ω)417.5 ± 4850.7 ± 8.2457.2 ± 49.247.4 ± 6.3434.8 ± 4347.6 ± 7.69.7 ± 5.8 *−5.3 ± 130.020.27−4.8 ± 3.1 *0.5 ± 10.50.0214.4 ± 4.9−4.5 ± 19.50.060.4
R/h (Ω/m)236.8 ± 34.528.6 ± 4.6259.1 ± 34.726.8 ± 3.5246.3 ± 3026.9 ± 4.4
Xc (Ω)64.1 ± 10.13.9 ± 2.167.4 ± 8.95 ± 262.8 ± 9.73.5 ± 2.26.1 ± 12.338.7 ± 44.7 *0.240.04−6.2 ± 13.8−30.8 ± 24.6 *0.240.02−1.8 ± 6−12.4 ± 12.3 *0.50.04
Xc/h (Ω/m)36.3 ± 62.2 ± 1.138.1 ± 5.42.8 ± 1.135.5 ± 5.72 ± 1.2
|Z| (m)422.5 ± 48.150.9 ± 8.2462.2 ± 49.547.7 ± 6.4439.3 ± 43.447.8 ± 7.59.6 ± 5.7 *−5.1 ± 130.020.31−4.8 ± 3.2 *0.3 ± 10.40.0214.2 ± 4.8−4.5 ± 19.30.060.4
|Z|/h (Ω/m)239.6 ± 34.628.7 ± 4.5261.9 ± 34.827 ± 3.5248.9 ± 30.327 ± 4.3
PhA (°)8.8 ± 1.34.6 ± 2.68.4 ± 16 ± 2.28.2 ± 14.4 ± 3−2.9 ± 12.848.1 ± 49.2 *0.550.03−1.6 ± 13.5−29.5 ± 29.10.240.06−5.8 ± 5 *−4.4 ± 25.40.041
r (R/h vs. Xc/h)0.61−0.790.570.230.68−0.7---
HEMATOLOGICAL
PREPOSTPOST24HΔ PRE-to-POST (%)pΔ POST-to-POST24H (%)pΔ PRE-to-POST24H (%)p
CK (IU/L)193.3 ± 75.5283.6 ± 84.3381.3 ± 147.753.4 ± 29.8 *0.0234.9 ± 29.5 *0.02109.2 ± 76.4 *0.02
Values are mean ± SD; BM, body mass; CK, creatine kinase; LOC, localized; P, perimeter; PhA, phase angle; POST, assessment after finishing the training session; POST24H, assessment 24 h after finishing the training session; PRE, measurements before starting the training session; R, resistance; R/h, resistance adjusted by height; r, Spearman correlation coefficient; WB, whole-body; Xc, reactance; Xc/h, reactance adjusted by height; |Z|, impedance module; |Z|/h, impedance module adjusted by height; * p statistical significance, p ≤ 0.05.
Publisher’s Note: MDPI stays neutral with regard to jurisdictional claims in published maps and institutional affiliations.

