Abstract
With regard to the current needs for greener aviation, this study focuses on a novel concept of Box-Wing Aircraft (BWA). Labelled SmartLiner (BWA/SL), this conceptual aircraft comes as a triplane comprising backward and forward swept wings. The aerodynamic performance and structural characteristics of this BWA/SL aircraft are here explored through numerical simulation, using Computational Fluid Dynamics (CFD) and Fluid-Structure Interaction (FSI). The computational approach is first validated using NASA’s Common Research Model (CRM) aircraft, which is then taken as a reference solution against which to compare the aero-structural merits of the BWA/SL concept. Results show that, although its design is still preliminary and lacks optimization, the BWA/SL aircraft exhibits very decent aerodynamic performance, with higher lifting capacities and a reasonable lift-to-drag ratio. Moreover, thanks to the closed frame of its peculiar planform, it demonstrates superior structural characteristics, including under extreme loading scenarios. Based on this preliminary analysis and considering the room left for its further optimization, this conceptual aircraft thus appears as a potentially promising alternative for the development of more environmentally friendly airliners.
1. Introduction
Modern air transportation is currently facing several challenges, including the need to reduce its environmental impact. In particular, pollutant emissions constitute the primary obstacle to a sustainable future for air transportation, the continuous growth (+5% every year) of which comes along with increased environmental concerns, worldwide. A way to mitigate the pollutant emissions entailed by air transportation is to improve the design of aircraft such that their transport capacity is maximized whereas their fuel consumption is minimized. This may be achieved by enhancing the aircraft’s lifting capacities (thereby increasing its payload) and diminishing its drag penalties (thereby reducing the propulsive power required in cruise). In other words, a way forward is to further improve the aerodynamic performance of aircraft by maximizing their lift-to-drag ratio (L/D). Research efforts in this area are very active worldwide, and proposed solutions can range from rather simple or conservative (e.g., passive flow control using vortex generators) to more complex or innovative (e.g., novel aircraft and/or power plant architectures).
Regarding novel aircraft configurations, and beside other embodiments (e.g., flying wing [1], strut-braced wing aircraft [2]), one can cite the Box-Wing Aircraft (BWA) concept [3] (see Figure 1). Based on the pioneering works by L. Blériot and G. Voisin [4,5] (1906), this concept was later rationalized through the Prandtl–Munk theory [6,7], according to which an aircraft with a closed wing system should offer better aero-structural performances than a conventional ‘tube-and-wing’ configuration. Indeed, different from a conventional aircraft whose lift is produced by a single wing, a box-wing aircraft relies on multiple lifting surfaces (wings, but also horizontal tail) that are connected one to the others, with these connections reducing the drag induced by wingtip vortices. The benefits are expected to be multi-fold, namely (i) more lift produced (i.e., more payload allowed and/or shorter wingspan required), (ii) less induced-drag generated (i.e., less fuel consumption entailed) and then, (iii) higher structural integrity (i.e., less weight from structural reinforcement)—all of which would ultimately lead to better performances and thus lower emissions.
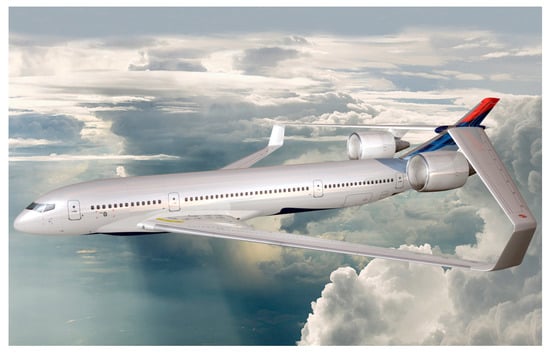
Figure 1.
Box-Wing Aircraft (BWA) design from Lockheed Martin (with NASA courtesy).
The last decade saw active research on box-wing aircraft, worldwide. One can cite the BWA concept currently explored by Lockheed Martin (see Figure 1) under the Environmentally Responsible Aviation Project (ERAP) initiative by NASA [8]. The proposed concept advantageously combines a box-wing design, advanced lightweight composite materials, and highly efficient engines (with a bypass ratio almost five times greater than that of current engines). It is claimed that this BWA aircraft would offer a lift-to-drag ratio that would be 16% higher than that of a conventional aircraft, along with reduced noise emissions. One can also mention several large-scale projects conducted under the aegis of the European Commission, namely PARSIFAL [9,10,11,12,13,14,15,16,17] and IDINTOS [18,19]. In particular, the recent EU project PARSIFAL explored rather extensively the so-called Prandtl Plane concept, which was investigated from various angles, including market perspectives [9], conceptual design viewpoints [10,11,12], and more technical aspects (e.g., performance [13], stability [14], aerodynamics [15,16], structures [17]). Additionally, more specific studies were conducted by several universities, worldwide; several works investigated the BWA concept from design perspectives [20,21,22,23,24,25,26,27] whereas others focused on more specific things such as the aerodynamic efficiency of the box-wing itself [28,29,30,31,32,33,34], as well as structural [35,36] and stability [37,38,39,40] aspects.
All these pioneering studies paved the way to the possible emergence of a BWA aircraft era. This being said, there are still many venues to explore for such an unconventional aircraft concept can be further consolidated and optimized. Besides, these conceptual early days are the perfect timeframe for further thinking out of the box (-wing), for instance by exploring even more disruptive BWA concepts. This is what led to the recent development of a novel box-wing aircraft concept, referred to as SmartLiner (SL) hereafter. Originally designed by the present third author, this novel concept (currently pending patent approval) comes as a triplane comprising backward and forward swept wings (see Figure 2). The main driver behind this concept relies on Prandlt’s idea [6,7] that a triplane should exhibit a lower induced drag than that of a biplane with identical lift (or wingspan) [41,42]. Compared to a typical (biplane) BWA, the present BWA/SL concept thus comprises an additional middle wing, which is connected to the other two. This novel configuration is expected to provide better aero-structural characteristics than a typical (two-wing) Prandlt plane, thanks to (i) its much stiffer closed frame structure, (ii) its further increased lifting areas, and (iii) its expected low-induced drag connected wingtips. Besides, thanks to its further increased lifting area, this BWA/SL concept could accommodate a reduced wingspan, thereby allowing a planform based on thin wings of high aspect ratio. In turn, this shall allow designing the wings using laminar flow airfoils, thereby further increasing their aerodynamic performance. This particular embodiment constitutes a new sub-class within the BWA family, along with those having a conventional wing-box, joined-wing, ring-wing, etc. Needless to say, however, such a disruptive BWA concept raises even more questions than a typical two-wing BWA, whether in terms of commercial exploitation, aerodynamic performance, structural efficiency, stability and control characteristics, etc. As a first step towards such an assessment of this BWA/SL aircraft concept, its aero-structural merits were here explored using computational means. The outcomes are summarized in the present article, which is organized as follows: Section 2 presents the computational approach that was used throughout the study, which relies on Computational Fluid Dynamics (CFD) and Fluid-Structure Interaction (FSI). In Section 3, the computational approach is first applied to a classical aircraft, namely the Common Research Model (CRM) configuration by NASA, thereby providing both a validation of the method and a reference solution against which to compare the BWA/SL aircraft concept. The latter is computationally explored and compared to its CRM counterpart in Section 4, before conclusions and perspectives are drawn in Section 5.
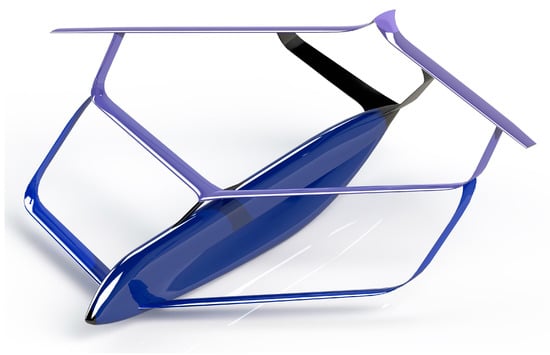
Figure 2.
“SmartLiner” triplane Box-Wing Aircraft concept (BWA/SL).
2. Computational Approach
Whether it concerns the reference (CRM) or the BWA (SL) aircraft, the numerical investigation is conducted using the same computational strategy and tool; the aerodynamic performance is investigated first, using a Computational Fluid Dynamics (CFD) method relying on a steady Reynolds Averaged Navier-Stokes (RANS) approach. The structural characteristics are then explored using a Fluid-Structure Interaction (FSI) simulation, which relies on the CFD results obtained beforehand. Of note, the FSI is handled in a weak (or one-way) coupling sense, i.e., it accounts for the structural deformations induced by the aerodynamic loads while neglecting how the former are impacted by the latter. In addition, all computations are performed under the assumption of static equilibrium, i.e., all inertial effects are neglected.
For each aircraft configuration, the RANS simulation underlying both the CFD and the FSI calculations is conducted using an unstructured mesh, which is made of polyhedral cells. To save computational resources, and given the (very) high value of targeted Reynolds numbers (from 30 to 60 million), use is made of a wall function. The latter enables relaxing importantly the grid requirements at the walls (e.g., around the aircraft skin) while rendering the drag effects incurred by the boundary layers’ shear stresses. Indeed, wall functions allow modelling—rather than resolving—the near-wall flow regions, whose viscous effects are of secondary importance compared to inertial ones, in high Reynolds number flow. More precisely, a wall function relies on a semi-empirical model, which allows “bridging” the inner (viscous sublayer and logarithmic boundary layer) to the outer (fully turbulent) regions, with no need to resolve the flow in the former one. Such a modelling is economical, robust, and reasonably accurate, thereby constituting a real advantage for industrial applications involving high Reynolds number flows, as in here. On that stage, it is worth noting that very high Reynolds number flows (e.g., by aircraft, ships) exhibit a logarithmic boundary layer that extends to several thousands of dimensionless length unit (y+) away from the wall (as opposed to more moderate Reynolds number flows, for which this distance would rather be of a hundred y+ units—e.g., turbine blades). Aside from a wall function, use is made of a k-ϵ turbulence model, which is a classical, two equation transport model that is more particularly suited for resolving flows away from the wall (as opposed to k-ω models, which rather apply to near-wall flows). Of note, use is here made of the so-called realizable k-ϵ turbulence model, which is known to better predict the boundary layer characteristics of large pressure gradients, separated and recirculating flows [43]. Finally, the fluid properties are classically set so that they correspond to an ideal gas, with a viscosity that obeys the Sutherland law. The specific heat and thermal conductivity are kept constant (with values of 1006.43 J/kg-K and 0.0242 W/m-K, respectively).
The computational methodology and underlying tool are first validated using the CRM reference aircraft (cf. Section 3), before they are applied to the BWA/SL aircraft concept (cf. Section 4), with additional sanity checks being performed whenever possible (e.g., grid convergence study, comparison with results obtained with a different solver).
3. Aero-Structural Characterization of CRM Aircraft
This section focuses on the reference aircraft, which is based on the Common Research Model (CRM) configuration. First, the aerodynamic performance is assessed using the CFD/RANS approach introduced above, this being achieved for numerous flight conditions. Results are validated against computational and experimental outputs coming from the literature. Then, the structural characteristics are estimated for that flight condition corresponding to the nominal cruise flight, this being achieved using the FSI approach. The simulation is validated against computational results from a reference study.
3.1. Main Characteristics of CRM Aircraft
The CRM aircraft [44,45,46,47,48] originates from a NASA initiative whose objective was to provide a benchmark case so as to help assess the computational capabilities employed for aircraft performances, worldwide. Since its introduction to the aeronautic research community via the AIAA Drag Prediction Workshop (DPW), the CRM model has been used by many research teams, whether as a means for validation or as a basis for comparison. Indeed, the CRM is a faithful representation of a long-range twin-aisle transport aircraft, very similar to the Boeing B777 (see Figure 3).
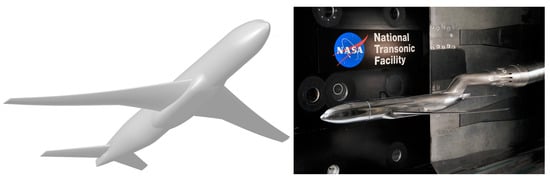
Figure 3.
Common Research Model (CRM) aircraft in its original wing-body-tail (WBT) configuration (i.e., with horizontal tail only). CAD model (left) and small-scale experiment ((right), reproduced from [47] with NASA courtesy).
It is designed for a cruise condition of Mach 0.85 and Reynolds number Re = 40 million (per reference chord), with an angle of attack α = 2.05° leading to a nominal lift coefficient of CL = 0.5. Table 1 lists some key characteristics of the CRM planform [44,45]. The CRM model comes with several variants; besides a classical set of fuselage and wings, it can comprise (or not) a horizontal tail (of variable incidence angle, ih), an empennage and/or a pair of engines (nacelle and pylon). As with most previous studies, the present work relies on the original CRM configuration, which solely comprises the horizontal tail (of zero incidence angle, ih = 0).

Table 1.
CRM aircraft: Main characteristics of the planform [44,45].
3.2. Computational Set-Up
All CRM simulations are conducted using an identical computational set-up (e.g., CFD mesh, FSI model), the latter being adjusted each time to the flight conditions considered (e.g., inflow boundary conditions).
3.2.1. CFD Computational Set-Up
The problem being symmetric, only one half of the aircraft is considered (cf. Figure 4). The computational domain is defined such that it extends by approximately 64 × 15 × 16 semispan (b/2) in the axial, lateral and vertical directions, respectively. This domain is meshed with an unstructured grid, which is generated upon the CAD model of the CRM aircraft. The latter is available via the AIAA DPW repository site (https://aiaa-dpw.larc.nasa.gov/Workshop6/DPW6-geom.html, accessed on 24 February 2020).
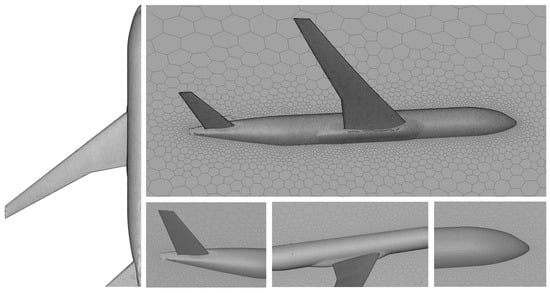
Figure 4.
CRM aircraft: Unstructured mesh used for the aerodynamic (CFD) computations.
This grid is composed of polyhedral elements, whose optimal density was determined through a grid convergence study involving meshes of up to 1.8 million cells. The final mesh comprises approximately 600,000 polyhedral elements, 95% of which exhibit a skewness that is deemed to be acceptable (~0.05–0.6). The finer grid region is classically attached to the aircraft skin, being characterized by a maximum y+ of about 2200. Although this value may seem large, it is deemed to be acceptable given the modelling strategy adopted (wall function and very high Reynolds number flows, realizable k-ϵ turbulence model). In turn, such a modest mesh is expected to entail light CPU consumption, thereby enabling the exploration of numerous flight conditions—as intended.
3.2.2. FSI Computational Set-Up
The FSI computations are performed using a pre-existing finite element method (FEM) model of the CRM aircraft [46], which is also available via the AIAA DPW repository site (https://commonresearchmodel.larc.nasa.gov/fem-file/wingbox-fem-files/, accessed on the 12 July 2020).
This FEM model (namely, the V15 version) comes as a shell-based structure that includes implicit stiffening elements such as main spars, skins, more than 50 ribs, etc. (see Figure 5). Following [46], the material adopted for the entire wing is aluminum (i.e., density: 2780 kg/m3, Poisson Ratio: 0.33, Young’s Modulus: 7.31 × 10¹⁰ Pa, yield Strength: 4.20 × 10⁸ Pa.).
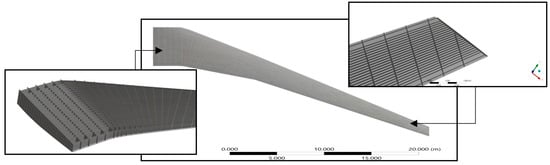
Figure 5.
CRM aircraft: FEM model used for the aero-structural (FSI) computations.
3.2.3. Computational Matrix
To explore the CRM flight envelope as well as to gather enough computational results for validation and comparison purposes, more than 20 flight conditions are simulated. As one can see in Table 2, various couples of altitude and speed are explored, each one coming with several aerodynamic settings (angle of attack, α). In particular, one can mention the flight condition characterized by a Mach number M = 0.85 and an altitude of 44,000 ft, thus corresponding to a Reynolds number of Re = 30 × 106 (with a reference length based on the mean aerodynamic chord, cref = 7 m). Labelled S1 hereafter, this flight condition (M = 0.85 at 44,000 ft) is representative of a nominal cruise flight for a CRM aircraft taken under its optimal aerodynamic settings (angle of attack α = 2.05°, CL = 0.45). It is chosen for the validation of the CFD simulations (cf. § 3.3.1), given the availability of both experimental and numerical data from the literature [45,46,47,48]. For the same reason of reference data available, it is then retained for comparing the respective aerodynamic performances by both CRM and BWA/SL aircraft (cf. § 4.3). One can also mention this other flight condition corresponding to an identical Mach number M = 0.85 but an altitude of 37,000 ft, thereby corresponding to a Reynolds number of Re = 43 × 106. Labelled S2 hereafter, this flight condition (M = 0.85 at 37,000 ft) is also representative of a nominal cruise flight of CRM under the same optimal aerodynamic settings (α = 2.05°, CL = 0.5). This flight condition is chosen for the validation of the FSI computations (cf. § 3.3.2), following [46]. It is then retained for comparing the respective structural merits of the CRM and BWA/SL aircraft (cf. § 4.3). Of note, the flight conditions and aerodynamic settings considered here are irrespective of the specific requirements for trimming the aircraft (e.g., elevator deflection), which would require specific stability analyses to be performed.
Table 2.
CRM aircraft: Flight conditions (S1 and S2 highlighted in blue and purple, respectively).
3.3. Computational Results and Analysis (Incl. Validation)
3.3.1. Aerodynamic (CFD) Results
The CFD computational campaign conducted for the CRM aircraft led to numerous results, only a fraction of which are presented hereafter. As an illustration, the left side of Figure 6 depicts the aerodynamic flow field obtained for the S1 flight condition and optimal aerodynamic settings (α = 2.05°), which is plotted here in terms of steady pressure coefficient. On the right side of the same Figure 6, the computational outputs associated with all flight conditions are plotted in terms of resulting lift-to-drag ratio (L/D). Notably, the S1 flight condition under a nominal angle of attack of α = 2.05° (CL = 0.45) exhibits an L/D value of 19.74, which is similar to that obtained through simulations (L/D = 19.56) and experiments (L/D = 20.47) by DLR and ETW for the same conditions [48]. Here, it is worth mentioning that such an important L/D value is typical of most modern aircraft (e.g., L/D = 19.3 for Boeing B777 and L/D = 19.2 for Airbus A340) [49], which are highly optimized in terms of aerodynamic performance. The slightly more favorable L/D recorded here can be attributed to the fact that the present CRM configuration lacks both its vertical tail and engines, whose presence would otherwise entail a drag penalty (for no extra lift produced).
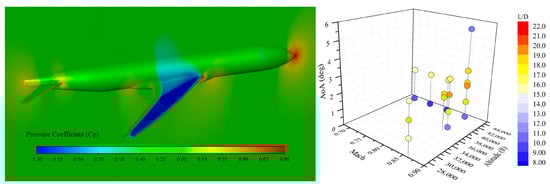
Figure 6.
CRM aircraft in various flight conditions. (Left): Steady pressure (Cp coefficient) on and around the aircraft in cruise flight conditions S1 (M = 0.85 at 44,000 ft) with an angle-of-attack α = 5.5°. (Right): L/D values obtained for the various flight conditions and aerodynamic settings (α).
Here, the horizontal tail also induces a penalty on the L/D value, simply because it produces a negative lift. This can be seen in Table 3, which provides a breakdown of the lift and drag forces exerted on the main parts of the airframe in this cruise condition. One can here notice the very beneficial effect of the wings on the overall L/D, as well as the contribution by the fuselage to the overall lift produced by the aircraft.
Table 3.
CRM aircraft in cruise flight condition S1 (M = 0.85 at 44,000 ft) with an angle-of-attack α = 2.05°. Breakdown of lift and drag forces (in tons), with their ratio.
A more qualitative description of the aerodynamic performance by the CRM aircraft in such a cruise flight condition S1 with α = 2.05° is given in Figure 7. This figure depicts the distribution of both the lift and drag forces on the aircraft skin. In particular, one can notice how the lift is mostly produced by the wings (as expected), being distributed rather heterogeneously over their area. On the other hand, the drag is mostly generated by those regions of the wings’ suction side that are located close to the fuselage—which is due to the interference effect produced by the latter.
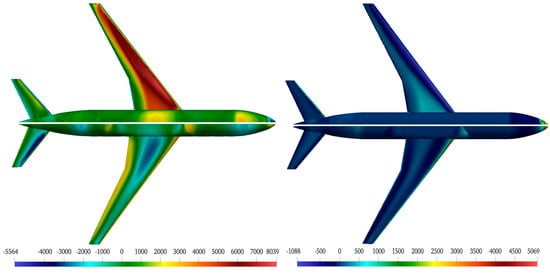
Figure 7.
CRM aircraft in cruise flight condition S1 (M = 0.85 at 44,000 ft) with an angle-of-attack α = 2.05°. Distribution of the lift (left) and drag (right) forces (in Newtons) exerted on the suction ((top) halves) and pressure ((bottom) halves) sides of the aircraft.
The good agreement of the present simulations with reference data is further highlighted in Figure 8, which depicts the lift and drag coefficients obtained under the S1 flight condition for various angles of attack (α ~ 0° to 3°), comparing them with those coming from [48]. The agreement is fairly good, with the present and reference simulations almost collapsing while closely matching the experiments.
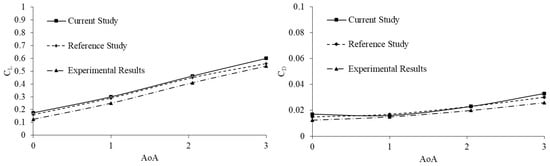
Figure 8.
CRM aircraft in cruise flight condition S1 (M = 0.85 at 44,000 ft) with various angle-of-attack (α ~ 0° to 3°). Lift (left) and drag (right) coefficients obtained through the present CFD (line), with comparison against the reference CFD (dash) and experiment (dot-dash).
An additional and more qualitative comparison is provided in Figure 9, which displays the chordwise distribution of the pressure coefficient (Cp) around the main wing, as obtained under the S1 flight condition and a higher angle of attack (α = 5.5°)—following [48]. As observed in the latter reference, beyond a limit angle of attack of α = 3°, non-linear effects mostly drive the lift creation (and, thus, the structural deformations) experienced by the wings. This goes along with the formation and upstream migration of a shock that initially extended towards the wing tip. One can see that the shock presence is captured by the simulations and the experiment, as revealed by the respective Cp distributions that are plotted here at three relative positions from the root (η = (y − yroot)/(ytip − yroot)). Similar to the reference computation [48], the present simulation agrees reasonably well with the experimental data [48], despite some noticeable deviations around the shock location. At this stage, it is worth underlining the inherent difficulty of capturing shocks using standard CFD approaches such as the one used here (e.g., classical 2nd order schemes), which makes it usually challenging to simulate such types of transonic configurations.
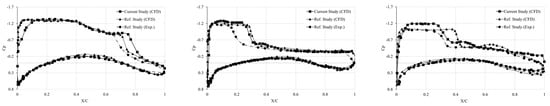
Figure 9.
CRM aircraft in cruise flight condition S1 (M = 0.85 at 44,000 ft) with an angle-of-attack α = 5.5°. Coefficient of pressure (Cp) around the main wing, as plotted at three relative positions from the root ((left): η = 0.283; (center): η = 0.603; (right): η = 0.846). Present results (line) with comparison against the reference CFD (dash) and experiment (dot-dash) ones.
Overall, the present results agree fairly well with the reference data, whether computational or experimental—which validates the CFD methodology and set-up employed here.
3.3.2. Structural (FSI) Results
The structural analysis is conducted for the flight condition S2 (M = 0.85 at 37,000 ft i.e., Re = 43 × 106) with an angle of attack α = 2.25° (i.e., CL = 0.50), thereby allowing a straight validation against results coming from a similar study [46]. The left side of Figure 10 depicts the corresponding FSI results, given here as wing deflection and associated stress concentration (Von Mises criteria). One can observe a gradual increase in the displacement from root to tip, which naturally translates the deformation resulting from the lift distribution. This induces a stress concentration on the central section of the wing, which is clearly seen to be sustained by the ribs (cf. the left wing, on left side of Figure 10). Additionally, the deflection reaches its maximum value at the wing tip, with a displacement of δtip = 2.9 m (cf. right/top of Figure 10). This value is aligned with that obtained in the reference study [46], i.e., δtip = 2.59 m. One can attribute the 10.6% mismatch between both results to the slightly different CRM geometries considered (cf. right/bottom of Figure 10). Indeed, in the reference study, the FSI process was initiated from an undeflected-wing CRM (namely uCRM9 [46], corresponding to an aircraft in ground conditions), whereas it is here started from the baseline CRM geometry [44,46], which corresponds to an in-flight aircraft with nominally pre-deflected wings. Note that such a wing tip deflection value cannot be readily compared to that of a typical Boeing B777 in cruise condition, because the two platforms are not identical (CRM wing is slightly shorter and more swept than the B777 wing) and—more importantly—because the present configuration does not incorporate the engines (and thus their weight).
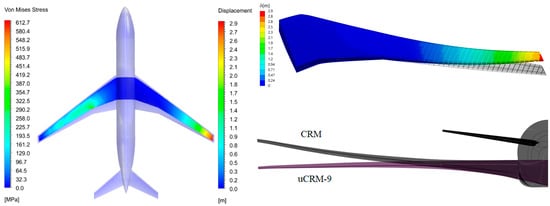
Figure 10.
CRM aircraft in flight condition S2 (M = 0.85 at 37,000 ft) with an angle-of-attack α = 2.25°. (Left): Stress distribution (left wing) and deflection (right wing) exerted by the aircraft planform. (Right): wing deflection (top) and comparison with that of [46] ((bottom): in-flight deflected and undeflected i.e., uCRM9).
All of the above demonstrates the reliability of the FSI computational strategy and set-up employed here, thereby further validating the present methodological approach, which is applied to the BWA/SL aircraft hereafter.
4. Aero-Structural Characterization of BWA/SL Aircraft
This section focuses on the Box-Wing Aircraft (BWA/SL), whose aero-structural merits are here assessed using the exact same computational methodology employed for its CRM counterpart. As done previously, the aerodynamic performance is first evaluated through CFD, this being conducted for a wider set of flight conditions so as to explore the BWA/SL’s flight envelope. Although no reference data exist, the results are tentatively validated whenever possible, through indirect means (e.g., grid convergence studies, alternative simulations using a different solver/method). In a second time, the BWA/SL structural characteristics are estimated for that particular flight condition which meets the criteria of an optimal cruise (higher L/D), this being achieved through FSI. Although its design is still preliminary (see below), the aero-structural merits of the BWA/SL aircraft are systematically compared to those of CRM, thereby providing key insights on how to improve the concept.
4.1. Main Characteristics of BWA/SL Aircraft
As can be seen in Figure 11, the BWA/SL aircraft is designed as a triplane comprising backward and forward swept wings. Although they are yet to be optimized from an aerodynamic standpoint, these wings are characterized by peculiar characteristics. The first two wings are swept backward and have an identical span that matches that of CRM, whereas the (foldable) third wing is forward swept and exhibits a 33% higher span (see Table 4). Each of these three wings is also characterized by a rather small mean aerodynamic chord (between 45% and 60% than that of CRM wing) and area (between 63% and 70% than that of CRM wing), which ultimately translate into a high aspect ratio (between 1.6 and 2.6 times that of CRM wing). On the other hand, thanks to its three-wing configuration, the aircraft offers an overall lifting area that is large (almost twice that of CRM one). The objective behind this design is to end up with a very large, long-range aircraft capable of producing massive amounts of lift against an acceptable drag.
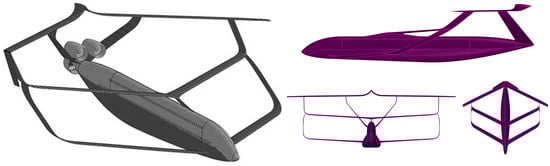
Figure 11.
Box-Wing Aircraft/SmartLiner (BWA/SL) concept. (Left): Early drawing of the BWA/SL with powerplant and one wing folded. (Right): CAD model of the clean (unpowered) configuration.
Table 4.
BWA/SL aircraft: Main characteristics of the planform.
Regarding its other characteristics, the aircraft is meant to carry 600+ passengers with 6-abreast seating on the main deck and two-by-three seating on the upper deck. The aircraft height is nearly 24.4 m, which is within the maximum gate box size (Group VI or Code Letter F). The V-tail fins are forward swept, to reduce their impact on the pair of aft wings. Notably, the roots of these tail fins could help shielding part of the noise emitted by the turbofan engines, to be mounted in a rear fuselage nacelle configuration [50]. Further, a rear mounted electric fan is envisioned to be used so as to ingest the fuselage boundary layer, thereby reducing its drag. The long fuselage is lifted at four points, as it is connected to the root of the parasol middle wing with two pylon-like structural bodies (fins). These junctions are smooth and bent, so as to even out the stress and to dampen the vibrations. Additionally, the fuselage is connected to the low-mounted front wing close to its nose region, which is characterized by an ovoid shape: the wider lower portion shall allow more payload in case of a single-pilot cockpit scenario. Finally, the wide fuselage belly extension offers enough space for very large fuel tanks, while making the cargo compartment uninterrupted (i.e., not affected by the undercarriage).
4.2. Computational Set-Up
As for the CRM cases, all BWA/SL computations were achieved using an identical computational set-up, with the latter being adjusted each time to the flight conditions considered.
4.2.1. CFD Computational Set-Up
Again, the problem being symmetric, only one half of the aircraft is considered. The computational domain extends by approximately 44 × 9 × 13 semispan (bref/2, bref = 60 m) in the axial, lateral and vertical directions, respectively. This domain is meshed with an unstructured grid that is composed of polyhedral elements. Based on a specific grid convergence study, the mesh is capped to 1.2 million cells, for a convergence met at 0.9 million. The resulting grid (cf. Figure 12) is such that 90% of the cells exhibit a skewness of 0.68–0.78 whereas 2% of cells have an orthogonality of less than 0.3. The smallest cells are again distributed along the aircraft skin, with a maximum y+ value of 1500. This is again deemed to be acceptable in view of the computational strategy deployed (wall function, realizable k-ε turbulence model, etc.), especially considering its preliminary validation through the CRM cases of the previous section.
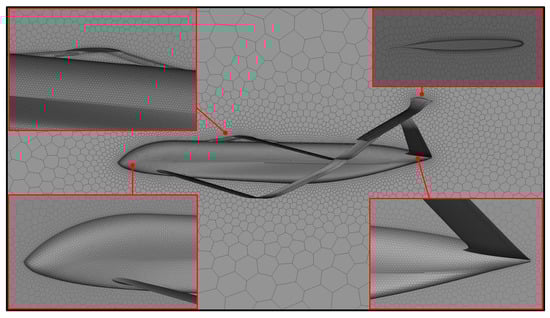
Figure 12.
BWA/SL aircraft: Unstructured mesh used for the aerodynamic (CFD) computations.
4.2.2. FSI Computational Set-Up
The FSI computations are achieved using the same process as previously adopted for CRM cases. In contrast to the CRM aircraft, however, no structural pre-design exists for the BWA/SL concept. Therefore, a Finite Element Method (FEM) model is first built from scratch, upon some necessary but reasonable simplifications.
First, the three wings and V-tail are assumed to be the primary load-carrying structures. The latter come as an ensemble of shells that are classically reinforced using ribs, spars, stringers, connections, etc. All of these structural elements exhibit various thicknesses, which are chosen so as to offer the best trade-off in terms of structural characteristics versus weight penalty. For instance, the wings and V-tail comprise a total of 40+ ribs overall, as well as stringers and spar caps (cf. right side of Figure 13). All are wrapped up with shells of thickness 7 mm, the stringers and spar caps being modelled using rods of equivalent radius 17.8 mm. The connections between wings and wingtips (or between the third wing and the V-tail) are assumed to be flexible bar structures (cf. right side of Figure 13). The wing-to-wing junctions are idealized and modelled as beams, using connecting rod elements of 20 mm radius. For a better realism (and in contrast to previous structural analyses of the PrandtlPlane [17]), the third wing root is here allotted some degrees of freedom, i.e., it is free to move in the vertical and axial directions. For a fair comparison, the material chosen is aluminum again, i.e., it fits with the one previously used for the CRM aircraft structural study. Based on the above, an unstructured FEM mesh is generated, which gathers a total of 0.46 million of elements against a total 0.3 million of nodes. The FEM elements are of variable types and of maximum cell size 15 × 10−2 m (i.e., bref/400).
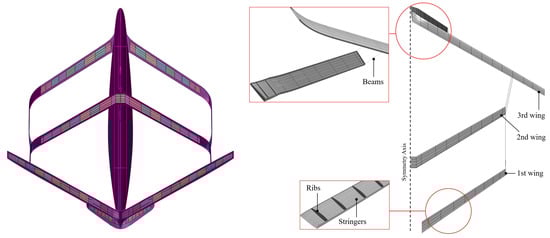
Figure 13.
BWA/SL aircraft: Finite element method (FEM) model used for the aero-structural (FSI) computations, with FEM elements of the planform highlighted ((left): overall view, (right): details).
4.2.3. Computational Matrix
Being completely unknown at first, the BWA/SL flight envelope is explored through no less than 45 flight conditions. As shown in Table 5, numerous couples of altitude and speed are simulated, each one coming with one to several aerodynamic settings (angle of attack, α).
Table 5.
BWA/SL aircraft: Flight conditions (S3, S4 and S1 highlighted in red, green and blue, respectively).
In particular, one can mention that flight condition associated with a Mach number M = 0.7 and an altitude of 43,000 ft, thus corresponding to a Reynolds number of Re = 14.4 × 10⁶ (with a reference length based on the averaged mean aerodynamic chord, cref = 3.79 m). Labelled S3 hereafter, this flight condition revealed to exhibit the best aerodynamic performance, for an angle of attack α ~ 0° (see § 4.3.1 below). It is thus retained as a typical cruise condition for the BWA/SL aircraft, and used for comparing the aero-structural merits of the latter against those of its CRM counterpart (whose optimal cruise condition, namely S1 with α = 2.05°, is explored as well). One can also notice the flight condition of Mach number M = 0.7 at sea level (thus corresponding to a Reynolds number of Re = 61.8 × 10⁶). Labelled S4 hereafter, this more extreme flight condition (load factor of 2.5 when α = 0°) is used for further challenging the structural characteristics of BWA/SL aircraft (see §4.3.2). Of note, here again, the flight conditions and aerodynamic settings are irrespective of any precise requirement for trimming the aircraft, which would require specific stability analyses to be performed.
4.3. Computational Results and Analysis (Incl. Validation)
4.3.1. Aerodynamic (CFD) Results
The CFD computational campaign conducted for the BWA/SL aircraft configuration led to numerous results, only a fraction of which are presented hereafter. As an illustration, the left side of Figure 14 depicts the aerodynamic flow field obtained for the S3 flight condition (M = 0.7 at 43,000 ft), which is plotted here in terms of steady pressure coefficient.
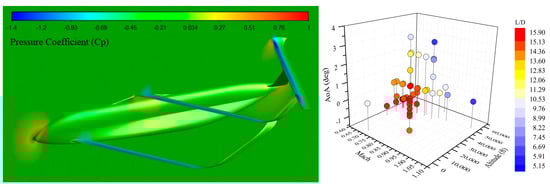
Figure 14.
BWA/SL aircraft in various flight conditions. (Left): Steady pressure (Cp coefficient) on and around the aircraft in cruise flight condition S3 (M = 0.7 at 43,000 ft) with an angle-of-attack α = 0°. (Right): L/D values obtained for the various flight conditions and aerodynamic settings (α).
On the right side of the same Figure 14, the computational outputs associated with all flight conditions are plotted in terms of the resulting lift-to-drag ratio (L/D). It appears that the aerodynamic performance of BWA/SL is rather independent of the altitude, while varying more importantly with the airspeed (M) and the aerodynamic settings (α). The best aerodynamic performance is reached under the S3 flight condition (M = 0.7 at 43,000 ft), with an L/D value of 15.5 ~16 (under an angle of attack of zero or slightly negative value). Notably, this L/D ratio is very similar to that of a Boeing B747-400 in cruise [49], albeit somewhat lower than that of more traditional, biplane BWA aircraft [9,10,11,12,13,14,15,16,17,18,19] (e.g., L/D ~ 20). This is rather encouraging, considering that the BWA/SL did not benefit (yet) from any aerodynamic optimization of its planform—as would be needed for its aerodynamic performance to be able to compete with those of more modern aircraft, such as the CRM (whose wings were heavily optimized [46,47]). This point, which is a matter of an ongoing study by the present authors, is discussed hereafter. In addition, this optimal value in Mach (M = 0.7) fits well with conclusions from previous works [51], according to which BWA aircraft are best suited for shorter range missions and lower cruise speeds, compared to their conventional counterparts.
Based on the above, the flight condition S3 is retained as a nominal cruise condition for assessing the BWA/SL merits, and is thus given particular attention. As a preliminary step, this S3 configuration is used for further validating the computational methodology and set-up, which is first achieved by successfully performing a grid convergence study (cf. Figure 15). In a second time, the present simulation results are compared to those coming from an alternative computation, which were obtained under the exact same conditions and following a similar computational approach (RANS with a standard k-ε turbulence model) while using a different solver and a denser mesh (with no wall function used).
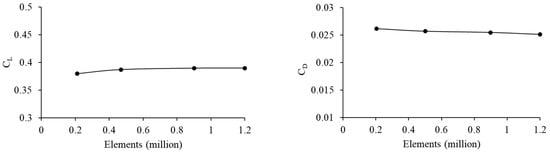
Figure 15.
BWA/SL aircraft in cruise flight condition S3 (M = 0.7 at 43,000 ft) with an angle-of-attack α = 0°. Overall lift (left) and drag (right) coefficients obtained through a grid convergence study.
As can be seen in Figure 16, both results are in fairly good agreement, exhibiting very similar patterns of pressure distribution on the aircraft skin. For instance, the maximum wall pressure recorded in both cases differs by no more than 5% (21.8 KPa vs. 20.7 KPa), such discrepancy being attributable to the methodological differences between the two simulations.
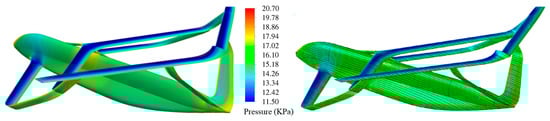
Figure 16.
BWA/SL aircraft in cruise flight condition S3 (M = 0.7 at 43,000 ft) with an angle-of-attack α = 0°. Absolute pressure distribution on the aircraft skin. Comparison between the current (left) and the alternative (right) simulations.
This good agreement between both simulations is further confirmed by analyzing more closely their breakdown in lift and drag forces (cf. Table 6). Here too, both results match quite closely despite some slight discrepancies, which can again be attributed to the methodological biases. Overall, the L/D ratios recorded by both calculations fall within the same range, with a 6% error bound (L/D = 15.69 vs. L/D = 16.55).
Table 6.
BWA/SL aircraft in cruise flight condition S3 (M = 0.7 at 43,000 ft) with an angle-of-attack α = 0°. Breakdown of lift and drag forces (in tons) and their ratio, with comparison against the alternative calculation (“alter.” label).
This breakdown in lift and drag forces sheds some light on the aerodynamic performance of the BWA/SL aircraft. It is no surprise that, here too, the lift is mostly produced by the planform elements, i.e., the 3 wings. With a respective wetted area that regularly increases (and ignoring sweep or interference effects), the first, second and third wings logically generate an increasing lift force (of approximately 48, 52, and 59 tons, respectively). On the other hand, their associated drag increases even more importantly (with approximately 1.8, 2.6 and 4.6 tons, respectively). As a result, the aerodynamic performance degrades constantly from the first to the third wing (with respective L/D values of 26.7, 19.8 and 12.9). One can notice that, although unoptimized, the first wing exhibits an L/D ratio that is as high as the (highly optimized) wing of the CRM aircraft in its optimal cruise condition, namely S1 with α = 2.05°. Conversely, although it is wider by no more than 30%, the third wing generates 2.5 times more drag than the first one.
The above observations can be explained by looking more qualitatively at how the lift and drag forces are distributed on the aircraft skin, which is depicted in Figure 17. First, and in contrast to the CRM aircraft (cf. Figure 7), each of the three wings sees its lift and drag forces being roughly equally distributed along its span—which comes from their unoptimized character (see below). This, however, does not hold for some areas. In particular, the first two wings suffer from a loss in lift and an increase in drag at their root. This is logically attributed to the flow interferences coming from the connections (root juncture, pylon) between the wings and the fuselage, as well as to the airflow blockage by the latter.
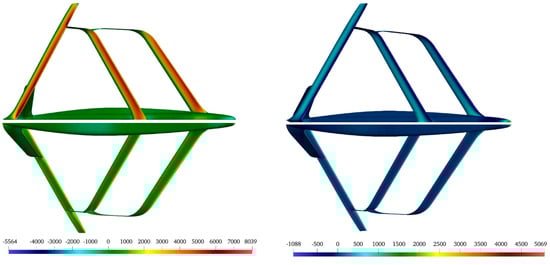
Figure 17.
BWA/SL aircraft in cruise flight condition S3 (M = 0.7 at 43,000 ft) with an angle-of-attack α = 0°. Distribution of the lift (left) and drag (right) forces (in Newtons), as exerted on the suction (top halves) and pressure (bottom halves) sides of the aircraft.
By contrast, the third wing is rather characterized by an increase in both lift and drag, which occurs at its root and tip. The excess lift at the tip region was observed to result from a beneficial side effect incurred by the vertical, backward swept junctures between the second and third wings, which provide the latter with an upward flow in the T-junction area. This results in some unexpected improvement for the outboard section of the third wing, namely a higher lift (and lift-to-drag ratio) than that observed without said vertical tip section of the wing ahead. Such a beneficial effect, however, also comes with a detrimental impact, namely the disruption of the flow by the outboard, straight junction, which then induces some flow swirling—ultimately resulting in vortical patterns that are likely to induce parasitic drag (see Figure 18, left side). Such an effect was observed to increase at either higher airspeeds (albeit similar Reynolds) or higher angles of attack, for which local shock gradually appeared. This is exemplified on the right side of Figure 18, which depicts the delta in steady pressure on the aircraft skin for the flight conditions S1 (M = 0.85 at 44,000 ft) with an angle-of-attack α = 3°. Aside from the outboard, straight junction, its inboard counterpart (V-tail to third wing junction) as well as the third wing root also revealed to entail some local flow disruptions, although to a lesser extent. Of note, the third wing’s inboard and outboard T-junctions were observed to degrade the lift distribution over the third wing, making it even less elliptical than that of its first and second wing counterparts. Notably, these side-effects resulting from the third wing junctions and root are likely to be mitigated through a proper design modification (e.g., filleting [3]), which is the subject of an ongoing study focusing on the aerodynamic optimization of the BWA/SL planform. Preliminary results are rather encouraging, revealing how the local modifications of these areas may actually minimize the parasitic drag and delay the local shock formation.
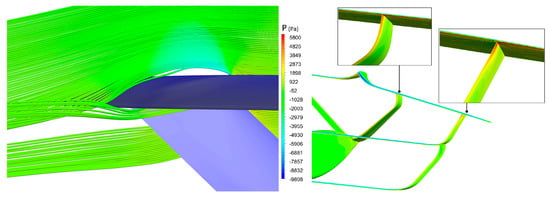
Figure 18.
BWA/SL aircraft in flight conditions S3 (M = 0.7 at 43,000 ft) with an angle-of-attack α = 0° (left) and S1 (M = 0.85 at 44,000 ft) with angle-of-attack α = 3° (right). Flow dynamics at the outboard, straight junction of third wing, with swirling streamlines (left) and absolute pressure (right).
This being said, a more prominent source of drag was observed to be entailed by (i) the third wing free tip, (ii) the bottom part of the first and second wing tip junctions, and (iii) the rear fuselage. These regions are characterized by an excess of vorticity, as shown in Figure 19, which depicts the instantaneous vortical flow structures around the aircraft (plotted here as Q-criterion iso-surfaces).
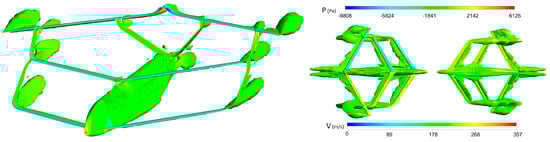
Figure 19.
BWA/SL aircraft in cruise flight condition S3 (M = 0.7 at 43,000 ft) with an angle-of-attack α = 0°. (Left): Vorticity field (swirling magnitude) depicted as Q-criterion iso-surfaces. (Right): Same result, as seen from the suction (left) and pressure (right) sides, along with the planform distribution in velocity (bottom half) and static pressure (top half).
Regarding first the third wing outboard portion, the latter logically induces tip vortices, which result from the pressure differential between the suction and pressure sides. Notably, this side-effect can be seen as the price to be paid for the additional lift produced by the third wing outboard portion—which is, however, not a prerequisite for the BWA/SL concept. Considering the sufficient lift produced by the present airframe, it is thus deemed possible to shorten the third wing so as to suppress its tip region and subsequent vortices. This is to be explored within an ongoing study that focuses specifically on the aerodynamic optimization of the BWA/SL planform. Aside from this classical example of lift-induced vorticity (and thus drag) that is inherited from the third wing tip, there exist less obvious albeit prominent vortical features incurred by the first and second wing tip junctions. The latter vortices are likely to come from the lateral disruption (e.g., partial blockage) of the flow dynamics occurring on either side of the wings, because of the bent wing tips. Again, mitigating these swirl effects and the resulting interference drag would require further optimizing the design of these junctions, which is the subject of an ongoing study.
From a more global perspective, these localized swirls can also be seen as a by-product of the downwash effect that is unavoidably entailed by each wing. The subsequent flow deflection is being counteracted by the clean airflow that is located on the outboard part of the wing, which then results in circulation and vortical effects. This is illustrated on the left side of Figure 20, which depicts the flow circulation experienced by the BWA/SL aircraft in its nominal cruise flight condition (S3), as plotted in the vertical planes passing by the bottom, bent tip junctions of either the first or second wing. Figure 20 also reveals the relative importance of the downwash effect, which is here measured as the ratio between the vertical and axial components of the airflow velocity. As can be seen, each one of the three wings logically entails some downwash, deflecting the flow downward. Even though this deflected flow does not directly impinge on the downstream wing (which is purposely located above), it is likely to degrade its aerodynamic performances. Such degradation, however, is difficult to assess. For instance, it was seen that the lift regularly increases (by approximately 7%) from one wing to its aft counterpart (including when they are of the same span, e.g., the first two wings). This tend to indicate that the flow degradation entailed by the successive downwashes is not too critical, even though it undoubtedly exists.
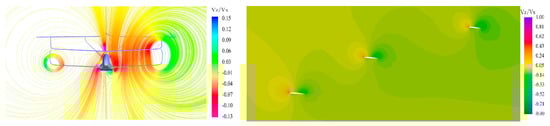
Figure 20.
BWA/SL aircraft in cruise flight condition S3 (M = 0.7 at 43,000 ft) with an angle-of-attack α = 0°. (Left): Flow circulation (iso-lines) and corresponding downwash effects (color code) occurring in the vertical plane passing by the first (left half) and second (right half) bent tip wing junctions (left and right half, respectively). (Right): downwash effects occurring in the vertical plane passing by the spanwise location bRef/2.
At this stage, it is worth mentioning that one cannot easily discriminate the various aerodynamic side-effects identified above. In particular, it is difficult to isolate their respective (negative) contribution to the overall aerodynamic performance, e.g., the regular decrease in the L/D ratio from one wing to another. This being said, these aerodynamic side-effects of the present BWA/SL planform are expected to be partly mitigated through further optimization of its planform, which is the subject of an ongoing study. This primarily concerns the design of the BWA/SL wings section, which should be improved. Indeed, whereas the highly optimized CRM wing involves supercritical airfoils, its BWA/SL counterparts rely on much simpler airfoils, of handmade design. Moreover, both the CRM and BWA/SL wings vary considerably in their respective twist (see left side of Figure 21). Indeed, the CRM wing exhibits a twist angle whose evolution along the span is constantly varying, and whose value is prominently negative (such a feature being desirable for both structural and stability reasons, e.g., enhanced washout effect providing the aircraft continued aileron control and some resistance to spin). Conversely, the BWA/SL wings are characterized by a quasi-constant twist, which is always positive (thereby producing more lift at zero angle-of-attack) and can be rather high (i.e., more prone to induce flow separation and, thus, higher drag).
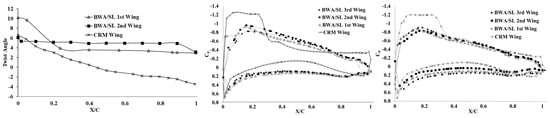
Figure 21.
Twist of the BWA/SL backward-swept wings, with comparison with that of CRM (left). Wall pressure distribution around the wings at 70% (center) and 90% (right) of their span, as obtained for BWA/SL and CRM aircraft in their cruise flight condition S3 (M = 0.7 at 43,000 ft) with an angle-of-attack α = 0° and S1 (M = 0.85 at 44,000 ft) with an angle-of-attack α = 2°, respectively.
As a result, whereas the wall pressure distribution evolves along the CRM wingspan, it remains almost unchanged along each of the BWA/SL wings. This may explain why the aerodynamic performance of BWA/SL aircraft is more “conservative” than that of its CRM counterpart, as revealed by Figure 22. This figure compares the L/D ratio obtained for both aircraft when flying (at their respective cruise altitudes) over a range of speeds and angles-of-attack. As can be seen, the good performance of the CRM aircraft is reached only under very specific conditions (M = 0.85, α = 2.05°), being much less impressive otherwise. Comparatively, the BWA/SL aircraft is less sensitive to its flight conditions and aerodynamic settings, with narrower variations of its L/D ratio value. The latter is expected to be substantially increased thanks to the further design of the BWA/SL planform, which is currently being achieved within an ongoing framework.
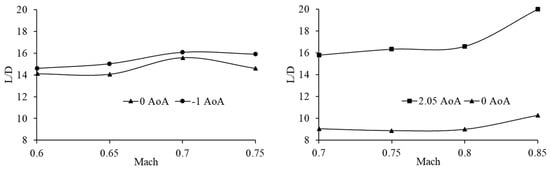
Figure 22.
Lift-to-drag ratio exhibited by the BWA/SL (left) and CRM (right) aircraft, as obtained at their cruise altitude (43,000 ft and 44,000 ft, respectively) for various airspeeds and angle-of-attack settings.
One can finally notice that, although its optimal cruise speed and L/D ratio are somehow lower, the BWA/SL aircraft delivers 20% more lift than its CRM counterpart, overall (compare Table 3 and Table 6). This represents bigger capacity in terms of payload, and thus of relative fuel savings.
All in all, one can conclude that the BWA/SL aircraft exhibits very decent aerodynamic performance, at least considering the unoptimized character of its planform. The design of the latter is expected to be significantly improved thanks to an ongoing research effort, whose objective is to optimize the BWA/SL planform from an aerodynamic perspective. So far, this ongoing study has focused on local modifications of the third wing’s root and junctions, with rather encouraging improvements observed (e.g., mitigation of the local shock). Global modifications of the entire planform (e.g., modifying the wing sweep and re-designing the airfoils) are also being explored, with preliminary satisfactory results (e.g., conservation of the current aerodynamic performances of L/D ~ 15–16 up to the transonic regime). Other possible improvements are the shortening of the third wing (so as to suppress its tip and subsequent vortices) as well as the modification of the first and second wing bent-tip junctions (so as to mitigate the induced vorticity). This will be the subject of another, more specific article.
4.3.2. Structural (FSI) Results
The structural analysis of the BWA/SL aircraft is first conducted for its nominal cruise condition S3 (M = 0. 7 at 43,000 ft) with an angle of attack α = 0°. Figure 23 depicts the corresponding FSI results, plotted here in terms of wing deformation and associated stress (Von Mises criteria). As for the CRM aircraft (cf. Figure 10), the wing deformation gradually increases from root to tip, which translates the deflection induced by the lift forces. As shown on the left side of Figure 23, the maximum displacement occurs at the tip of the third (and wider) wing, which is deflected up by 0.57 m. This value is considerably lower than those usually recorded for typical tube-wing commercial airliners. For instance, this deflection of the BWA/SL third wing represents less than 20% of the one by the CRM main wing (cf. § 3.3.2), even though the former has a 30% higher span than the latter (80 m and 60 m, respectively).
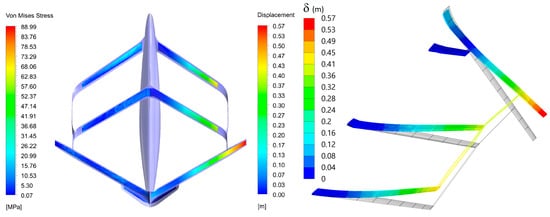
Figure 23.
BWA/SL aircraft in cruise flight condition S3 (M = 0.7 at 43,000 ft) with an angle-of-attack α = 0°. (Left): Stress distribution (left wing) and deflection (right wing) exerted by the aircraft planform. (Right): Deflection of the three wings (visual rendering is here exacerbated on purpose).
This fact can be attributed to both the aerodynamic (lift distribution) and structural (closed frame) specificities of the BWA/SL planform. First, although the overall lift produced by the BWA/SL planform is 25% higher than that of its CRM counterpart (160 and 127 tons, respectively), it is almost equally distributed over the three wings (each of which is thus exerting between 2 and 2.5 times less lift than the CRM wing alone). Second, the closed frame of the BWA/SL planform naturally translates into a structure that is much stiffer (i.e., more likely to resist deformations) than its CRM counterpart. As a logical consequence, the BWA/SL planform exhibits much lower structural stress, with a maximum Von Mises stress that is 7 times lower than that recorded for the CRM wing (compare, for instance, the left sides of Figure 10 and Figure 24). Although they are rather small, the higher stresses experienced by the BWA/SL planform are located over the first half of the first wing. This may be due to the fact that the first wing is highly twisted near its root (see left side of Figure 21), which makes it more likely to generate higher lift locally, thereby inducing larger flexural stresses. Even though they are even less important, the secondary stresses appear to concentrate at the juncture of the third wing and V-tail (cf. left sides of Figure 23). This is likely due to the overly turbulent flow originating from the rather rough design of such juncture (cf. § 4.3.2), whose optimization to come will hopefully minimize the impact.
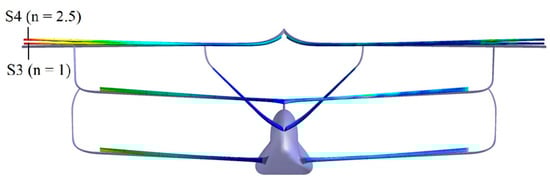
Figure 24.
BWA/SL aircraft in flight conditions S3 and S4 (M = 0.7 at 43,000 ft and sea level, respectively) with an angle-of-attack α = 0°. Deflections (left) and stress (right) exerted by the aircraft planform.
In a second time, the structural analysis is performed for an alternative (and likely unrealistic) flight condition, i.e., S4 (M = 0.7 at sea level) with an angle of attack α = 0°. Compared to the nominal cruise condition S3 of unitary load factor (n = 1), this flight condition entails an overall lift of around 2.5 times the BWA/SL’s expected maximum take-off weight (MTOW ~ 300–450 tons), thereby inducing a load factor n = 2.5. In such an extreme scenario, the maximum stress (Von Mises) recorded on the planform does not exceed 163 MPa, i.e., about 26% of the one reached by the CRM aircraft in its optimal cruise condition (n = 1). Moreover, the maximum deflection occurring at the tip of the third wing now becomes 1.06 m (see Figure 24), which represents roughly 35% of its CRM counterpart in cruise.
Although preliminary, this FSI analysis highlights the structural merits of the BWA/SL, which takes full benefit from the advantages offered by the Box-Wing Aircraft concept, namely a stiffer airframe that is thus capable of enduring higher aerodynamic loads. Combined with its increased lifting capacity, this more robust planform would allow the BWA/SL aircraft to carry higher payloads than an actual tube-and-wings aircraft such as the CRM.
More analyses are currently being conducted within an ongoing study, whose objective is to further optimize the aerodynamic design and structural characteristics of this BWA/SL conceptual aircraft.
5. Conclusions
The present work focused on the so-called SmartLiner aircraft concept, which is a novel variant of a Box-Wing Aircraft (BWA). Differing from more typical, biplane BWA concepts, it comes as a triplane comprising backward and forward swept wings. The aerodynamic performance and structural characteristics of this BWA/SL conceptual aircraft were here assessed through numerical simulation, using Computational Fluid Dynamics (CFD) and Fluid-Structure Interaction (FSI) calculations.
First, the computational approach was carefully validated using NASA’s Common Research Model (CRM) aircraft. No less than 20 simulations were achieved, several of which were validated against experimental and numerical results coming from the literature. In a second time, the computational methodology was applied to the BWA/SL aircraft, so as to compare its aero-structural merits to those of its CRM counterpart. In the lack of any prior knowledge, the BWA/SL flight envelope was first explored by simulating an extensive set of flight conditions and aerodynamics settings—with no less than 45 computations performed. For the most relevant cases, the aerodynamic performance was then assessed, both quantitatively and qualitatively.
Results show that although its design is still preliminary and lacks optimization, this BWA/SL aircraft exhibits very decent aerodynamic performance, with higher lifting capacities and a reasonable lift-to-drag ratio (L/D). In its current state of design, the BWA/SL aircraft can fly optimally at a cruise speed of Mach 0.7 and an altitude of 43,000 ft, with an overall L/D of about 15.7. This aerodynamic performance is expected to be significantly improved through further optimization of the BWA/SL planform, upon preliminary results from an ongoing study. Whether or not this will be enough for the current (triplane) BWA/SL concept to actually outperform its competitors (traditional or biplane BWA aircraft) remains an open question.
Aside from this, the BWA/SL aircraft demonstrates superior structural characteristics, including under extreme loading scenarios. In particular, thanks to the higher stiffness inherited from its closed-frame character, the planform exhibits only small amounts of tip deflection and stress concentration. Combined with its increased lifting capacity, this more robust planform allows the BWA/SL aircraft to carry higher payloads than actual and more traditional tube-and-wings aircraft, such as the CRM.
Based on this preliminary aero-structural analysis, and considering the room left for its further optimization, the BWA/SL conceptual aircraft appears as a promising alternative for the development of more environmentally friendly airliners. On the other hand, whether this promise can translate into a tangible reality remains an open question, which can only be answered by further assessing this concept from an aero-structural perspective and exploring its viability through other lenses (e.g., stability and control, propulsion, commercial exploitation, and so on).
Author Contributions
Conceptualization, A.H., S.R. and M.H.; methodology, S.R. and M.H.; validation, M.H., A.H. and S.R.; formal analysis, S.R., A.H. and M.H.; investigation, M.H., S.R. and A.H.; data curation, M.H.; writing—original draft preparation, S.R.; writing—review and editing, S.R., M.H. and A.H.; visualization, M.H.; supervision, S.R.; project administration, S.R. All authors have read and agreed to the published version of the manuscript.
Funding
This research received no external funding.
Conflicts of Interest
The authors declare no conflict of interest.
References
- Okonkwo, P.; Smith, H. Review of evolving trends in blended wing body aircraft design. Prog. Aerosp. Sci. 2016, 82, 1–23. [Google Scholar] [CrossRef]
- Secco, N.R.; Martins, J.R. RANS-Based Aerodynamic Shape Optimization of a Strut-Braced Wing with Overset Meshes. J. Aircr. 2019, 56, 217–227. [Google Scholar] [CrossRef]
- Wolkovitch, J. The joined wing—An overview. J. Aircr. 1986, 23, 161–178. [Google Scholar] [CrossRef]
- Lewis, P. British Aircraft 1809–1914; Putnam: London, UK, 1962. [Google Scholar]
- Elliot, B.A. Bleriot: Herald of an Age; Arcadia Publishing: Mount Pleasant, CA, USA, 2000. [Google Scholar]
- Prandtl, L. Induced Drag of Multiplanes. In Technical Note from the National Advisory Committee for Aeronautics; NACA: Washington, DC, USA, 1924. [Google Scholar]
- Munk, M.M. General biplane theory. In Technical Report from the National Advisory Committee for Aeronautics; NACA: Washington, DC, USA, 1923. [Google Scholar]
- Suder, K.L. Overview of the NASA Environmentally Responsible Aviation Project’s Propulsion Technology Portfolio. In AIAA Paper No. 2012-4038; AIAA: Reston, VA, USA, 2012. [Google Scholar]
- Abu Salem, K.; Binante, V.; Cipolla, V.; Maganzi, M. PARSIFAL Project: A Breakthrough Innovation in Air Transport. Aerotec. Missili Spaz. 2018, 97, 40–46. [Google Scholar] [CrossRef] [Green Version]
- Frediani, A.; Cipolla, V.; Abu Salem, K.; Binante, V.; Scardaoni, M.P. Conceptual design of PrandtlPlane civil transport aircraft. Proc. Inst. Mech. Eng. Part G J. Aerosp. Eng. 2020, 234, 1675–1687. [Google Scholar] [CrossRef] [Green Version]
- Frediani, A.; Cipolla, V.; Salem, K.A.; Binante, V.; Scardaoni, M.P. On the preliminary design of PrandtlPlane civil transport aircraft. In Proceedings of the 7th EUCASS Conference (paper #546), Milano, Italy, 3–6 July 2017. [Google Scholar] [CrossRef]
- Oliviero, F.; Frediani, A.; Rizzo, E. Design of an airfreight system based on an innovative PrandtlPlane aircraft. In AIAA Paper No. 2015-1186; AIAA: Reston, VA, USA, 2015. [Google Scholar]
- Cipolla, V.; Salem, K.A.; Scardaoni, M.P.; Binante, V. Preliminary design and performance analysis of a box-wing transport aircraft. In AIAA Paper No. 2020-0267; AIAA: Reston, VA, USA, 2020. [Google Scholar]
- Cipolla, V.; Abu Salem, K.; Bachi, F. Preliminary stability analysis methods for PrandtlPlane aircraft in subsonic conditions. Aircr. Eng. Aerosp. Technol. 2019, 91, 525–537. [Google Scholar] [CrossRef] [Green Version]
- Carini, M.; Meheut, M.; Kanellopoulos, S.; Cipolla, V.; Salem, K.A. Aerodynamic analysis and optimization of a box-wing architecture for commercial airplanes. In AIAA Paper No. 2020-1285; AIAA: Reston, VA, USA, 2020. [Google Scholar]
- Frediani, A.; Cipolla, V.; Salem, K.A.; Binante, V.; Scardaoni, M.P. Preliminary transonic CFD analyses of a PrandtlPlane transport aircraft. Transp. Res. Procedia 2018, 29, 82–91. [Google Scholar]
- Scardaoni, M.P.; Montemurro, M.; Panettieri, E. PrandtlPlane wing-box least-weight design: A multi-scale optimisation approach. Aerosp. Sci. Technol. 2020, 106, 106156. [Google Scholar] [CrossRef]
- Cipolla, V.; Frediani, A.; Oliviero, F.; Pinucci, M.; Rizzo, E.; Rossi, R. Ultralight amphibious PrandtlPlane: The final design. In Proceedings of the Italian Association of Aeronautics and Astronautics XXII Conference, Naples, Italy, 9–12 September 2013. [Google Scholar]
- Frediani, A.; Cipolla, V.; Oliviero, F. IDINTOS: The first prototype of an amphibious PrandtlPlane-shaped aircraft, Aerotecnica Missili & Spazio. J. Aerosp. Sci. Technol. Syst. 2015, 94, 195–209. [Google Scholar]
- Zohlandt, C.N. Conceptual Design of High Subsonic PrandtlPlanes. Master’s Thesis, Delft University, Delft, The Netherlands, 2016. [Google Scholar]
- Schiktanz, D.; Scholz, D. Box wing fundamentals—An aircraft design perspective. In Proceedings of the German Aerospace Conference, Bremen, Germany, 27–29 September 2011; ISBN 978-3-932182-74-X. [Google Scholar]
- Andrews, S.; Perez, R. Multidisciplinary Analysis of a Box-Wing Aircraft Designed for a Regional-Jet Mission. In AIAA Paper No. 2015-2793; AIAA: Reston, VA, USA, 2015. [Google Scholar]
- Syamsudin, H. Development of an Approach and Tool to Improve the Conceptual-Design Process of Wing Box Structure of Low-Subsonic Transport Aircraft. Master’s Thesis, Cranfield University, Bedford, UK, 2009. [Google Scholar]
- Jemitola, P.; Fielding, J. Box Wing Aircraft Conceptual Design. In Proceedings of the 28th International Congress of the Aeronautical Sciences (ICAS), Brisbane, Australia, 23–28 September 2012. [Google Scholar]
- Jemitola, P. Conceptual Design and Optimization Methodology for Box Wing Aircraft. Ph.D. Thesis, Canfield University, Bedford, UK, 2012. [Google Scholar]
- Salam, I.R.; Bil, C. Multi-disciplinary analysis and optimisation methodology for conceptual design of a box-wing aircraft. Aeronaut. J. 2016, 120, 1315–1333. [Google Scholar] [CrossRef]
- Ribeiro, F.C.; de Paula, A.; Scholz, D.; Gil, R.; da Silva, A. Wing geometric parameter studies of a box wing aircraft configuration for subsonic flight. In Proceedings of the 7th EUCASS Conference (paper #447), Milano, Italy, 3–6 July 2017. [Google Scholar] [CrossRef]
- Khalid, A.; Kumar, P. Aerodynamic Optimization of Box Wing–A Case Study. Int. J. Aviat. Aeronaut. Aerospace 2014, 1, 6. [Google Scholar]
- Kumar, P.; Khalid, A. Analysis of aspect ratio and winglet height of a box wing design. In AIAA Paper No. 2014-3002; AIAA: Reston, VA, USA, 2014. [Google Scholar]
- Chau, T.; Zingg, D. Aerodynamic Shape Optimization of a Box-Wing Regional Aircraft Based on the Reynolds-Averaged Navier-Stokes Equations. In AIAA Paper No. 2017-3258; AIAA: Reston, VA, USA, 2017. [Google Scholar]
- Lee, J.Y.; Tan, K.J.; Wang, P.C. Parametric Investigation of Box Wing Configuration in Viscous Flow Regime. In AIAA Paper No. 2018-3814; AIAA: Reston, VA, USA, 2018. [Google Scholar]
- Russo, L.; Tognaccini, R.; Demasi, L. Box-Wing and Induced Drag: Compressibility Effects in Subsonic and Transonic Regimes. In AIAA Paper No. 2020-0447; AIAA: Reston, VA, USA, 2020. [Google Scholar]
- Gagnon, H.; Zingg, D.W. Aerodynamic Optimization Trade Study of a Box-Wing Aircraft Configuration. J. Aircr. 2016, 53, 971–981. [Google Scholar] [CrossRef] [Green Version]
- Pérez-Álvarez, J.; Cuerno-Rejado, C.; Meseguer, J. Aerodynamic parametric analysis of an unconventional joined-wing aircraft configuration. Proc. Inst. Mech. Eng. Part G J. Aerosp. Eng. 2016, 230, 1917–1933. [Google Scholar] [CrossRef] [Green Version]
- Jemitola, P.; Okonkwo, P. Review of Structural Issues in the Design of a Box Wing Aircraft. J. Aerosp. Eng. Mech. 2019, 3, 161–166. [Google Scholar]
- Jemitola, P.O.; Monterzino, G.; Fielding, J. Wing mass estimation algorithm for medium range box wing aircraft. Aeronaut. J. 2016, 117, 329–340. [Google Scholar] [CrossRef]
- Schiktanz, D.; Scholz, D. The Conflict of Aerodynamic Efficiency and Static Longitudinal Stability of Box Wing Aircraft. In Proceedings of the 3rd CEAS AirSpace Conference, Venice, Italy, 24–28 October 2011. [Google Scholar]
- Andrews, S.; Perez, R. Stability and Control Effects on the Design Optimization of a Box-Wing Aircraft. In AIAA Paper No. 2014-2592; AIAA: Reston, VA, USA, 2014. [Google Scholar]
- Caja-Calleja, R.; Scholz, D. Box Wing Flight Dynamics in the Stage of Conceptual Aircraft Design. In Proceedings of the German Aerospace Conference, Oberpfaffenhofen, Germany, 24–26 October 2012. [Google Scholar]
- Sousa, A.; de Paula, A.; Ribeiro, F.C.; Cardoso-Ribeiro, F. Box wing longitudinal flight quality evaluation. In AIAA Paper No. 2019-3490; AIAA: Reston, VA, USA, 2019. [Google Scholar]
- Frediani, A. The Prandtl Wing, from Innovative Configurations and Advanced Concepts for Future Civil transport Aircraft. In VKI Lecture Series; VKI: Sint-Genesius-Rode, Belgium, 2005. [Google Scholar]
- Frediani, A.; Montanari, G. Best wing system: An exact solution of the Prandtl’s problem. In Variational Analysis and Aerospace Engineering; Springer: New York, NY, USA, 2009; Volume 33. [Google Scholar]
- Bulat, M.P.; Bulat, P.V. Comparison of turbulence models in the calculation of supersonic separated flows. World Appl. Sci. J. 2013, 27, 1263–1266. [Google Scholar]
- Vassberg, J.C.; DeHaan, M.A.; Rivers, S.M.; Wahls, R.A. Development of a Common Research Model for Applied CFD Validation Studies. In AIAA Paper No. 2008-6919; AIAA: Reston, VA, USA, 2008. [Google Scholar]
- Lacy, D.; Sclafani, A. Development of the High-Lift Common Research Model (HL-CRM): A Representative High Lift Configuration for Transonic Transports. In AIAA Paper No. 2016-0308; AIAA: Reston, VA, USA, 2016. [Google Scholar]
- Brooks, T.; Kenway, G.; Martins, J. Benchmark Aero-structural Models for the Study of Transonic Aircraft Wings. AIAA J. 2018, 58, 2840–2855. [Google Scholar] [CrossRef]
- Rivers, M.B.; Dittberner, A. Experimental Investigation of the NASA Common Research Model. In AIAA Paper No. 2010-4218; AIAA: Reston, VA, USA, 2010. [Google Scholar]
- Keye, S.; Rudnik, R. Validation of Wing Deformation Simulations for the NASA CRM Model using Fluid-Structure Interaction Computations. In AIAA Paper No. 2015-0619; AIAA: Reston, VA, USA, 2015. [Google Scholar]
- Martínez-Val, R.; Pérez, E.; Palacín, J.F. Historical evolution of air transport productivity and efficiency. In AIAA Paper No. 2005-121; AIAA: Reston, VA, USA, 2005. [Google Scholar]
- Redonnet, S.; Desquesnes, G.; Manoha, E.; Parzani, C. Numerical Study of Acoustic Installation Effects with a CAA method. AIAA J. 2010, 48, 929–937. [Google Scholar] [CrossRef]
- Andrews, S.A.; Perez, R.E. Comparison of box-wing and conventional aircraft mission performance using multidisciplinary analysis and optimization. Aerosp. Sci. Technol. 2018, 79, 336–351. [Google Scholar] [CrossRef]
Publisher’s Note: MDPI stays neutral with regard to jurisdictional claims in published maps and institutional affiliations. |
© 2022 by the authors. Licensee MDPI, Basel, Switzerland. This article is an open access article distributed under the terms and conditions of the Creative Commons Attribution (CC BY) license (https://creativecommons.org/licenses/by/4.0/).