2.2. Miscibility Studies
The miscibility between candidate polymeric carriers and plasticizers was systematically investigated to identify suitable systems for the development of IND-ASDs intended for HME and FDM 3D printing. The components’ miscibility during ASD preparation is closely related to the physical stability of the system [
32,
33], as immiscibility may lead to phase separation and increased recrystallization tendency of the API [
34]. However, reliable prediction of drug–polymer miscibility remains challenging, and no single method can provide a definitive assessment [
32]. Although differential scanning calorimetry (DSC) and the identification of a single Tg are commonly employed, this approach presents limitations in multicomponent systems due to overlapping transitions and reduced sensitivity [
35]. In this context, hot-stage microscopy (HSM) was employed as a practical and process-relevant tool to evaluate melt-state behavior under conditions relevant to HME. HSM enables direct visualization of phase behavior during heating, allowing identification of phase separation or crystalline remnants. Within the scope of the present study, HSM was considered sufficient as a preliminary screening method to assess melt-state compatibility, which is a critical prerequisite for successful ASD formation via HME.
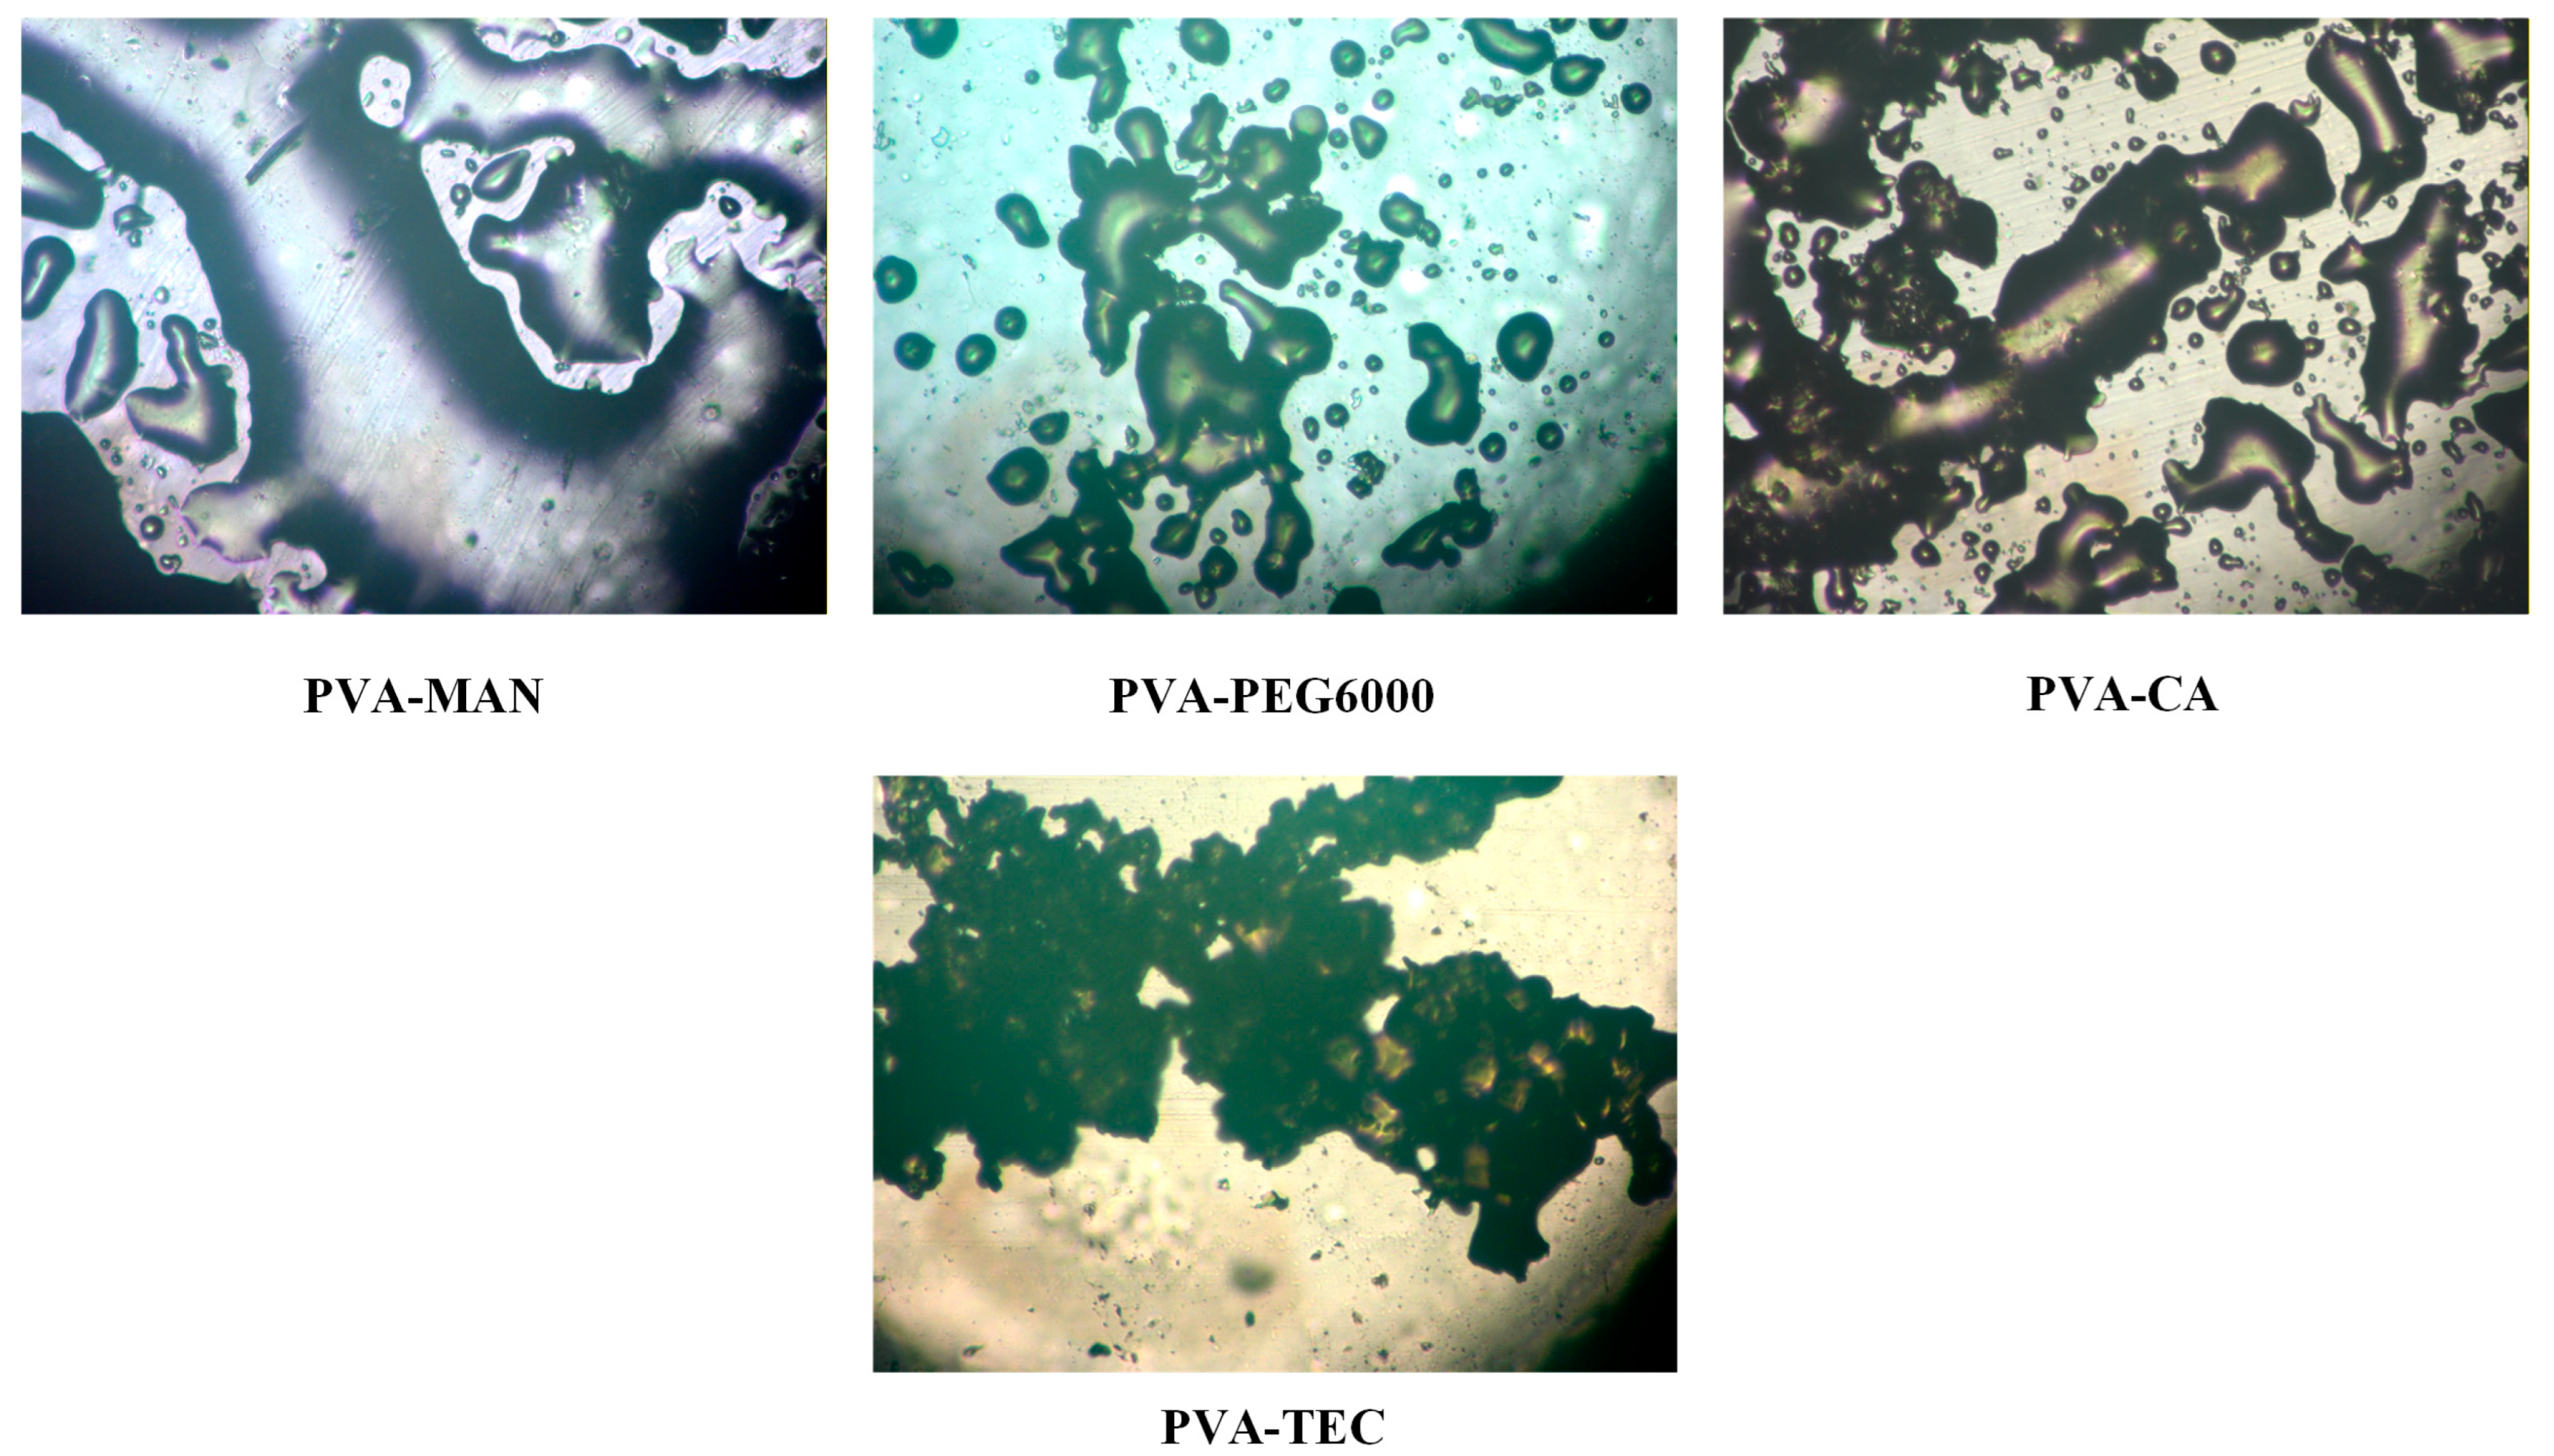
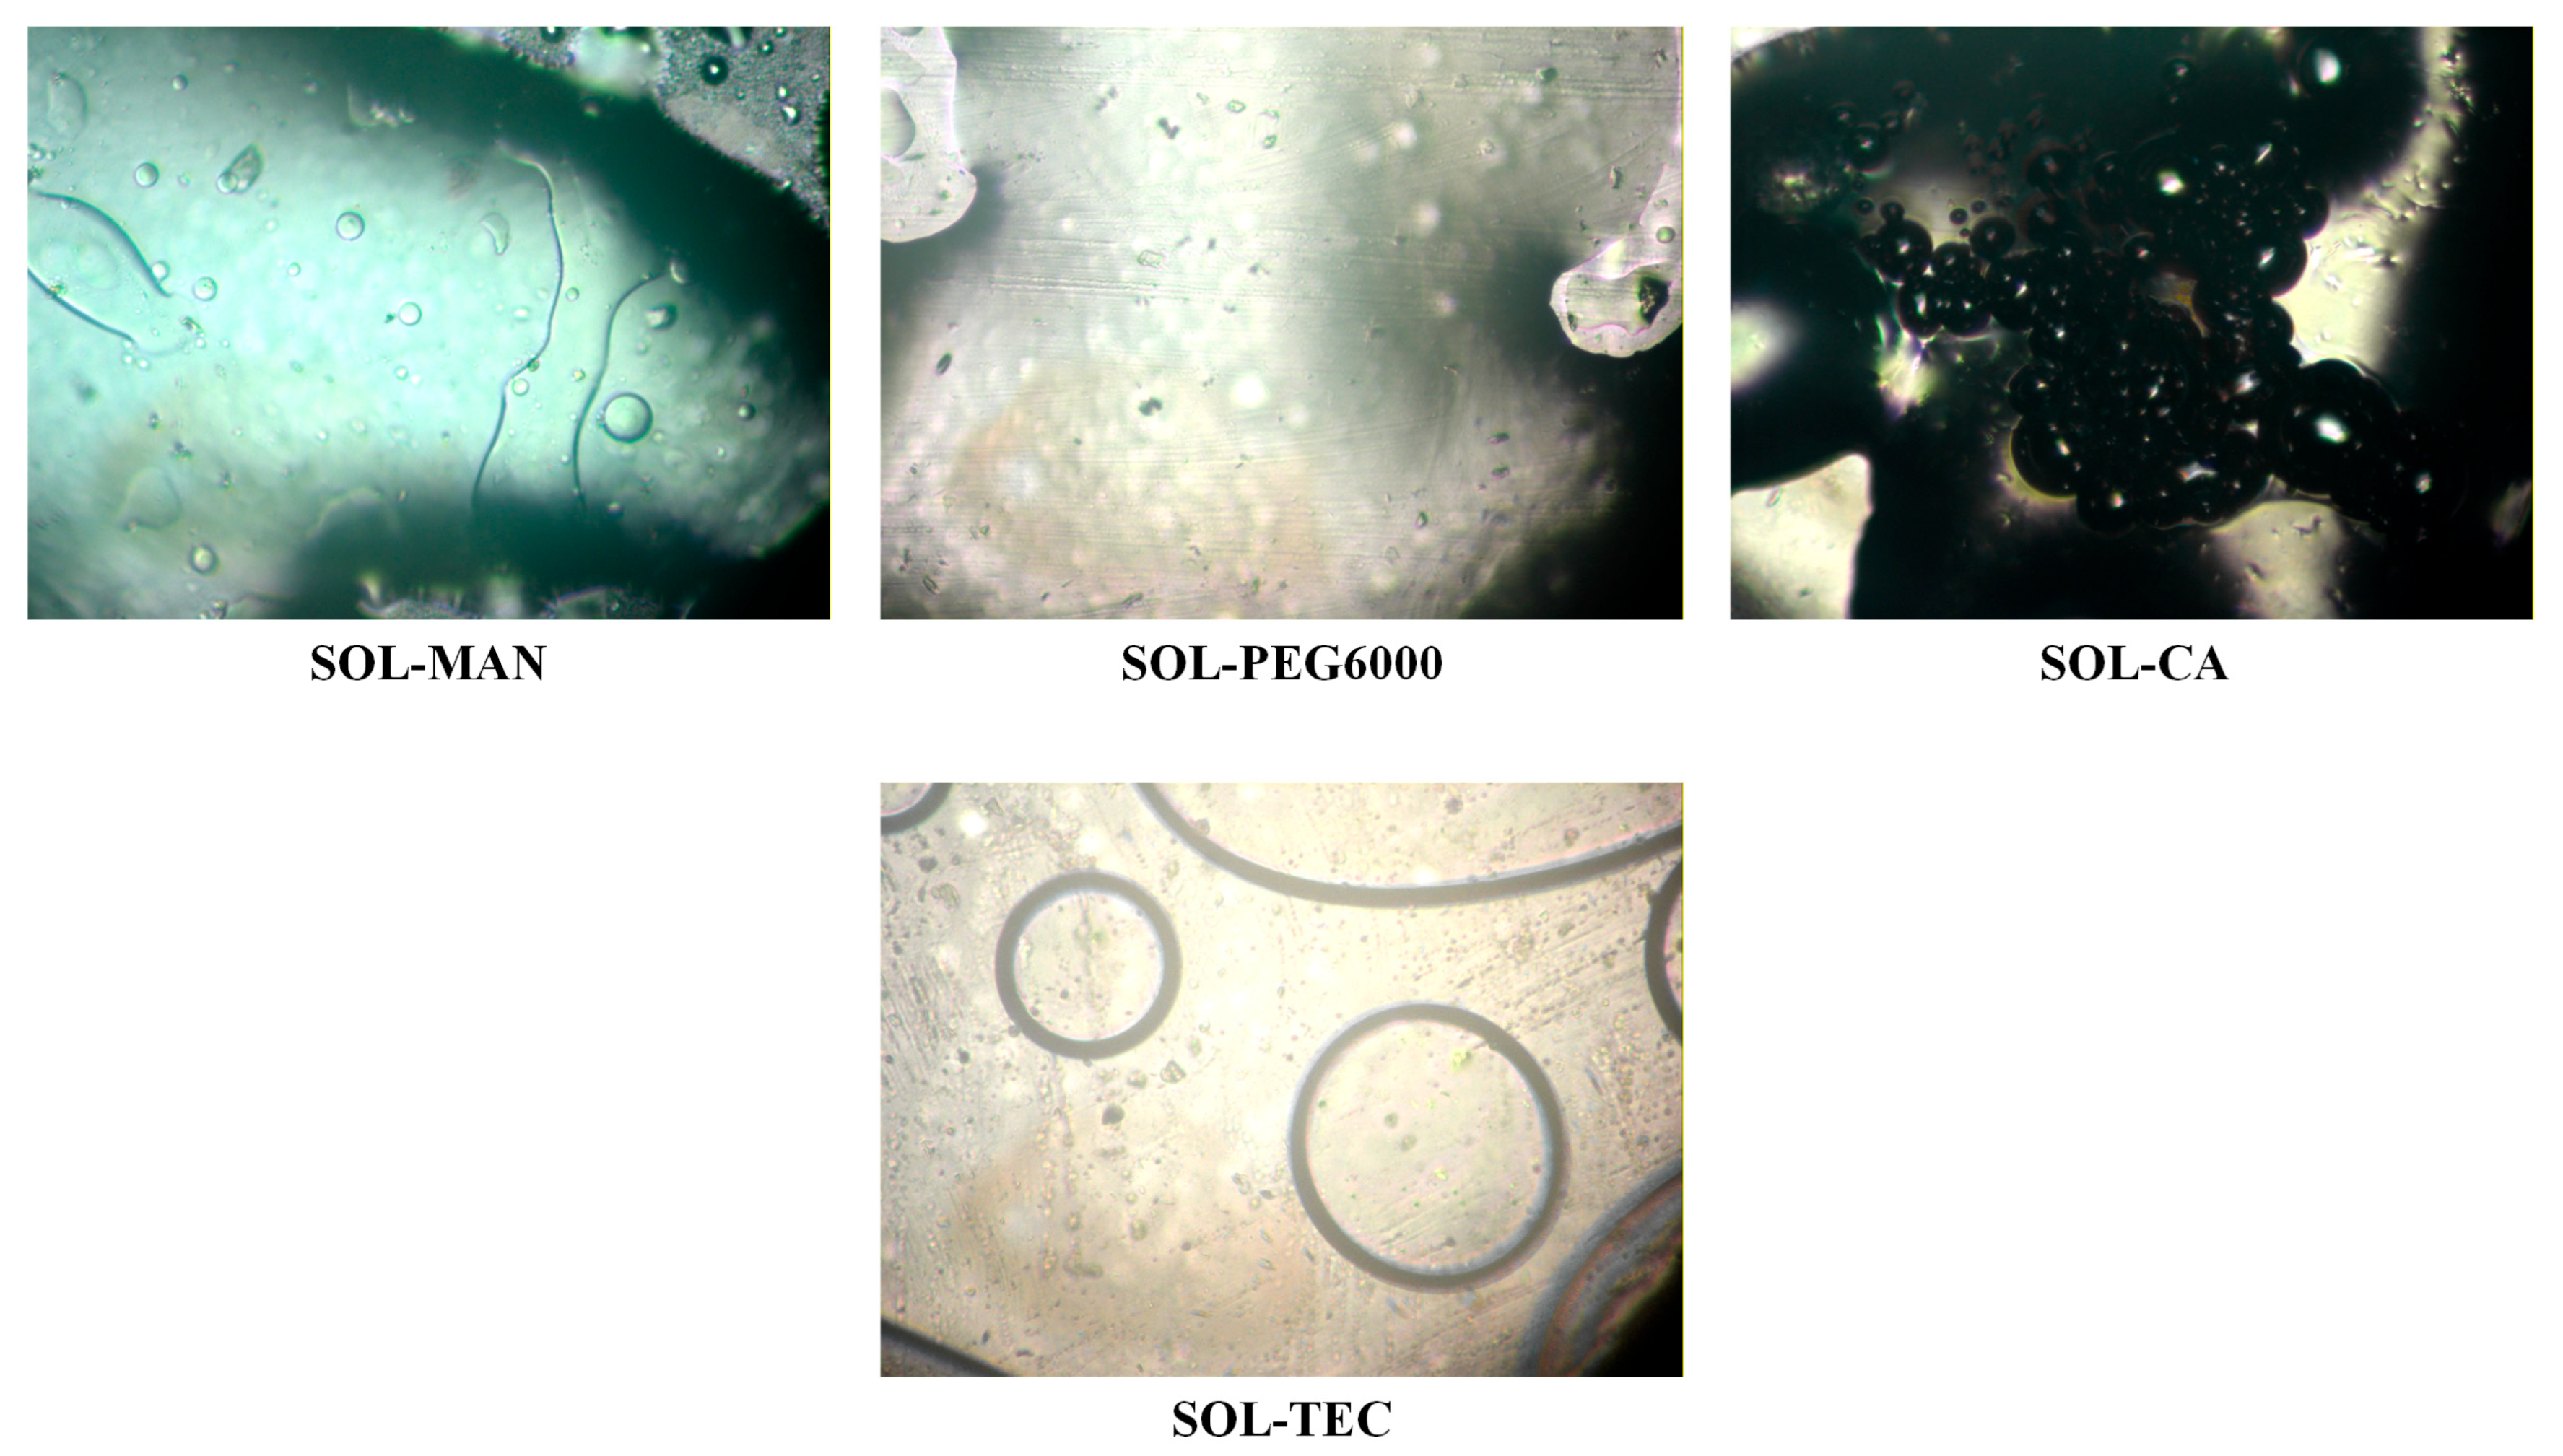
Initially, the miscibility of PVA and SOL with the selected plasticizers (i.e., MAN, PEG6000, CA, and TEC) was evaluated in the molten state using HSM. Representative photographs are presented in
Figure 2 and
Figure 3.
As shown in
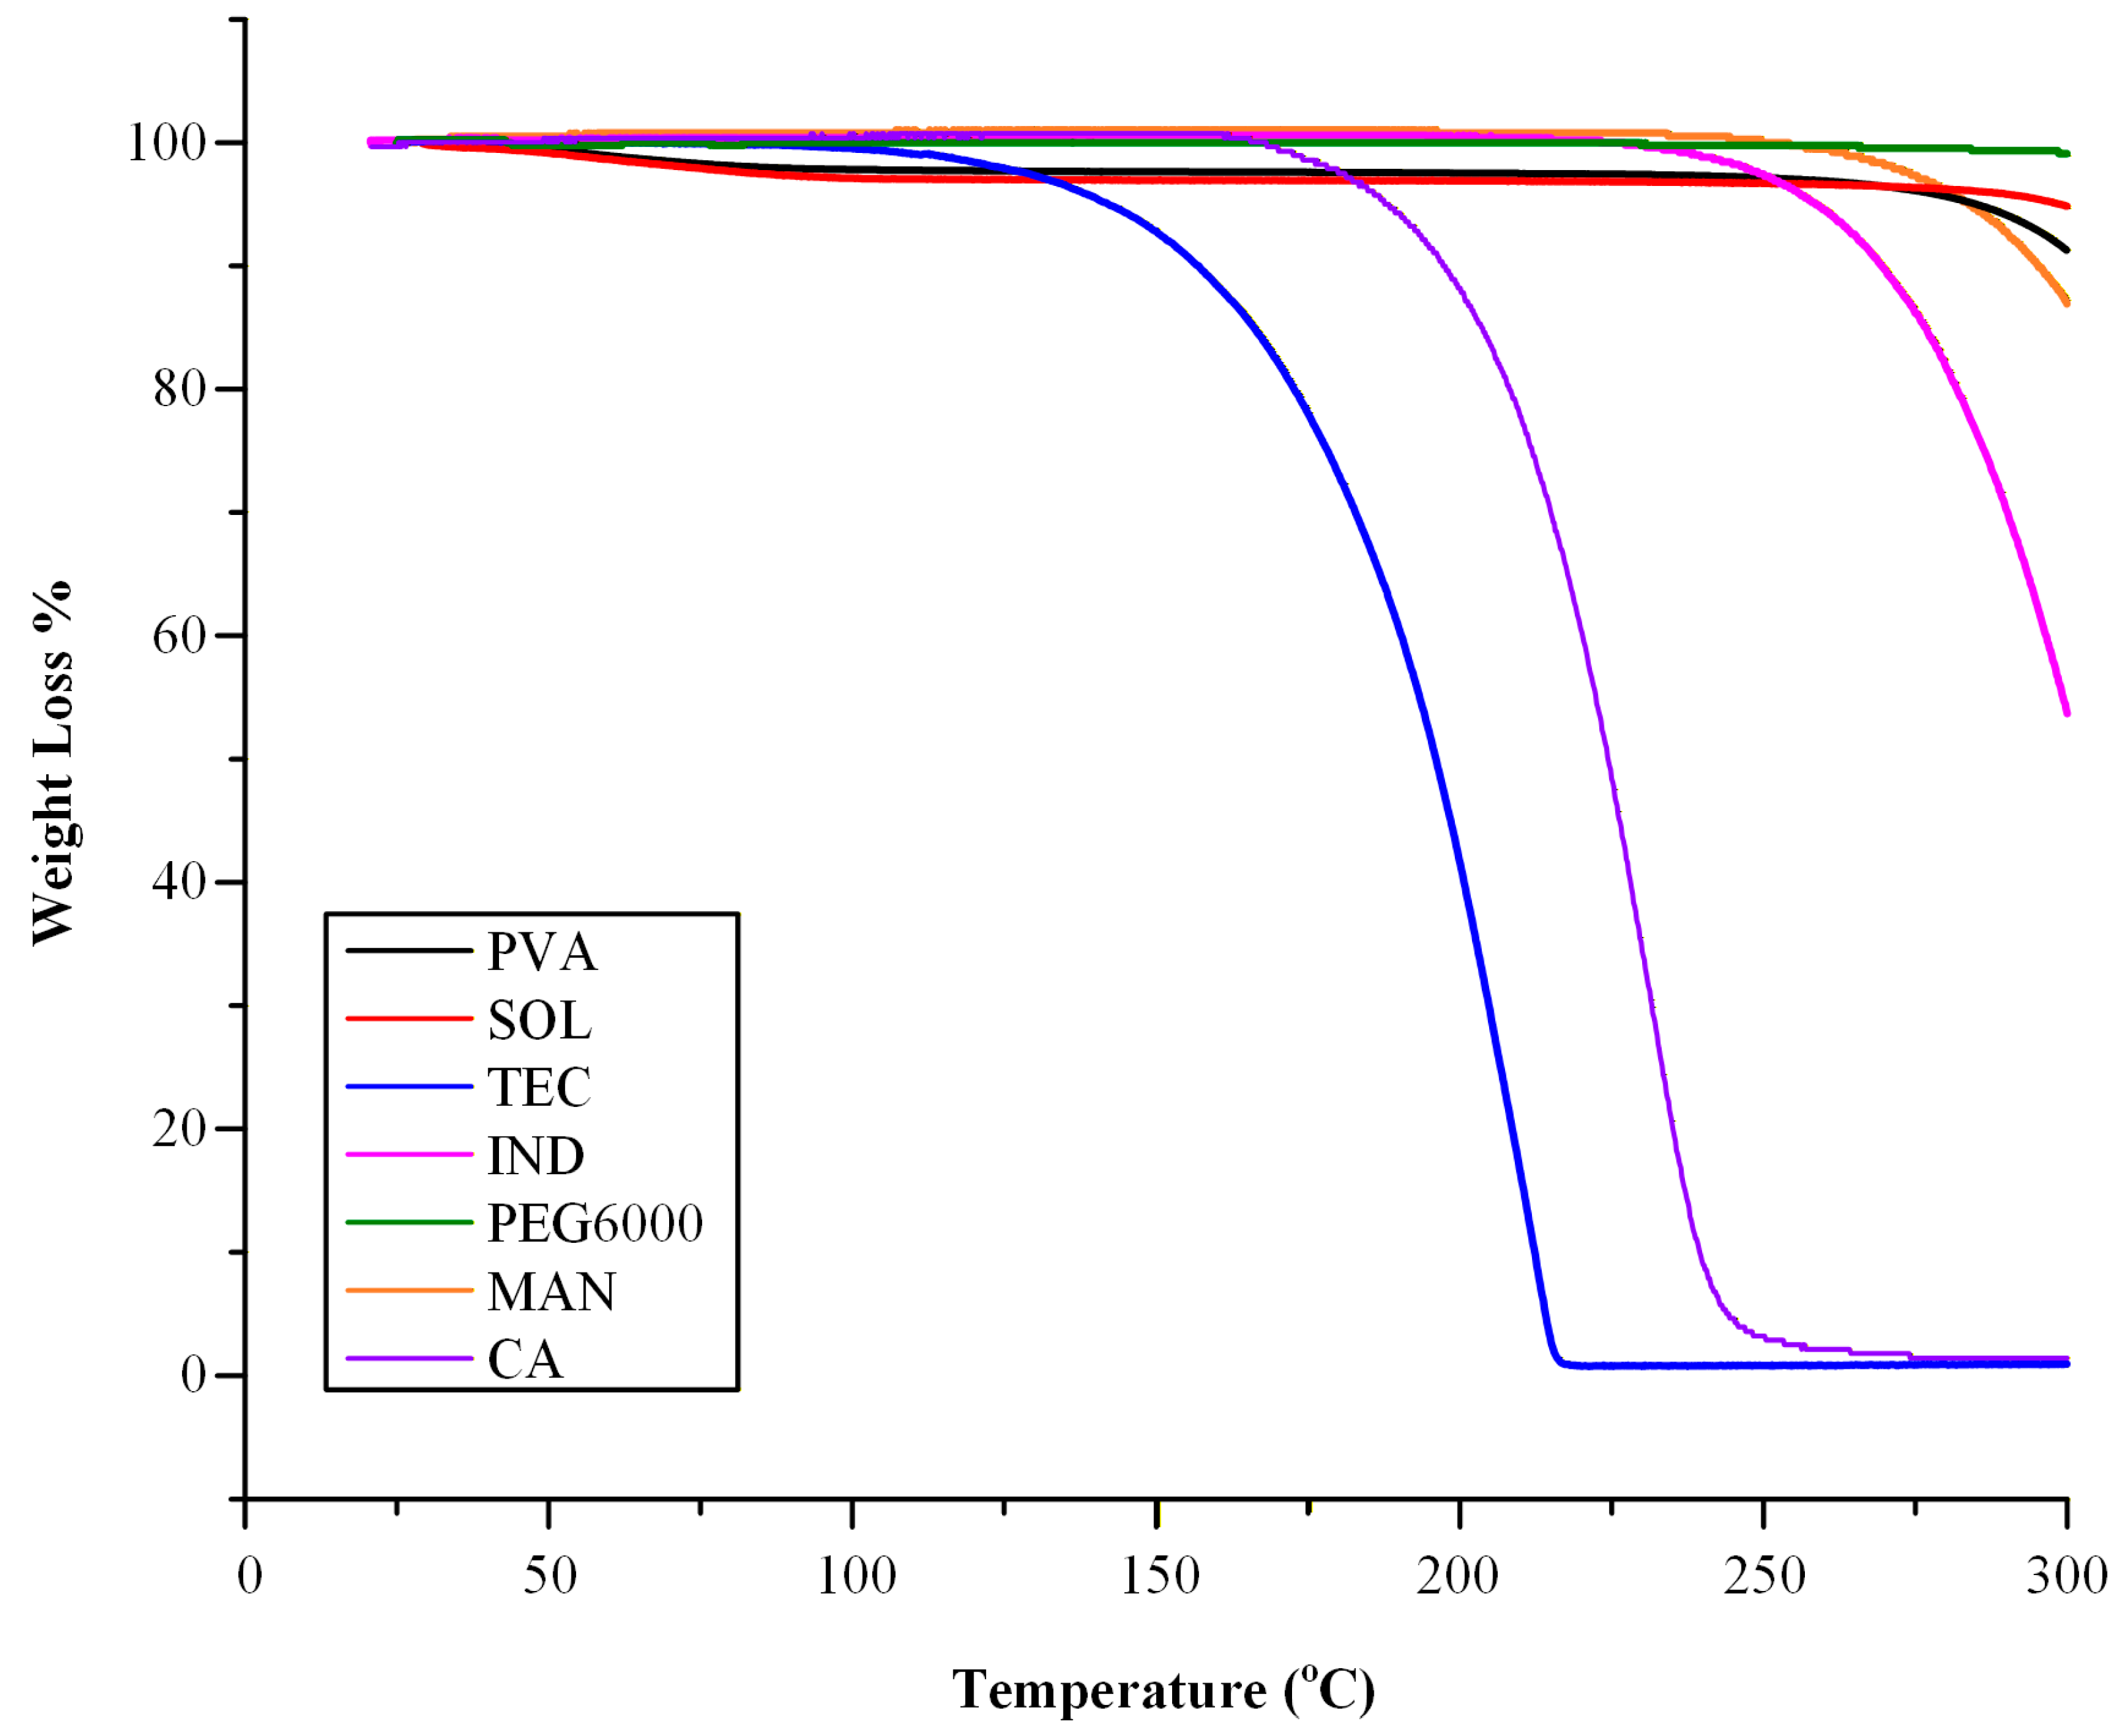
Figure 2, PVA exhibited satisfactory miscibility with both MAN and PEG 6000, as indicated by the formation of homogeneous molten phases without visible phase separation. In contrast, in the PVA-CA and PVA-TEC systems, thermal degradation of the plasticizers was observed at temperatures approaching the melting point of PVA, rendering these combinations unsuitable for further development under the examined processing conditions.
The miscibility behavior of SOL differed depending on the plasticizer employed (
Figure 3). The SOL-MAN and SOL-CA systems displayed clear phase separation during melting, forming distinct molten regions and indicating lack of miscibility. Conversely, both SOL-PEG6000 and SOL-TEC systems formed uniform molten phases without visible separation, suggesting favorable miscibility and thermal compatibility.
Based on these findings, four polymer–plasticizer systems (i.e., PVA-MAN, PVA-PEG 6000, SOL-PEG6000, and SOL-TEC) were further evaluated in the presence of IND to assess their suitability for ASD formation.
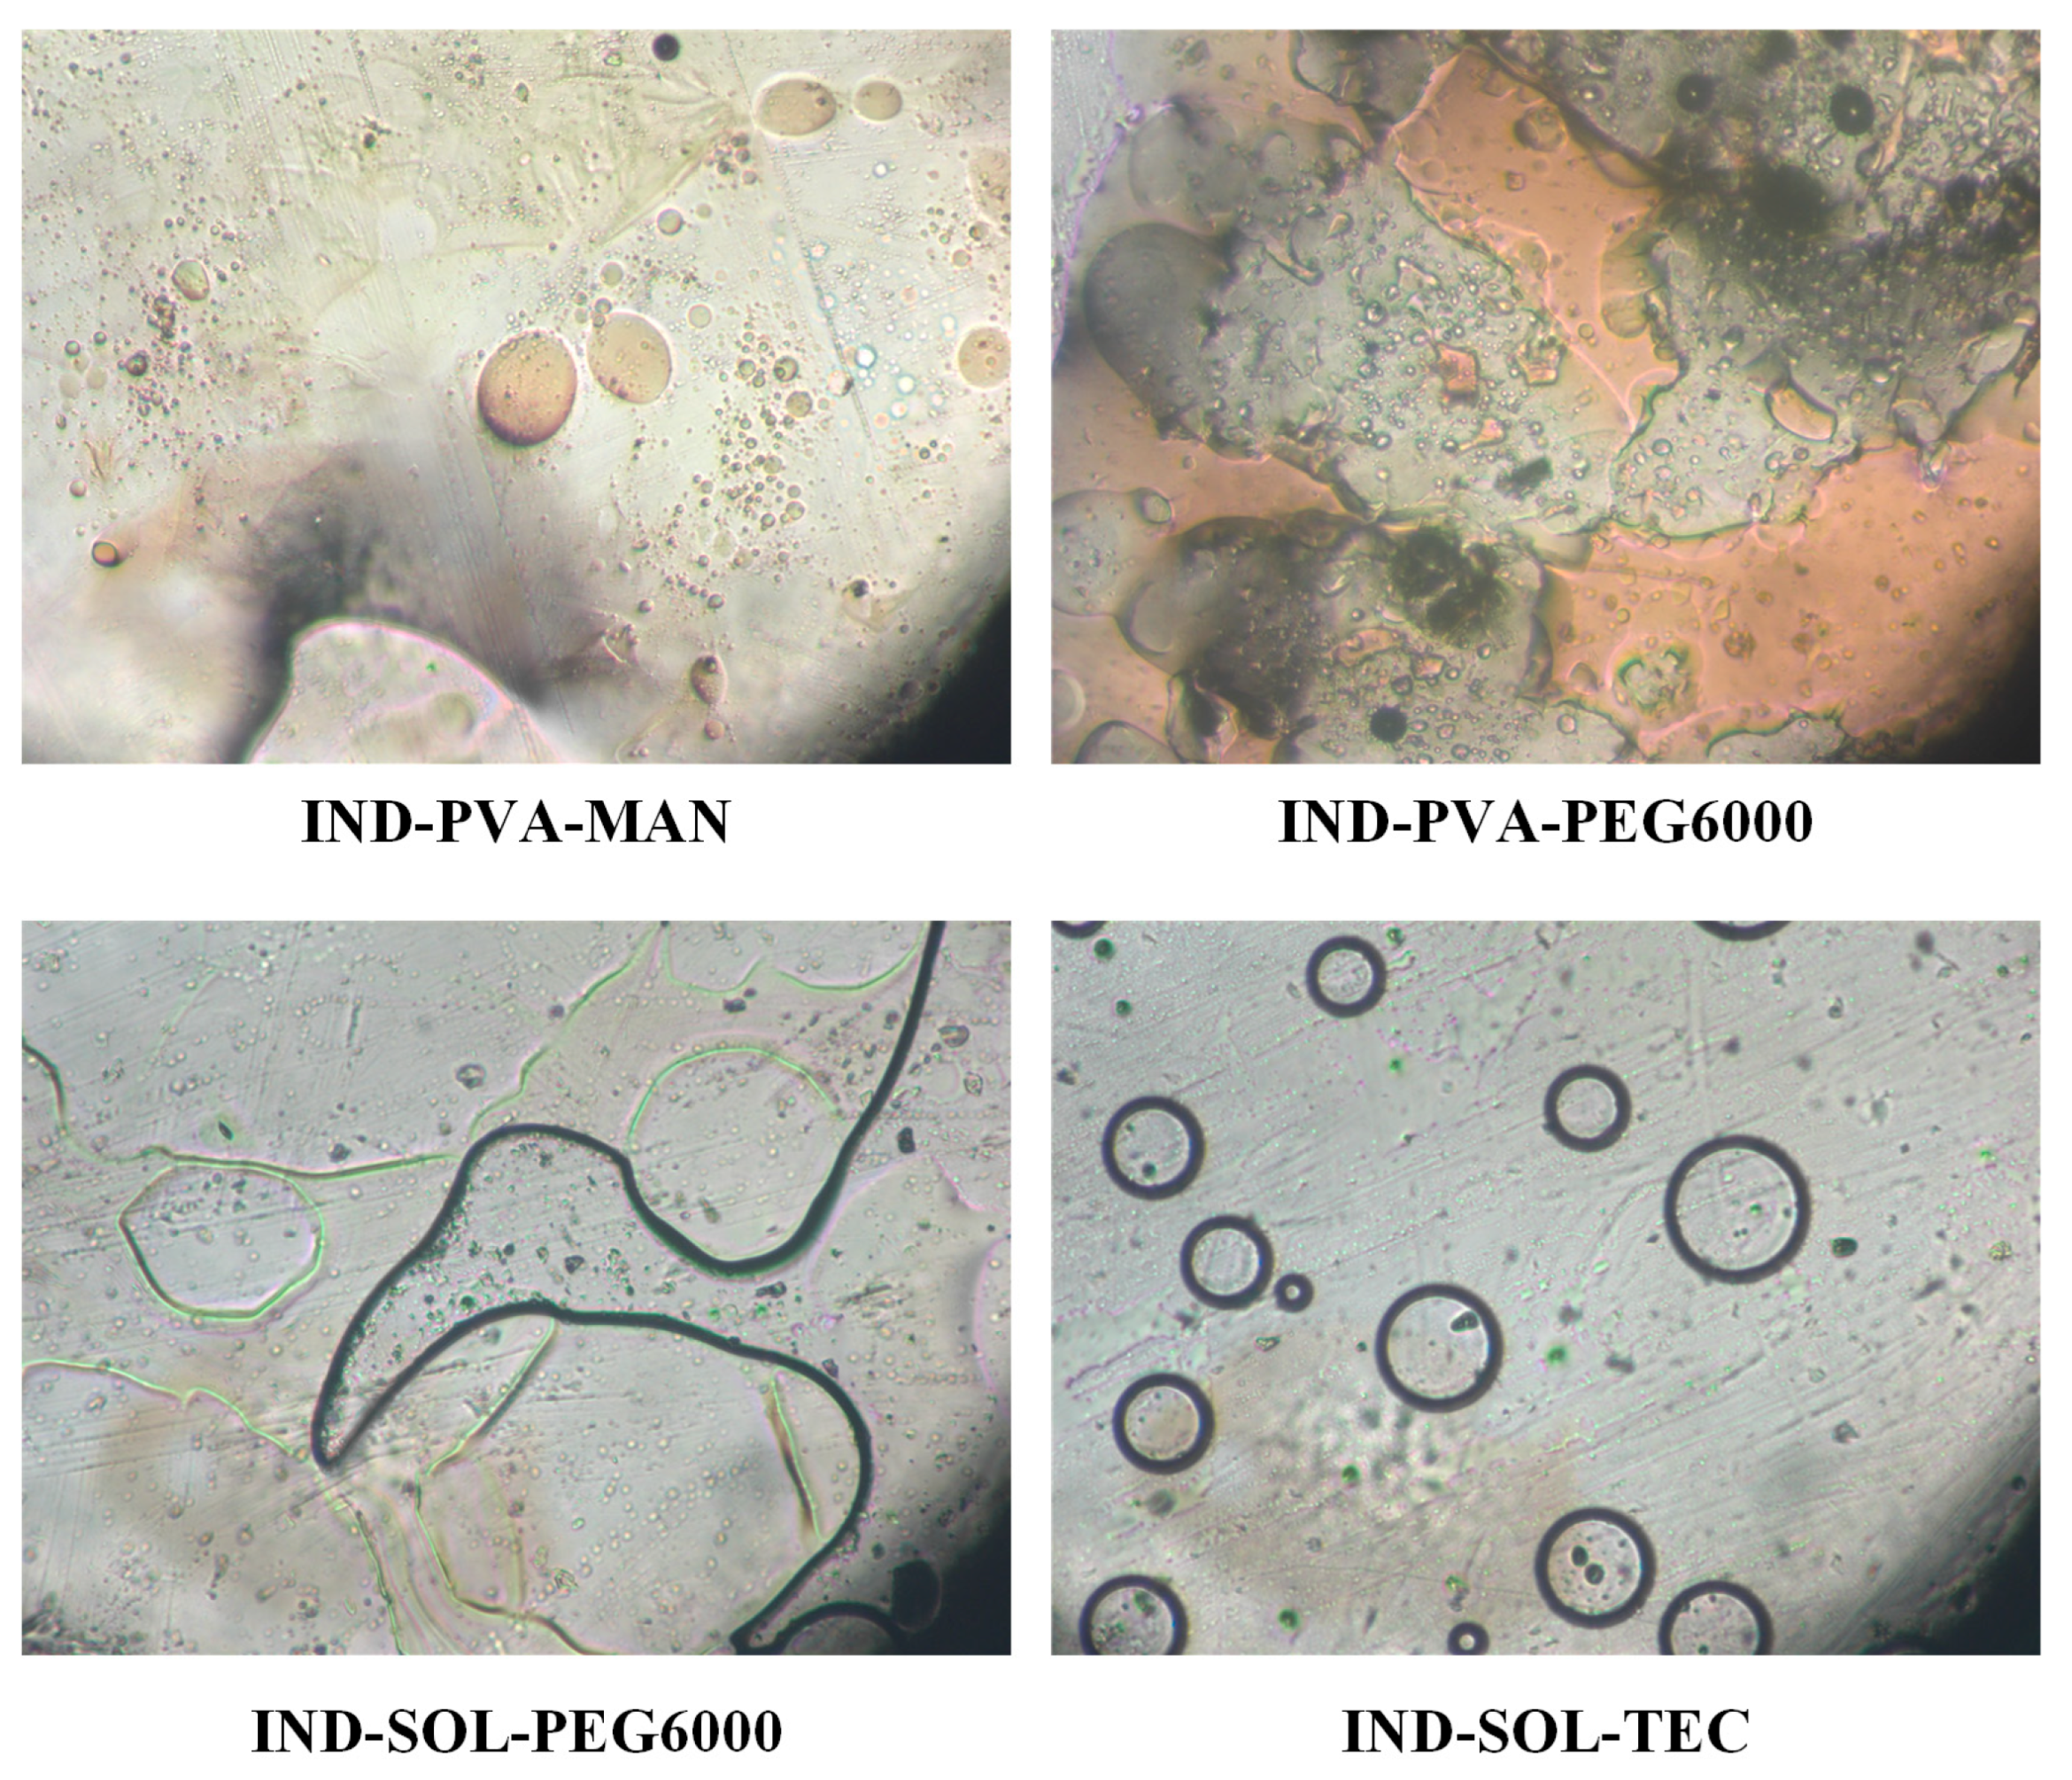
The incorporation of IND significantly affected system miscibility. As illustrated in
Figure 4, all PVA-based ternary systems exhibited pronounced phase separation upon melting, regardless of the plasticizer used. Distinct molten domains corresponding to individual components were observed, indicating inadequate miscibility and limited potential for homogeneous ASD formation. Consequently, IND-PVA-MAN and IND-PVA-PEG6000 systems were excluded from further investigation.
For SOL-based systems, different behaviors were observed. The IND-SOL-PEG6000 system exhibited phase separation, indicating poor miscibility among the components. In contrast, the IND-SOL-TEC system formed a single homogeneous molten phase without visible separation, demonstrating satisfactory miscibility between IND, SOL, and TEC. Based on these results, SOL was selected as the polymeric carrier and TEC as the plasticizer for subsequent HME and FDM optimization studies.
2.3. Selection of Plasticizer Content
Following the identification of SOL and TEC as the most suitable polymer–plasticizer combination based on miscibility studies, preliminary HME experiments were conducted to determine the optimal TEC concentration required to produce FILs with appropriate handling properties.
Three formulations containing a fixed IND loading of 10% w/w and varying TEC concentrations (5, 10, and 15% w/w) were prepared and extruded under identical processing conditions. The investigated concentration range (5–15% w/w) was selected to systematically modulate the extent of polymer plasticization while remaining within the plasticizer levels commonly reported for printable pharmaceutical FILs.
Plasticizers such as TEC function by reducing intermolecular polymer–polymer interactions, increasing free volume, and lowering the glass transition temperature (Tg) of the matrix. This Tg depression reduces segmental relaxation time and melt viscosity, thereby decreasing extrusion torque and facilitating continuous strand formation. However, excessive reduction in Tg may compromise solid-state mechanical strength by increasing molecular mobility at ambient conditions [
36,
37]. Thus, plasticizer concentration must be optimized to achieve sufficient melt flow during HME while preserving FIL stiffness required for reliable feeding during FDM.
Evidence supporting this range is provided by Maru et al. [
38], who evaluated the impact of TEC (and PEG 6000) on the thermal and rheological behavior of HME formulations and reported that TEC at 5–10%
w/
w enabled suitable processing by HME, demonstrating substantial plasticization efficiency at relatively low concentrations. The authors further demonstrated that increasing TEC loading progressively altered rheological behavior, with higher concentrations leading to marked viscosity reduction and changes in shear-thinning characteristics, confirming the strong plasticization efficiency of TEC in melt-processed systems. These findings support the investigation of TEC at relatively low levels as a starting point for achieving adequate melt processability without excessive softening of the polymeric matrix. In addition, a broad formulation survey by Pereira et al. [
28] compiling HME-FDM FIL studies reported that the plasticizer content typically ranges between ~5% and 20%
w/
w across printable pharmaceutical formulations.
At this study, FILs prepared with 5% w/w TEC exhibited pronounced brittleness and fractured easily during handling, indicating insufficient plasticization of the polymeric matrix. Similarly, FILs containing 15% w/w TEC demonstrated increased fragility, likely due to over-plasticization of the system and reduced structural cohesion. In contrast, FILs produced with 10% w/w TEC displayed improved flexibility, and sufficient mechanical strength to withstand handling and further processing. Based on these observations, a TEC concentration of 10% w/w was selected as the optimal plasticizer content for subsequent formulation development, HME optimization, and FDM 3D printing studies. This concentration provided a balanced combination of flexibility and mechanical robustness, ensuring the production of FILs suitable for continuous feeding during 3D printing while maintaining formulation stability.
2.4. DoE-Driven Optimization of HME FILs: Performance–Sustainability Relationships
A DoE framework was applied to simultaneously optimize FIL manufacturability and key quality attributes while explicitly quantifying electrical energy consumption (Y
1) as a sustainability-relevant response and FIL extrusion yield (Y
2), IND’s encapsulation efficiency (Y
3) and IND’s residual crystallinity (Y
4) as drug formulation-relevant responses. The experimental design and corresponding response values obtained from the factorial DoE are summarized in
Table 1. The investigated design space was defined by two critical process and formulation variables: IND loading (5–20%
w/
w) and extrusion temperature (110–150 °C). These factors were selected based on preliminary formulation screening and thermal stability considerations, with the aim of simultaneously optimizing FIL performance and reducing the environmental footprint associated with HME processing. The experimental results revealed a measurable variation across all responses, confirming the sensitivity of FIL properties and process sustainability metrics to both formulation composition and processing temperature.
Across the experimental runs, Y
1 ranged from 0.144 to 0.188 KWh per extrusion run, demonstrating measurable differences in electrical demand within the studied formulation-process space. Electrical energy demand during HME arises from both thermal heating requirements and mechanical work associated with melt transport and shear. Recent quantitative assessments show that electricity demand can be a dominant driver of the CO
2 footprint of pharmaceutical 3D printing, and that parameter optimization can meaningfully reduce energy consumption and associated emissions [
21]. Therefore, minimizing Y
1 provides a rational pathway to reduce climate impact during melt-based processing.
Electrical energy consumption is defined as
, where
V is the applied voltage and
I the current intensity. Therefore, variations in recorded current profiles directly reflect changes in mechanical resistance and melt rheology during processing. To evaluate energy consumption, the average voltage and current values were calculated for each triplicate extrusion under identical DoE conditions. The corresponding profiles are provided in the
Supplementary Material (Figures S1 and S2). The differences observed in the total data recording duration across the electrical profiles correspond to the total time required for complete extrusion of the entire feed material from the extruder. In all experimental runs, the same mass of physical mixture (PM) was introduced as feed; however, the time required to complete extrusion varied depending on the processing conditions. These differences are attributed to variations in melt rheology, which influence mass transport through the screw and die, and consequently affect the overall extrusion rate. Therefore, the differing time scales presented in the electrical recording diagrams do not reflect differences in initial feed quantity but rather the processing time necessary under each specific formulation–temperature combination.
ANOVA indicated that the selected factorial model for Y
1 was significant (
p < 0.0001), with A (IND content), B (extrusion temperature), and AB interaction all statistically significant terms (
Table 2). The model showed strong fit statistics (R
2 ≈ 0.92; predicted R
2 ≈ 0.82; adequate precision ≈ 16), and diagnostic plots supported model adequacy (no transformation required; acceptable residual behavior; no influential outliers). The coded model for Y
1 (Y
1 = 0.1624 − 0.0064*A + 0.0120*B − 0.0027*AB) indicated a negative coefficient for A and a positive coefficient for B, demonstrating that increasing drug loading decreased energy demand, whereas increasing extrusion temperature increased energy demand; the significant AB term confirmed that the effect of temperature depended on drug loading. At first glance, the positive temperature-energy correlation is intuitive: higher barrel temperatures require greater electrical heating power and may increase heat losses to the environment. However, the effect of drug loading on energy consumption requires deeper mechanistic interpretation.
IND, when incorporated at elevated concentrations, likely reduces the effective melt viscosity of the SOL-TEC matrix under the examined conditions. Although IND does not reach its crystalline melting point at 110 °C, it can dissolve into the polymeric melt, behaving as a low-molecular-weight component that perturbs polymer–polymer interactions and increases free volume [
39]. In SOL-based systems, such effects have been associated with modifications in thermal behavior, including depression of the Tg, which is indicative of increased molecular mobility within the polymer matrix [
40]. This Tg reduction is interpreted as a manifestation of plasticization and is associated with reduced melt resistance and enhanced chain mobility under processing conditions. Such drug-induced plasticization [
41] reduces chain entanglement density and lowers shear resistance within the extruder. Because mechanical energy input during HME is proportional to torque and shear stress, reduced melt viscosity translates into lower mechanical work requirements [
36]. In this context, the decrease in energy demand observed in the present study is consistent with a potential reduction in melt resistance during extrusion at higher drug loadings. However, it should be emphasized that this interpretation is based on indirect evidence derived from energy consumption trends and literature-reported thermal behavior and was not directly confirmed through rheological measurements. Therefore, the relationship between drug loading and melt viscosity should be considered a mechanistically supported hypothesis rather than a directly validated causal relationship.
The negative coefficient of drug loading in the Y1 model therefore suggests that IND contributes to viscosity modulation, decreasing mechanical energy demand. The significant interaction between temperature and drug loading further indicates that this plasticization effect becomes more pronounced at elevated temperatures, where diffusion and mixing efficiency increase.
Extrusion yield (Y2) varied considerably across the experimental domain, ranging from approximately 24% to 47%. ANOVA demonstrated that both IND loading (A) and extrusion temperature (B) significantly affected extrusion yield. Model coefficients (Y2 = 36.50 + 3.88*A − 6.02*B) indicated that increasing drug loading positively influenced Y2, whereas increasing extrusion temperature exerted a negative effect, likely due to increased material softening and adhesion phenomena at elevated temperatures that may compromise material recovery.
Encapsulation efficiency (Y
3) ranged from values in the mid-80% region to slightly above 110% across the design space (
Table 1). ANOVA identified IND loading (A), extrusion temperature (B), and their interaction (AB) as significant contributors to Y
3 variability. Model coefficients (Y
3 = 93.76 − 6.61*A + 5.86*B − 3.37*AB) indicated that increasing drug loading tended to decrease encapsulation efficiency, whereas increasing extrusion temperature improved drug incorporation within the polymeric matrix. This behavior is consistent with enhanced melt homogeneity and drug dispersion at elevated processing temperatures. Encapsulation values exceeding 100% were observed in selected runs, which may be attributed to analytical variability, sampling heterogeneity, or minor deviations in calibration and weighing accuracy at low sample masses. Importantly, the analytical method was applied consistently across all experimental runs, and the observed trends remained internally coherent with formulation and processing variables. Therefore, the data are considered suitable for comparative evaluation within the DoE framework, where relative differences between conditions are of primary relevance.
Residual crystallinity (Y
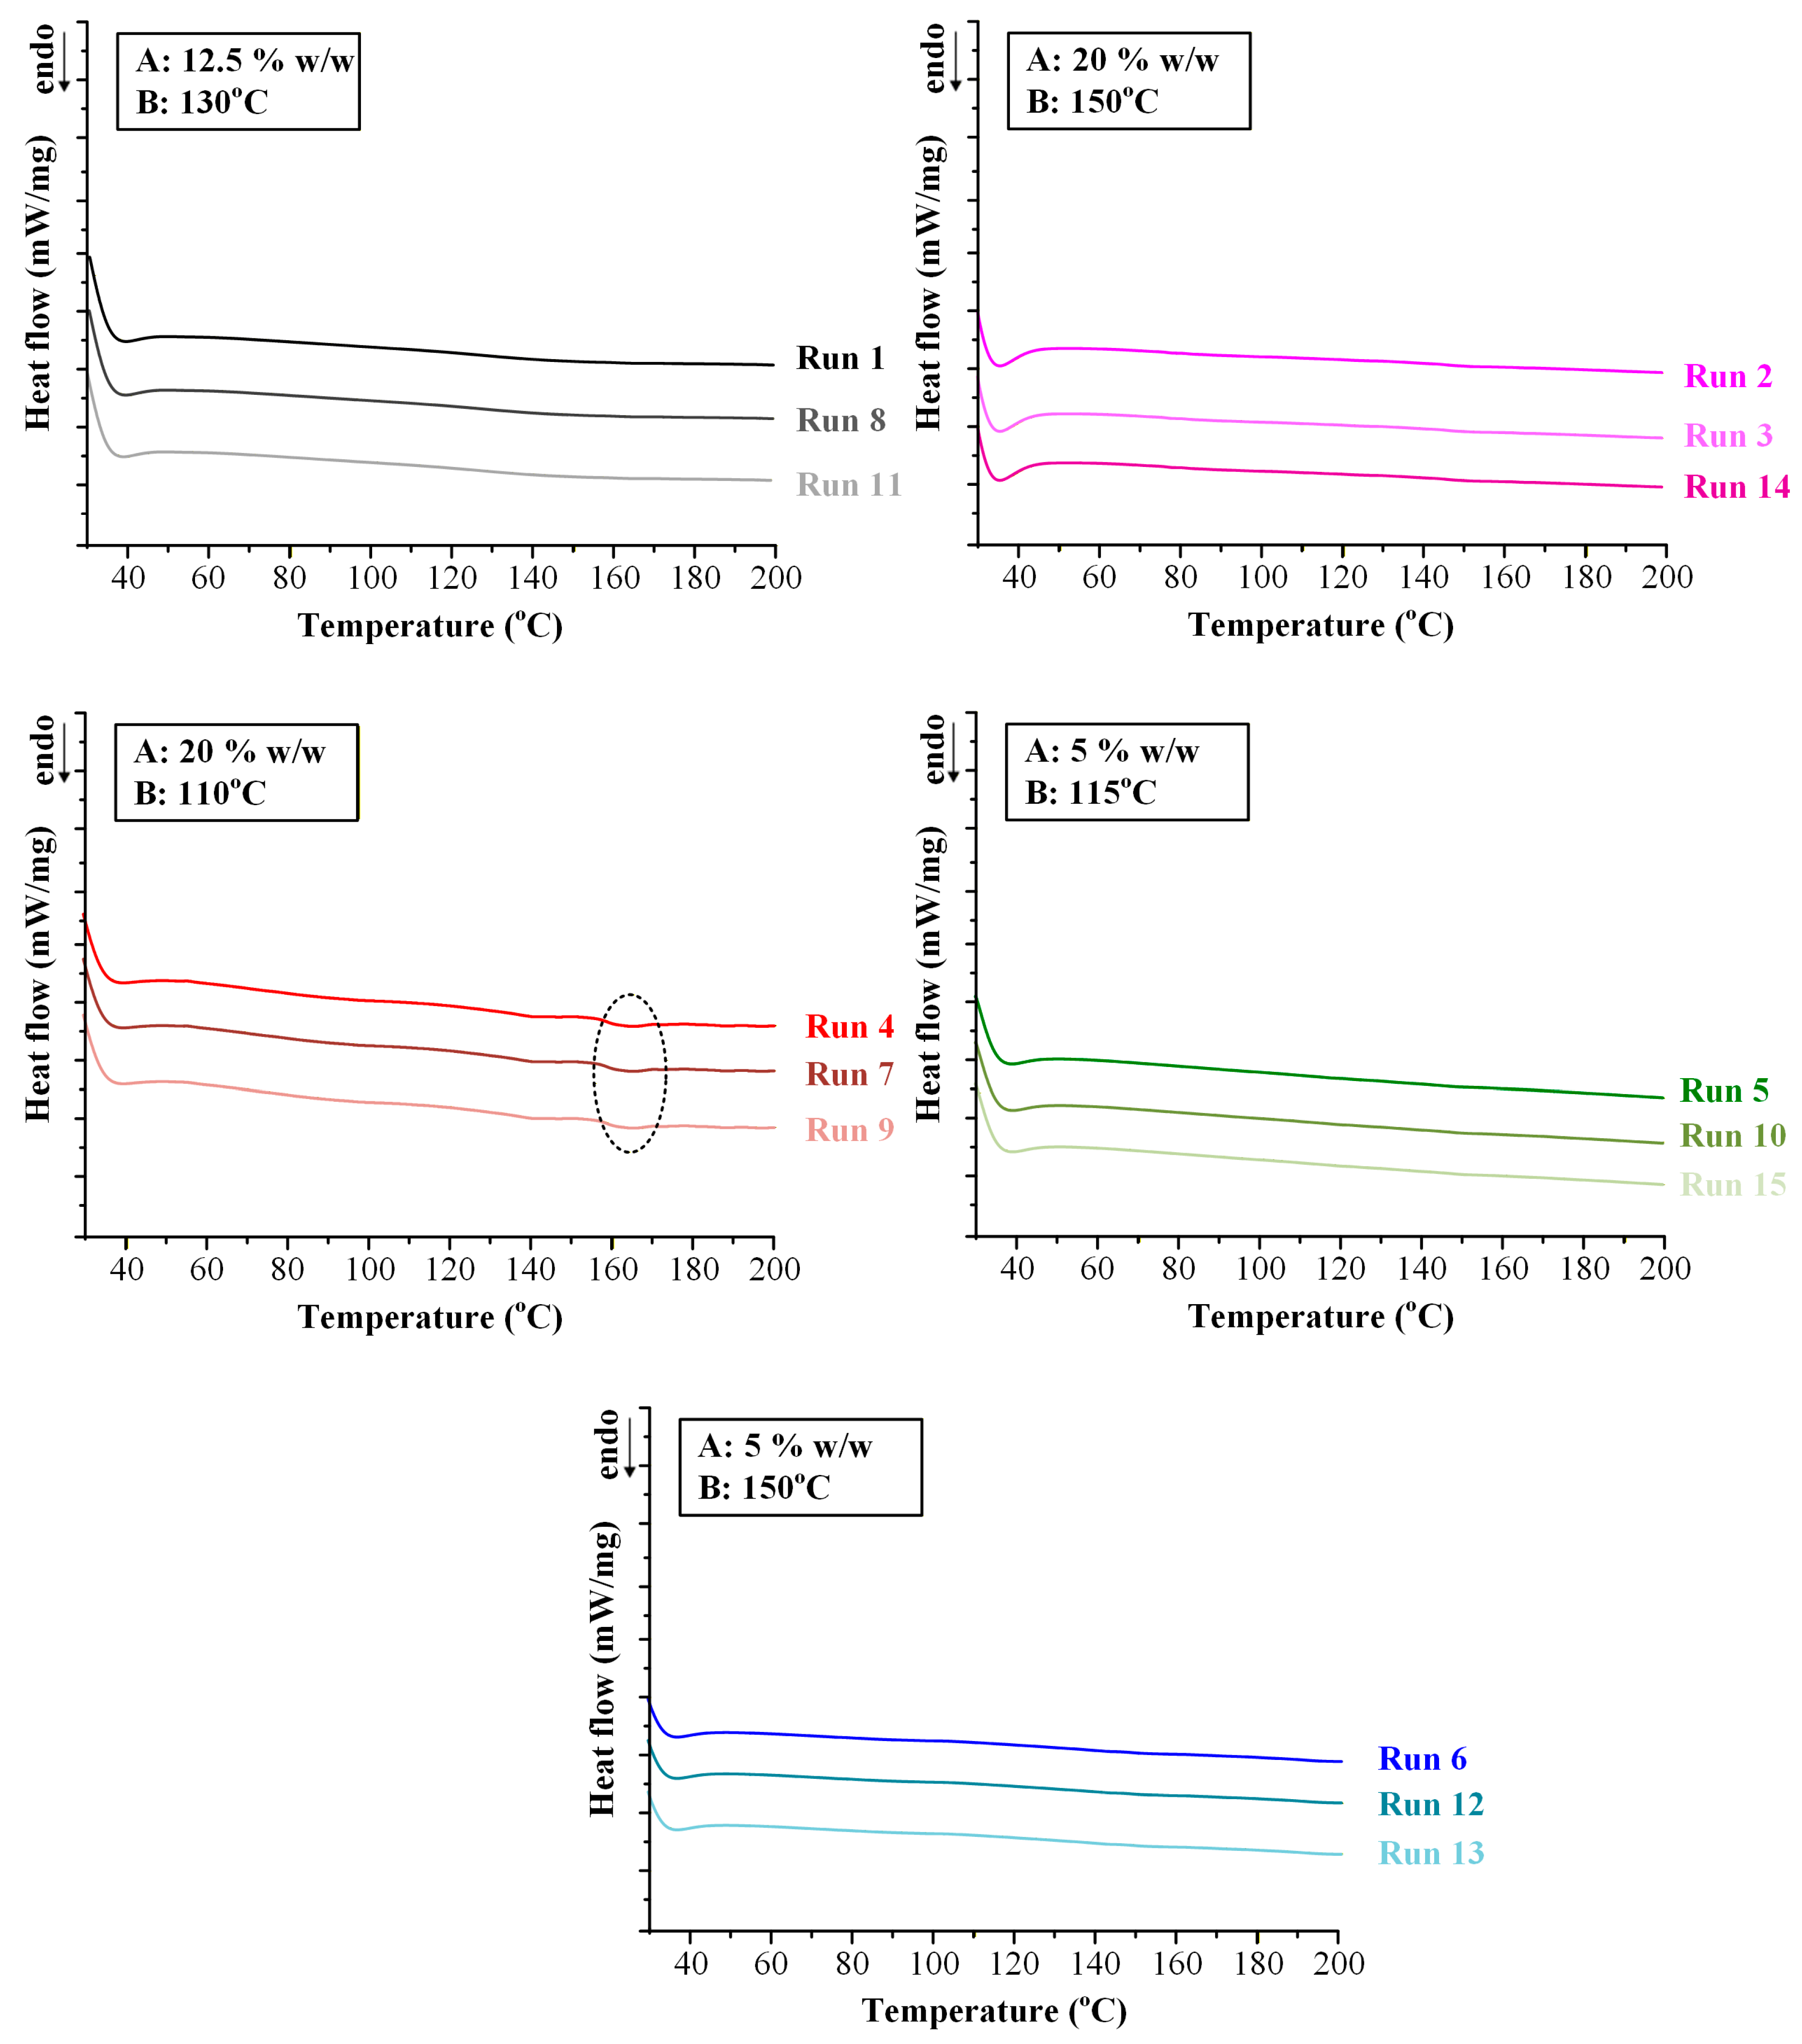
4) was equal to zero in the majority of experimental runs, indicating successful amorphization of IND during the HME process, as supported by DSC thermograms (
Figure 5). Non-zero crystallinity values (~7.5%) were observed only under conditions of high drug loading (20%
w/
w) combined with low extrusion temperature (110 °C).
Mechanistically, this response is governed by kinetic constraints rather than thermodynamic immiscibility. The absence of residual crystallinity at 20% drug loading when processed at 150 °C demonstrates that the SOL-TEC matrix is thermodynamically capable of dissolving IND at this concentration. The presence of crystallinity at 110 °C therefore arises from insufficient molecular diffusion and incomplete dissolution within the available residence time. At lower temperatures, melt viscosity is elevated, reducing IND mobility and limiting interdiffusion into the polymer matrix. Under these conditions, undissolved crystalline domains may persist as kinetically trapped remnants. In contrast, higher temperature exponentially enhances diffusion coefficients and reduces viscosity, facilitating complete drug dissolution and molecular dispersion. This distinction between kinetic amorphization efficiency and thermodynamic miscibility is critical. It demonstrates that processing temperature defines a critical thermal input threshold required to achieve complete amorphization at a given drug loading. Exceeding this threshold ensures molecular-level homogeneity; falling below it results in partial crystalline retention despite overall compatibility of the system.
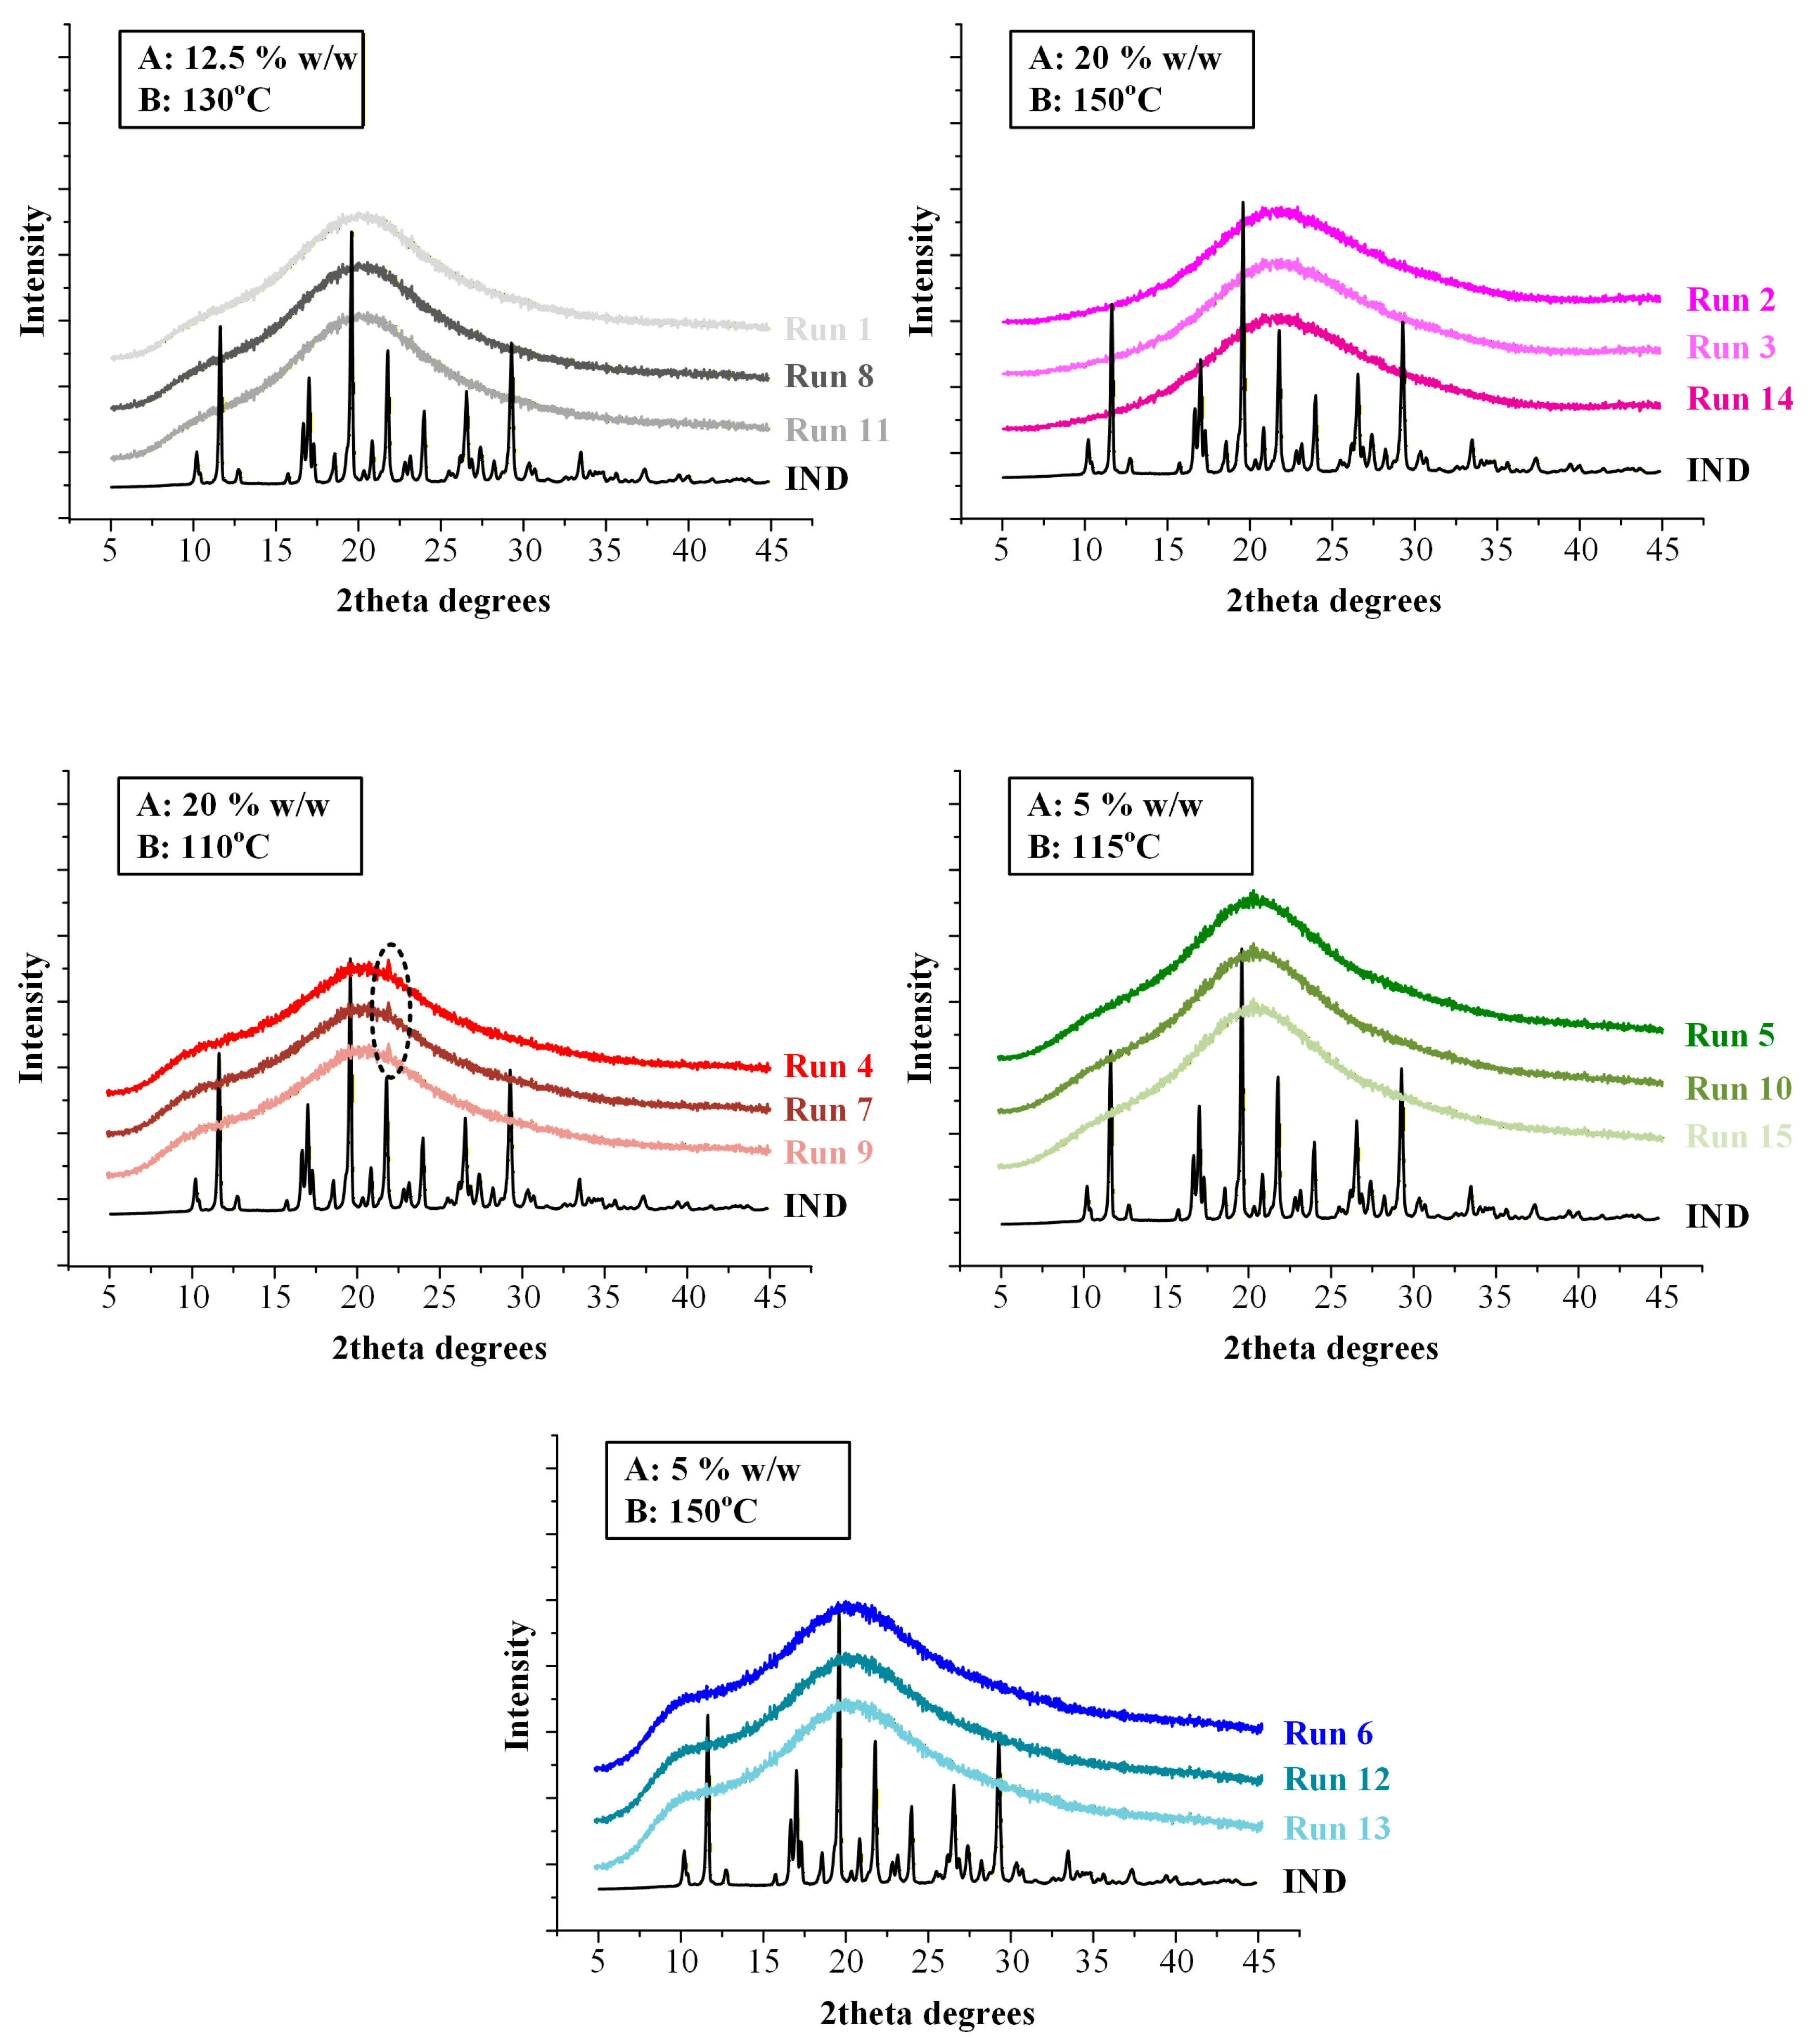
X-ray diffraction (XRD) analysis was performed on FILs obtained from all fifteen experimental runs in order to independently verify the solid-state form of IND following HME and to corroborate the DSC-based assessment of residual crystallinity. The obtained diffractograms are presented at
Figure 6.
Crystalline IND (form γ) exhibited a series of sharp and well-defined reflections at 2θ values of 11.6°, 16.7°, 19.6°, 21.8°, 26.6°, and 29.3°, consistent with previously reported diffraction patterns [
42]. These reflections served as reference markers for identification of crystalline domains within the extruded FILs.
FILs corresponding to Runs 4, 7, and 9 (20% w/w IND processed at 110 °C) exhibited a distinct diffraction peak at approximately 2θ ≈ 22°, which aligns with one of the characteristic reflections of crystalline IND. The presence of this peak confirms that a fraction of the drug retained long-range lattice order under these processing conditions. The absence of additional prominent reflections suggests that the crystalline fraction was limited and/or partially disordered, consistent with low residual crystallinity levels (~7.5%) quantified by DSC analysis.
In contrast, diffractograms of FILs obtained from the remaining twelve runs displayed only broad halo-type scattering patterns without detectable sharp reflections attributable to IND, indicating that the drug was present in an amorphous form within the SOL-TEC matrix.
Importantly, the use of XRD was critical to exclude the possibility of in situ amorphization during DSC heating. In partially crystalline systems, the melting endotherm observed in DSC can be underestimated or even suppressed due to rapid dissolution of residual crystallites within the polymer matrix during thermal scanning. The detection of a characteristic diffraction peak at ~22° in Runs 4, 7, and 9 confirms that crystalline domains were already present in the extruded FILs. Conversely, the absence of diffraction peaks in the remaining runs supports the conclusion that complete amorphization was achieved during extrusion when sufficient thermal input was applied.
Overall, DSC and XRD confirm that residual crystallinity occurs only at high drug loading and low temperature and results from kinetically limited drug dissolution during extrusion rather than thermodynamic incompatibility.
Generally, the DoE analysis revealed pronounced interdependencies between formulation composition, extrusion temperature, and sustainability-related process metrics. The investigated responses (Y1–Y4) were not independent but rather represented coupled manifestations of underlying thermo-rheological and molecular phenomena governing melt processing. In particular, extrusion temperature emerged as a dominant process variable simultaneously affecting electrical energy demand, drug amorphization efficiency, encapsulation performance, and material recovery.
Increasing thermal input enhanced molecular mobility within the polymeric matrix, reducing the risk of residual crystallinity. However, this benefit was accompanied by increased electrical energy consumption, reflecting the intrinsic trade-off between physicochemical performance and environmental burden. These findings underscore the necessity of multi-objective optimization strategies in melt-based pharmaceutical manufacturing, where thermal conditions must be carefully balanced to ensure complete amorphization while avoiding excessive energy expenditure.
Importantly, the explicit incorporation of electrical energy consumption (Y1) as a quantitative response within the DoE framework extends traditional formulation optimization beyond product-centric metrics. By treating energy demand as an intrinsic process attribute rather than an external consideration, the present approach enables rational identification of operating conditions that align product quality requirements with sustainability objectives.
2.4.1. Statistical Diagnostics Tools for HME-DoE
To further assess the adequacy of the model, key statistical diagnostic metrics were evaluated.
Table 3 presents the goodness-of-fit indicators, including R
2, adjusted R
2, predicted R
2, and adequate precision for each response in the design. The predicted R
2 values are in reasonable agreement with the corresponding adjusted R
2 values, with differences less than 0.2, indicating a robust predictive capability of the model. Adequate precision, which reflects the signal-to-noise ratio, exceeds the recommended threshold of 4 for all responses, confirming that the model provides an adequate signal.
In addition, diagnostic plots are presented in the
Supplementary Information (Figure S3) for response Y
1 as a representative example, including the normal probability plot of residuals, residuals versus predicted values, residuals versus run order, and Cook’s distance plot. The normal probability plot shows that residuals closely follow the reference line, indicating approximate normality. The residual versus predicted plot displays no systematic pattern, supporting homoscedasticity and absence of model misspecification. The residuals versus run order plot shows no discernible trends, confirming independence of errors. Cook’s distance values remain below the critical threshold, indicating the absence of influential observations. Similar diagnostic behavior was observed for all other responses, confirming that the underlying regression assumptions are consistently satisfied across the design.
2.4.2. Multi-Response Design Space and Sustainability-by-Design Selection
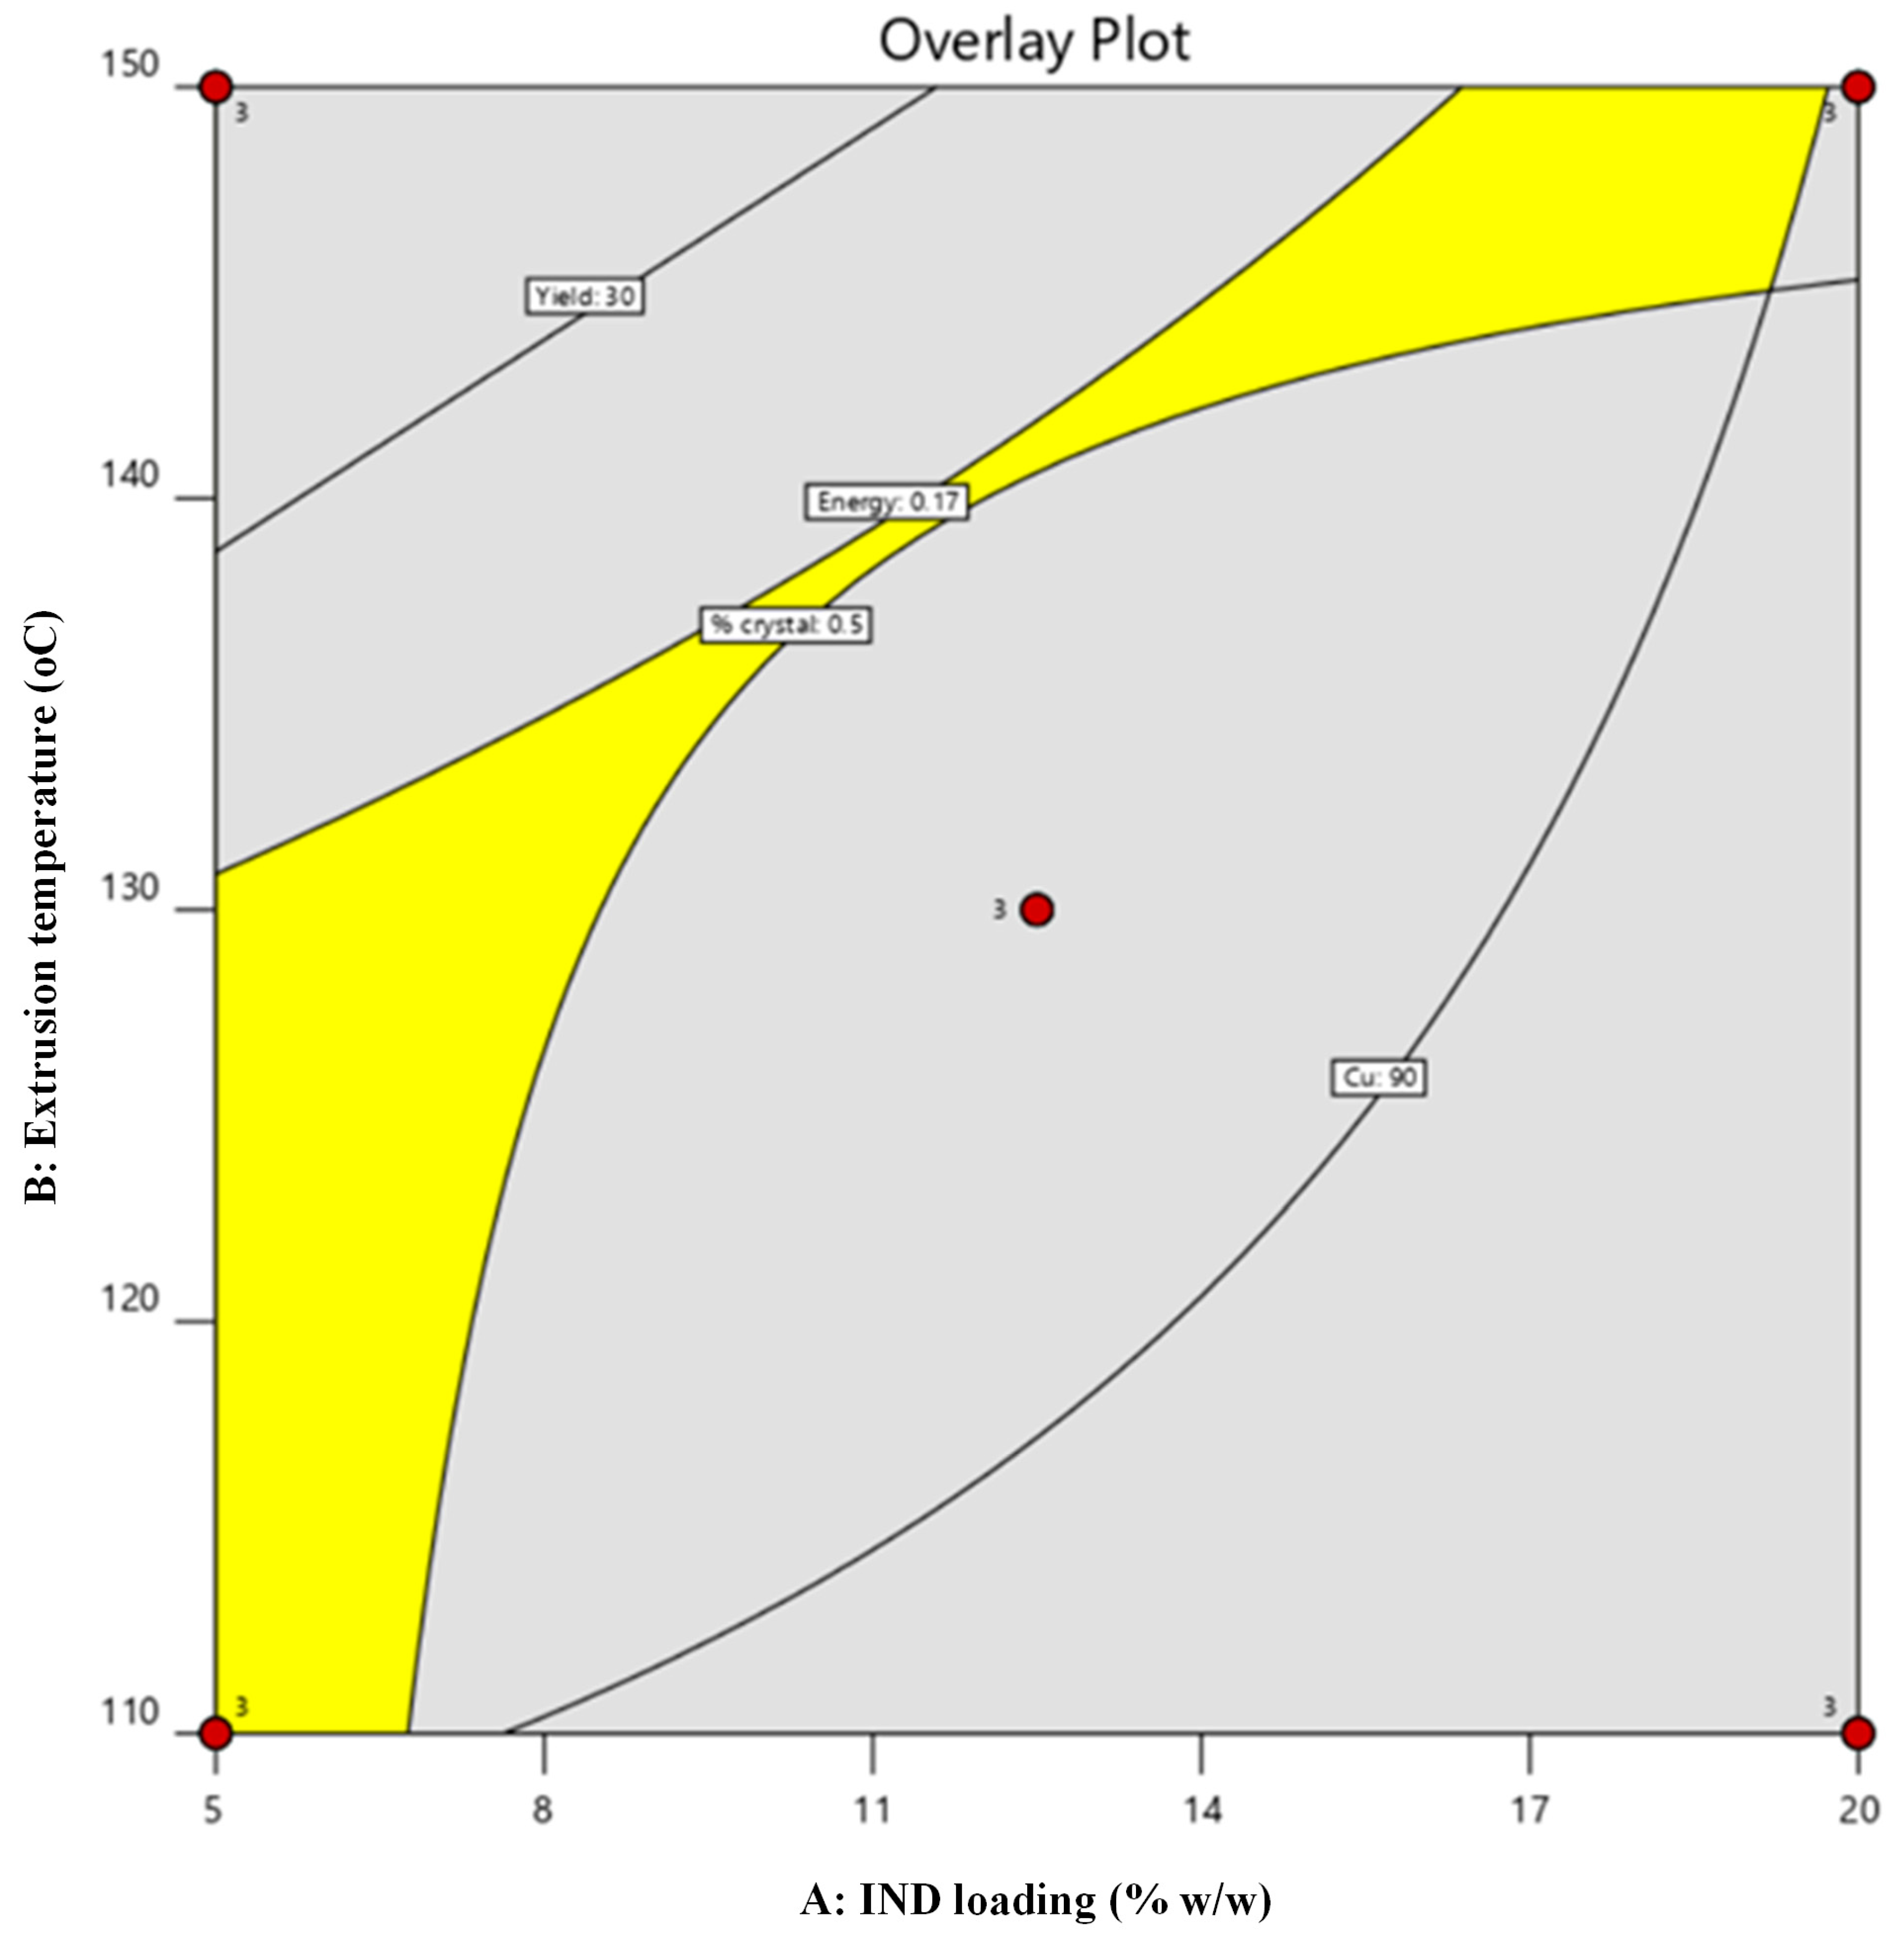
To translate the multivariate DoE outcomes into a practically applicable processing window, overlay contour analysis was conducted using predefined acceptance criteria reflecting both performance and sustainability targets: electrical energy consumption (Y1) ≤ 0.17 kWh, extrusion yield (Y2) ≥ 30%, encapsulation efficiency (Y3) ≥ 90%, and residual crystallinity (Y4) < 0.5%.
The resulting composite design space (
Figure 7) delineated a feasible region in which all responses simultaneously satisfied the specified constraints. Within this region, extrusion conditions provided sufficient thermal input to ensure molecular dispersion of IND and acceptable FIL manufacturability, while maintaining reduced electrical demand. The identified processing window therefore represents a sustainability-by-design operating envelope, in which energy efficiency is harmonized with material performance and downstream FDM suitability.
This integrated response-surface strategy demonstrates that environmental impact can be quantitatively embedded into pharmaceutical process optimization, enabling informed selection of extrusion parameters that minimize resource intensity without compromising solid-state quality attributes.
2.5. Selection of the Optimized FIL
The overlay analysis defines a constrained design space in which all responses meet the specified criteria, highlighting the interplay between drug loading, processing temperature, and performance attributes. As shown in
Figure 7, the feasible region narrows considerably with increasing IND loading, particularly above ~10–15%
w/
w, where higher extrusion temperatures are required to maintain complete amorphization. This behavior reflects kinetic limitations in drug dissolution within the polymer matrix, as higher drug fractions increase the demand for molecular dispersion within the available residence time. Consequently, higher drug loadings are associated with a trade-off between amorphization efficiency and energy input, with regions of the design space excluded due to either residual crystallinity or increased energy consumption. In contrast, lower drug loadings provide a broader and more robust processing window.
Based on the multi-response overlay analysis, a formulation located within the identified feasible design space was selected as the optimized FIL composition for subsequent FDM 3D printing studies. The selected operating point corresponded to a composition containing 5% w/w IND, 10% w/w TEC, and 85% w/w SOL, processed at an extrusion temperature of 130 °C.
Figure 7.
Multi-response overlay contour plot illustrating the optimized design space derived from the factorial DoE. The yellow region represents the operating window satisfying the predefined acceptance criteria.
Figure 7.
Multi-response overlay contour plot illustrating the optimized design space derived from the factorial DoE. The yellow region represents the operating window satisfying the predefined acceptance criteria.
This specific formulation–temperature combination was chosen because it simultaneously satisfied all predefined performance and sustainability criteria, including complete drug amorphization, high encapsulation efficiency, acceptable extrusion yield, and reduced electrical energy consumption. Importantly, this condition provided sufficient thermal input to ensure molecular dispersion of IND while avoiding excessive energy demand associated with higher extrusion temperatures. This optimum point should be interpreted within the boundaries of the investigated design space rather than as a fundamental limitation of the formulation system.
The selection of this optimized FIL was not intended as an endpoint of process development but rather as a rationally validated intermediate platform for downstream additive manufacturing. Given that FDM printing represents a secondary thermal processing step, it was essential to first establish a FIL composition that ensures solid-state stability, compositional uniformity, and controlled thermo-mechanical behavior during extrusion. The validated FIL therefore served as the foundational material for subsequent optimization of FDM. By establishing an HME processing window that balances molecular dispersion efficiency with energy consumption, the present approach ensures that downstream FDM optimization can be performed on a formulation that is both physicochemically robust and environmentally rational.
Following its selection from the multi-response design space, the optimized FIL formulation (5% w/w IND, 10% w/w TEC, processed at 130 °C) was experimentally prepared and systematically evaluated to validate the predictive accuracy of the DoE model. All four critical responses—electrical energy consumption (Y1), extrusion yield (Y2), encapsulation efficiency (Y3), and residual crystallinity (Y4)—were determined using the methodologies described previously.
The experimentally measured electrical energy consumption (Y
1) was 0.1625 kWh, as calculated based on the recorded voltage and current intensity during extrusion of the optimized FIL (
Figure S3), closely matching the model-predicted value (~0.169 kWh). This agreement confirms the reliability of incorporating electrical demand as a quantitative response within the optimization framework.
The experimentally determined extrusion yield (Y2) was 33%, in excellent agreement with the predicted value (~32%), indicating that the selected processing temperature provided an appropriate balance between melt flow and material recovery.
Encapsulation efficiency (Y3) was 98.03%, as determined from three independent FIL segments, demonstrating homogeneous drug distribution and efficient molecular dispersion within the polymeric matrix. The slight deviation from the predicted 100% value falls within normal analytical variability and does not indicate formulation inconsistency.
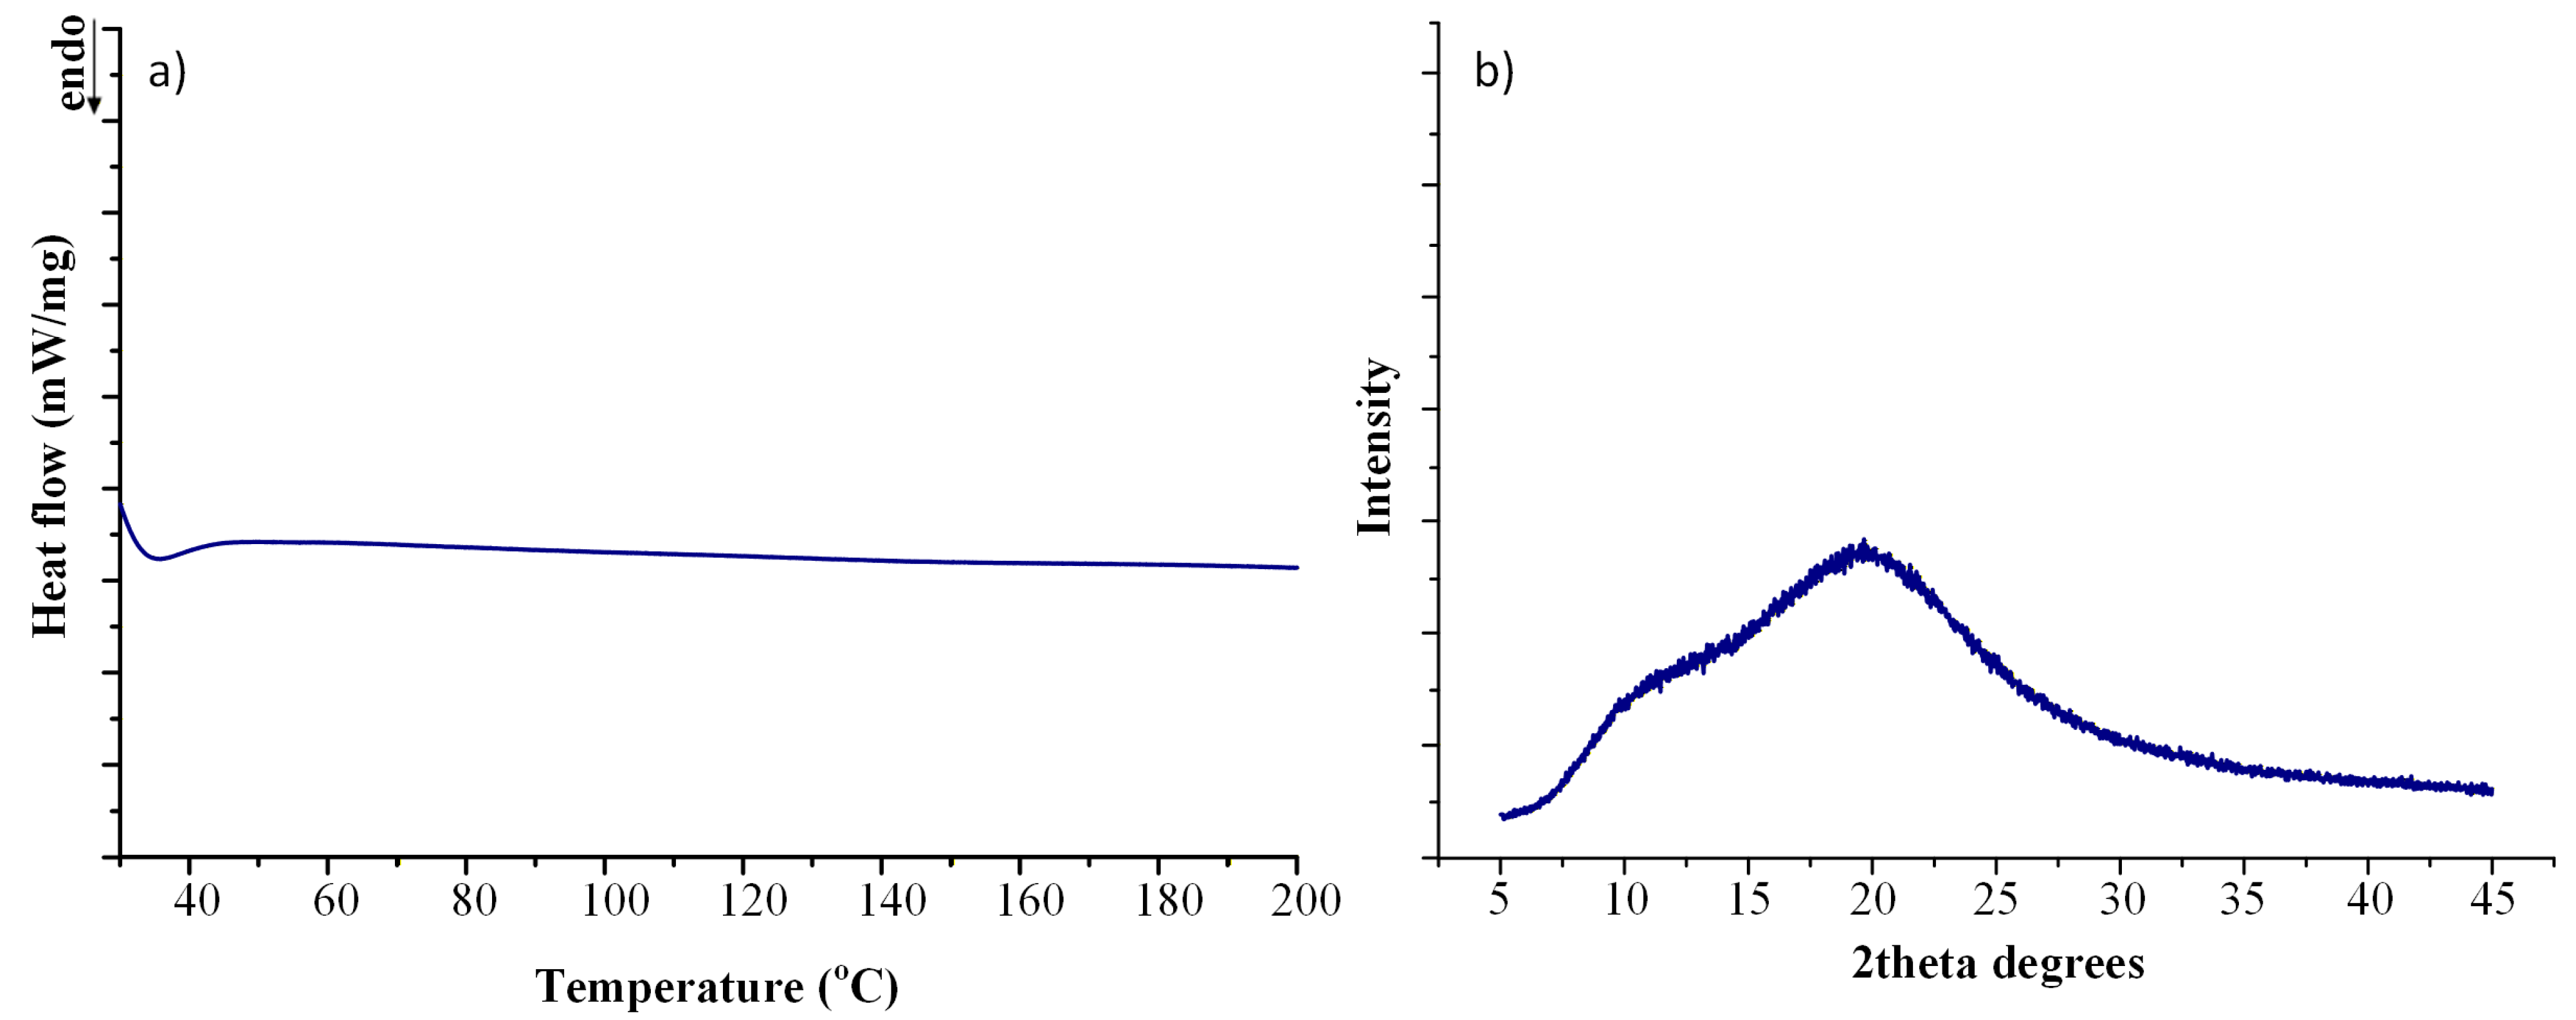
Solid-state characterization confirmed complete drug amorphization. The obtained DSC thermogram (
Figure 8a) showed no detectable melting endotherm corresponding to crystalline IND, while the XRD diffractogram (
Figure 8b) exhibited a diffuse halo pattern without characteristic crystalline reflections. Residual crystallinity (Y
4) was therefore calculated as 0% within the detection limits of the applied techniques.
Collectively, the close agreement between predicted and experimentally determined values for Y1–Y4 validates the robustness of the multi-response DoE model and confirms that the selected operating point simultaneously satisfies performance and sustainability criteria. This experimental confirmation strengthens the proposed sustainability-by-design strategy for melt-processed ASD development.
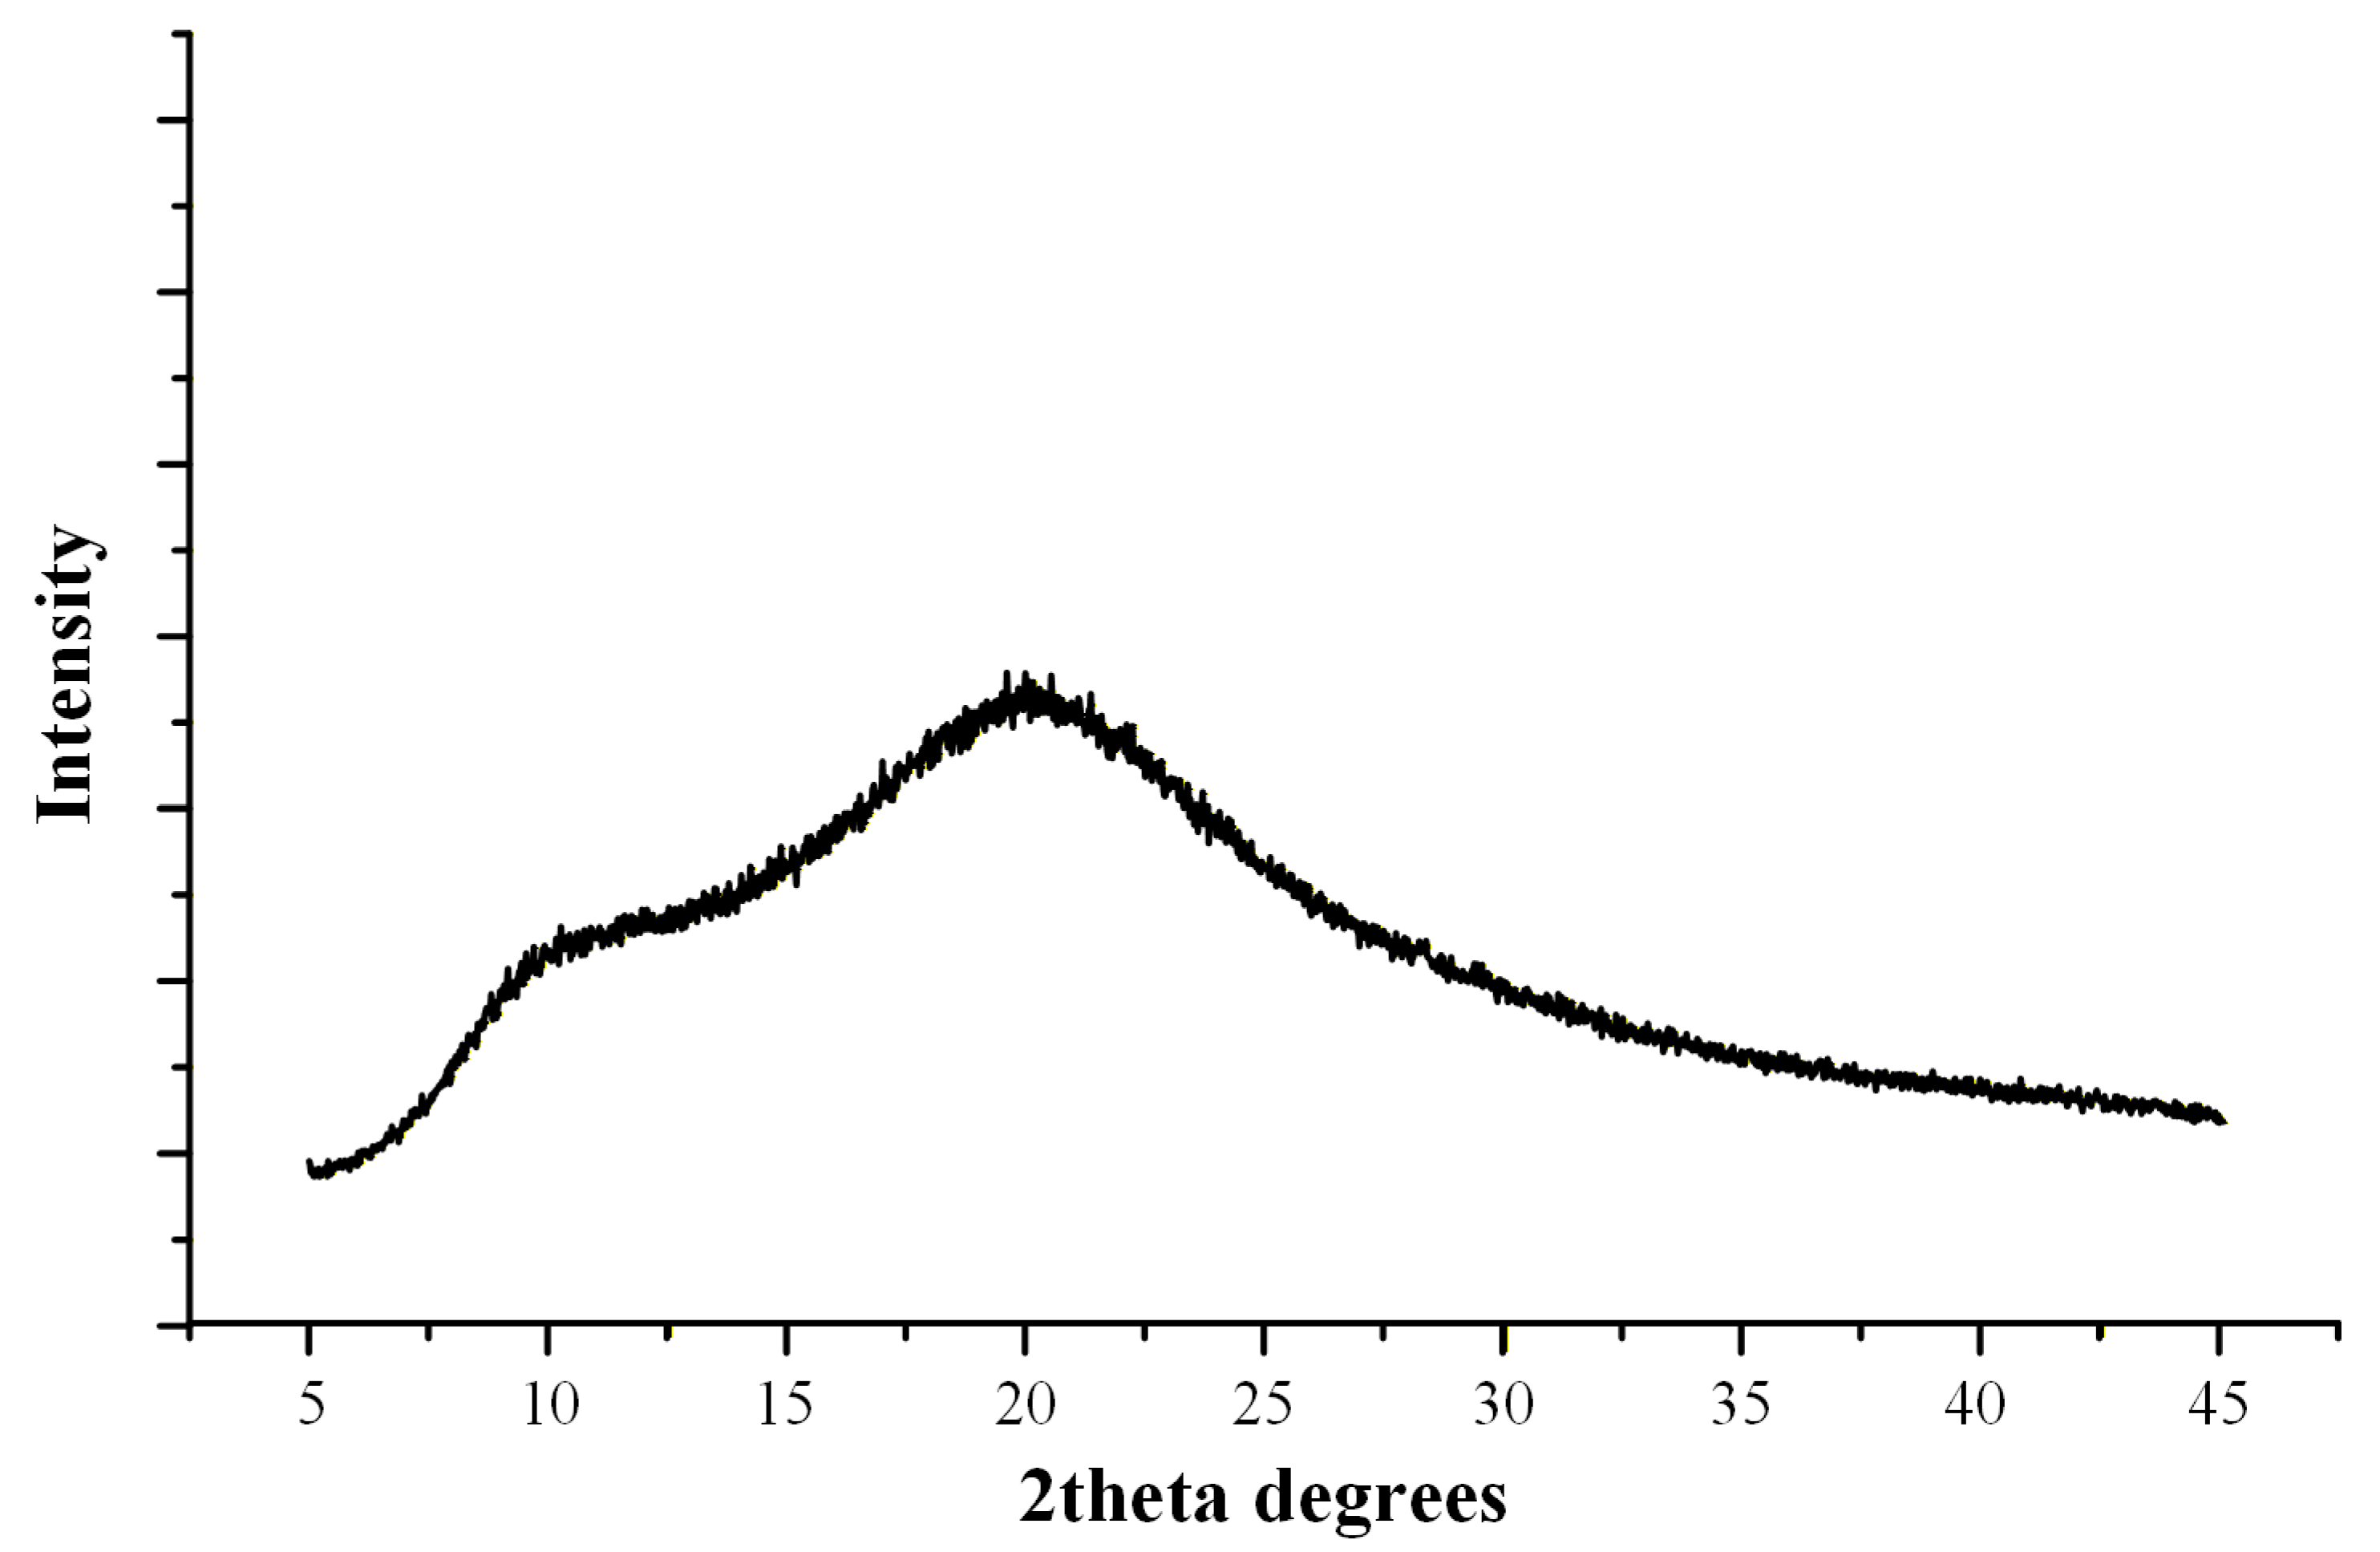
To assess the physical stability of the optimized ASD system, the FIL was stored at 25 °C/60% RH for 6 months (6 M) and subsequently analyzed by XRD (
Figure 9). The diffractograms showed no evidence of recrystallization, as no characteristic diffraction peaks of crystalline IND were detected after storage. This indicates that the amorphous state of the drug was preserved over the studied period. The observed stability suggests that the system remains kinetically stabilized within the polymer matrix.
2.6. FDM Process Optimization
2.6.1. Selection of the Optimal Dosage Form Geometry
The influence of dosage form geometry on FDM process performance was systematically evaluated using the optimized IND-loaded FIL. Three geometries—capsule, cylindrical tablet, and torus—were printed under identical processing conditions to isolate the structural contribution to electrical energy consumption, printing duration, and mass accuracy. The 3D-printed dosage forms with the different geometries are shown in
Figure S5.
Table 4 summarizes the printing energy, printing time, and weight yield for each printed dosage form. Electrical energy consumption was calculated from the recorded voltage (
Figure S6) and current intensity (
Figure S6) throughout the printing process for each geometry. Total electrical energy consumption was determined using the equation
, where
V represents the applied voltage and
I the current intensity over the entire printing duration. Printing time was directly provided by the Flashforge slicing software (FlashPrint 5, version 5.6.0) for each geometry. Weight yield was defined as the ratio between the experimentally measured mass of the printed dosage form and its theoretical mass, serving as an indicator of deposition accuracy and dimensional fidelity.
Although identical FIL mass was used for all geometries, measurable differences in total electrical energy consumption were observed. The torus geometry exhibited the highest energy demand (0.1608 kWh), followed by the capsule (0.1498 kWh), while the cylindrical tablet required the lowest energy input (0.1498 kWh). To further quantify the influence of geometry on process efficiency, energy consumption was normalized to the mass of printed material (kWh/g). The calculated values were 0.297 kWh/g for the capsule, 0.283 kWh/g for the cylindrical tablet, and 0.344 kWh/g for the torus geometry. The cylindrical geometry exhibited the lowest energy consumption per unit mass, indicating more efficient material deposition, while the torus geometry showed increased energy demand relative to the printed mass.
Because instantaneous electrical power during FDM printing is directly related to the mechanical load of FIL feeding, nozzle heating, and printhead motion, total energy consumption is influenced not only by material mass but also by printing time and motion dynamics. The torus geometry required the longest printing time (21 min 30 s), whereas the cylindrical tablet was completed in less time (18 min 25 s).
The increased energy demand of the torus can be mechanistically attributed to its structural complexity. Curvature transitions and the presence of an internal void require frequent changes in printhead direction and acceleration, increasing travel movements and localized deposition events. These dynamic motion adjustments prolong printing duration and elevate cumulative mechanical and thermal load. In contrast, the cylindrical tablet geometry presents continuous, symmetric deposition paths with minimal directional changes, enabling more efficient material deposition and reduced travel movements. From a sustainability perspective, the direct relationship between printing time and electrical demand indicates that geometric simplification can reduce the carbon footprint of additive manufacturing without altering formulation composition.
Weight yield—defined as the ratio between experimentally obtained mass and theoretical mass—serves as an indirect measure of deposition precision and dose accuracy. The cylindrical tablet exhibited the highest weight yield (0.88), followed by the capsule (0.84), whereas the torus demonstrated the lowest value (0.78). Reduced weight yield in the torus geometry likely arises from cumulative deposition inconsistencies in regions of curvature and internal bridging. Complex geometries may introduce minor over- or under-extrusion events due to transient pressure fluctuations within the melt channel during acceleration changes. Additionally, internal void formation may reduce effective material packing density at constant infill settings. The superior mass accuracy observed in the cylindrical tablet reflects uniform layer stacking, consistent perimeter overlap, and minimal structural stress during cooling. From a pharmaceutical standpoint, improved weight yield directly translates to enhanced dose reproducibility and reduced variability.
Importantly, this evaluation demonstrates that geometry selection in FDM-based pharmaceutical manufacturing should not be driven solely by aesthetic preferences or conventional tablet shapes, but rather by integrated sustainability and process-performance criteria. When energy consumption, printing time, mass accuracy, and normalized energy demand are evaluated collectively, the cylindrical tablet geometry emerges as the most efficient and robust configuration. In addition to exhibiting shorter printing duration and higher mass accuracy, the cylindrical tablet demonstrated the lowest energy consumption per unit mass (0.283 kWh/g), compared to the capsule (0.297 kWh/g) and torus (0.344 kWh/g) geometries. These results indicate superior deposition efficiency and reduced non-productive movements, consistent with the simpler and more continuous too path associated with the cylindrical design. On this basis, the cylindrical tablet was selected as the optimal dosage form for subsequent FDM process optimization studies, ensuring that further parameter refinement would be conducted using a geometrically robust and energy-efficient platform.
2.6.2. DoE-Driven Optimization of FDM 3D-Printing Process
Following selection of the cylindrical tablet as the most efficient geometry, a full factorial DoE was applied to quantify the influence of key FDM processing parameters on printing time (R
1), electrical energy consumption (R
2), and IND encapsulation efficacy (R
3). Platform temperature (X
1), nozzle temperature (X
2), and printing speed (X
3) were examined within practical operating ranges, and the corresponding experimental matrix and response values are presented in
Table 5, with ANOVA outcomes summarized in
Table 6. Regression modeling produced coded-factor equations describing the response surfaces within the investigated design space.
Printing time (R1) ranged from 0.194 to 0.246 h. ANOVA identified platform temperature and nozzle temperature as statistically significant main effects (p = 0.0003 and p < 0.0001, respectively), while the X1X2 interaction was also significant (p = 0.0012), indicating that the temperature dependence of printing time is not purely additive. Consistent with these findings, the coded regression equation for R1 (R1 = 0.2250 + 0.0102*X1 − 0.0030*X2 − 0.0001*X1X2) shows a positive coefficient for platform temperature and negative coefficients for nozzle temperature. Mechanistically, increasing nozzle temperature reduces melt viscosity in the liquefier zone and stabilizes extrusion flow, thereby reducing time penalties associated with intermittent under-extrusion or flow interruptions. In contrast, higher platform temperature can prolong thermal equilibration and layer stabilization, which may manifest as slightly longer effective printing times depending on the thermal history of deposition.
Electrical energy consumption (R
2) varied between 0.026 and 0.048 kWh per printing run and was strongly sensitive to all three factors (
Table 6). It should be noted that within the DoE framework, electrical energy consumption was defined as the total energy required per printing process (kWh per print), encompassing all contributions, including bed heating, nozzle heating, and steady-state operation during printing. Unlike the preliminary geometry study, where all samples were produced under identical conditions and normalization (kWh/g) enabled direct comparison of structural effects, the DoE involves systematic variation in process parameters. This approach was intentionally adopted to capture the overall process-level energy demand, ensuring a direct linkage between processing parameters (e.g., temperature settings and printing speed) and energy consumption. The voltage and current intensity profiles recorded during the 3D printing process are presented in
Figures S8 and S9, respectively. These profiles provide real-time insight into the electrical load of the system under each DoE condition, reflecting the combined thermal and mechanical demands imposed by the selected platform temperature, nozzle temperature, and printing speed. Platform temperature exhibited the dominant contribution (F = 2560.97,
p < 0.0001), reflecting the continuous baseline power required to maintain the build plate at elevated setpoints. Nozzle temperature and printing speed were also significant contributors (
p < 0.0001). The coded equation for R
2 (R
2 = 0.0376 + 0.0084*X
1 + 0.0011*X
2 − 0.0010*X
3) indicates that increases in platform and nozzle temperatures increase energy demand, whereas increased printing speed decreases cumulative energy consumption. This reflects the time-integrated nature of energy: although higher speeds may not reduce instantaneous power substantially, they shorten the total printing duration, thereby reducing the total energy consumption over time.
IND encapsulation efficacy (R
3) ranged from 85.2% to 96.4%. Both platform and nozzle temperatures were highly significant (
p < 0.0001), and multiple interaction terms (X
1X
2, X
1X
3) were significant, demonstrating a non-linear coupling between thermal boundary conditions and dose accuracy. The coded equation for R
3, R
3 = 92.53 + 0.9919*X
1 + 1.54*X
2 − 2.11*X
1X
2 + 1.51*X
1X
3), suggests that, in isolation, higher platform and nozzle temperatures increase encapsulation efficacy values, consistent with improved interlayer fusion and reduced voiding that can otherwise lead to mass deficits and under-dosing. However, the negative Χ
1Χ
2 term indicates that simultaneously elevating both temperatures can offset these gains. Within the investigated range, printing speed did not exhibit a significant main effect on assay (
Table 6), implying that deposition remained sufficiently stable to maintain dose accuracy, provided thermal conditions were appropriately selected.
Collectively, the coded equations and ANOVA demonstrate that FDM performance is governed by coupled thermo-mechanical mechanisms. Platform temperature primarily dictates baseline electrical demand and interlayer thermal history; nozzle temperature modulates melt rheology and extrusion stability; and printing speed influences the time-dependent integration of electrical power and overall throughput. These findings support the necessity of multi-objective optimization to identify an operating window that minimizes energy and printing time without compromising assay performance.
2.6.3. Statistical Diagnostics Tools for FDM 3D Printing
To further evaluate the suitability of the model, several statistical diagnostic measures were examined once again. As summarized in
Table 7, the goodness-of-fit parameters—namely, R
2, adjusted R
2, predicted R
2, and adequate precision—were calculated for each response variable. The predicted R
2 values show good consistency with the adjusted R
2 values, with deviations remaining below 0.2, which demonstrates a satisfactory predictive performance. In addition, the adequate precision values for all responses are greater than 4, indicating an acceptable signal-to-noise ratio and confirming that the model provides a reliable signal.
Diagnostic plots are provided in the
Supplementary Information (Figure S10) for response R
1 as a representative example, including the normal probability plot of residuals, residuals versus predicted values, residuals versus run order, and Cook’s distance plot. The normal probability plot shows that residuals closely follow the reference line, supporting approximate normality. The residuals versus predicted values plot displays no systematic pattern, indicating homoscedasticity and absence of model misspecification. The residuals versus run order plot shows no discernible trends, confirming independence of errors. Furthermore, all Cook’s distance values remain below the critical threshold, indicating the absence of influential observations. Similar diagnostic behavior was observed for all other responses, confirming that the regression assumptions are consistently satisfied across the design space.
2.6.4. Multi-Response Design Space and Sustainability-by-Design Selection for FDM 3D Printing
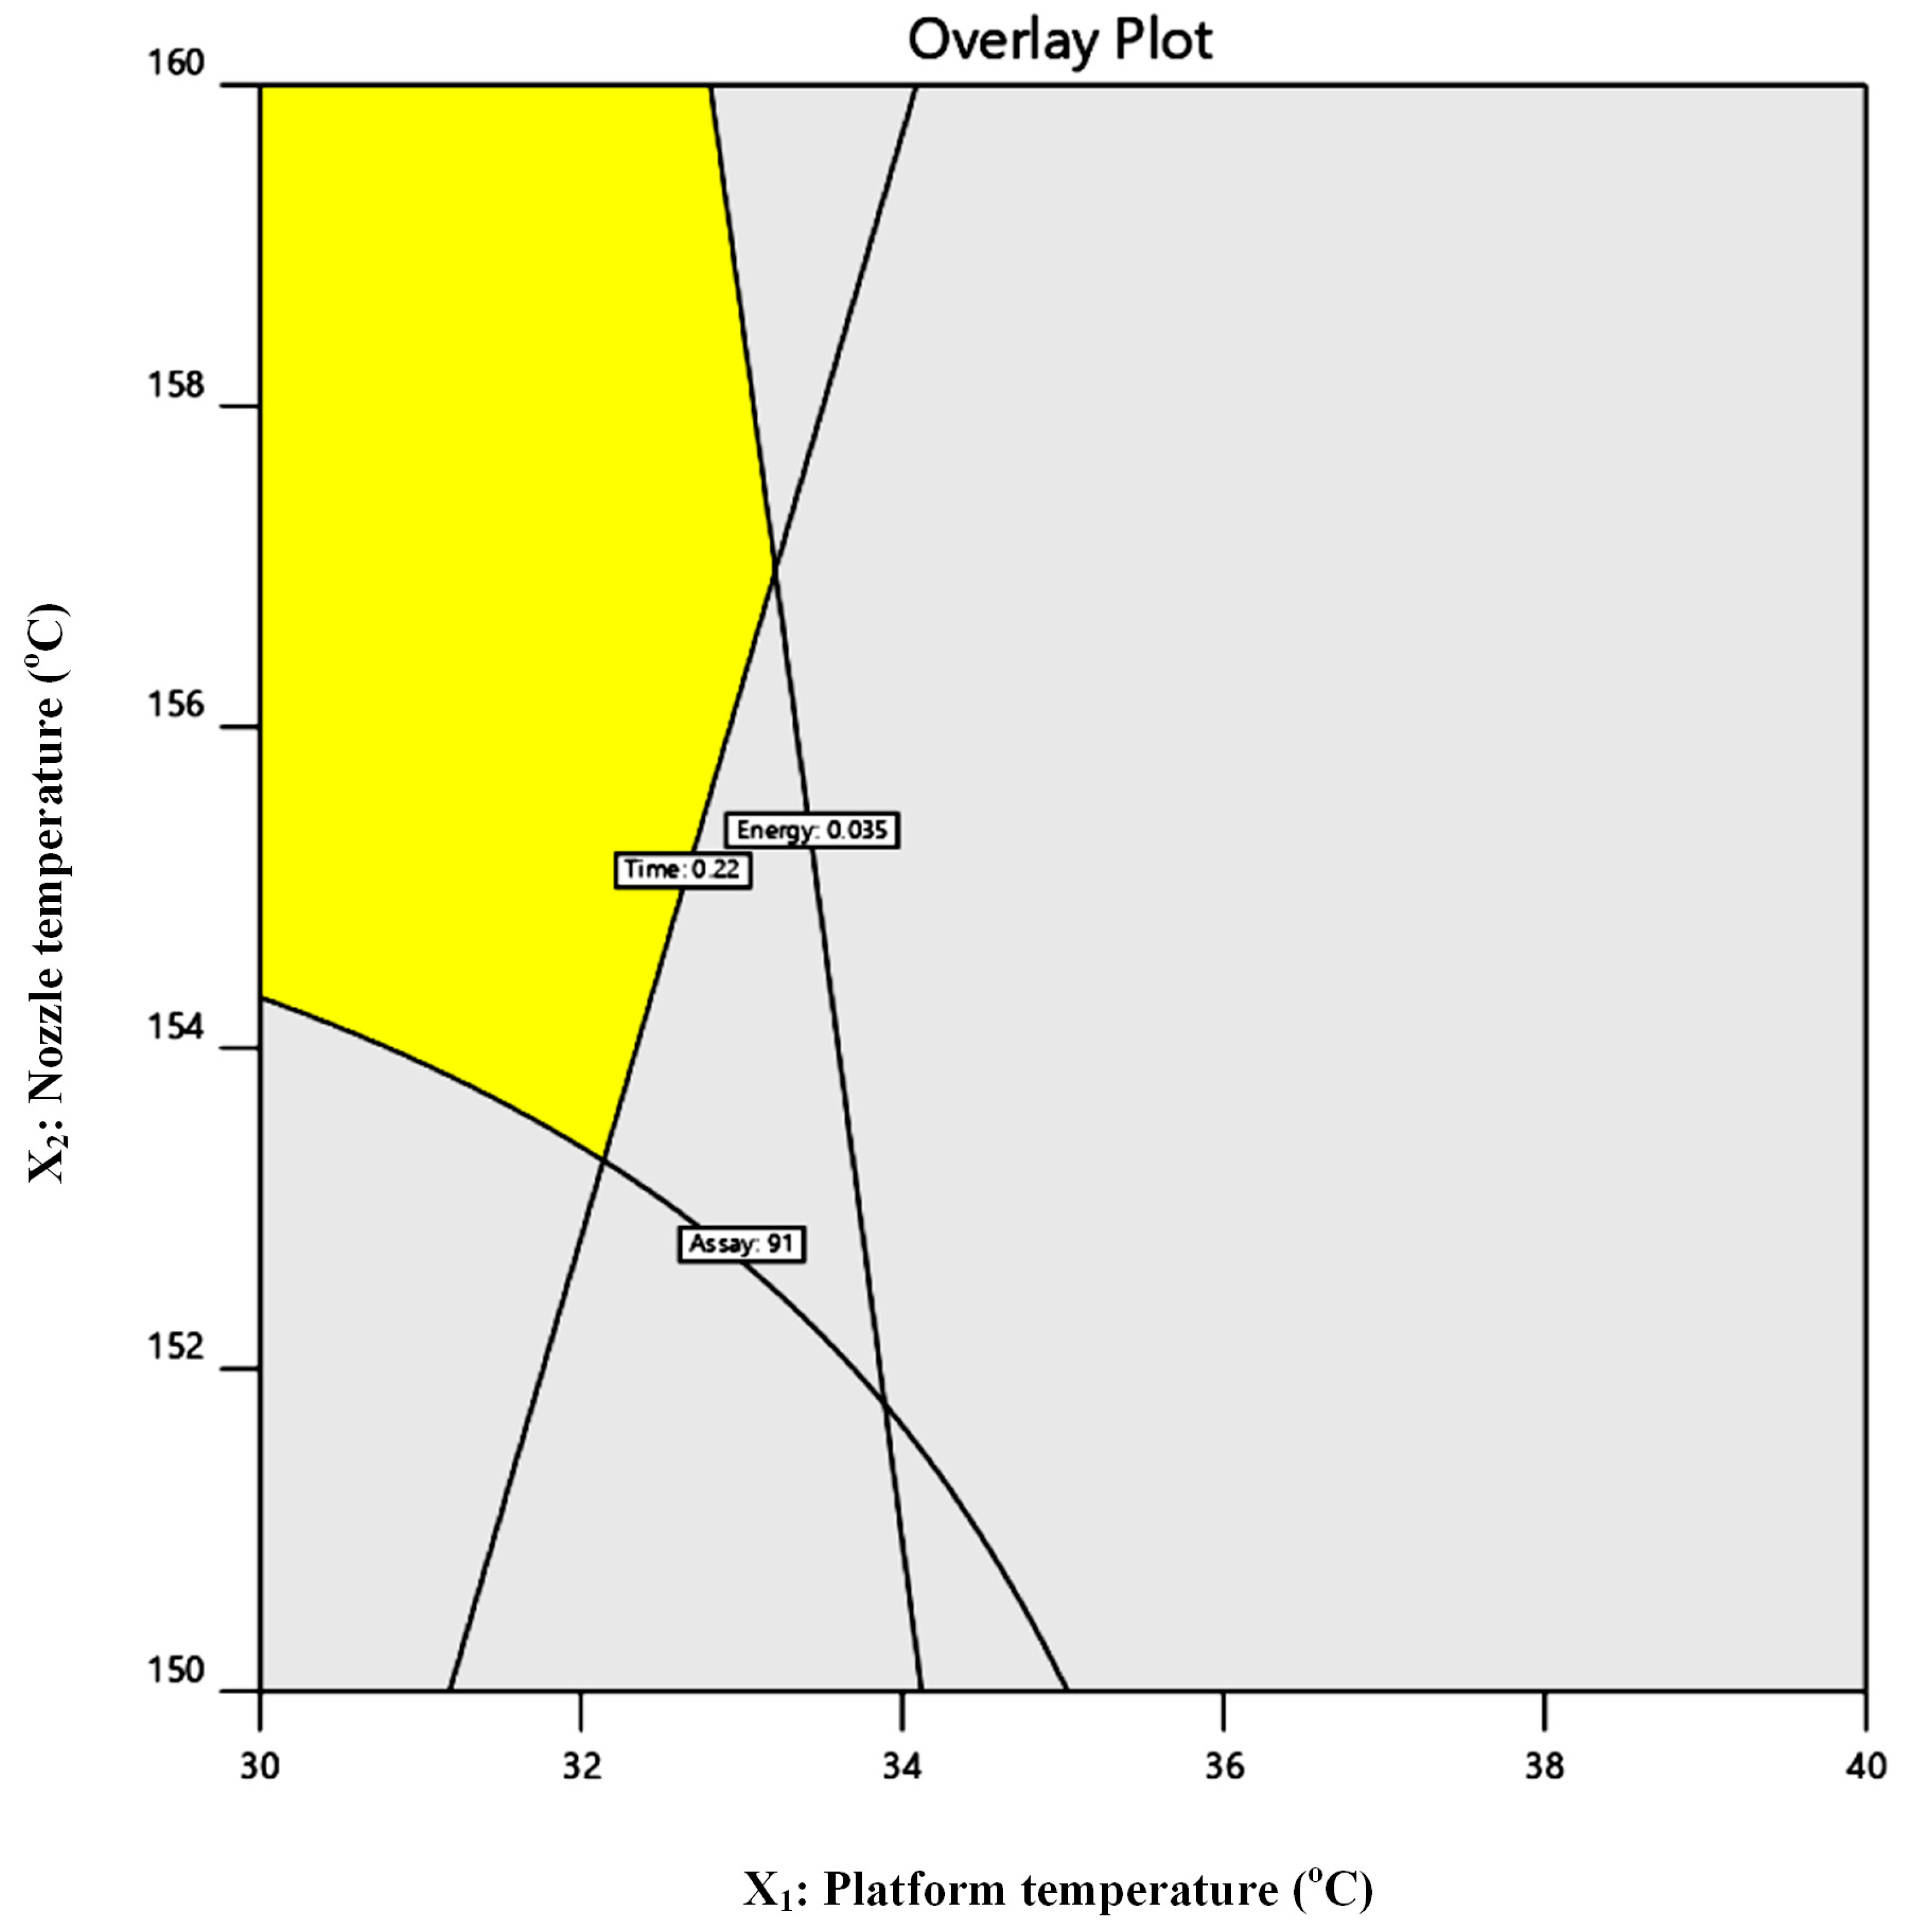
To translate the multivariate DoE outcomes into a practically applicable FDM processing window, overlay contour analysis was conducted using predefined acceptance criteria reflecting both manufacturing efficiency and sustainability targets: printing time (R1) < 0.22 h, electrical energy consumption (R2) < 0.035 kWh per print, and IND loading efficacy (R3) > 91%.
The composite overlay generated from the response surface models delineated a constrained yet clearly defined feasible region in which all three criteria were simultaneously satisfied. Within this region, the selected combinations of platform temperature, nozzle temperature, and printing speed provided sufficient thermal input to ensure accurate material deposition and dose uniformity, while maintaining reduced electrical demand and shortened production time.
Mechanistically, the feasible design space corresponded to moderate platform temperatures, which limited baseline heater load, combined with sufficiently elevated nozzle temperatures to promote stable melt flow and interlayer fusion. Simultaneously, intermediate-to-high printing speeds reduced cumulative process duration without compromising deposition fidelity. Outside this region, either excessive thermal input increased electrical demand beyond the predefined sustainability threshold, or insufficient thermal energy compromised assay values, likely due to suboptimal melt homogenization and interlayer bonding (
Figure 10).
To experimentally verify the predictive capability of the FDM DoE model, one operating point located within the optimized multi-response design space was selected for confirmation. This point corresponded to a platform temperature of 32 °C, a nozzle temperature of 158 °C, and a printing speed of 11 mm/s. These conditions were identified from the overlay contour analysis as satisfying simultaneously the predefined criteria of minimized printing time, reduced electrical energy consumption, and acceptable IND assay.
According to the regression models derived from the factorial design, the predicted responses at this operating point were 0.21 h for printing time (R1), 0.032 kWh for electrical energy consumption (R2), and 93.3% for drug loading efficacy (R3). To validate these predictions, three cylindrical tablets were printed under the proposed optimal conditions. All responses were calculated as the mean of the three independent prints.
The experimentally recorded printing time, obtained directly from the FDM printer software (FlashPrint 5, version 5.6.0), was 0.202 h. This value closely matches the model-predicted time of 0.21 h, confirming the reliability of the regression model for R1 within the defined design space.
Voltage and current intensity profiles recorded during printing under the optimized conditions are presented in the
Supplementary Material (Figure S11). The experimentally determined energy consumption was consistent with the predicted value (~0.032 kWh), indicating that the selected parameter combination effectively limits cumulative electrical demand. The relatively low platform temperature reduces baseline heater load, while the elevated nozzle temperature ensures stable melt flow and continuous deposition. The selected printing speed further contributes to energy reduction by shortening total process duration without compromising deposition fidelity.
The experimentally determined IND assay was 92%, in close agreement with the predicted value of 93.3%. This confirms that the selected thermal and kinematic conditions provide sufficient melt homogenization and interlayer fusion to maintain dose accuracy. The minor deviation between predicted and observed values falls within expected analytical variability and does not indicate model inadequacy.
Overall, the close agreement between predicted and experimental values for R1, R2, and R3 validates the robustness of the FDM DoE model and confirms that the identified processing window effectively balances manufacturing efficiency, energy minimization, and pharmaceutical performance. This final validation step demonstrates that sustainability-driven parameter selection can be quantitatively integrated into additive pharmaceutical manufacturing without compromising dosage quality.
2.6.5. Dissolution Studies of Optimized Dosage Forms
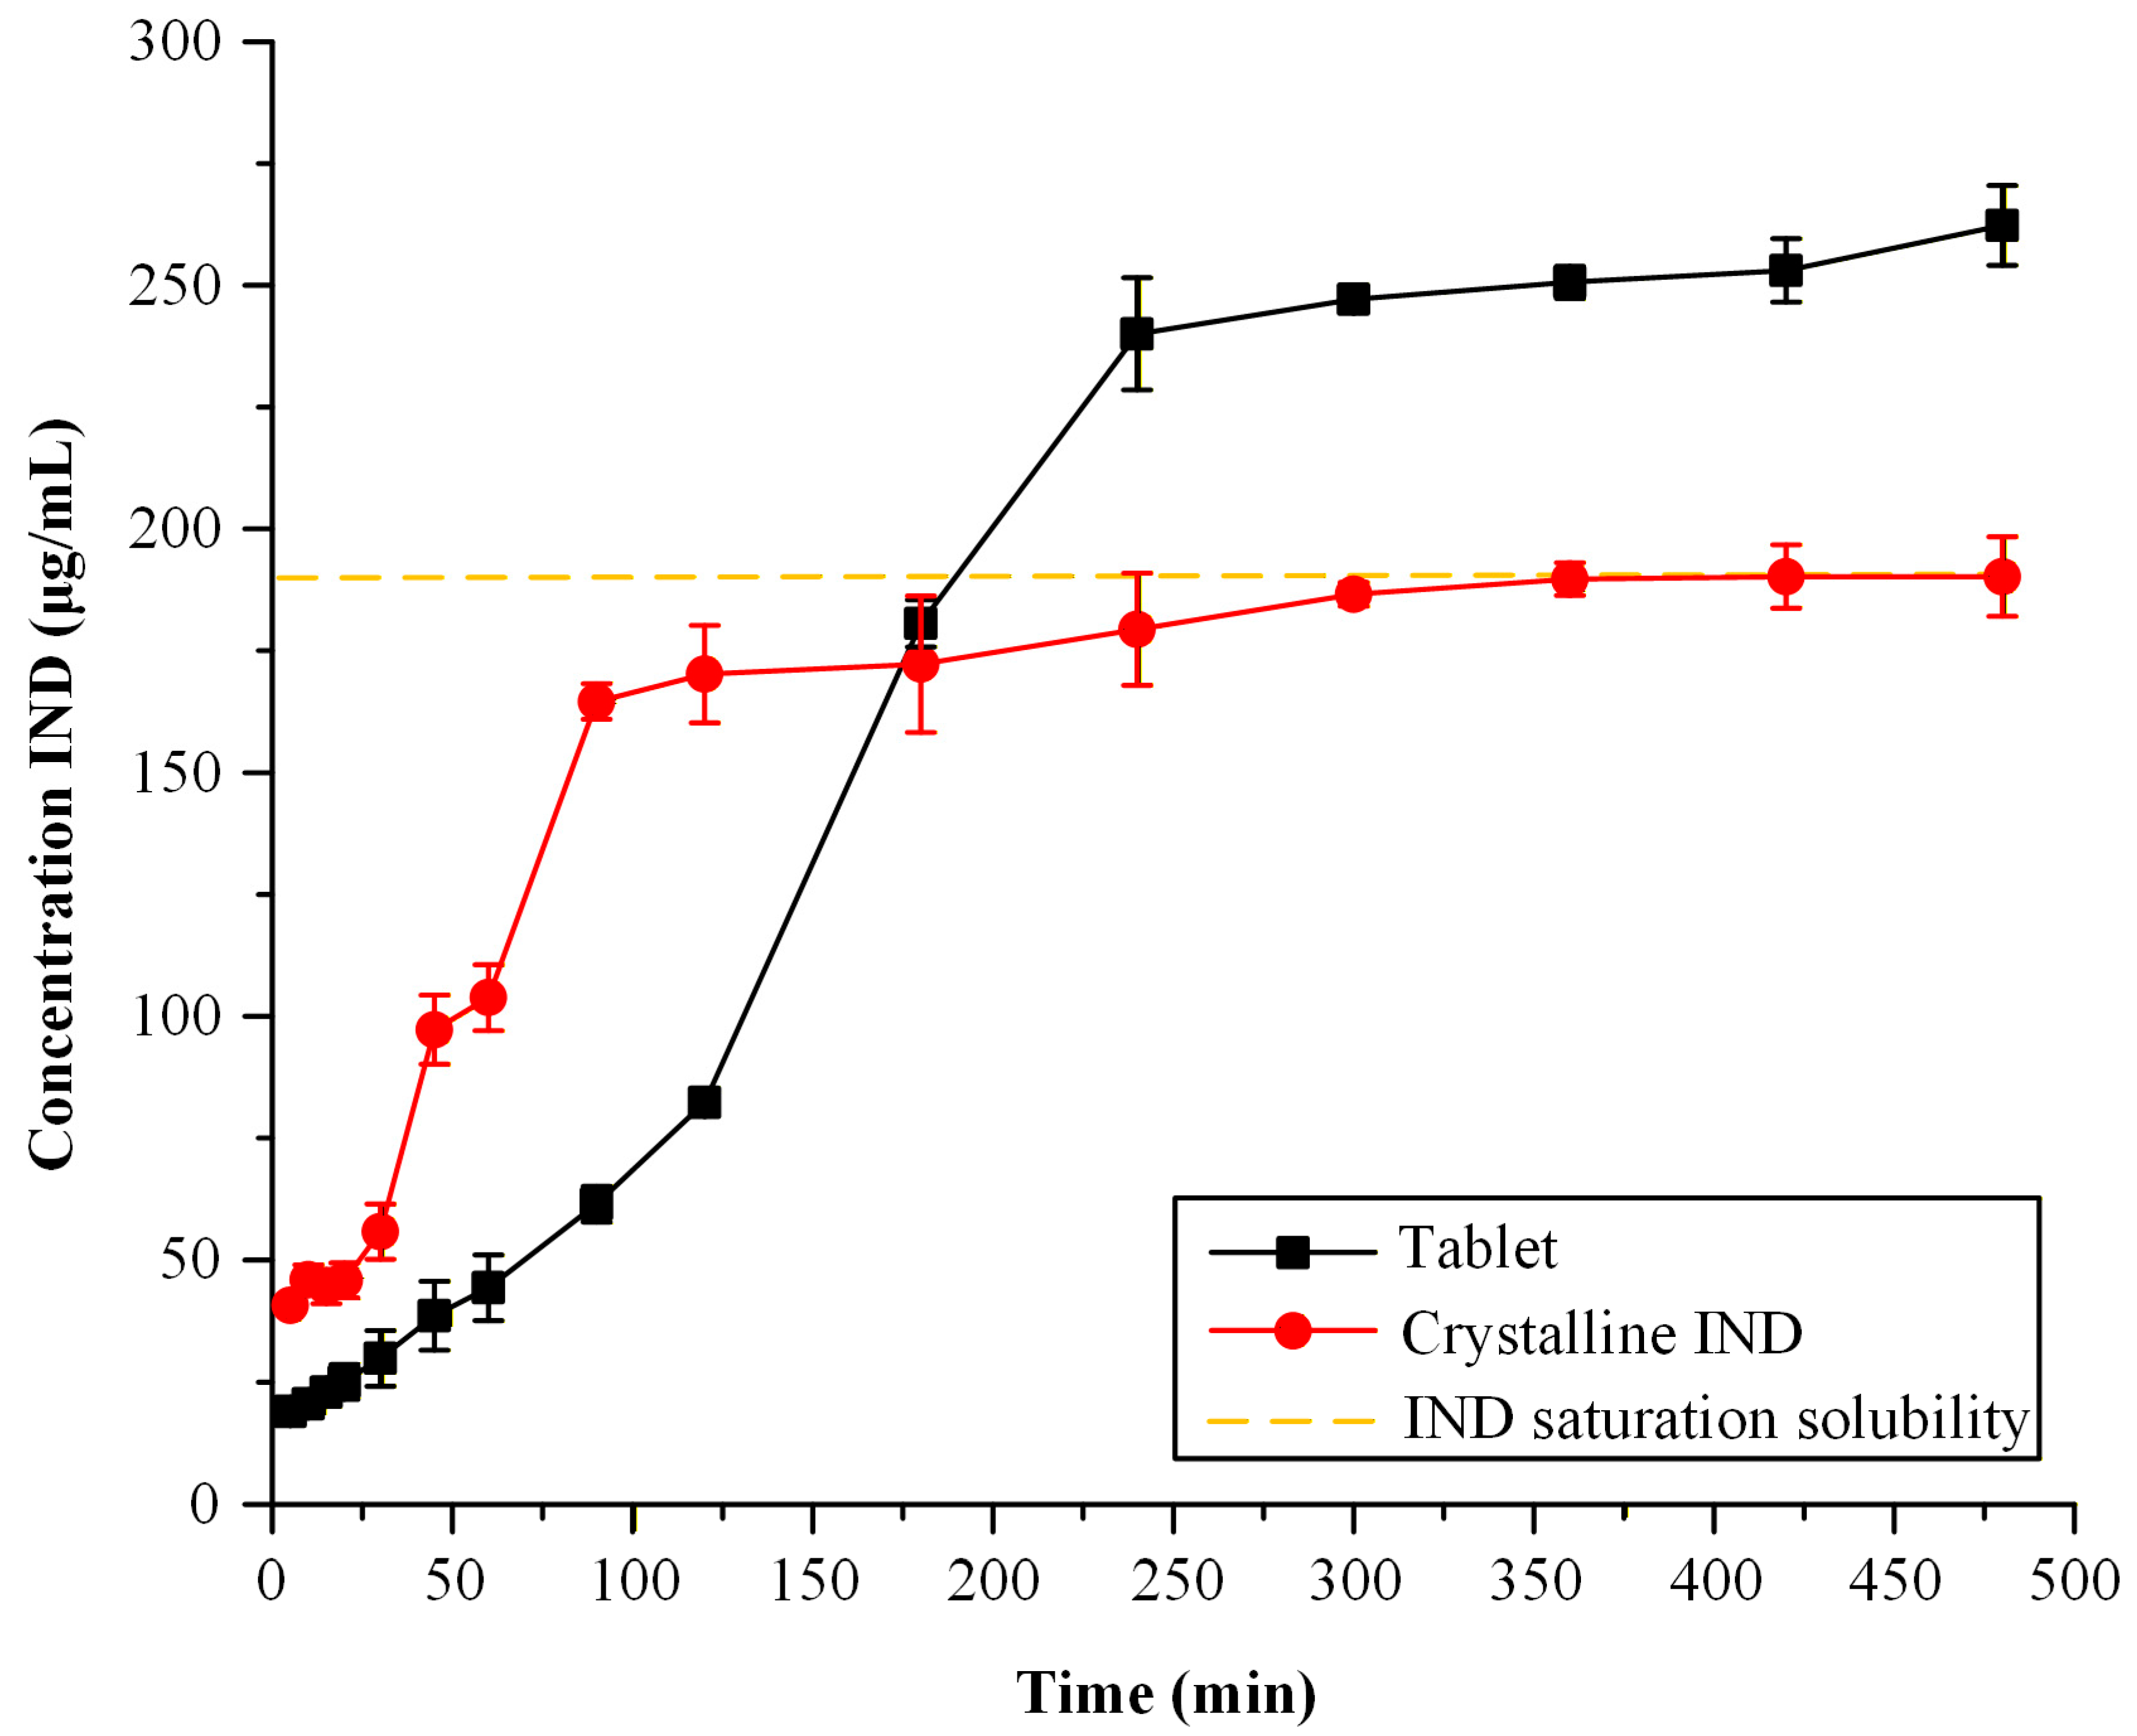
To evaluate the effectiveness of the optimized 3D-printed tablets in enhancing drug solubility, dissolution studies were performed in phosphate-buffered solution (PBS, pH 6.8) and compared with crystalline IND. The dissolution profiles (
Figure 11) demonstrate a significant enhancement in drug release from the ASD-based printed dosage forms compared to crystalline IND. The crystalline drug exhibited limited dissolution, consistent with its low aqueous solubility and dissolution rate-limited behavior, reaching a plateau at approximately 190 μg/mL after 300 min, corresponding to its saturation solubility in the selected medium [
43].
In contrast, the ASD formulations exhibited a slower initial drug release during the first 180 min, with lower dissolved concentrations compared to crystalline IND. However, at later time points, the ASD systems achieved higher dissolved concentrations, exceeding the apparent solubility of the crystalline drug. This behavior is consistent with the amorphous state of IND within the polymer matrix, which eliminates the energetic barrier associated with crystal lattice disruption. The delayed release phase may be attributed to matrix-controlled drug diffusion and polymer hydration kinetics, which govern the initial release behavior.
At extended time scales, the increased molecular mobility and higher apparent solubility of the amorphous form enable the generation of supersaturated solutions, while the presence of the polymer likely inhibits recrystallization and supports the maintenance of supersaturation. These results confirm that the optimized HME-FDM process produces ASD systems capable of enhancing apparent solubility, despite differences in early-stage release kinetics.




 ,
,