
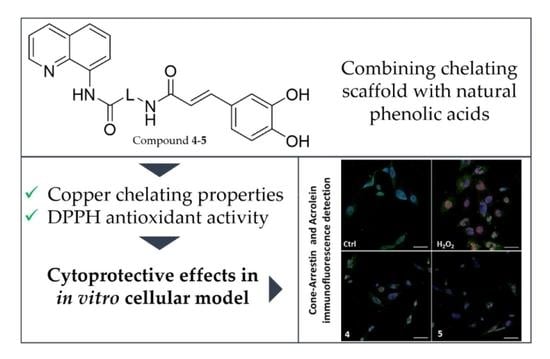
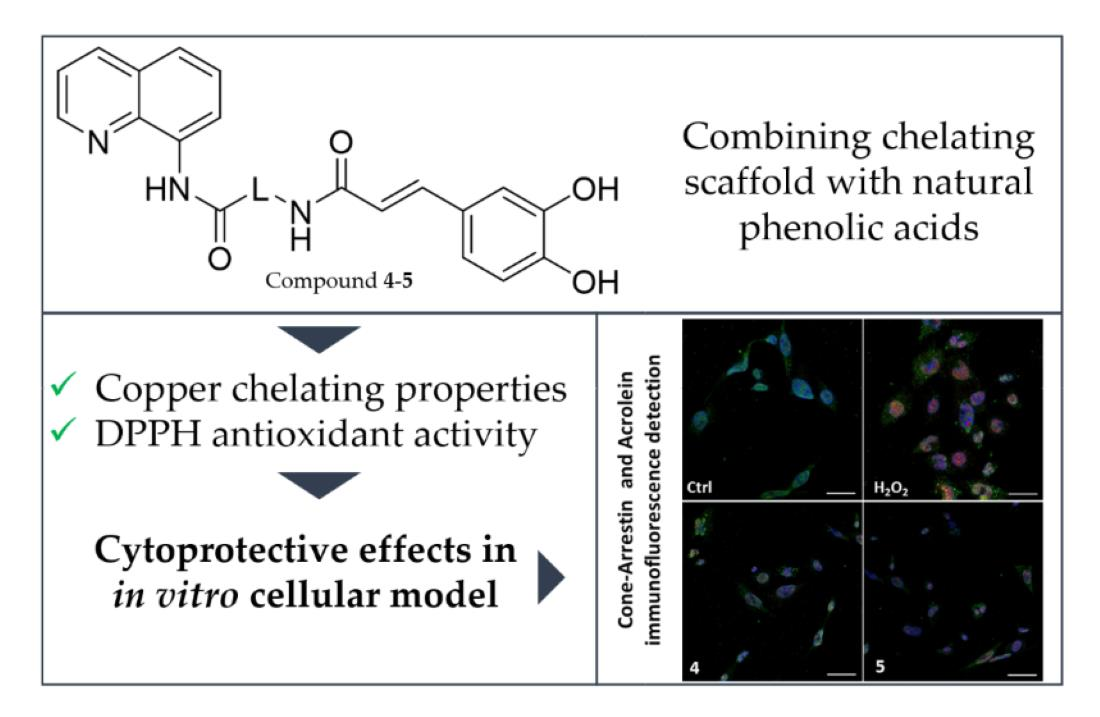
Design, Synthesis, and In Vitro Evaluation of Novel 8-Amino-Quinoline Combined with Natural Antioxidant Acids

 ,
,  ,
,  ,
, 

Abstract
:
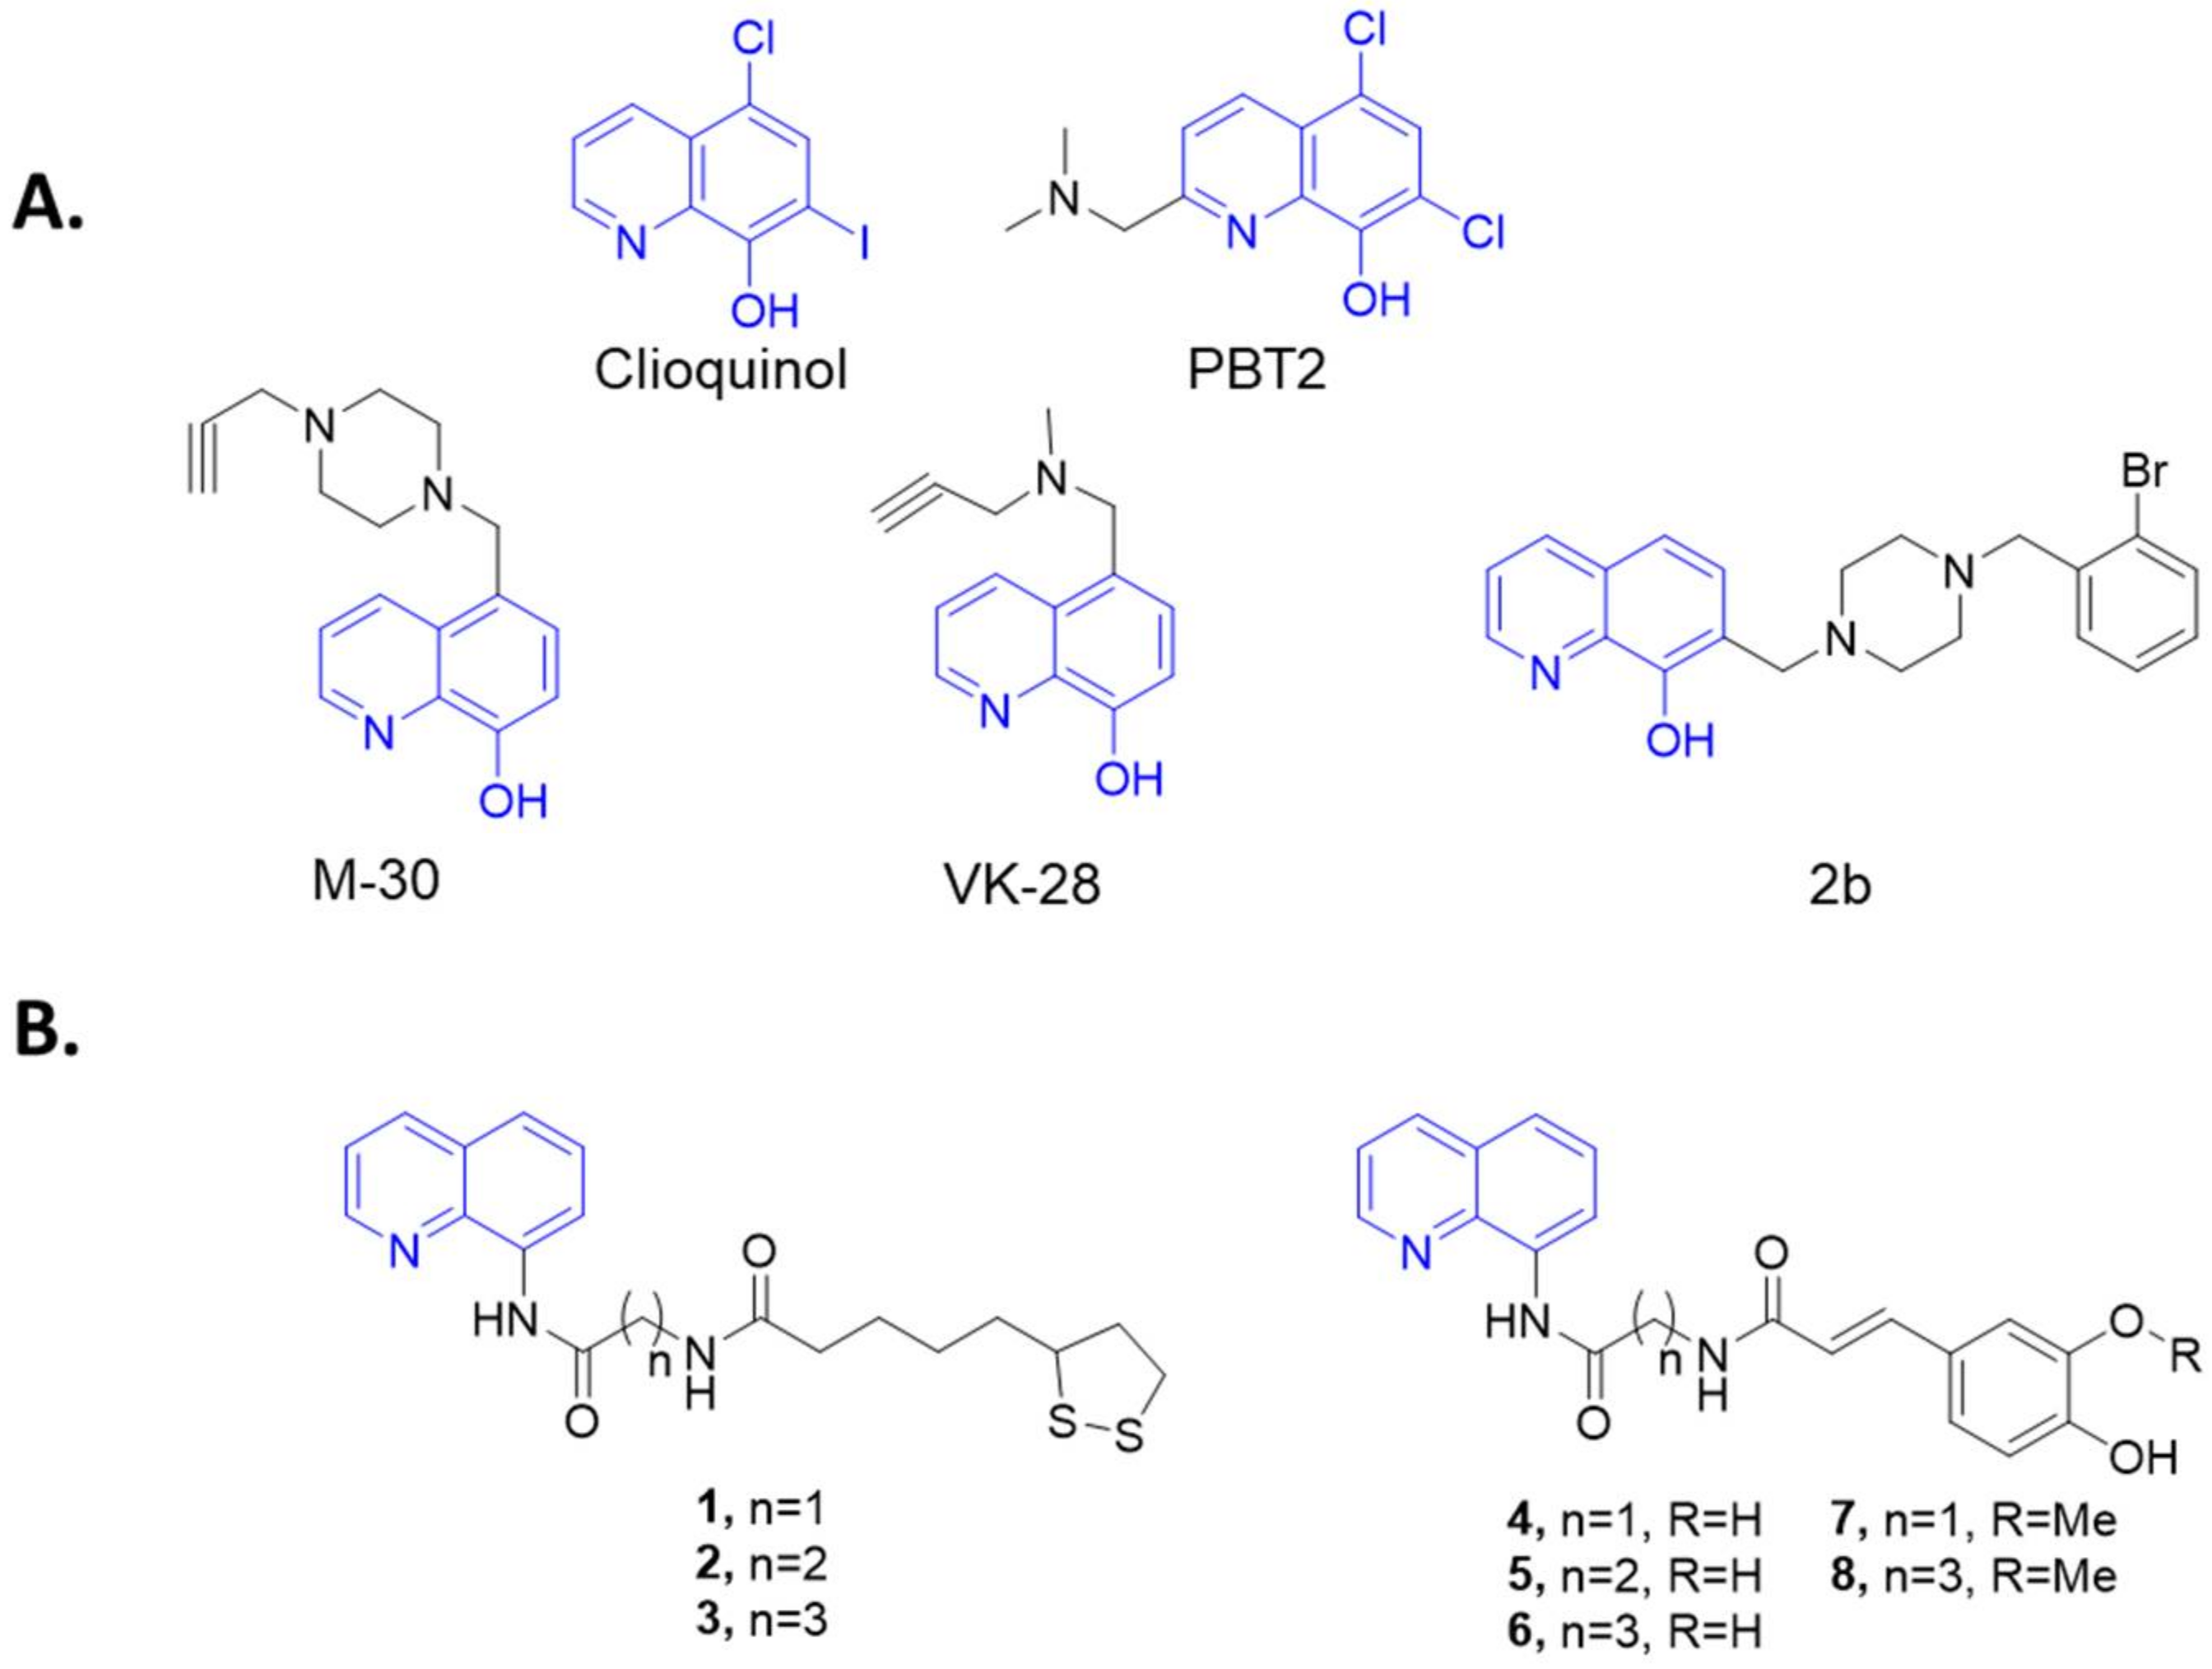
1. Introduction
2. Results
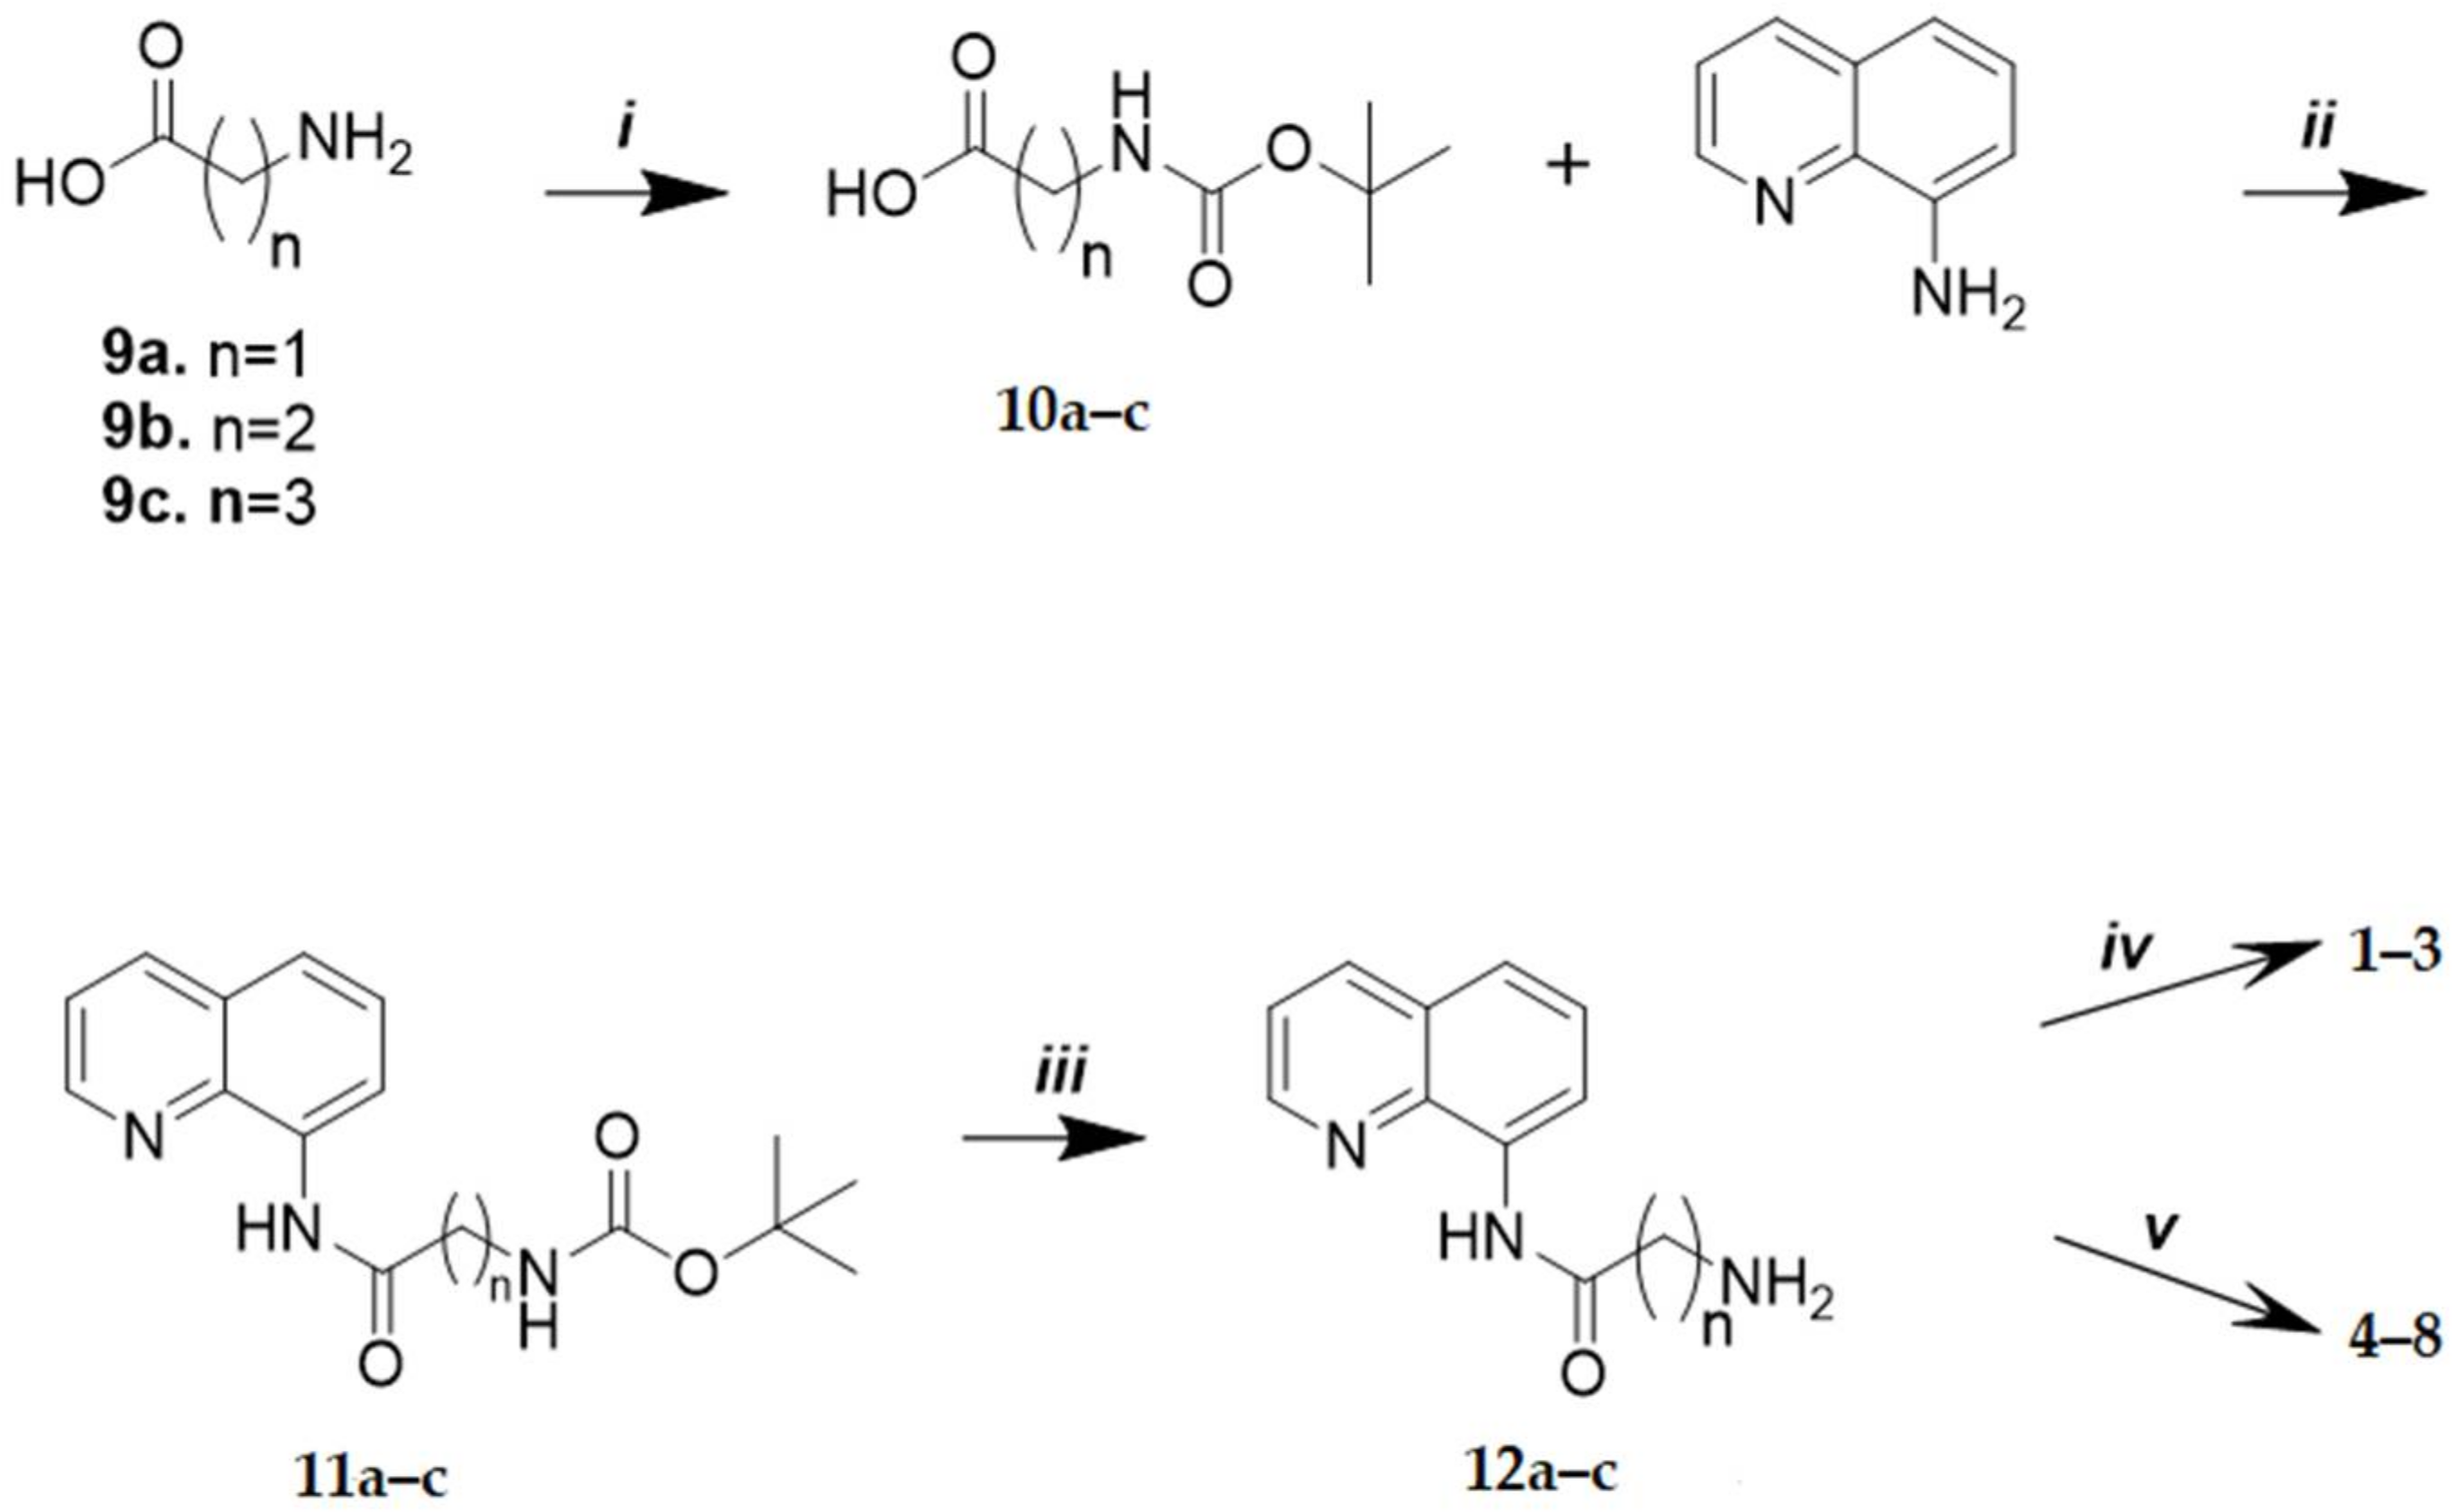
2.1. Chemistry
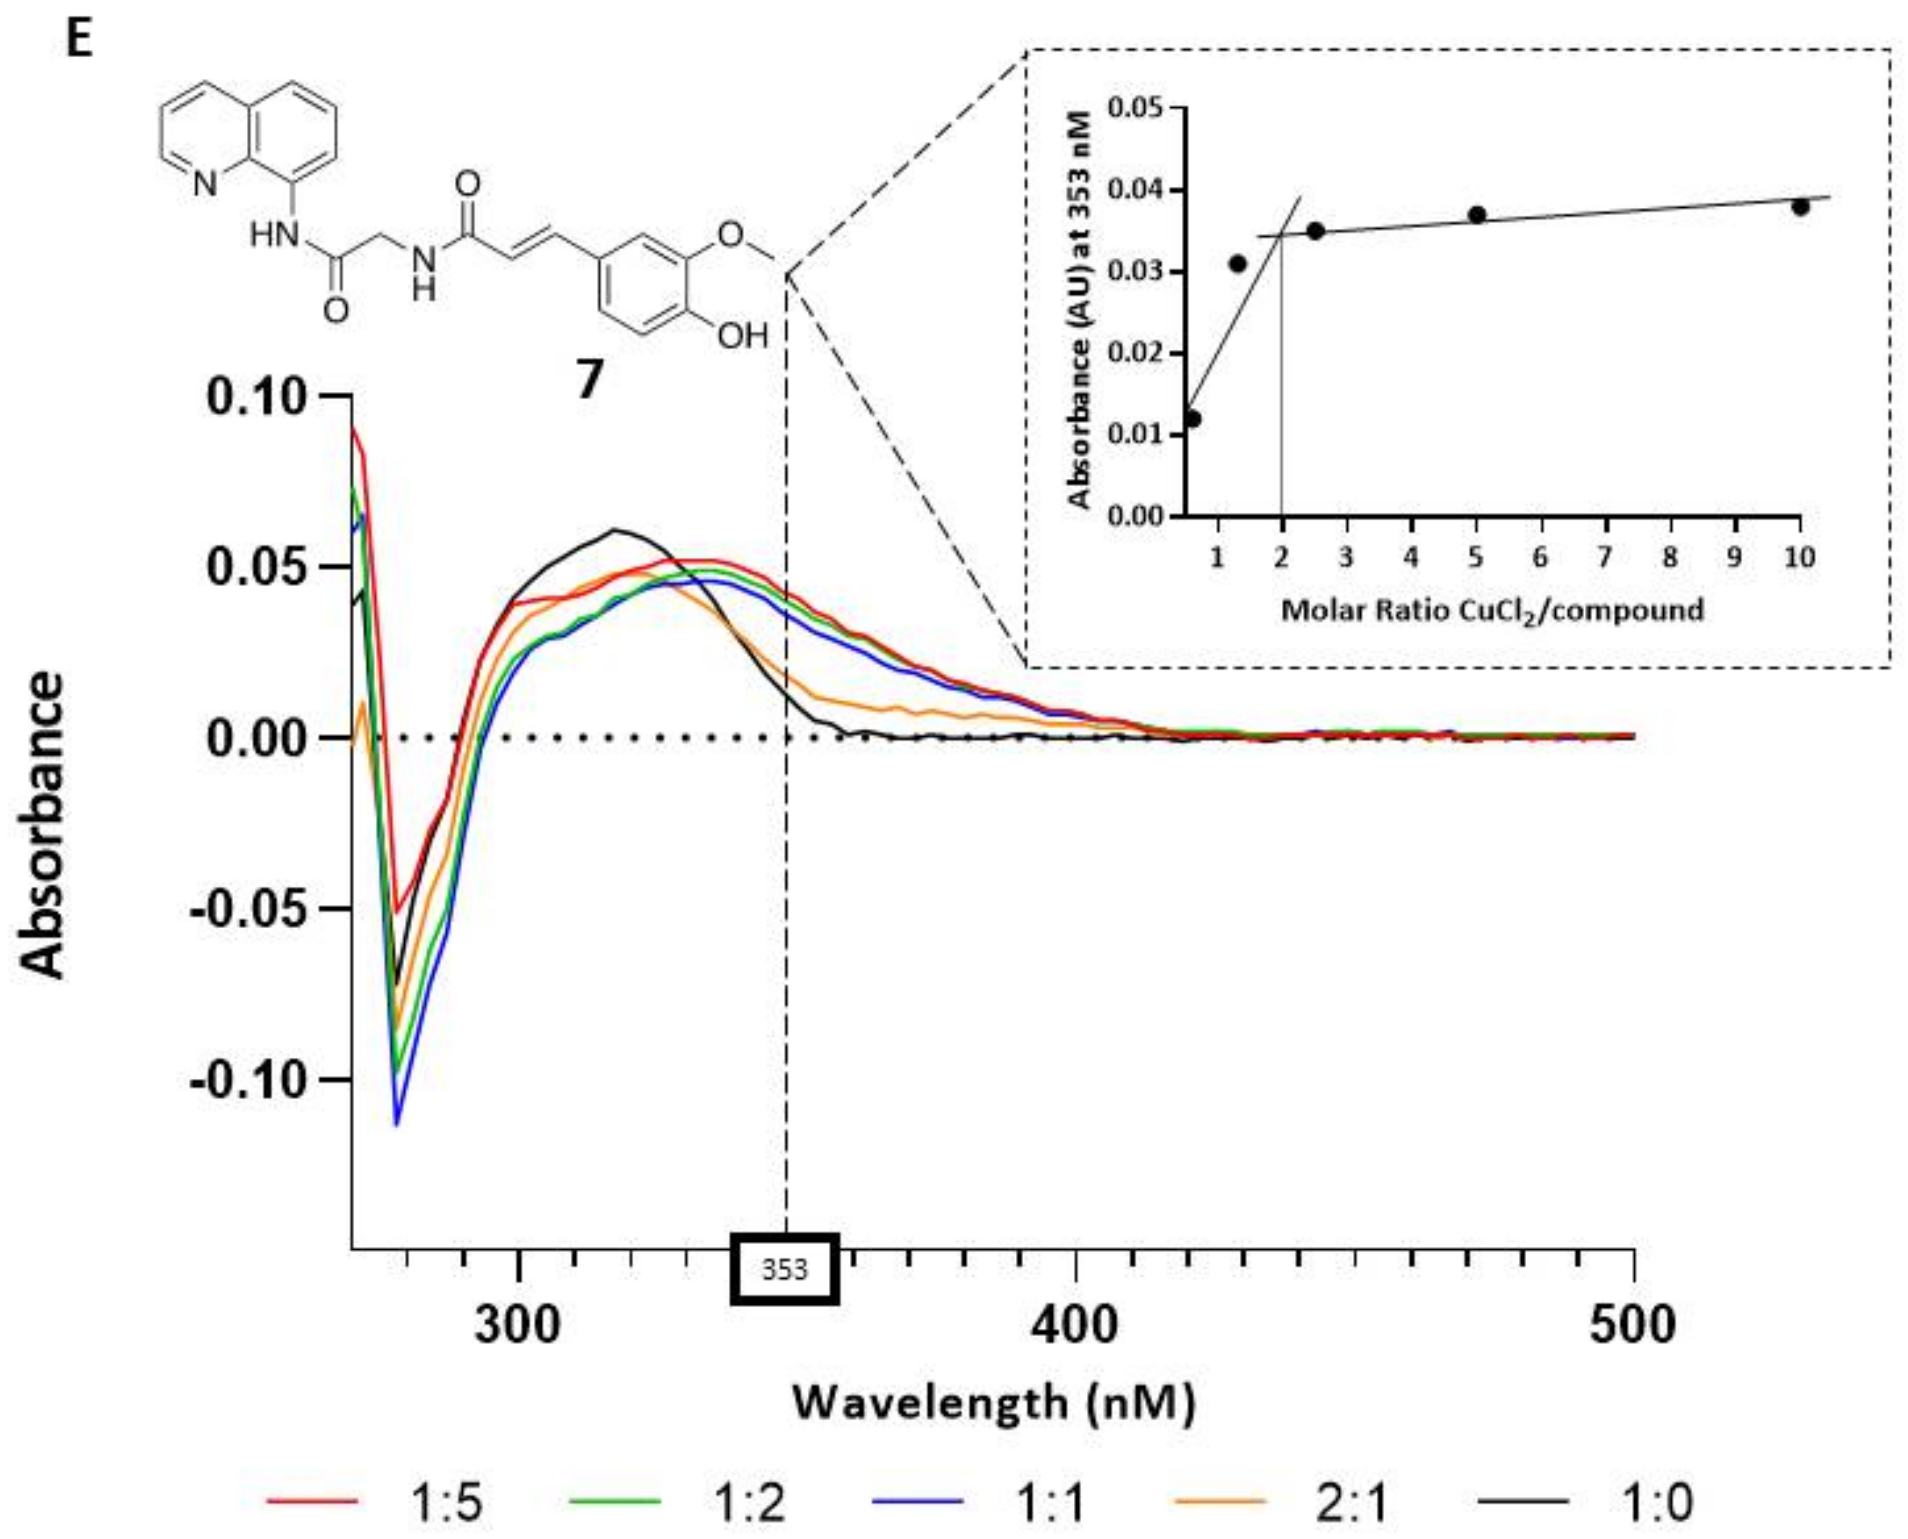
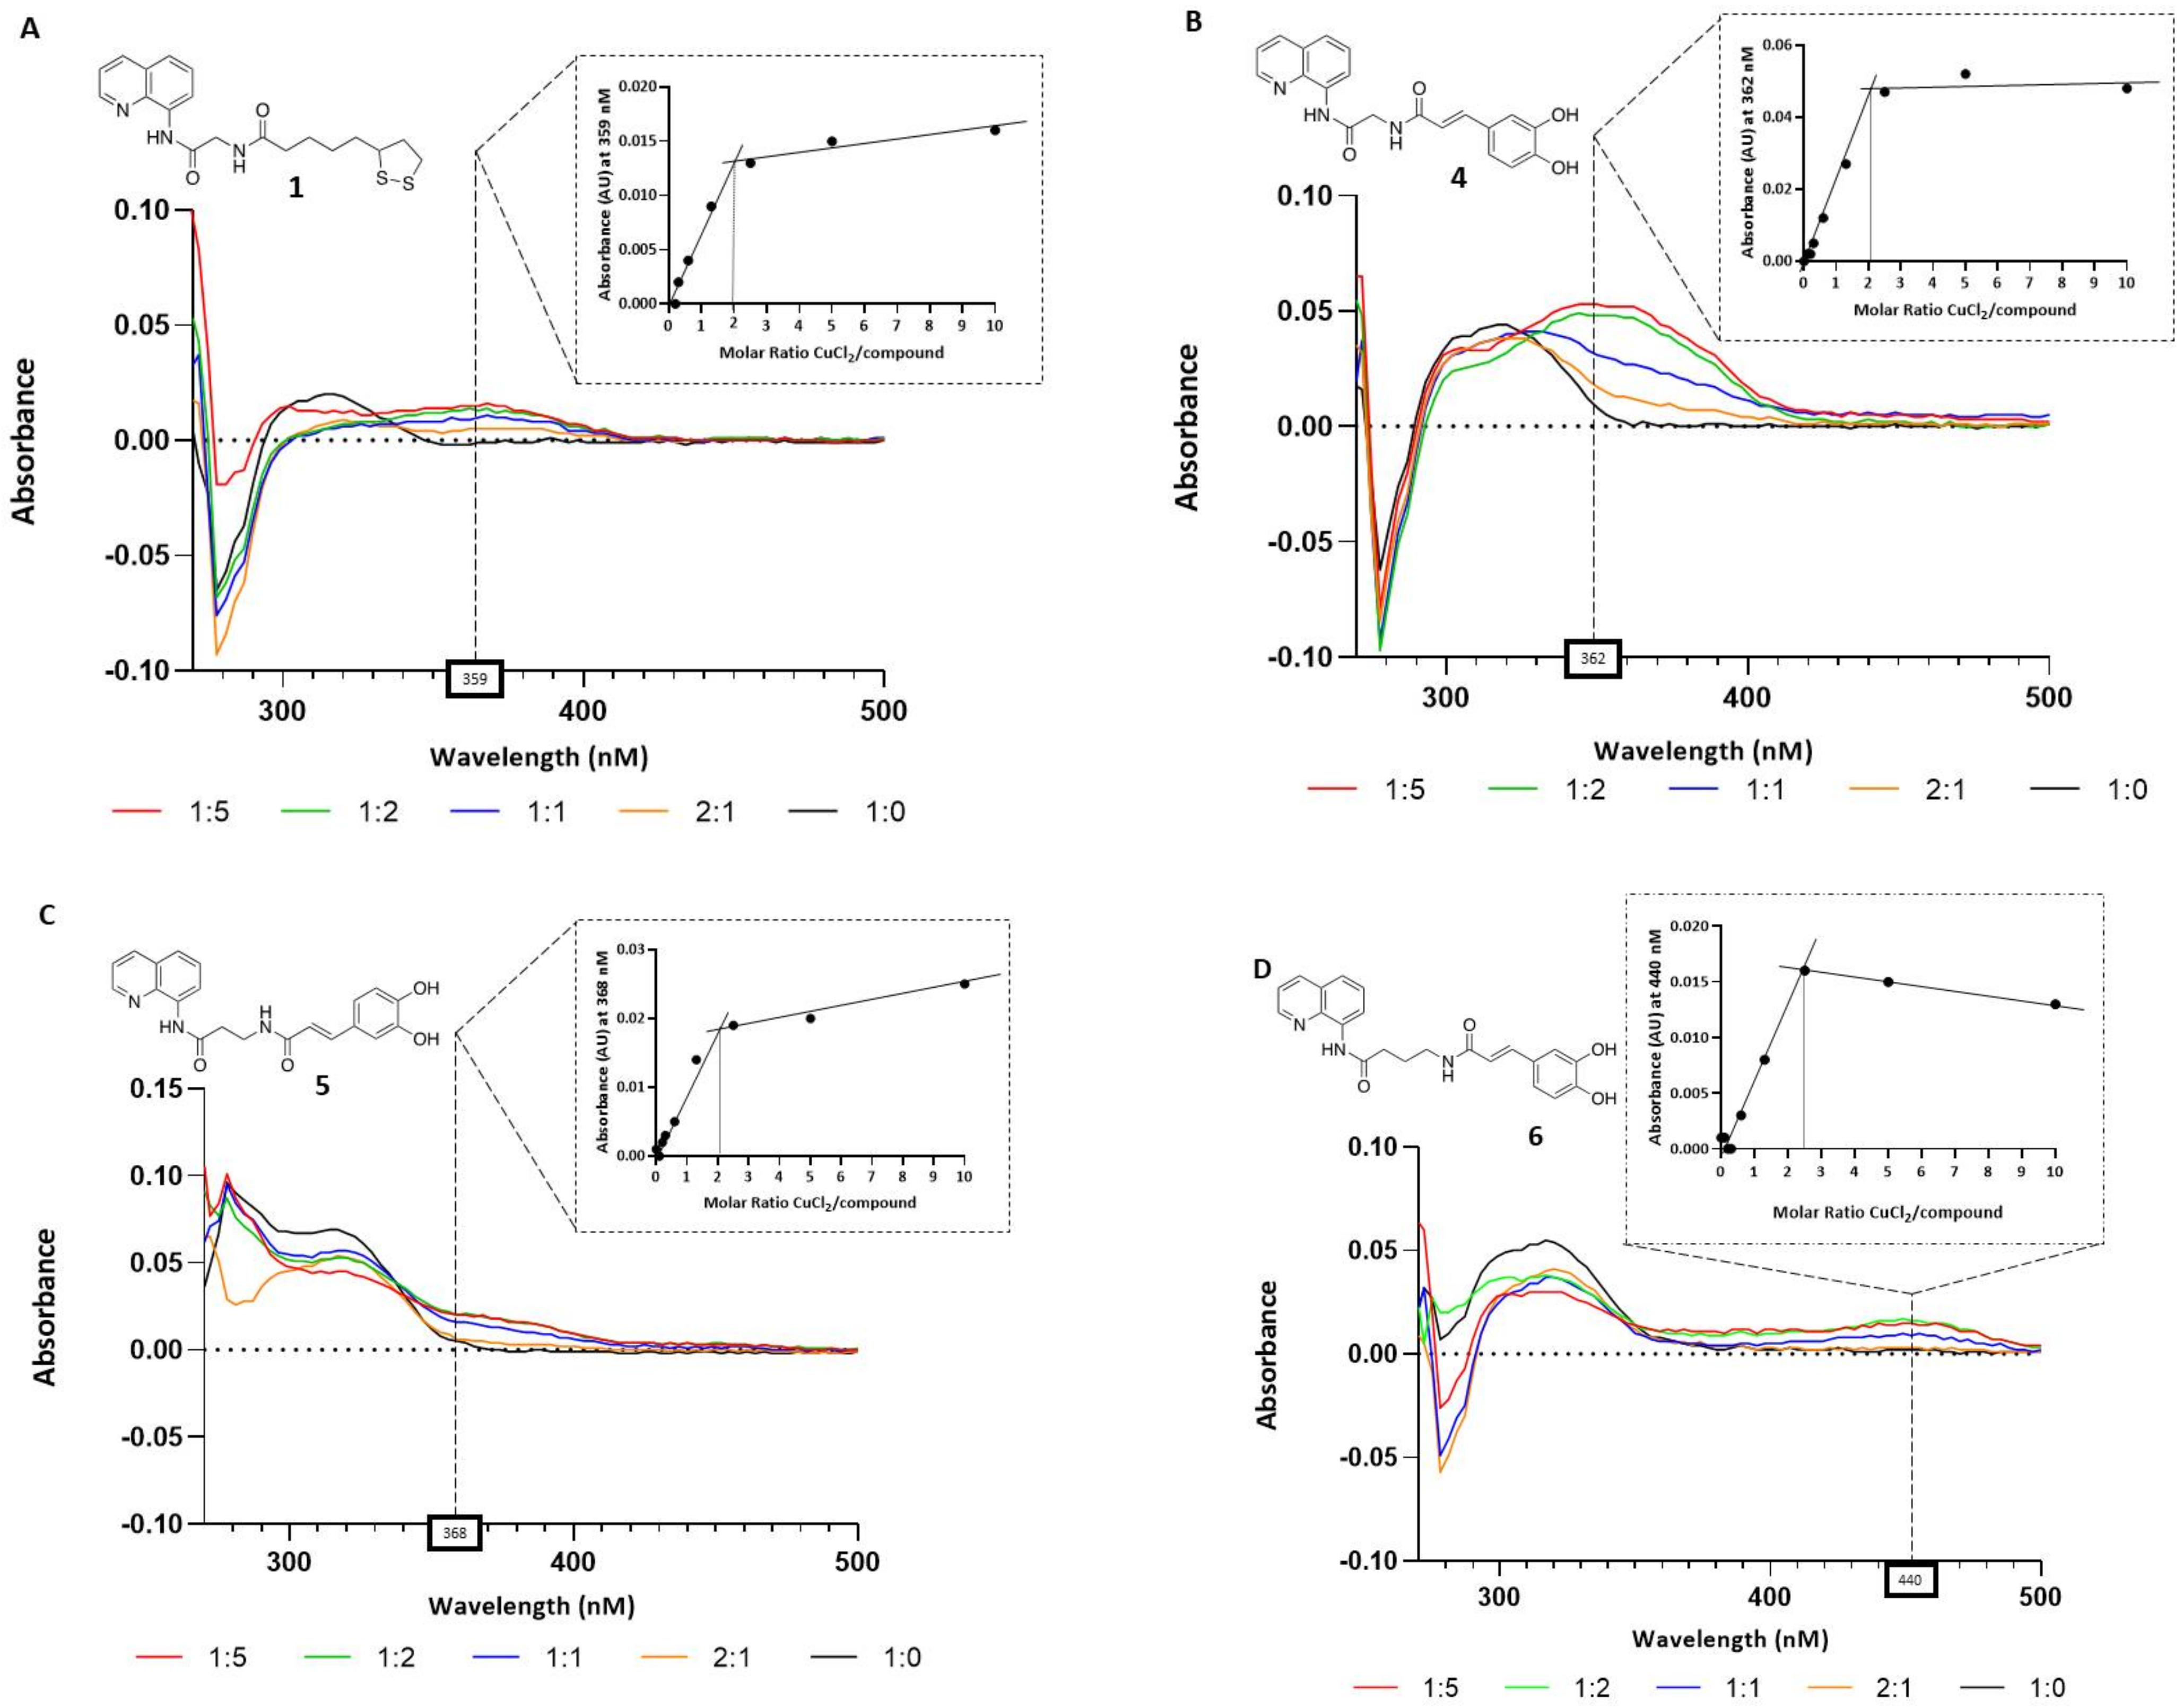
2.2. Copper-Chelating Activity Test
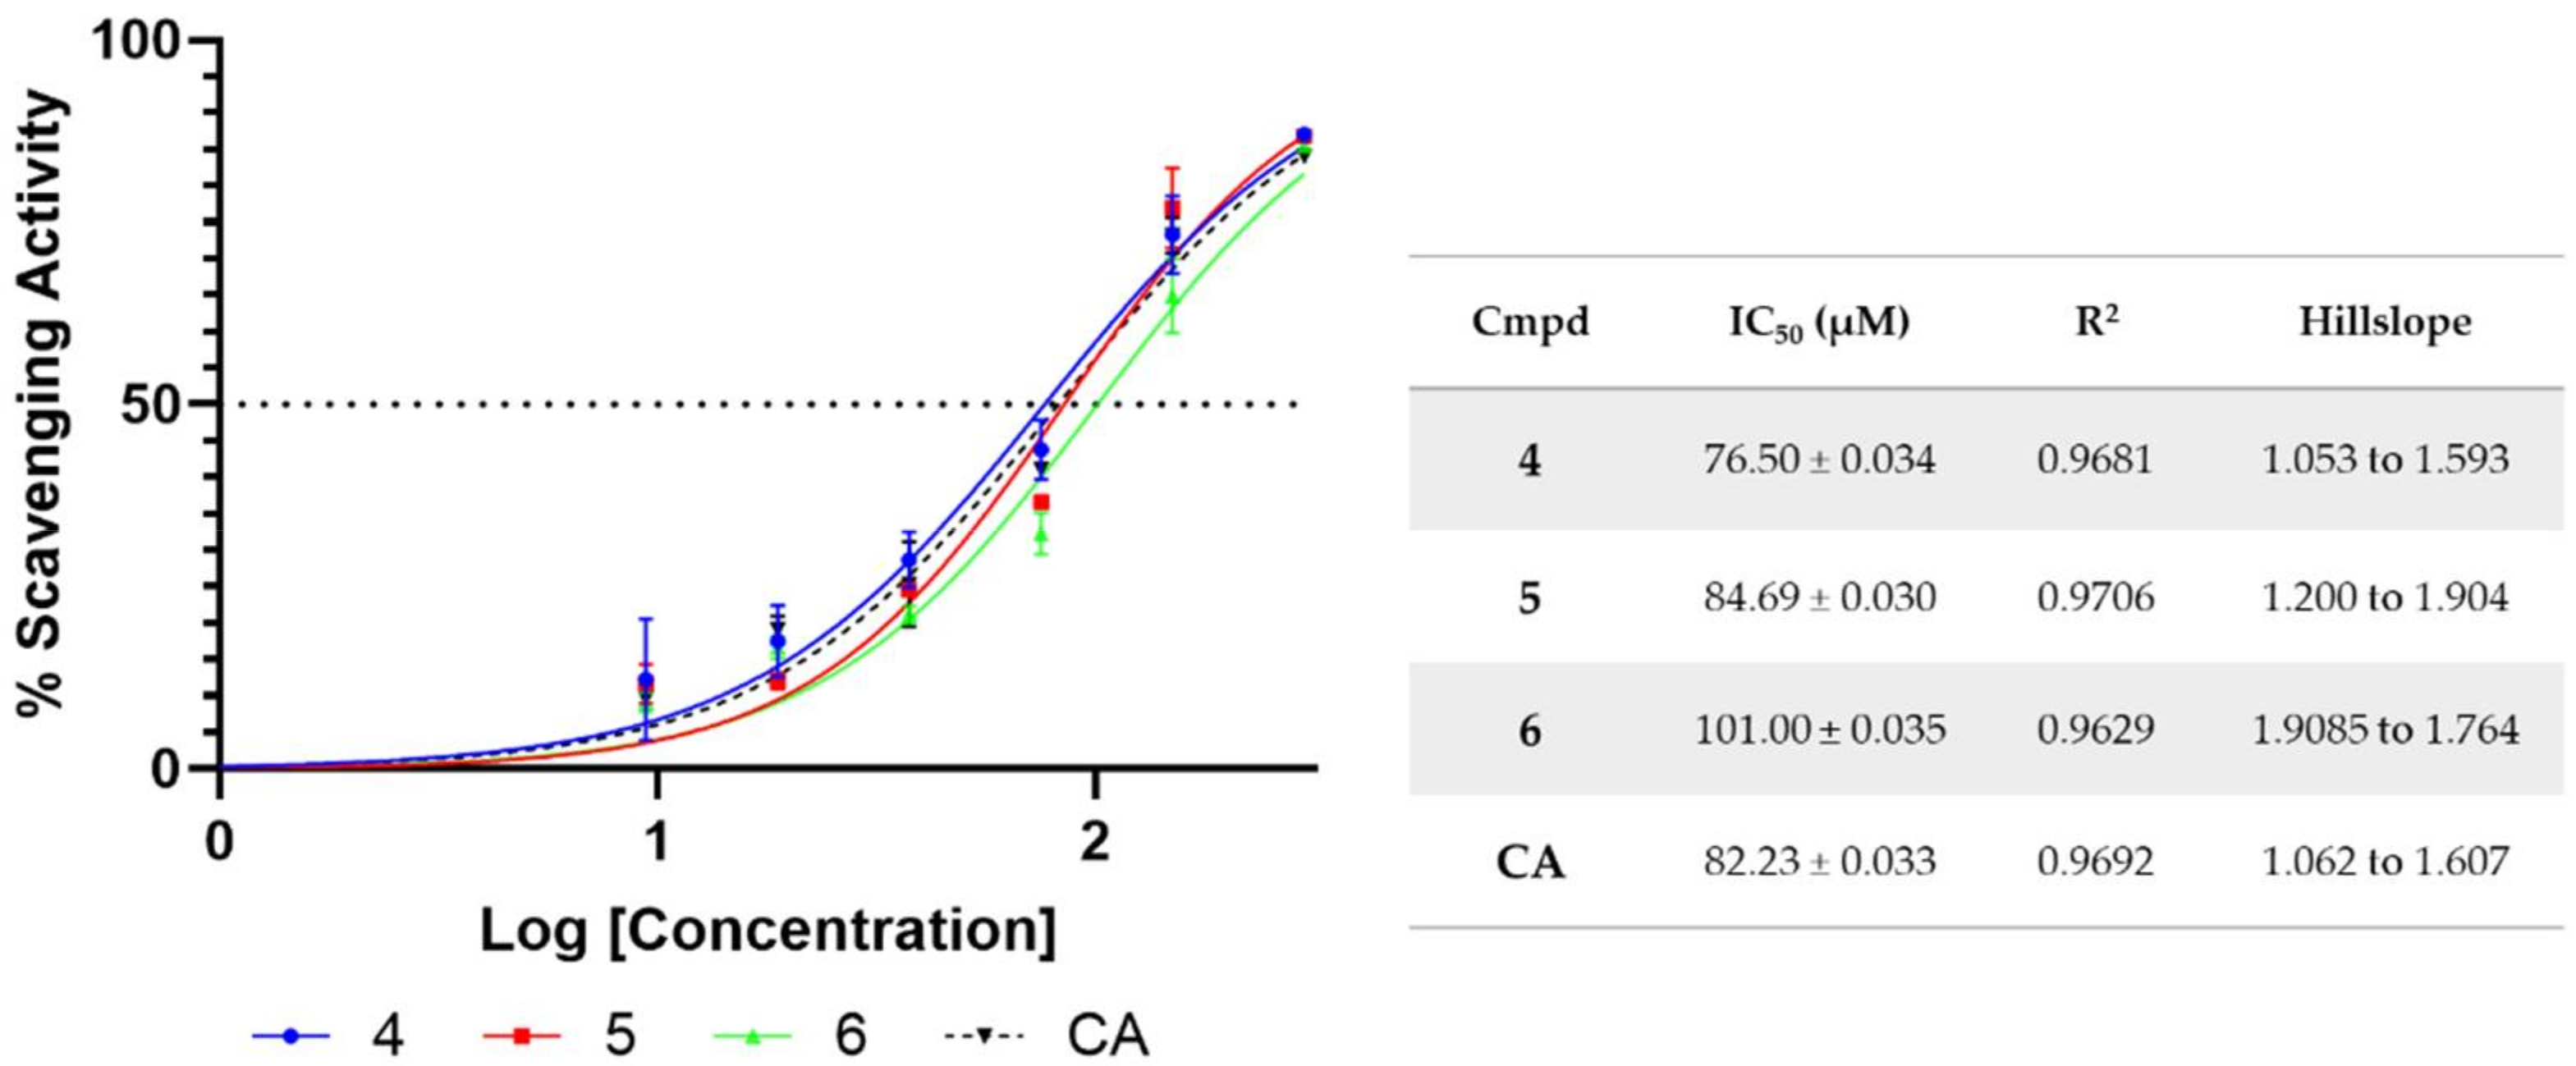
2.3. Radical-Scavenging Activity
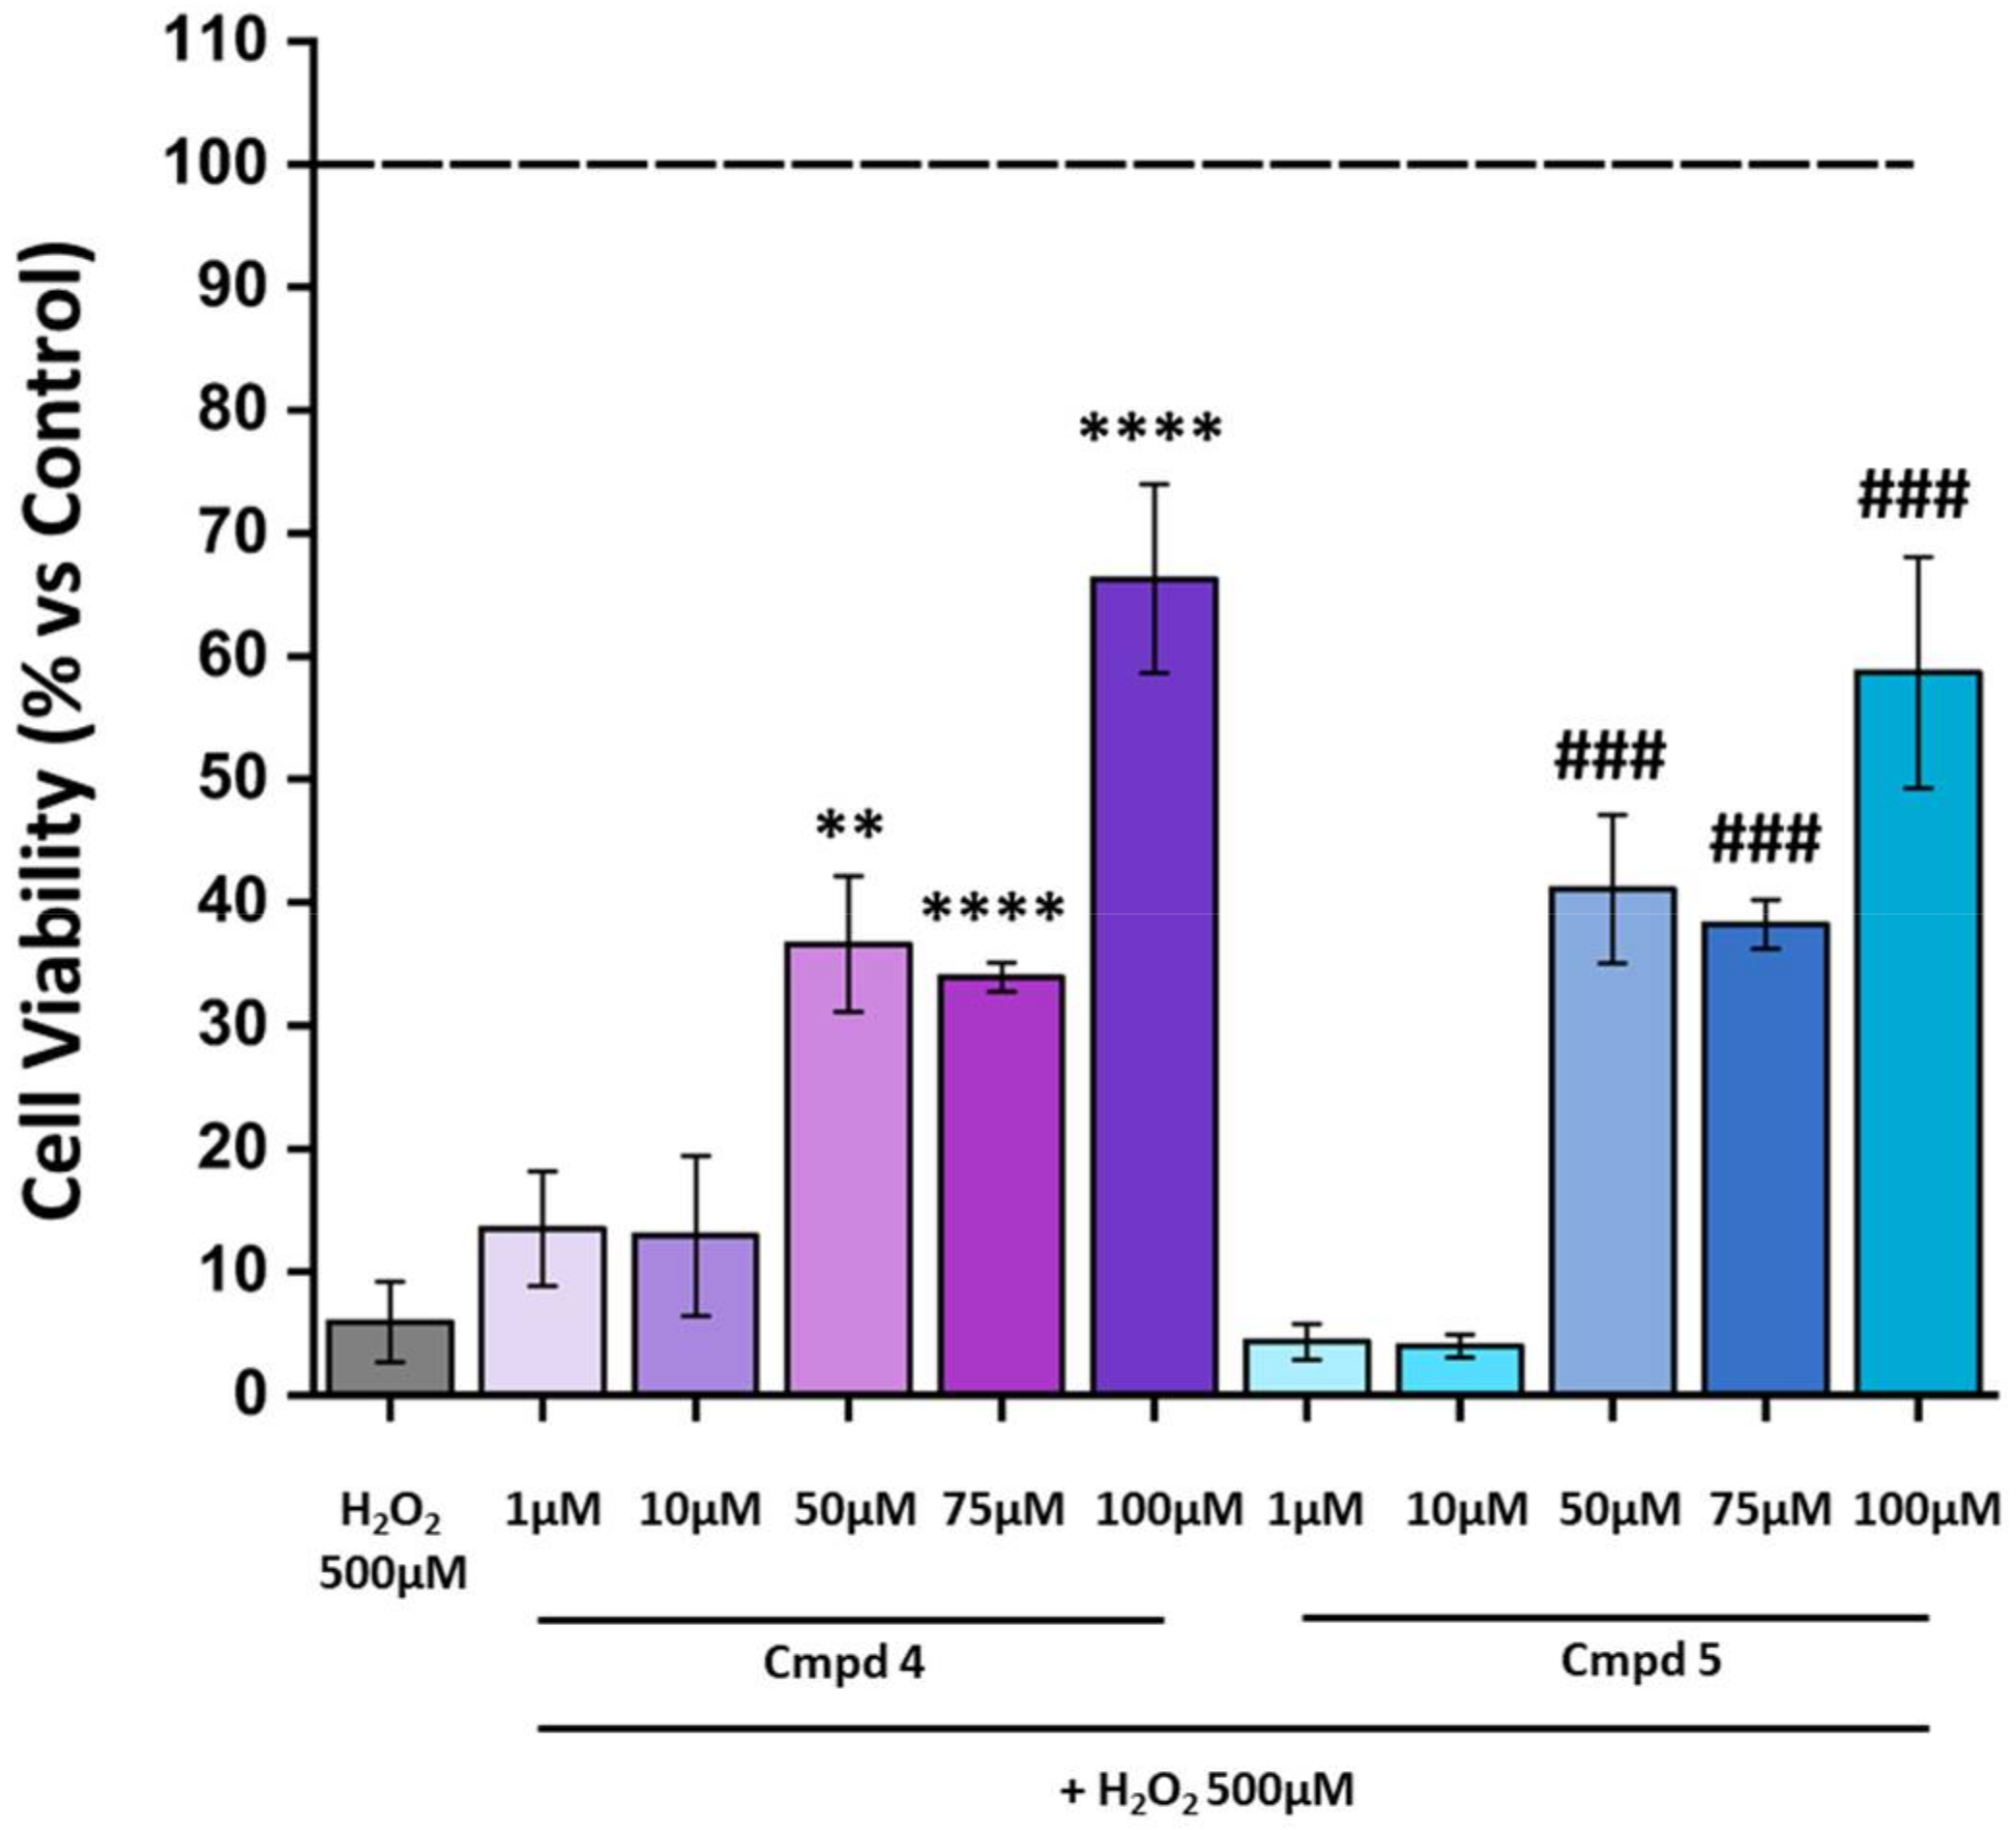
2.4. Biological Evaluation of Compound in H2O2-Induced Cell Death
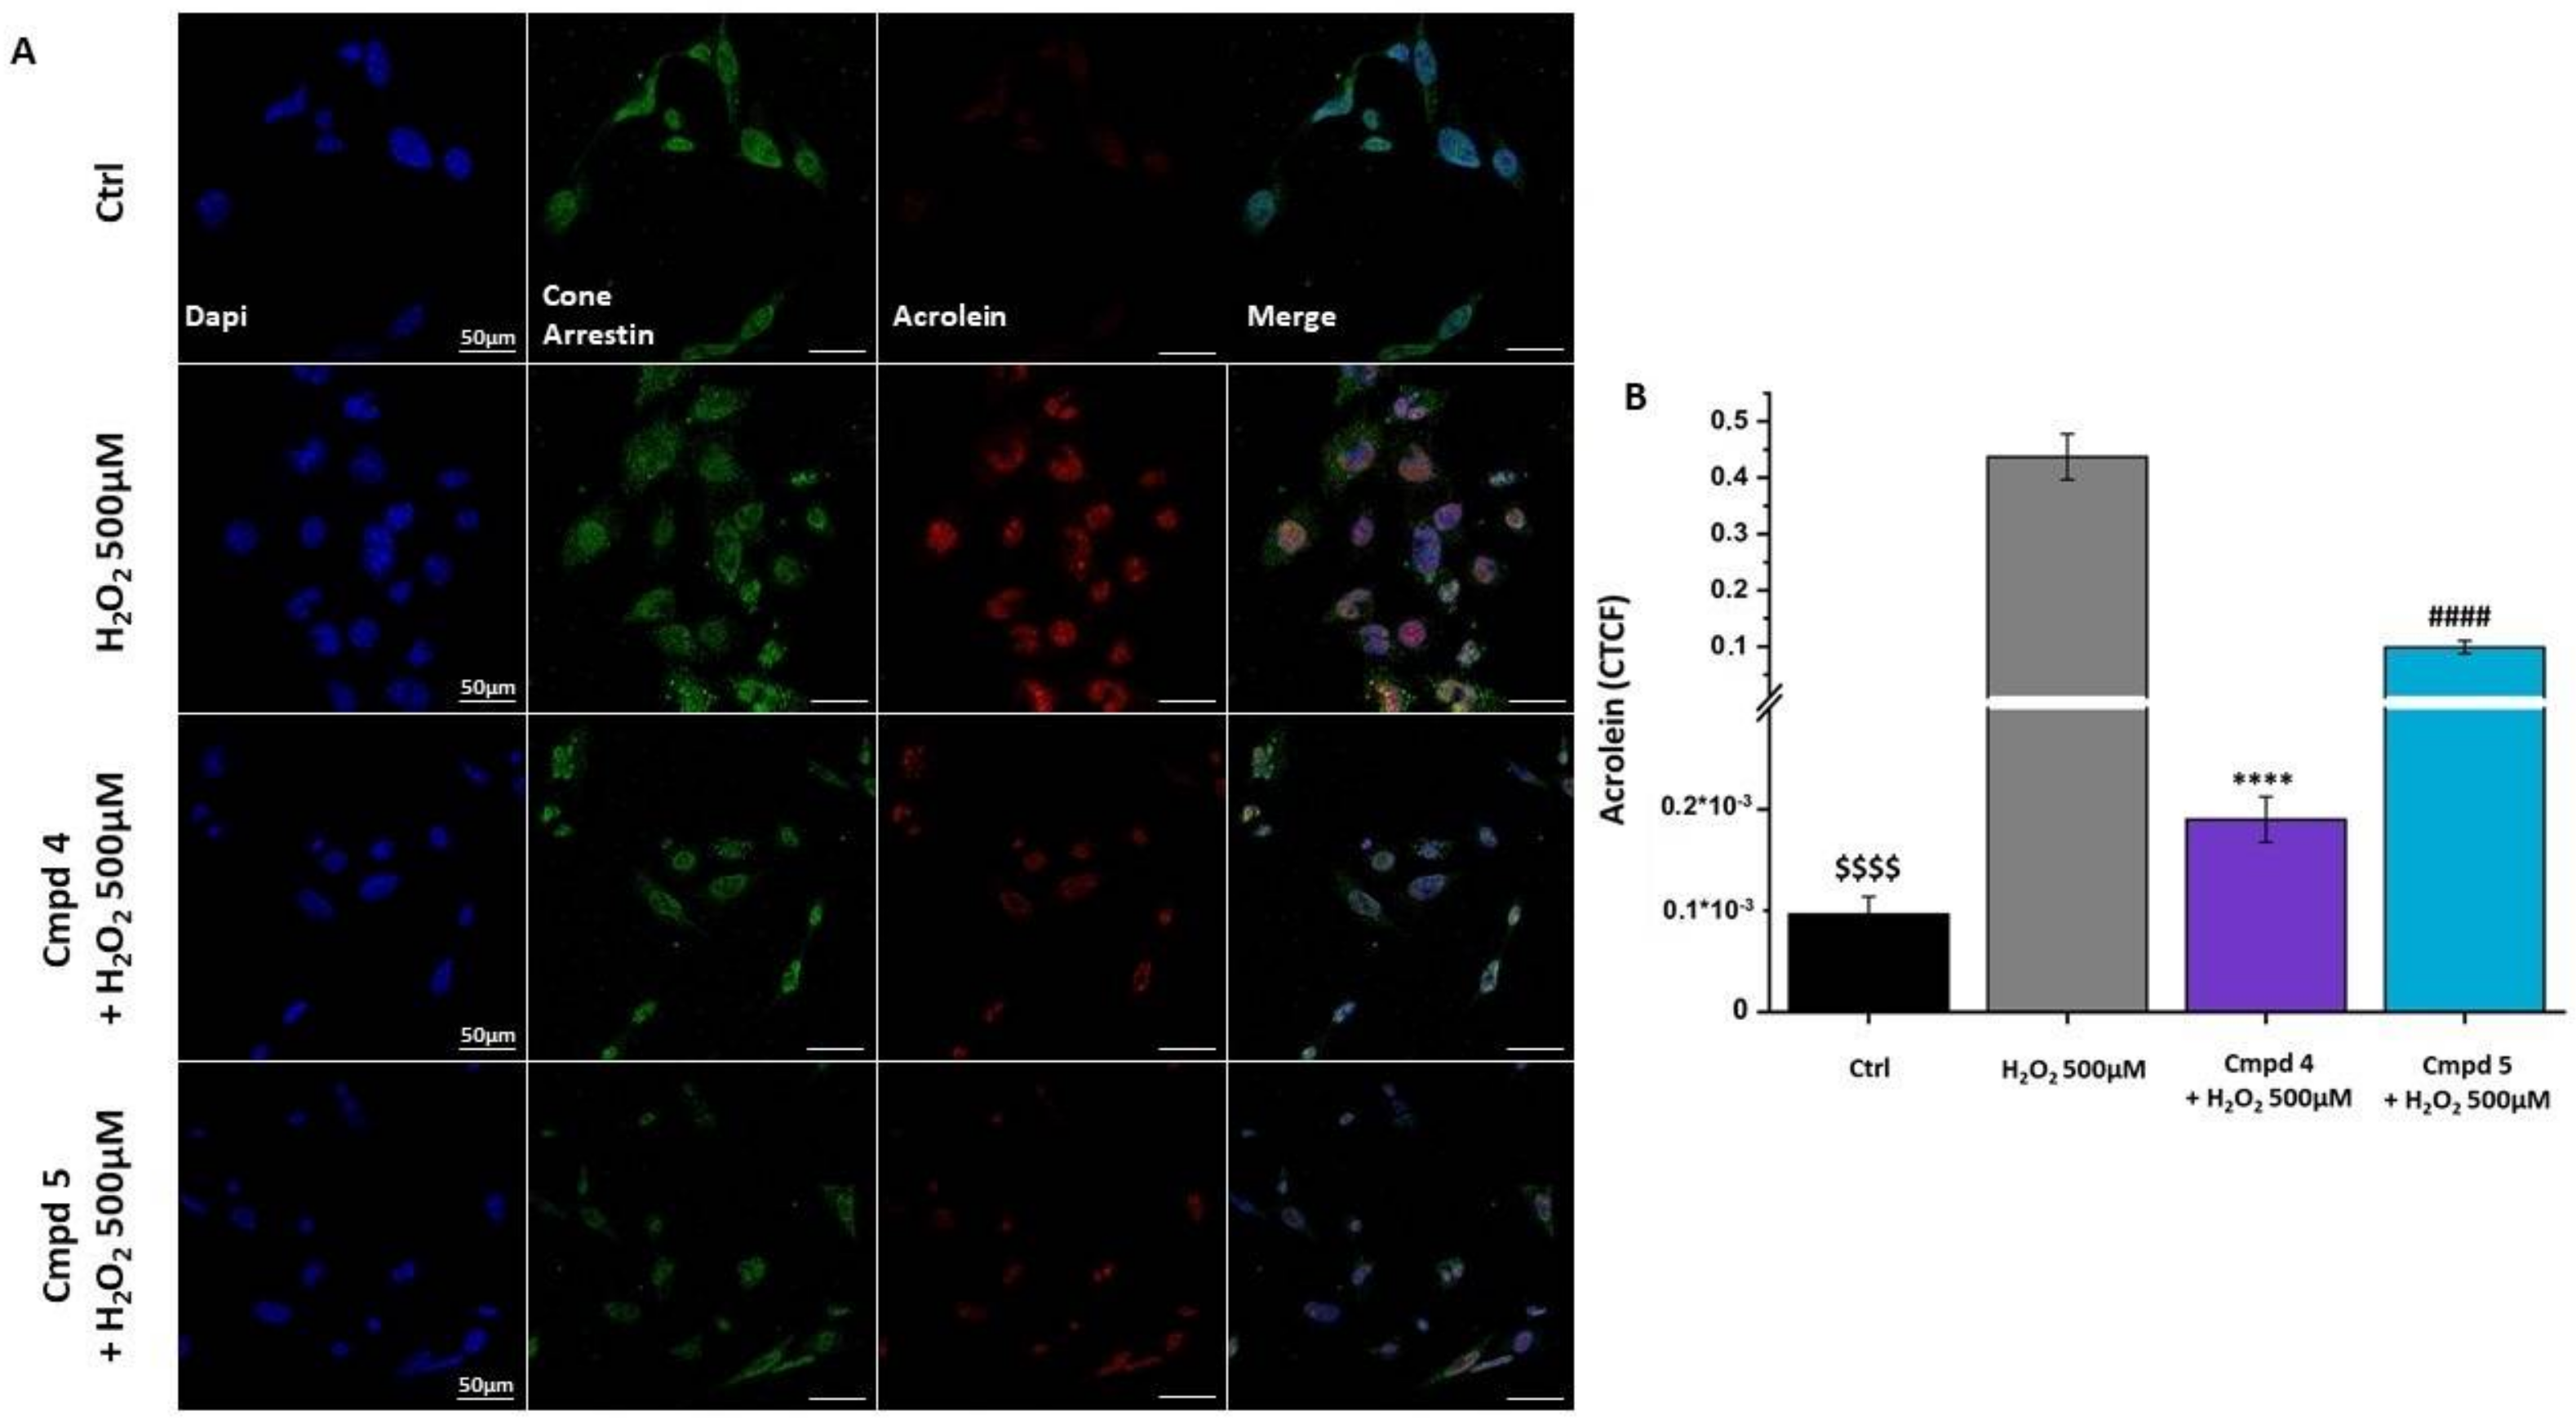
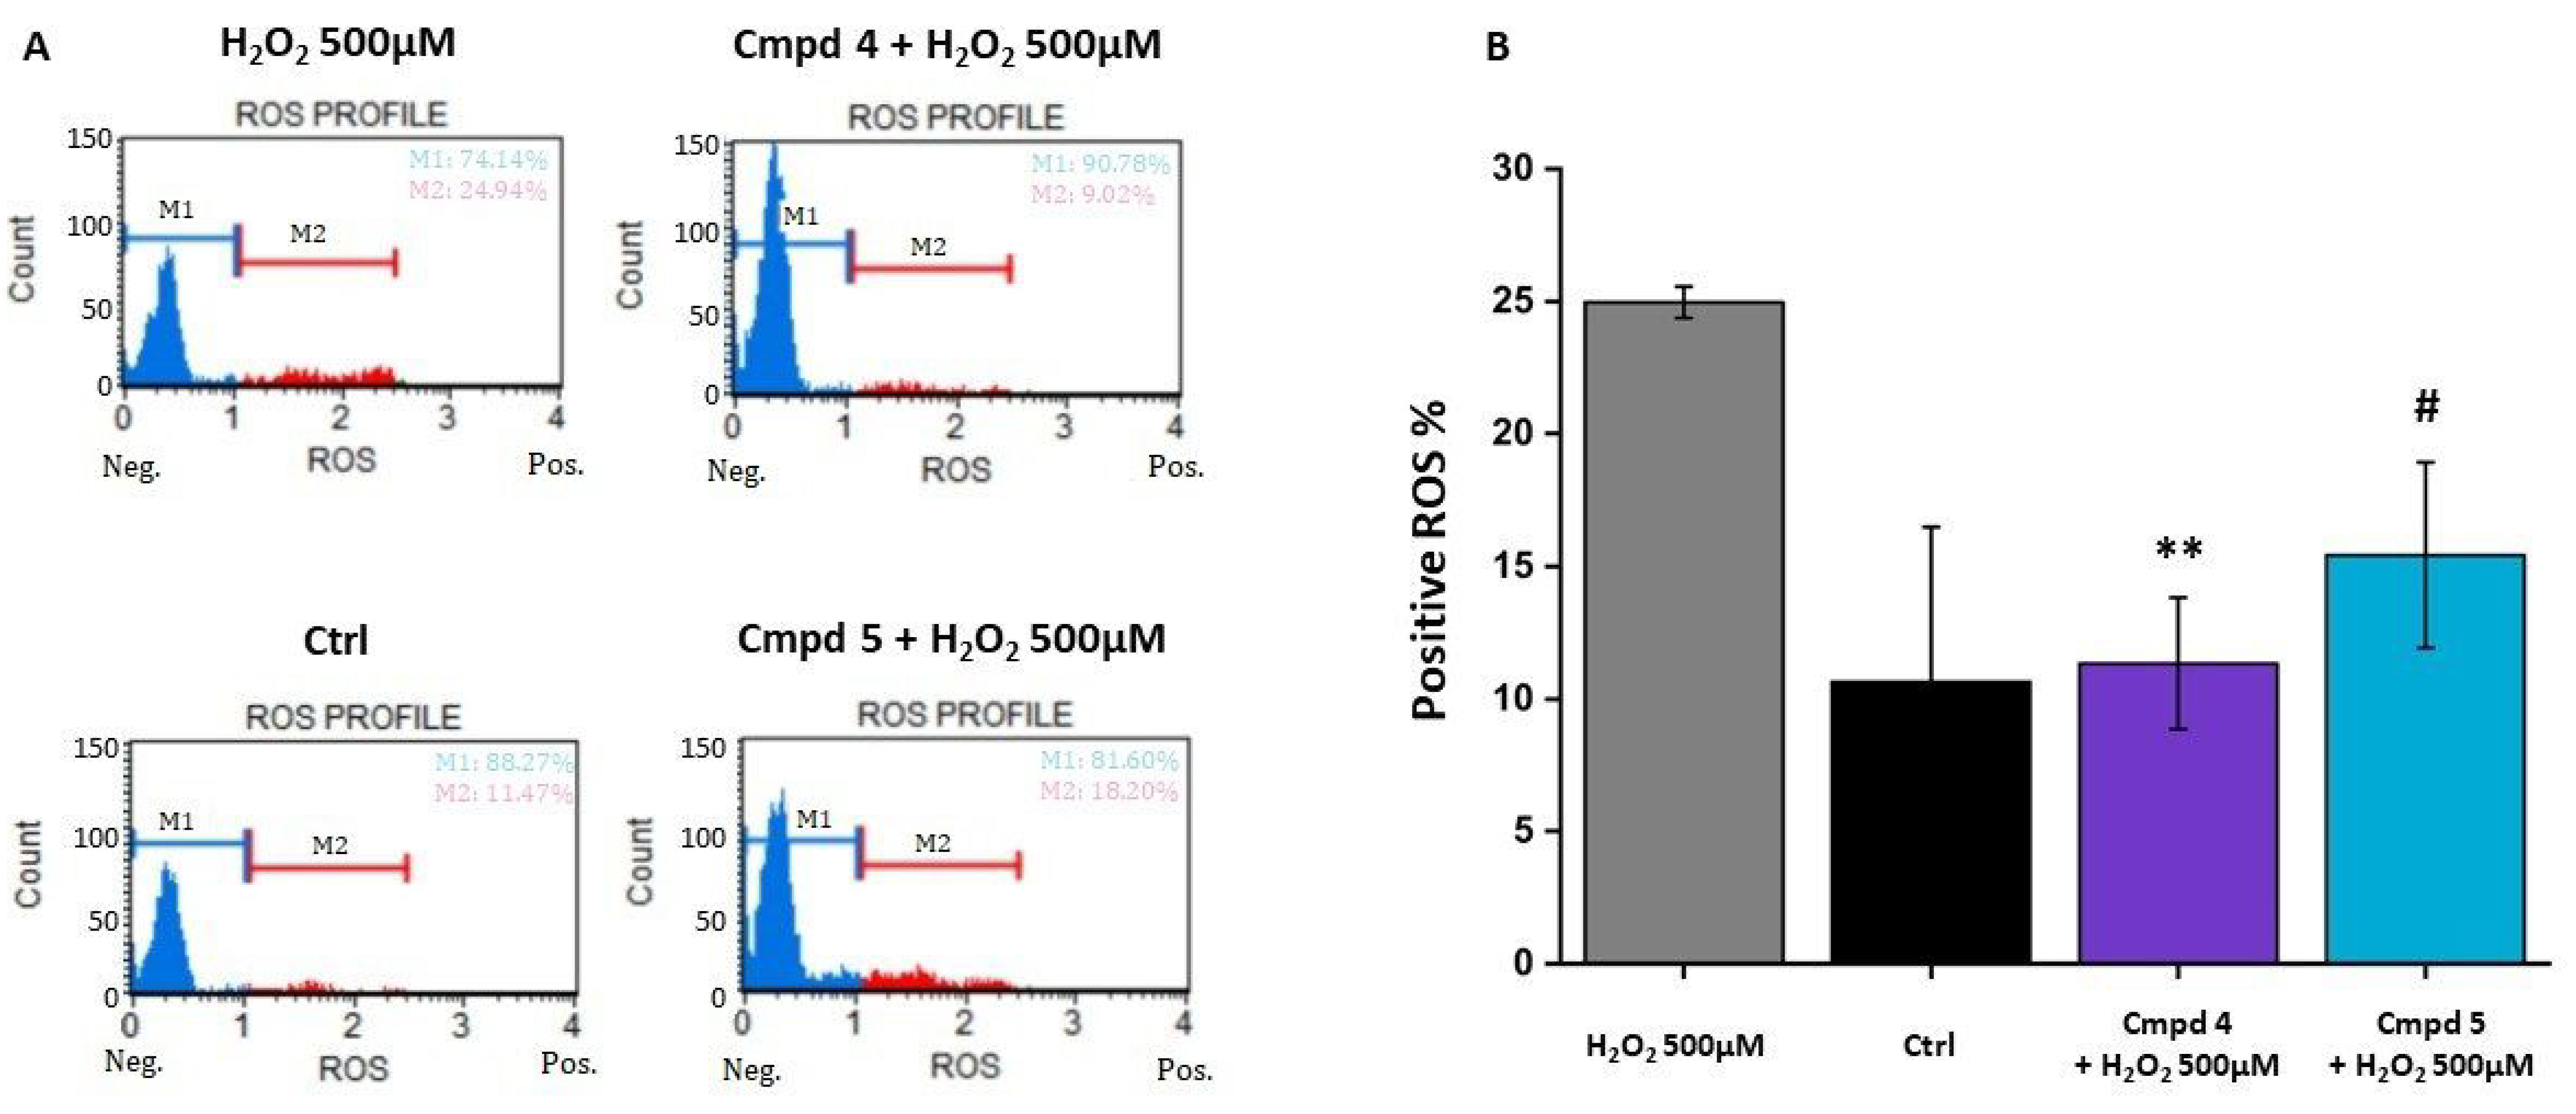
2.5. Compounds 4 and 5 Protect 661W Photoreceptors from H2O2-Induced Cell Death by Reducing Intracellular ROS Generation
3. Discussion
4. Materials and Methods
4.1. Synthesis and Characterization
General Procedure for the Synthesis of Compounds 1–3
- i.
- General Procedure for the Synthesis of Caffeic Acid Derivatives 4–6
- ii.
- General Procedure for the Synthesis of Caffeic Acid Derivatives 7 and 8
- iii.
- Synthesis of Intermediates 10a–c, 11a–c, and Free Amines 12a–c
4.2. In Vitro Biological Assay
4.2.1. Metal-Chelating Study
4.2.2. DPPH Assay
4.3. In Vitro Cell Line Screening
4.3.1. Cell Culture
4.3.2. Drug Stock Preparation
4.3.3. Cell Viability
4.3.4. Intracellular Reactive Oxygen Species’ (ROS) Determination
4.3.5. Immunofluorescence
4.3.6. Statistical Analysis in Vitro Assay
5. Conclusions
Supplementary Materials
Author Contributions
Funding
Institutional Review Board Statement
Informed Consent Statement
Data Availability Statement
Acknowledgments
Conflicts of Interest
Abbreviations
References
- Redza-Dutordoir, M.; Averill-Bates, D.A. Activation of apoptosis signalling pathways by reactive oxygen species. Biochim. Biophys. Acta 2016, 1863, 2977–2992. [Google Scholar] [CrossRef] [PubMed]
- Kim, G.H.; Kim, J.E.; Rhie, S.J.; Yoon, S. The Role of Oxidative Stress in Neurodegenerative Diseases. Exp. Neurobiol. 2015, 24, 325–340. [Google Scholar] [CrossRef] [PubMed]
- Sidorova, Y.; Domanskyi, A. Detecting Oxidative Stress Biomarkers in Neurodegenerative Disease Models and Patients. Methods Protoc. 2020, 3, 66. [Google Scholar] [CrossRef]
- Guo, T.; Zhang, D.; Zeng, Y.; Huang, T.Y.; Xu, H.; Zhao, Y. Molecular and cellular mechanisms underlying the pathogenesis of Alzheimer’s disease. Mol. Neurodegener. 2020, 15, 40. [Google Scholar] [CrossRef]
- Michalska, P.; León, R. When It Comes to an End: Oxidative Stress Crosstalk with Protein Aggregation and Neuroinflammation Induce Neurodegeneration. Antioxidants 2020, 9, 740. [Google Scholar] [CrossRef]
- Piano, I.; Corsi, F.; Polini, B.; Gargini, C. Nutraceutical Molecules Slow Down Retinal Degeneration, in Tvrm4 Mice a Model of Retinitis Pigmentosa, by Genetic Modulation of Anti-oxidant Pathway. Front. Neurosci. 2022, 16. [Google Scholar] [CrossRef]
- Komeima, K.; Rogers, B.S.; Campochiaro, P.A. Antioxidants slow photoreceptor cell death in mouse models of retinitis pigmentosa. J. Cell. Physiol. 2007, 213, 809–815. [Google Scholar] [CrossRef]
- Oveson, B.C.; Iwase, T.; Hackett, S.F.; Lee, S.Y.; Usui, S.; Sedlak, T.W.; Snyder, S.H.; Campochiaro, P.A.; Sung, J.U. Constituents of bile, bilirubin and TUDCA, protect against oxidative stress-induced retinal degeneration. J. Neurochem. 2011, 116, 144–153. [Google Scholar] [CrossRef] [Green Version]
- Fernández-Sánchez, L.; Lax, P.; Esquiva, G.; Martín-Nieto, J.; Pinilla, I.; Cuenca, N. Safranal, a saffron constituent, attenuates retinal degeneration in P23H rats. PLoS ONE 2012, 7, e43074. [Google Scholar] [CrossRef] [Green Version]
- Khansari, N.; Shakiba, Y.; Mahmoudi, M. Chronic inflammation and oxidative stress as a major cause of age-related diseases and cancer. Recent Pat. Inflamm. Allergy Drug Discov. 2009, 3, 73–80. [Google Scholar] [CrossRef]
- Sabbatino, F.; Conti, V.; Liguori, L.; Polcaro, G.; Corbi, G.; Manzo, V.; Tortora, V.; Carlomagno, C.; Vecchione, C.; Filippelli, A.; et al. Molecules and Mechanisms to Overcome Oxidative Stress Inducing Cardiovascular Disease in Cancer Patients. Life 2021, 11, 105. [Google Scholar] [CrossRef] [PubMed]
- Misrani, A.; Tabassum, S.; Yang, L. Mitochondrial Dysfunction and Oxidative Stress in Alzheimer’s Disease. Front. Aging Neurosci. 2021, 13, 617588. [Google Scholar] [CrossRef] [PubMed]
- Simpson, D.S.A.; Oliver, P.L. ROS Generation in Microglia: Understanding Oxidative Stress and Inflammation in Neurodegenerative Disease. Antioxidants 2020, 9, 743. [Google Scholar] [CrossRef] [PubMed]
- Jomova, K.; Baros, S.; Valko, M. Redox active metal-induced oxidative stress in biological systems. Transit. Metal. Chem. 2012, 37, 127–134. [Google Scholar] [CrossRef]
- Muhoberac, B.B.; Vidal, R. Iron, Ferritin, Hereditary Ferritinopathy, and Neurodegeneration. Front. Neurosci. 2019, 13, 1195. [Google Scholar] [CrossRef] [Green Version]
- Alfonso-Muñoz, E.A.; Burggraaf-Sánchez de Las Matas, R.; Mataix Boronat, J.; Molina Martín, J.C.; Desco, C. Role of Oral Antioxidant Supplementation in the Current Management of Diabetic Retinopathy. Int. J. Mol. Sci. 2021, 22, 4020. [Google Scholar] [CrossRef]
- Piano, I.; D’Antongiovanni, V.; Testai, L.; Calderone, V.; Gargini, C. A Nutraceutical Strategy to Slowing Down the Progression of Cone Death in an Animal Model of Retinitis Pigmentosa. Front. Neurosci. 2019, 13, 461. [Google Scholar] [CrossRef] [Green Version]
- Olivares-González, L.; Velasco, S.; Campillo, I.; Salom, D.; González-García, E.; Soriano Del Castillo, J.M.; Rodrigo, R. Nutraceutical Supplementation Ameliorates Visual Function, Retinal Degeneration, and Redox Status in rd10 Mice. Antioxidants 2021, 10, 1033. [Google Scholar] [CrossRef]
- Shen, J.; Yang, X.; Dong, A.; Petters, R.M.; Peng, Y.W.; Wong, F.; Campochiaro, P.A. Oxidative damage is a potential cause of cone cell death in retinitis pigmentosa. J. Cell. Physiol. 2005, 203, 457–464. [Google Scholar] [CrossRef]
- Lee, S.Y.; Usui, S.; Zafar, A.B.; Oveson, B.C.; Jo, Y.J.; Lu, L.; Masoudi, S.; Campochiaro, P.A. N-Acetylcysteine promotes long-term survival of cones in a model of retinitis pigmentosa. J. Cell. Physiol. 2011, 226, 1843–1849. [Google Scholar] [CrossRef]
- Kang, K.; Yu, M. Protective effect of sulforaphane against retinal degeneration in the Pde6(rd10) mouse model of retinitis pigmentosa. Curr. Eye Res. 2017, 42, 1684–1688. [Google Scholar] [CrossRef] [PubMed] [Green Version]
- Campochiaro, P.A.; Iftikhar, M.; Hafiz, G.; Akhlaq, A.; Tsai, G.; Wehling, D.; Lu, L.; Wall, G.M.; Singh, M.S.; Kong, X. Oral N-acetylcysteine improves cone function in retinitis pigmentosa patients in phase I trial. J. Clin. Investig. 2020, 130, 1527–1541. [Google Scholar] [CrossRef] [PubMed] [Green Version]
- Safety, tolerability, and efficacy of PBT2 in Huntington’s disease: A phase 2, randomised, double-blind, placebo-controlled trial. Lancet. Neurol. 2015, 14, 39–47. [CrossRef]
- Avramovich-Tirosh, Y.; Amit, T.; Bar-Am, O.; Zheng, H.; Fridkin, M.; Youdim, M.B. Therapeutic targets and potential of the novel brain- permeable multifunctional iron chelator-monoamine oxidase inhibitor drug, M-30, for the treatment of Alzheimer’s disease. J. Neurochem. 2007, 100, 490–502. [Google Scholar] [CrossRef]
- Prati, F.; Bergamini, C.; Fato, R.; Soukup, O.; Korabecny, J.; Andrisano, V.; Bartolini, M.; Bolognesi, M.L. Novel 8-Hydroxyquinoline Derivatives as Multitarget Compounds for the Treatment of Alzheimer’s Disease. ChemMedChem 2016, 11, 1284–1295. [Google Scholar] [CrossRef]
- Youdim, M.B.; Fridkin, M.; Zheng, H. Bifunctional drug derivatives of MAO-B inhibitor rasagiline and iron chelator VK-28 as a more effective approach to treatment of brain ageing and ageing neurodegenerative diseases. Mech. Ageing Dev. 2005, 126, 317–326. [Google Scholar] [CrossRef]
- Sestito, S.; Wang, S.; Chen, Q.; Lu, J.; Bertini, S.; Pomelli, C.; Chiellini, G.; He, X.; Pi, R.; Rapposelli, S. Multi-targeted ChEI-copper chelating molecules as neuroprotective agents. Eur. J. Med. Chem. 2019, 174, 216–225. [Google Scholar] [CrossRef]
- Hiremathad, A.; Keri, R.S.; Esteves, A.R.; Cardoso, S.M.; Chaves, S.; Santos, M.A. Novel Tacrine-Hydroxyphenylbenzimidazole hybrids as potential multitarget drug candidates for Alzheimer’s disease. Eur. J. Med. Chem. 2018, 148, 255–267. [Google Scholar] [CrossRef]
- Jiang, X.; Zhou, T.; Bai, R.; Xie, Y. Hydroxypyridinone-Based Iron Chelators with Broad-Ranging Biological Activities. J. Med. Chem. 2020, 63, 14470–14501. [Google Scholar] [CrossRef]
- Sestito, S.; Pruccoli, L.; Runfola, M.; Citi, V.; Martelli, A.; Saccomanni, G.; Calderone, V.; Tarozzi, A.; Rapposelli, S. Design and synthesis of H(2)S-donor hybrids: A new treatment for Alzheimer’s disease? Eur. J. Med. Chem. 2019, 184, 111745. [Google Scholar] [CrossRef]
- Kupershmidt, L.; Amit, T.; Bar-Am, O.; Youdim, M.B.; Weinreb, O. The novel multi-target iron chelating-radical scavenging compound M30 possesses beneficial effects on major hallmarks of Alzheimer’s disease. Antioxid. Redox Signal. 2012, 17, 860–877. [Google Scholar] [CrossRef] [PubMed]
- Lin, B.; Youdim, M.B.H. The protective, rescue and therapeutic potential of multi-target iron-chelators for retinitis pigmentosa. Free Radic. Biol. Med. 2021, 174, 1–11. [Google Scholar] [CrossRef] [PubMed]
- Bacci, A.; Runfola, M.; Sestito, S.; Rapposelli, S. Beyond Antioxidant Effects: Nature-Based Templates Unveil New Strategies for Neurodegenerative Diseases. Antioxidants 2021, 10, 367. [Google Scholar] [CrossRef] [PubMed]
- Khan, F.A.; Maalik, A.; Murtaza, G. Inhibitory mechanism against oxidative stress of caffeic acid. J. Food Drug Anal. 2016, 24, 695–702. [Google Scholar] [CrossRef]
- Yao, J.; Peng, S.; Xu, J.; Fang, J. Reversing ROS-mediated neurotoxicity by chlorogenic acid involves its direct antioxidant activity and activation of Nrf2-ARE signaling pathway. BioFactors 2019, 45, 616–626. [Google Scholar] [CrossRef]
- Moini, H.; Packer, L.; Saris, N.E. Antioxidant and prooxidant activities of alpha-lipoic acid and dihydrolipoic acid. Toxicol. Appl. Pharmacol. 2002, 182, 84–90. [Google Scholar] [CrossRef] [Green Version]
- Pérez-Torres, I.; Castrejón-Téllez, V.; Soto, M.E.; Rubio-Ruiz, M.E.; Manzano-Pech, L.; Guarner-Lans, V. Oxidative Stress, Plant Natural Antioxidants, and Obesity. Int. J. Mol. Sci. 2021, 22, 1786. [Google Scholar] [CrossRef]
- Huang, W.Y.; Chao, X.J.; Ouyang, Y.; Liu, A.M.; He, X.X.; Chen, M.H.; Wang, L.H.; Liu, J.; Yu, S.W.; Rapposelli, S.; et al. Tacrine-6-ferulic acid, a novel multifunctional dimer against Alzheimer’s disease, prevents oxidative stress-induced neuronal death through activating Nrf2/ARE/HO-1 pathway in HT22 cells. CNS Neurosci. Ther. 2012, 18, 950–951. [Google Scholar] [CrossRef]
- Lee, D.-Y.; Song, M.-Y.; Kim, E.-H. Role of Oxidative Stress and Nrf2/KEAP1 Signaling in Colorectal Cancer: Mechanisms and Therapeutic Perspectives with Phytochemicals. Antioxidants 2021, 10, 743. [Google Scholar] [CrossRef]
- Pierzynowska, K.; Gaffke, L.; Cyske, Z.; Puchalski, M.; Rintz, E.; Bartkowski, M.; Osiadły, M.; Pierzynowski, M.; Mantej, J.; Piotrowska, E.; et al. Autophagy stimulation as a promising approach in treatment of neurodegenerative diseases. Metab Brain Dis 2018, 33, 989–1008. [Google Scholar] [CrossRef]
- García-Aguilar, A.; Palomino, O.; Benito, M.; Guillén, C. Dietary Polyphenols in Metabolic and Neurodegenerative Diseases: Molecular Targets in Autophagy and Biological Effects. Antioxidants 2021, 10, 142. [Google Scholar] [CrossRef] [PubMed]


| Percentage Radical Scavenging (%) | |||||||||||
|---|---|---|---|---|---|---|---|---|---|---|---|
| Concetration | LA | 1 | 2 | 3 | CA | 4 | 5 | 6 | FA | 7 | 8 |
| 200 μM | 3.2 ± 5.2 | −5.8 ± 1.3 | 26.9 ± 2.6 | 4.1 ± 0.2 | 63.9 ± 5.0 | 85.9 ± 1.6 | 90.4 ± 0.7 | 79.8 ± 0.4 | 31.0 ± 3.4 | 26.6 ± 5.3 | 36.9 ± 0.4 |
| 100 μM | −3.1 ± 10 | −11.6 ± 1.1 | 19.5 ± 2.7 | −2.8 ± 0.1 | 41.5 ± 3.9 | 76.5 ± 6.6 | 78.6 ± 8.4 | 46.5 ± 2.1 | 20.3 ± 2.1 | 16.0 ± 0.5 | 26.5 ± 2.5 |
| 50 μM | −2.1 ± 1.3 | −11.4 ± 1.0 | 26.7 ± 6.1 | −5.1 ± 5.9 | 23.2 ± 3.2 | 42.3 ± 12.2 | 44.0 ± 1.8 | 33.9 ± 0.8 | 13.2 ± 0.5 | 9.9 ± 1.3 | 23.5 ± 1.4 |
Publisher’s Note: MDPI stays neutral with regard to jurisdictional claims in published maps and institutional affiliations. |
© 2022 by the authors. Licensee MDPI, Basel, Switzerland. This article is an open access article distributed under the terms and conditions of the Creative Commons Attribution (CC BY) license (https://creativecommons.org/licenses/by/4.0/).
Share and Cite
Bacci, A.; Corsi, F.; Runfola, M.; Sestito, S.; Piano, I.; Manera, C.; Saccomanni, G.; Gargini, C.; Rapposelli, S. Design, Synthesis, and In Vitro Evaluation of Novel 8-Amino-Quinoline Combined with Natural Antioxidant Acids. Pharmaceuticals 2022, 15, 688. https://doi.org/10.3390/ph15060688
Bacci A, Corsi F, Runfola M, Sestito S, Piano I, Manera C, Saccomanni G, Gargini C, Rapposelli S. Design, Synthesis, and In Vitro Evaluation of Novel 8-Amino-Quinoline Combined with Natural Antioxidant Acids. Pharmaceuticals. 2022; 15(6):688. https://doi.org/10.3390/ph15060688
Chicago/Turabian StyleBacci, Andrea, Francesca Corsi, Massimiliano Runfola, Simona Sestito, Ilaria Piano, Clementina Manera, Giuseppe Saccomanni, Claudia Gargini, and Simona Rapposelli. 2022. "Design, Synthesis, and In Vitro Evaluation of Novel 8-Amino-Quinoline Combined with Natural Antioxidant Acids" Pharmaceuticals 15, no. 6: 688. https://doi.org/10.3390/ph15060688
APA StyleBacci, A., Corsi, F., Runfola, M., Sestito, S., Piano, I., Manera, C., Saccomanni, G., Gargini, C., & Rapposelli, S. (2022). Design, Synthesis, and In Vitro Evaluation of Novel 8-Amino-Quinoline Combined with Natural Antioxidant Acids. Pharmaceuticals, 15(6), 688. https://doi.org/10.3390/ph15060688