Characterisation of an Isogenic Model of Cisplatin Resistance in Oesophageal Adenocarcinoma Cells


 ,
, 

Abstract
1. Introduction
2. Results
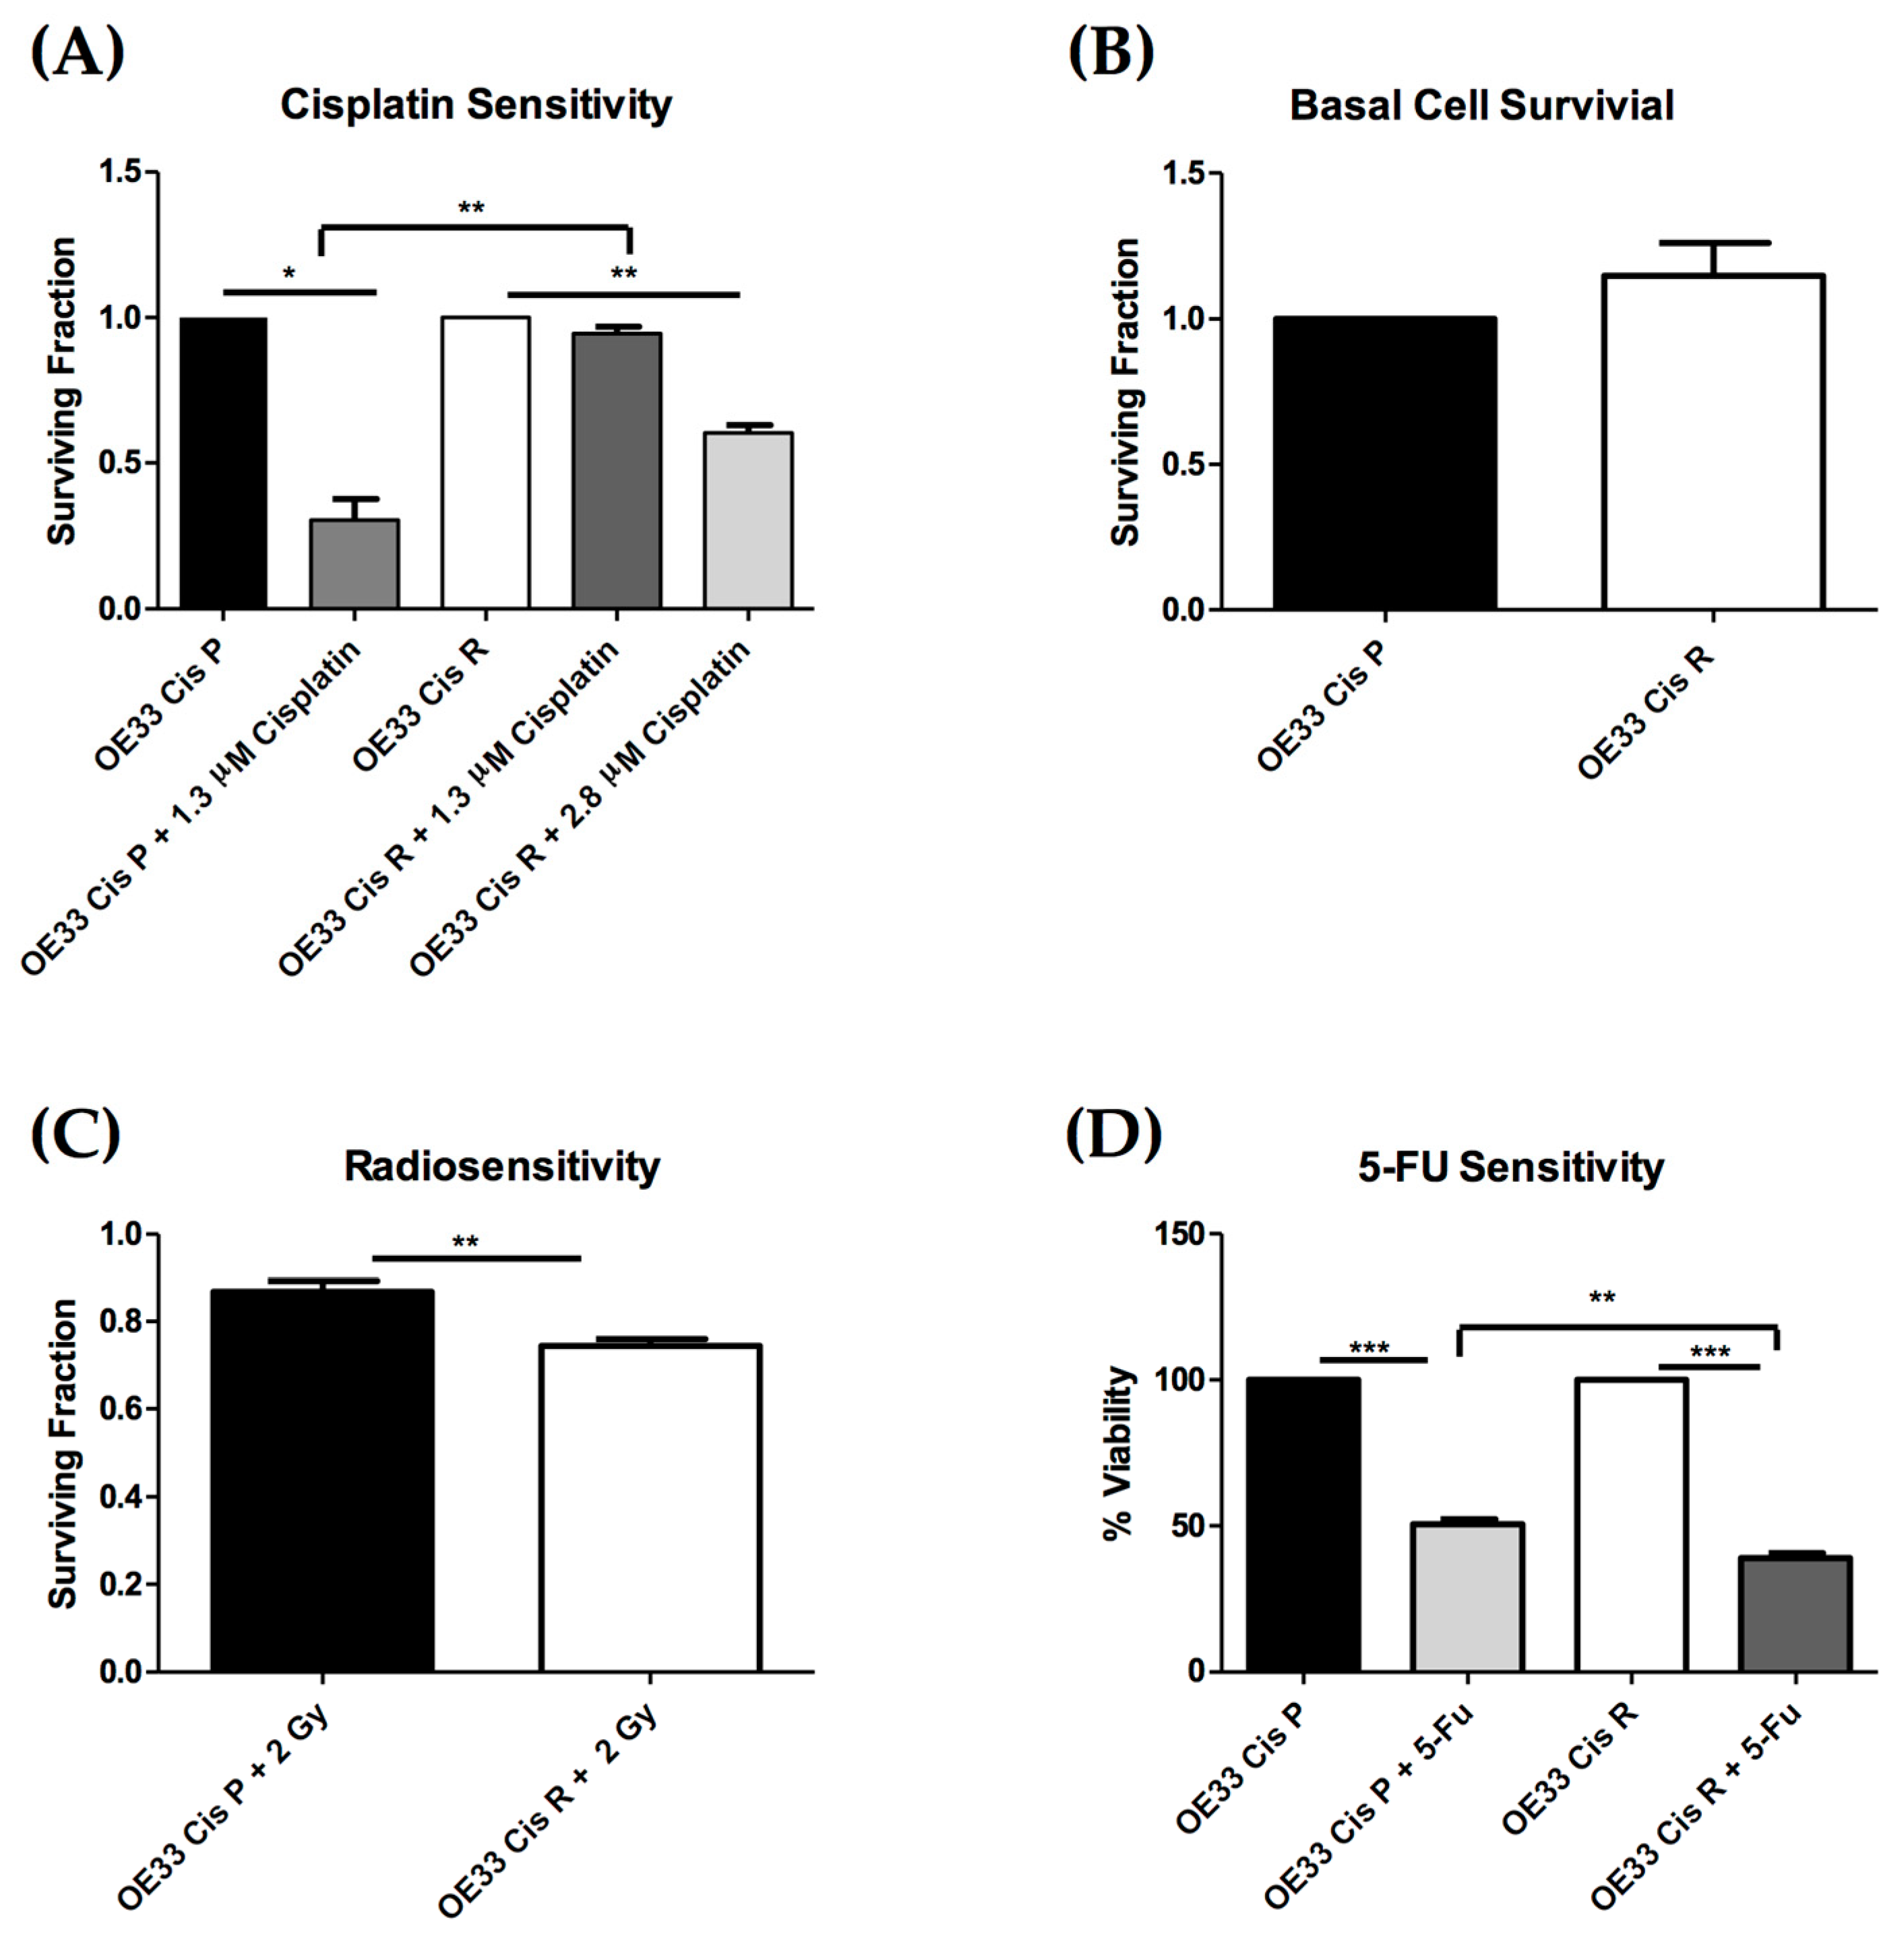
2.1. OE33 Cis R Cells Are More Sensitive to Radiation and 5-Fluorouracil (5-FU) Treatment
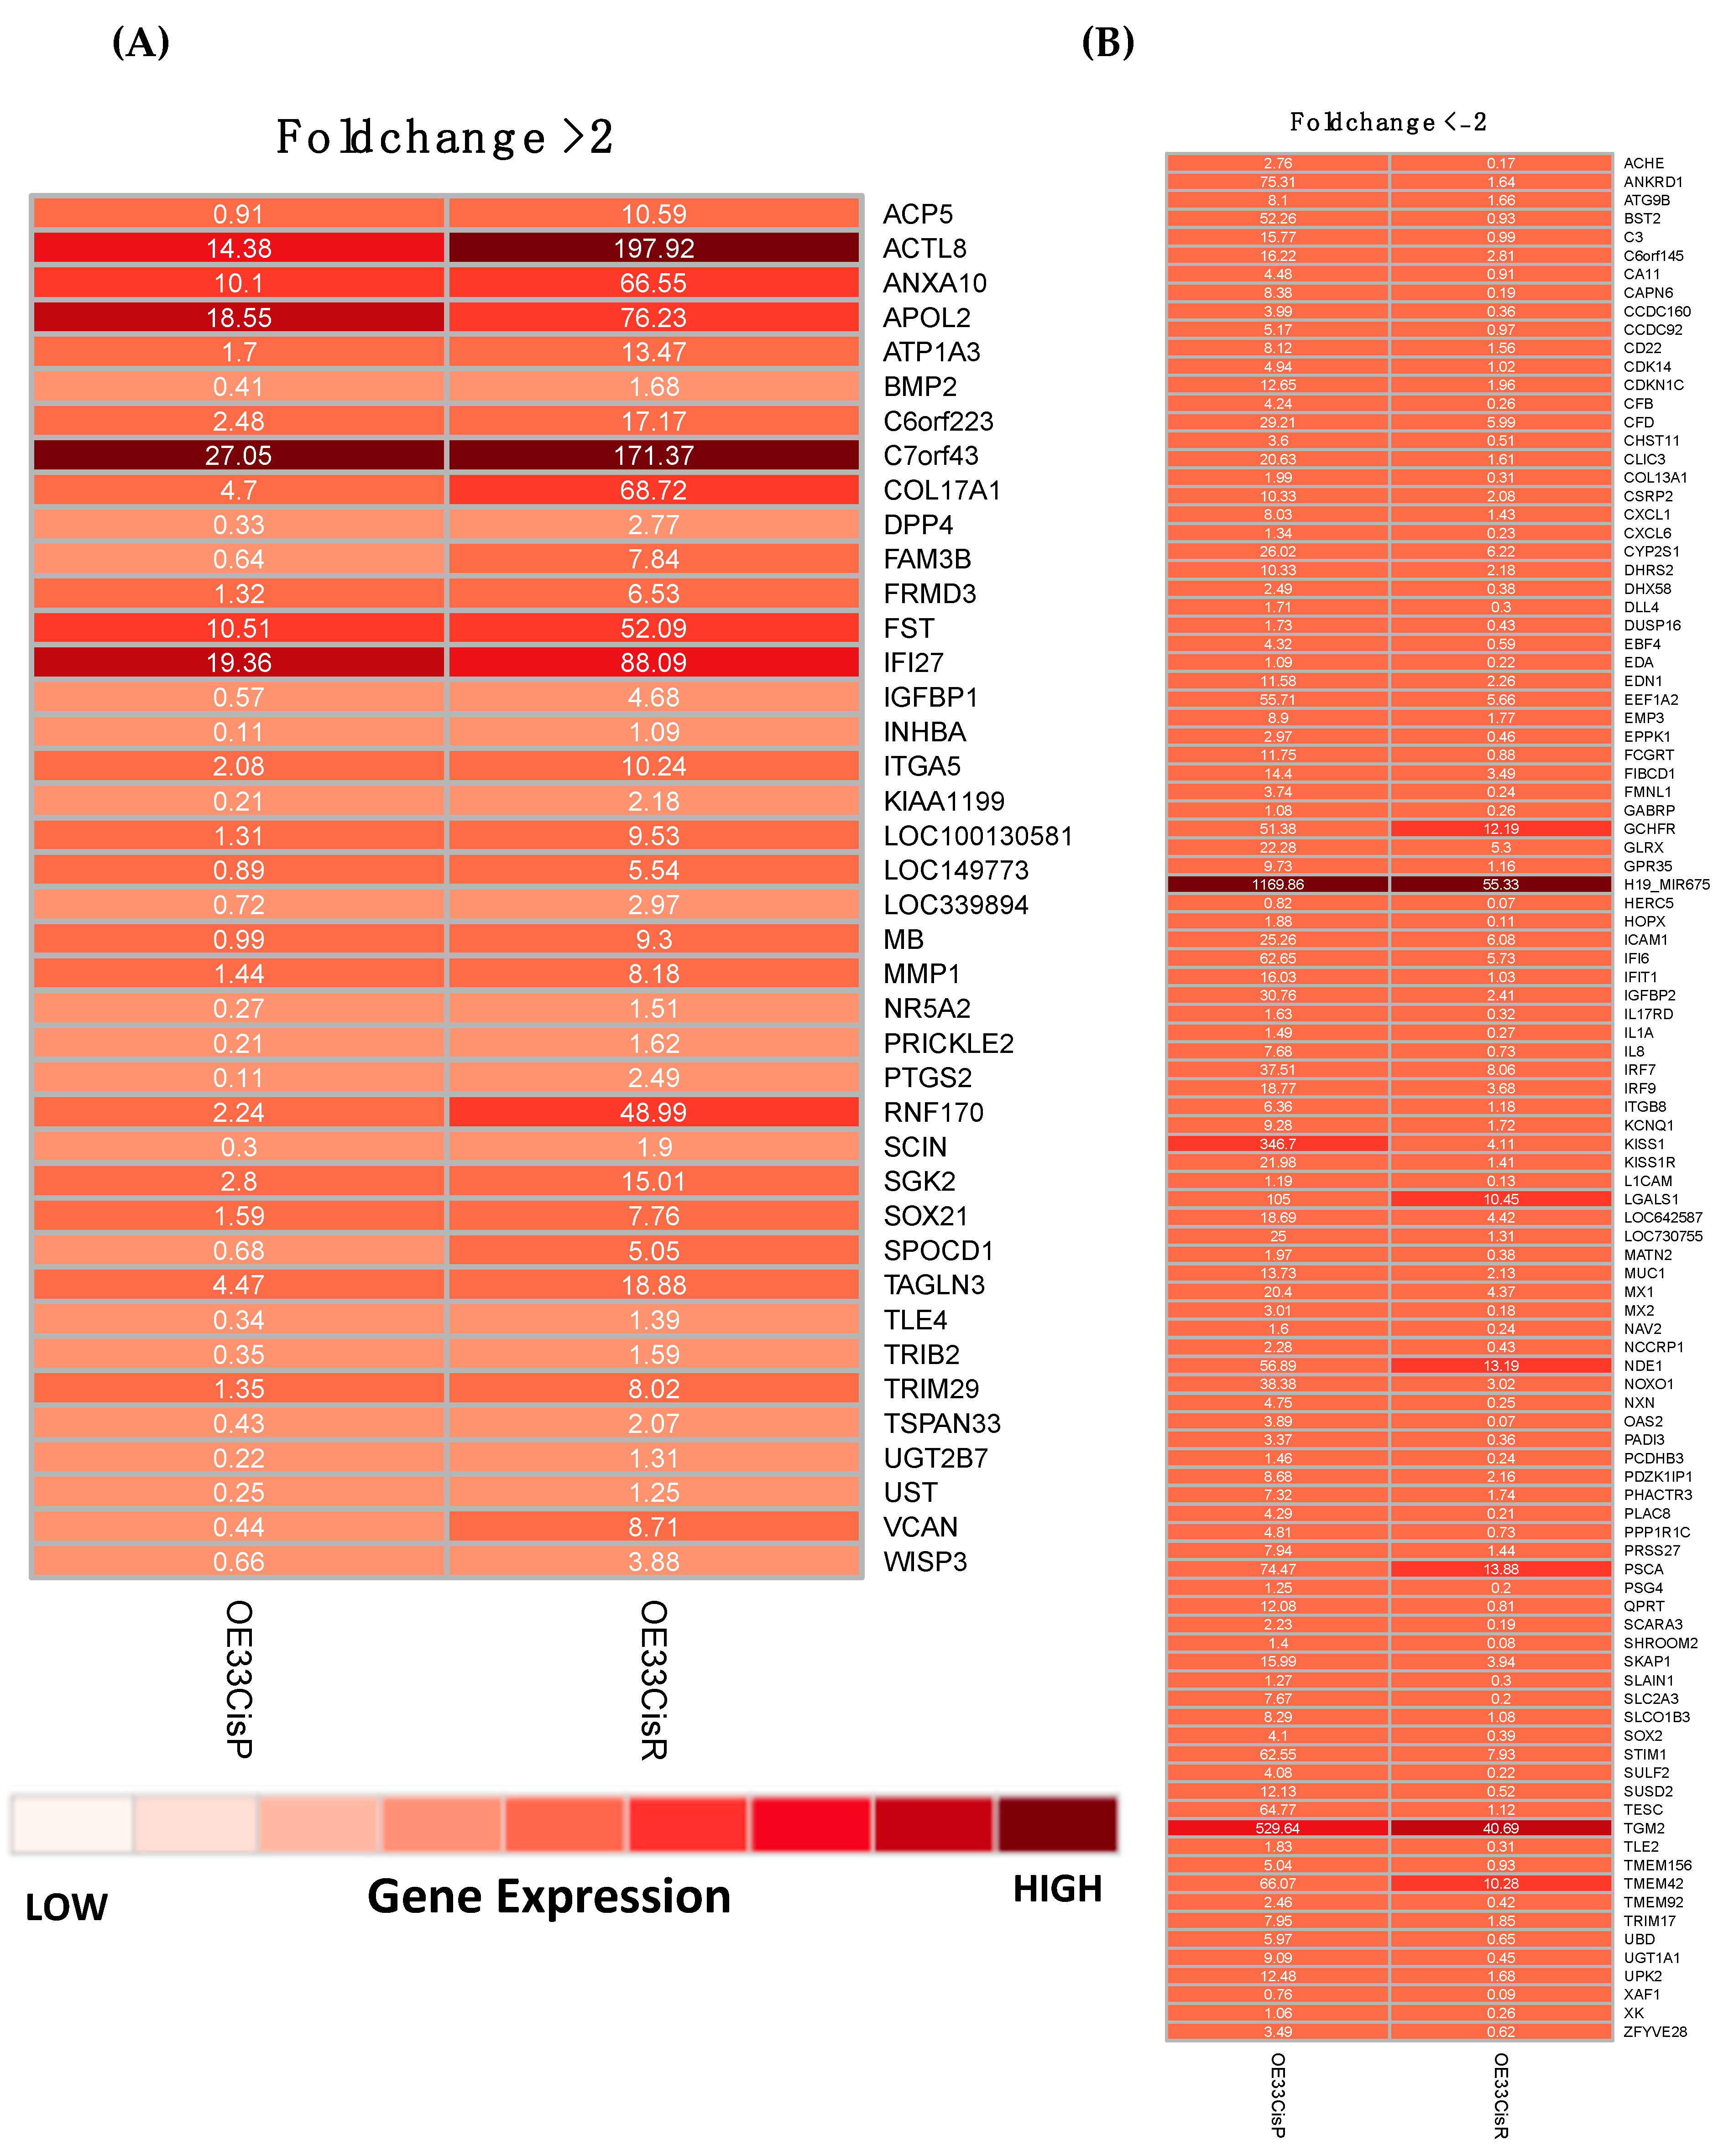
2.2. Gene Expression Is Significantly Altered in OE33 Cis R Cells
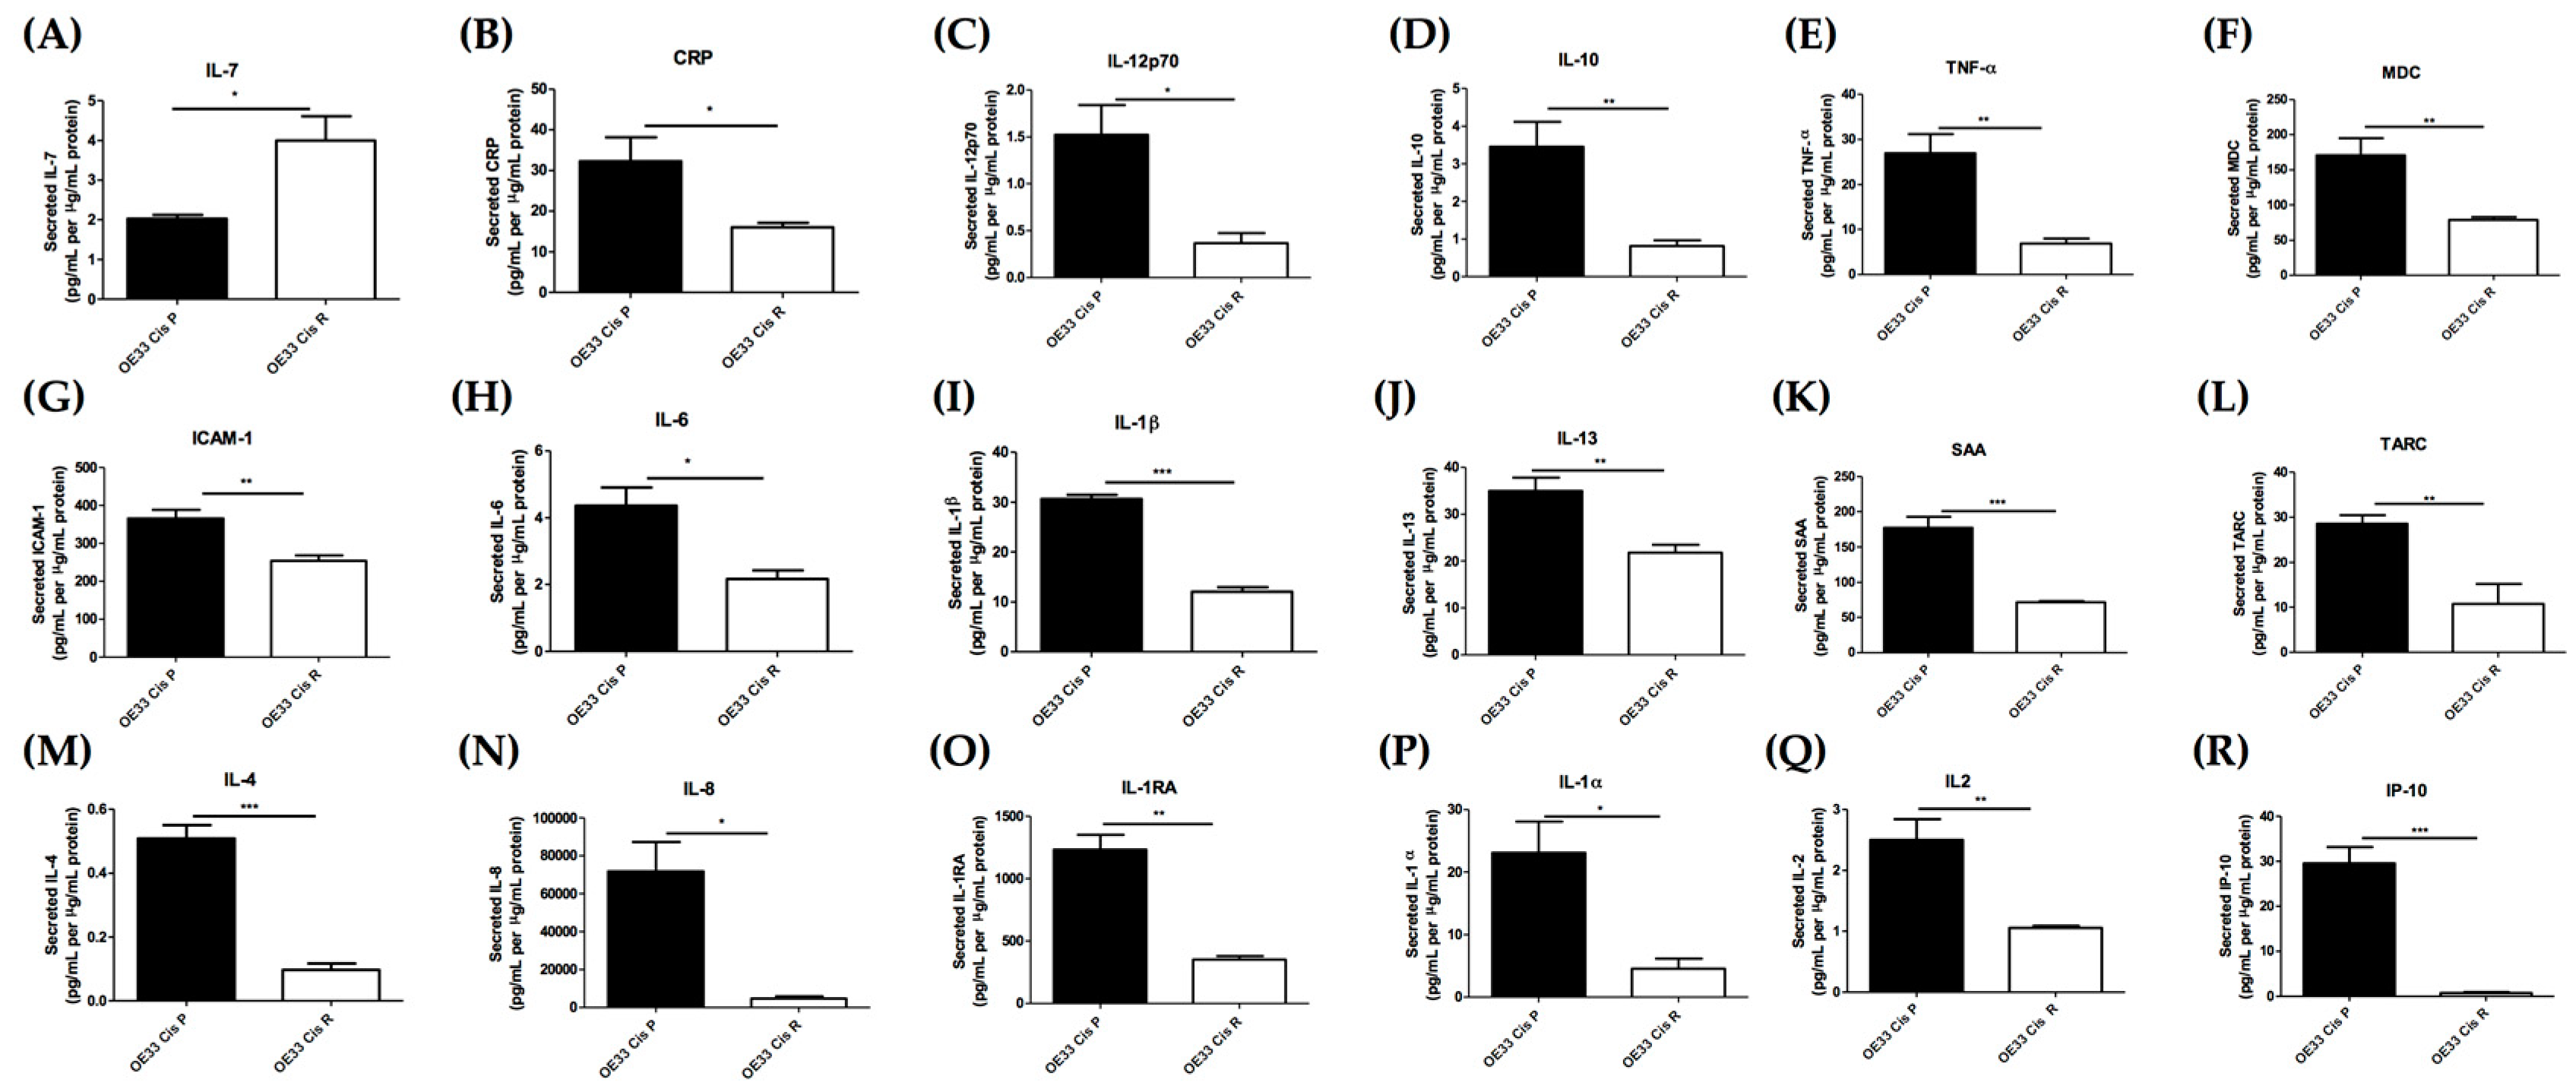
2.3. Acquisition of Cisplatin Resistance Results in an Alerted Inflammatory Secretome
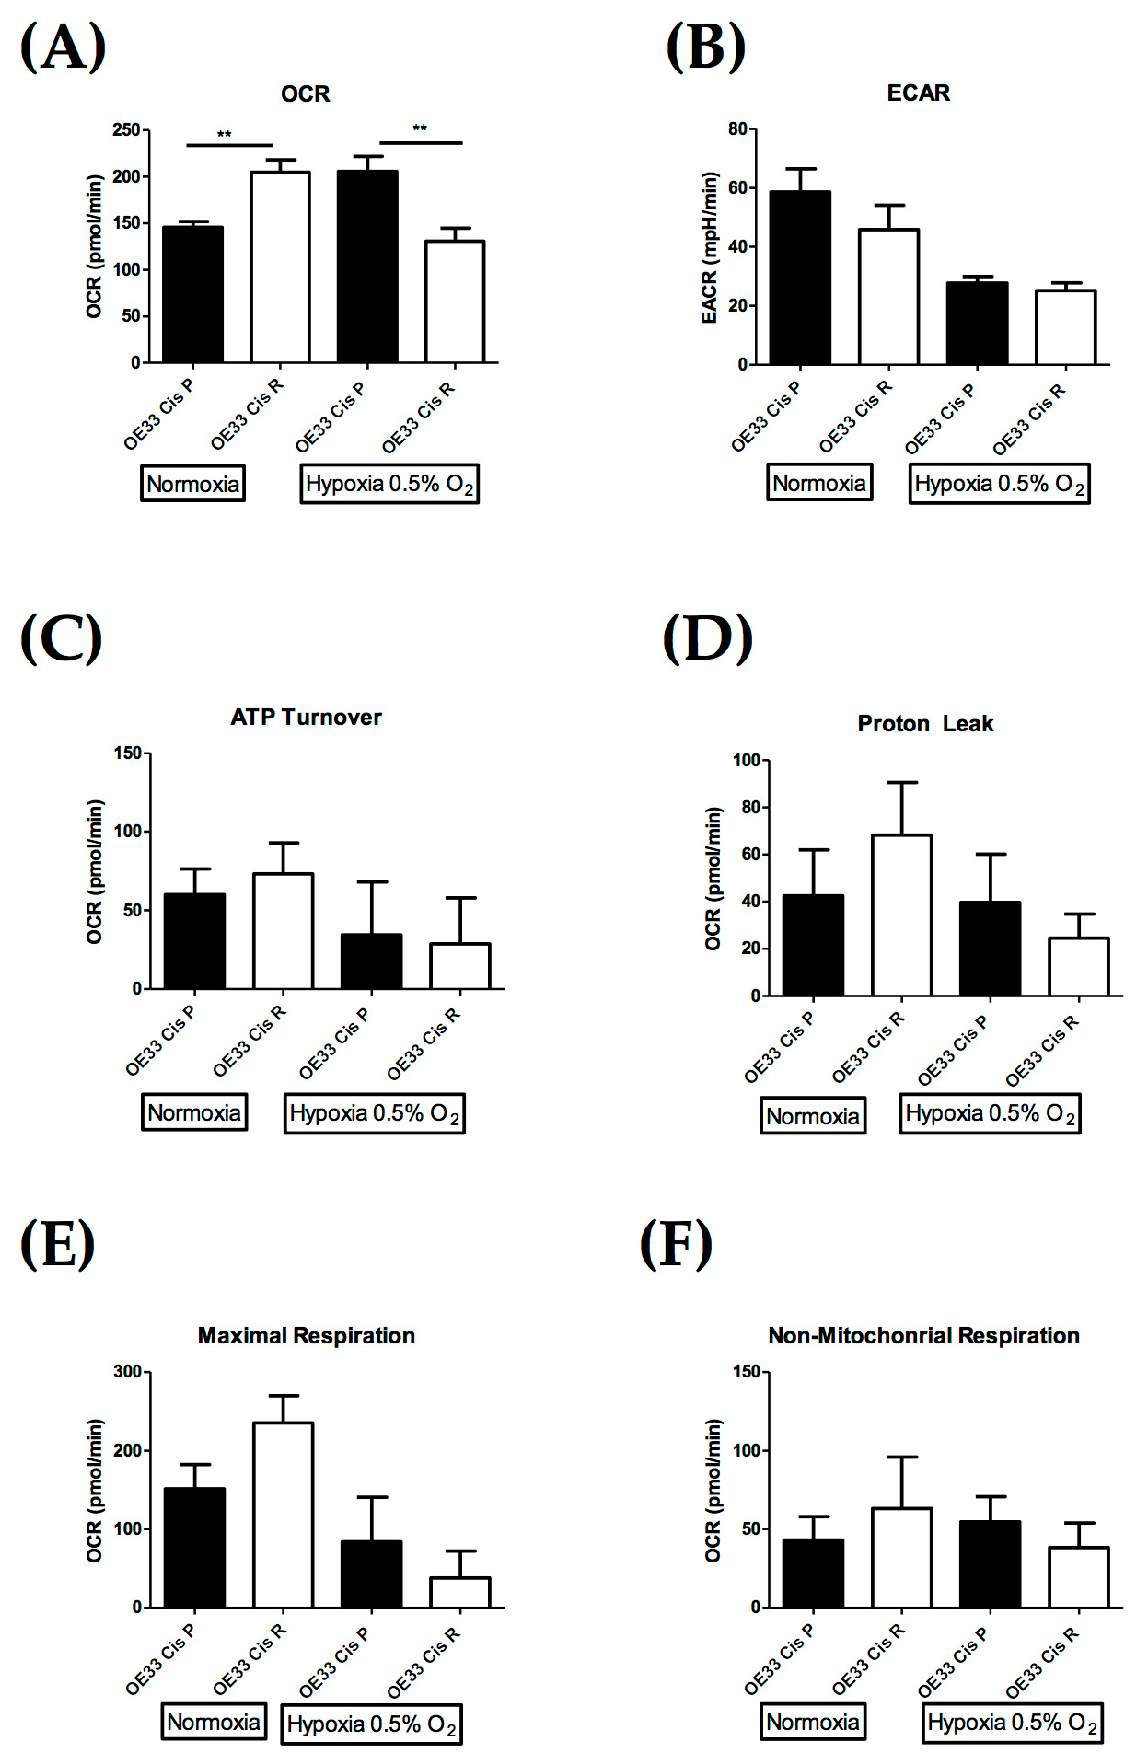
2.4. OE33 Cis R Cells Have an Altered Metabolic Phenotype Compared to the Parental OE33 Cis P Cells
3. Discussion
4. Materials and Methods
4.1. Generation of the OE33 Cis P and OE33 Cis R Cell Lines
4.2. Preparation of Chemotherapeutic Drugs
4.3. Determining IC50 of Cisplatin for OE33 Cis P and OE33 Cis R Cells at Using Cell Counting kit-8 (CCK8) Assay
4.4. Clonogenic Assay
4.5. Irradiation
4.6. RNA Extraction from Cell Lines
4.7. Digital Gene Expression Sequencing
4.8. Multiplex Enzyme Linked Immunosorbent Assay (ELISA)
4.9. OCR and ECAR Measurements in Cis P and Cis R Cells
4.10. Crystal Violet
4.11. Statistical Analysis
Supplementary Materials
Author Contributions
Funding
Conflicts of Interest
Abbreviations
| 5-FU | Fluorouracil |
| Cis | Cisplatin |
| ECAR | Extracellular Acidification Rate |
| ELISA | Enzyme Linked Immunosorbent assay |
| DMEM | Dulbecco’s Modified Eagle’s medium |
| IL-1α | Interleukin 1 alpha |
| IL-7 | Interleukin 7 |
| IL-8 | Interleukin 8 |
| ICAM-1 | Intracellular Adhesion Molecule 1 |
| KEGG | Kyoto Encyclopedia of Genes and Genomes |
| MiRNA | Micro ribonucleic acid |
| NeoCRT | Neoadjuvant Chemoradiation Therapy |
| NHEJ | Non Homologous end joining |
| OAC | Oesophageal Adenocarcinoma |
| OCR | Oxidative Phosphorylation |
| PE | Plating Efficiency |
| RMPI | Roswell Park Memorial Institute medium |
| SCC | Squamous Cell Carcinoma |
| SF | Surviving Fraction |
| TGF-β | Transforming Growth Factor Beta |
| VEGF | Vascular Endothelial Growth Factor |
References
- Arnold, M.; Soerjomataram, I.; Ferlay, J.; Forman, D. Global incidence of oesophageal cancer by histological subtype in 2012. Gut 2015, 64, 381–387. [Google Scholar] [CrossRef] [PubMed]
- Ferlay, J.; Soerjomataram, I.; Dikshit, R.; Eser, S.; Mathers, C.; Rebelo, M.; Parkin, D.M.; Forman, D.; Bray, F. Cancer incidence and mortality worldwide: Sources, methods and major patterns in GLOBOCAN 2012. Int. J. Cancer 2015, 136, E359–E386. [Google Scholar] [CrossRef] [PubMed]
- Abbas, G.; Krasna, M. Overview of esophageal cancer. Ann. Cardiothorac. Surg. 2017, 6, 131–136. [Google Scholar] [CrossRef] [PubMed]
- Picardo, S.L.; Maher, S.G.; O’Sullivan, J.N.; Reynolds, J.V. Barrett’s to oesophageal cancer sequence: A model of inflammatory-driven upper gastrointestinal cancer. Digest. Surg. 2012, 29, 251–260. [Google Scholar] [CrossRef] [PubMed]
- Cools-Lartigue, J.; Spicer, J.; Ferri, L.E. Current status of management of malignant disease: Current management of esophageal cancer. J. Gastrointest. Surg. Off. J. Soc. Surg. Aliment. Tract. 2015, 19, 964–972. [Google Scholar] [CrossRef] [PubMed]
- Donohoe, C.L.; Reynolds, J.V. Neoadjuvant treatment of locally advanced esophageal and junctional cancer: The evidence-base, current key questions and clinical trials. J. Thorac. Dis. 2017, 9, S697–S704. [Google Scholar] [CrossRef] [PubMed]
- Walsh, T.N.; Noonan, N.; Hollywood, D.; Kelly, A.; Keeling, N.; Hennessy, T.P.J. A Comparison of Multimodal Therapy and Surgery for Esophageal Adenocarcinoma. N. Engl. J. Med. 1996, 335, 462–467. [Google Scholar] [CrossRef] [PubMed]
- Jin, H.-L.; Zhu, H.; Ling, T.-S.; Zhang, H.-J.; Shi, R.-H. Neoadjuvant chemoradiotherapy for resectable esophageal carcinoma: A meta-analysis. World J. Gastroenterol. WJG 2009, 15, 5983–5991. [Google Scholar] [CrossRef] [PubMed]
- Galluzzi, L.; Senovilla, L.; Vitale, I.; Michels, J.; Martins, I.; Kepp, O.; Castedo, M.; Kroemer, G. Molecular mechanisms of cisplatin resistance. Oncogene 2012, 31, 1869–1883. [Google Scholar] [CrossRef] [PubMed]
- Reynolds, J.V.; Preston, S.R.; O’Neill, B.; Baeksgaard, L.; Griffin, S.M.; Mariette, C.; Cuffe, S.; Cunningham, M.; Crosby, T.; Parker, I.; et al. ICORG 10-14: NEOadjuvant trial in Adenocarcinoma of the oEsophagus and oesophagoGastric junction International Study (Neo-AEGIS). BMC Cancer 2017, 17, 401. [Google Scholar] [CrossRef]
- Cunningham, D.; Allum, W.H.; Stenning, S.P.; Thompson, J.N.; Van de Velde, C.J.H.; Nicolson, M.; Scarffe, J.H.; Lofts, F.J.; Falk, S.J.; Iveson, T.J.; et al. Perioperative Chemotherapy versus Surgery Alone for Resectable Gastroesophageal Cancer. N. Engl. J. Med. 2006, 355, 11–20. [Google Scholar] [CrossRef]
- Van Hagen, P.; Hulshof, M.C.C.M.; van Lanschot, J.J.B.; Steyerberg, E.W.; Henegouwen, M.I.V.B.; Wijnhoven, B.P.L.; Richel, D.J.; Nieuwenhuijzen, G.A.P.; Hospers, G.A.P.; Bonenkamp, J.J.; et al. Preoperative Chemoradiotherapy for Esophageal or Junctional Cancer. N. Engl. J. Med. 2012, 366, 2074–2084. [Google Scholar] [CrossRef] [PubMed]
- Maher, S.G.; McDowell, D.T.; Collins, B.C.; Muldoon, C.; Gallagher, W.M.; Reynolds, J.V. Serum proteomic profiling reveals that pretreatment complement protein levels are predictive of esophageal cancer patient response to neoadjuvant chemoradiation. Ann. Surg. 2011, 254, 809–816. [Google Scholar] [CrossRef] [PubMed]
- Cui, L.; Fu, J.; Pang, J.C.-S.; Qiu, Z.-K.; Liu, X.-M.; Chen, F.-R.; Shi, H.-L.; Ng, H.-K.; Chen, Z.-P. Overexpression of IL-7 enhances cisplatin resistance in glioma. Cancer Biol. Therapy 2012, 13, 496–503. [Google Scholar] [CrossRef] [PubMed]
- Andrejeva, G.; Rathmell, J.C. Similarities and Distinctions of Cancer and Immune Metabolism in Inflammation and Tumors. Cell Metabol. 2017, 26, 49–70. [Google Scholar] [CrossRef] [PubMed]
- Hanahan, D.; Weinberg, R.A. Hallmarks of cancer: The next generation. Cell 2011, 144, 646–674. [Google Scholar] [CrossRef] [PubMed]
- Lynam-Lennon, N.; Maher, S.G.; Maguire, A.; Phelan, J.; Muldoon, C.; Reynolds, J.V.; O’Sullivan, J. Altered Mitochondrial Function and Energy Metabolism Is Associated with a Radioresistant Phenotype in Oesophageal Adenocarcinoma. PLoS ONE 2014, 9, e100738. [Google Scholar] [CrossRef] [PubMed]
- Lynam-Lennon, N.; Reynolds, J.V.; Pidgeon, G.P.; Lysaght, J.; Marignol, L.; Maher, S.G. Alterations in DNA repair efficiency are involved in the radioresistance of esophageal adenocarcinoma. Radiat. Res. 2010, 174, 703–711. [Google Scholar] [CrossRef]
- Wangpaichitr, M.; Theodoropoulos, G.; Wu, C.; You, M.; Feun, L.; Kuo, M.T.; Savaraj, N. The Relationship of Thioredoxin-1 and Cisplatin Resistance: Its Impact on ROS and Oxidative Metabolism in Lung Cancer Cells. Mol. Cancer Ther. 2012. [Google Scholar] [CrossRef]
- Lynam-Lennon, N.; Heavey, S.; Sommerville, G.; Bibby, B.A.S.; Ffrench, B.; Quinn, J.; Gasch, C.; O’Leary, J.J.; Gallagher, M.F.; Reynolds, J.V.; et al. MicroRNA-17 is downregulated in esophageal adenocarcinoma cancer stem-like cells and promotes a radioresistant phenotype. Oncotarget 2017, 8, 11400–11413. [Google Scholar] [CrossRef]
- Buckley, A.M.; Lynam-Lennon, N.; Kennedy, S.A.; Dunne, M.R.; Aird, J.J.; Foley, E.K.; Clarke, N.; Ravi, N.; O’Toole, D.; Reynolds, J.V.; et al. Leukaemia inhibitory factor is associated with treatment resistance in oesophageal adenocarcinoma. Oncotarget 2018, 9, 33634–33647. [Google Scholar] [CrossRef] [PubMed]
- Stordal, B.; Davey, M. Understanding cisplatin resistance using cellular models. IUBMB Life 2007, 59, 696–699. [Google Scholar] [CrossRef] [PubMed]
- Hummel, R.; Sie, C.; Watson, D.I.; Wang, T.; Ansar, A.; Michael, M.Z.; Van der Hoek, M.; Haier, J.; Hussey, D.J. MicroRNA signatures in chemotherapy resistant esophageal cancer cell lines. World J. Gastroenterol. WJG 2014, 20, 14904–14912. [Google Scholar] [CrossRef] [PubMed]
- Xie, X.-Q.; Zhao, Q.-H.; Wang, H.; Gu, K.-S. Dysregulation of mRNA profile in cisplatin-resistant gastric cancer cell line SGC7901. World J. Gastroenterol. 2017, 23, 1189–1202. [Google Scholar] [CrossRef]
- Shen, D.W.; Pouliot, L.M.; Hall, M.D.; Gottesman, M.M. Cisplatin resistance: A cellular self-defense mechanism resulting from multiple epigenetic and genetic changes. Pharmacol. Rev. 2012, 64, 706–721. [Google Scholar] [CrossRef] [PubMed]
- Adelstein, D.J.; Li, Y.; Adams, G.L.; Wagner, H., Jr.; Kish, J.A.; Ensley, J.F.; Schuller, D.E.; Forastiere, A.A. An Intergroup Phase III Comparison of Standard Radiation Therapy and Two Schedules of Concurrent Chemoradiotherapy in Patients With Unresectable Squamous Cell Head and Neck Cancer. J. Clin. Oncol. 2003, 21, 92–98. [Google Scholar] [CrossRef]
- Keys, H.M.; Bundy, B.N.; Stehman, F.B.; Muderspach, L.I.; Chafe, W.E.; Suggs, C.L.; Walker, J.L.; Gersell, D. Cisplatin, Radiation, and Adjuvant Hysterectomy Compared with Radiation and Adjuvant Hysterectomy for Bulky Stage IB Cervical Carcinoma. N. Engl. J. Med. 1999, 340, 1154–1161. [Google Scholar] [CrossRef]
- Tu, L.; Sun, L.; Xu, Y.; Wang, Y.; Zhou, L.; Liu, Y.; Zhu, J.; Peng, F.; Wei, Y.; Gong, Y. Paclitaxel and cisplatin combined with intensity-modulated radiotherapy for upper esophageal carcinoma. Radiat. Oncol. 2013, 8, 75. [Google Scholar] [CrossRef]
- Ilson, D.H.; Minsky, B.; Kelsen, D. Irinotecan, cisplatin, and radiation in esophageal cancer. Oncology 2002, 16, 11–15. [Google Scholar]
- Myint, W.K.; Ng, C.; Raaphorst, G.P. Examining the non-homologous repair process following cisplatin and radiation treatments. Int. J. Radiat. Biol. 2002, 78, 417–424. [Google Scholar] [CrossRef]
- Boeckman, H.J.; Trego, K.S.; Henkels, K.M.; Turchi, J.J. Cisplatin sensitizes cancer cells to ionizing radiation via inhibition of non-homologous end joining. Mol. Cancer Res. MCR 2005, 3, 277–285. [Google Scholar] [CrossRef] [PubMed]
- Eljack, N.D.; Ma, H.Y.; Drucker, J.; Shen, C.; Hambley, T.W.; New, E.J.; Friedrich, T.; Clarke, R.J. Mechanisms of cell uptake and toxicity of the anticancer drug cisplatin. Metall. Integr. Biomet. Sci. 2014, 6, 2126–2133. [Google Scholar] [CrossRef] [PubMed]
- Kilari, D.; Guancial, E.; Kim, E.S. Role of copper transporters in platinum resistance. World J. Clin. Oncol. 2016, 7, 106–113. [Google Scholar] [CrossRef]
- Baskar, R.; Dai, J.; Wenlong, N.; Yeo, R.; Yeoh, K.-W. Biological response of cancer cells to radiation treatment. Front. Mol. Biosci. 2014, 1, 24. [Google Scholar] [CrossRef] [PubMed]
- Hummel, R.; Watson, D.I.; Smith, C.; Kist, J.; Michael, M.Z.; Haier, J.; Hussey, D.J. Mir-148a improves response to chemotherapy in sensitive and resistant oesophageal adenocarcinoma and squamous cell carcinoma cells. J. Gastrointest. Surg. Off. J. Soc. Surg. Aliment. Tract. 2011, 15, 429–438. [Google Scholar] [CrossRef] [PubMed]
- Singh, A.; Settleman, J. EMT, cancer stem cells and drug resistance: An emerging axis of evil in the war on cancer. Oncogene 2010, 29, 4741–4751. [Google Scholar] [CrossRef]
- Piskareva, O.; Harvey, H.; Nolan, J.; Conlon, R.; Alcock, L.; Buckley, P.; Dowling, P.; O’Sullivan, F.; Bray, I.; Stallings, R.L. The development of cisplatin resistance in neuroblastoma is accompanied by epithelial to mesenchymal transition in vitro. Cancer Lett. 2015, 364, 142–155. [Google Scholar] [CrossRef] [PubMed]
- Katoh, M. Networking of WNT, FGF, Notch, BMP, and Hedgehog signaling pathways during carcinogenesis. Stem Cell Rev. 2007, 3, 30–38. [Google Scholar] [CrossRef] [PubMed]
- Matsuoka, S.; Edwards, M.C.; Bai, C.; Parker, S.; Zhang, P.; Baldini, A.; Harper, J.W.; Elledge, S.J. p57KIP2, a structurally distinct member of the p21CIP1 Cdk inhibitor family, is a candidate tumor suppressor gene. Genes Dev. 1995, 9, 650–662. [Google Scholar] [CrossRef]
- Vlachos, P.; Nyman, U.; Hajji, N.; Joseph, B. The cell cycle inhibitor p57(Kip2) promotes cell death via the mitochondrial apoptotic pathway. Cell Death Differ. 2007, 14, 1497–1507. [Google Scholar] [CrossRef]
- Oshimori, N.; Oristian, D.; Fuchs, E. TGF-β Promotes Heterogeneity and Drug Resistance in Squamous Cell Carcinoma. Cell 2015, 160, 963–976. [Google Scholar] [CrossRef] [PubMed]
- Bissey, P.-A.; Law, J.H.; Bruce, J.P.; Shi, W.; Renoult, A.; Chua, M.L.K.; Yip, K.W.; Liu, F.-F. Dysregulation of the MiR-449b target TGFBI alters the TGFβ pathway to induce cisplatin resistance in nasopharyngeal carcinoma. Oncogenesis 2018, 7, 40. [Google Scholar] [CrossRef]
- Di Paolo, N.C.; Shayakhmetov, D.M. Interleukin 1α and the inflammatory process. Nat. Immunol. 2016, 17, 906. [Google Scholar] [CrossRef]
- Benchekroun, M.N.; Parker, R.; Dabholkar, M.; Reed, E.; Sinha, B.K. Effects of interleukin-1 alpha on DNA repair in human ovarian carcinoma (NIH:OVCAR-3) cells: Implications in the mechanism of sensitization of cis-diamminedichloroplatinum(II). Mol. Pharmacol. 1995, 47, 1255–1260. [Google Scholar] [PubMed]
- Webb, D.S.; Mostowski, H.S.; Gerrard, T.L. Cytokine-induced enhancement of ICAM-1 expression results in increased vulnerability of tumor cells to monocyte-mediated lysis. J. Immunol. 1991, 146, 3682–3686. [Google Scholar]
- Jonjic, N.; Alberti, S.; Bernasconi, S.; Peri, G.; Jilek, P.; Anichini, A.; Parmiani, G.; Mantovani, A. Heterogeneous susceptibility of human melanoma clones to monocyte cytotoxicity: Role of ICAM-1 defined by antibody blocking and gene transfer. Eur. J. Immunol. 1992, 22, 2255–2260. [Google Scholar] [CrossRef] [PubMed]
- Guo, P.; Huang, J.; Wang, L.; Jia, D.; Yang, J.; Dillon, D.A.; Zurakowski, D.; Mao, H.; Moses, M.A.; Auguste, D.T. ICAM-1 as a molecular target for triple negative breast cancer. Proc. Natl. Acad. Sci. USA 2014, 111, 14710–14715. [Google Scholar] [CrossRef]
- Takizawa, K.; Kamijo, R.; Ito, D.; Hatori, M.; Sumitani, K.; Nagumo, M. Synergistic induction of ICAM-1 expression by cisplatin and 5-fluorouracil in a cancer cell line via a NF-κB independent pathway. Br. J. Cancer 1999, 80, 954. [Google Scholar] [CrossRef]
- Tsai, S.T.; Wang, P.J.; Liou, N.J.; Lin, P.S.; Chen, C.H.; Chang, W.C. ICAM1 Is a Potential Cancer Stem Cell Marker of Esophageal Squamous Cell Carcinoma. PLoS ONE 2015, 10, e0142834. [Google Scholar] [CrossRef]
- Xu, Y.; Gao, W.; Zhang, Y.; Wu, S.; Liu, Y.; Deng, X.; Xie, L.; Yang, J.; Yu, H.; Su, J.; et al. ABT737 reverses cisplatin resistance by targeting glucose metabolism of human ovarian cancer cells. Int. J. Oncol. 2018, 53, 1055–1068. [Google Scholar] [CrossRef]
- Catanzaro, D.; Gaude, E.; Orso, G.; Giordano, C.; Guzzo, G.; Rasola, A.; Ragazzi, E.; Caparrotta, L.; Frezza, C.; Montopoli, M. Inhibition of glucose-6-phosphate dehydrogenase sensitizes cisplatin-resistant cells to death. Oncotarget 2015, 6, 30102–30114. [Google Scholar] [CrossRef] [PubMed]
- Ippolito, L.; Marini, A.; Cavallini, L.; Morandi, A.; Pietrovito, L.; Pintus, G.; Giannoni, E.; Schrader, T.; Puhr, M.; Chiarugi, P.; et al. Metabolic shift toward oxidative phosphorylation in docetaxel resistant prostate cancer cells. Oncotarget 2016, 7, 61890–61904. [Google Scholar] [CrossRef]
- Zhao, F.Q.; Keating, A.F. Functional properties and genomics of glucose transporters. Curr. Genomics 2007, 8, 113–128. [Google Scholar] [CrossRef] [PubMed]
- Guo, Q.; Lan, F.; Yan, X.; Xiao, Z.; Wu, Y.; Zhang, Q. Hypoxia exposure induced cisplatin resistance partially via activating p53 and hypoxia inducible factor-1alpha in non-small cell lung cancer A549 cells. Oncol. Lett. 2018, 16, 801–808. [Google Scholar] [PubMed]
- Wu, H.M.; Jiang, Z.F.; Ding, P.S.; Shao, L.J.; Liu, R.Y. Hypoxia-induced autophagy mediates cisplatin resistance in lung cancer cells. Sci. Rep. 2015, 5, 12291. [Google Scholar] [CrossRef] [PubMed]
- Kolde, R. Pheatmap: Pretty Heatmaps. R Package Version 1.0.10. 2018. Available online: https://CRAN.R-project.org/package=pheatmap (accessed on 4 January 2019).
- Team, R.C. R: A Language and Environment for Statistical Computing; R Foundation for Statistical Computing: Vienna, Austria, 2018. [Google Scholar]


| KEGG Pathway Term | Number of Identified Genes Involved | p Value | Gene Names |
|---|---|---|---|
| hsa05200:Pathways in cancer | 13 | 5.29 × 10⁻³ | BMP4, PPARD, BMP2, BCR, PTGS2, EPAS1, PIK3CB, FOXO1, KITLG, MLH1, MMP1, RAC2, WNT9A |
| hsa04350:TGF-beta signalling pathway | 6 | 1.21 × 10⁻² | BMP4, INHBA, BMP2, ID2, ID1, FST |
| hsa00100:Steroid biosynthesis | 3 | 2.92 × 10⁻² | CYP27B1, LIPA, DHCR24 |
| hsa04310:Wnt signalling pathway | 6 | 9.19 × 10⁻² | SENP2, PPARD, RAC2, PRICKLE2, FRAT2, WNT9A |
| KEGG Pathway Term | Number of Identified Genes Involved | p Value | Gene Names |
|---|---|---|---|
| hsa04010:MAPK signaling pathway | 17 | 2.61 × 10⁻⁴ | FGFR3, PDGFA, RELB, CACNG6, CACNG4, NR4A1, STK3, JMJD7-PLA2G4B, RASGRP3, DUSP14, JMJD7, DUSP16, RRAS, HSPB1, TRAF6, GADD45B, PLA2G4B, IL1A, DUSP6 |
| hsa04610:Complement and coagulation cascades | 7 | 4.23 × 10⁻³ | PLAT, C3, CFB, SERPINA1, CFD, F2R, PLAUR |
| hsa04622:RIG-I-like receptor signaling pathway | 6 | 2.09 × 10⁻² | IFIH1, ISG15, IL8, IRF7, TRAF6, DHX58 |
| hsa00920:Sulfur metabolism | 3 | 2.84 × 10⁻² | CHST11, CHST13, SULT2B1 |
| hsa04621:NOD-like receptor signaling pathway | 5 | 4.95 × 10⁻² | CXCL1, IL8, IL18, TRAF6, BIRC3 |
| hsa04514:Cell adhesion molecules (CAMs) | 7 | 7.50 × 10⁻² | ICAM1, CLDN9, CLDN3, ITGB8, PVRL2, CD22, L1CAM |
| hsa04662:B cell receptor signaling pathway | 5 | 8.68 × 10⁻² | RASGRP3, CD22, PIK3AP1, MALT1, VAV1 |
| hsa04330:Notch signaling pathway | 4 | 8.75 × 10⁻² | HES5, DTX2, DLL4, RBPJ |
| Protein | OE33 Cis P Mean Gene Expression (FPKM) | OE33 Cis R Mean Gene Expression (FPKM) | OE33 Cis P Mean Protein Secretion (pg/mL per µg/mL Protein) | OE33 Cis R Mean Protein Secretion (pg/mL per µg/mL Protein) |
|---|---|---|---|---|
| ICAM-1 | 25.26 | 6.08 | 365.64 | 254.39 |
| IL-8 | 7.68 | 0.73 | 71822.10 | 4611.60 |
| IL-1α | 1.49 | 0.27 | 23.10 | 4.56 |
© 2019 by the authors. Licensee MDPI, Basel, Switzerland. This article is an open access article distributed under the terms and conditions of the Creative Commons Attribution (CC BY) license (http://creativecommons.org/licenses/by/4.0/).
Share and Cite
Buckley, A.M.; Bibby, B.A.; Dunne, M.R.; Kennedy, S.A.; Davern, M.B.; Kennedy, B.N.; Maher, S.G.; O’Sullivan, J. Characterisation of an Isogenic Model of Cisplatin Resistance in Oesophageal Adenocarcinoma Cells. Pharmaceuticals 2019, 12, 33. https://doi.org/10.3390/ph12010033
Buckley AM, Bibby BA, Dunne MR, Kennedy SA, Davern MB, Kennedy BN, Maher SG, O’Sullivan J. Characterisation of an Isogenic Model of Cisplatin Resistance in Oesophageal Adenocarcinoma Cells. Pharmaceuticals. 2019; 12(1):33. https://doi.org/10.3390/ph12010033
Chicago/Turabian StyleBuckley, Amy M., Becky AS. Bibby, Margaret R. Dunne, Susan A. Kennedy, Maria B. Davern, Breandán N. Kennedy, Stephen G. Maher, and Jacintha O’Sullivan. 2019. "Characterisation of an Isogenic Model of Cisplatin Resistance in Oesophageal Adenocarcinoma Cells" Pharmaceuticals 12, no. 1: 33. https://doi.org/10.3390/ph12010033
APA StyleBuckley, A. M., Bibby, B. A., Dunne, M. R., Kennedy, S. A., Davern, M. B., Kennedy, B. N., Maher, S. G., & O’Sullivan, J. (2019). Characterisation of an Isogenic Model of Cisplatin Resistance in Oesophageal Adenocarcinoma Cells. Pharmaceuticals, 12(1), 33. https://doi.org/10.3390/ph12010033