Article

A Calibration-Free pH Sensor Using an In-Situ Modified Ir Electrode for Bespoke Application in Seawater

Physical & Theoretical Chemistry Laboratory, University of Oxford, Oxford OX1 3QZ, UK
*
Author to whom correspondence should be addressed.
Sensors 2022, 22(9), 3286; https://doi.org/10.3390/s22093286
Submission received: 9 March 2022 / Revised: 13 April 2022 / Accepted: 13 April 2022 / Published: 25 April 2022
(This article belongs to the Collection Electrochemical Sensors and Platforms: Design and Application)

Abstract

:
A bespoke calibration-free pH sensor using an in situ modified Ir electrode for applications in seawater is reported. The electrochemical behaviour of an iridium wire in air-saturated synthetic seawater was studied and the formation of pH-sensitive surface layers was observed that featured three pH-sensitive redox couples, Ir(III/IV), IrO x O I / IrO x O II H , and Hupd/H+, where Hupd is adsorbed hydrogen deposited at underpotential conditions. The amperometric properties of the electrochemically activated Ir wire were investigated using linear sweep voltammetry first, followed, second, by square wave voltammetry with the formation conditions in seawater for the optimal pH sensitivity of the redox couples identified. The sensor was designed to be calibration-free by measuring the “super-Nernstian” response, in excess of ca 60 mV per pH unit, of Ir(III/IV) relative to the less sensitive upd H oxidation signal with the pH reported on the total pH scale. The pH dependency of the optimised sensor was 70.1 ± 1.4 mV per pH unit at 25 °C, showing a super-Nernstian response of high sensitivity.

1. Introduction

pH measurements in chemistry are ubiquitous. As defined by IUPAC [1], pH is a function of the activity of the hydrogen ion in a solution:
pH = log a H + = log ( m H + γ H + m θ )
where a H + is the single ion activity (measured on the molality scale in mol kg1), γ H + is the activity coefficient of the hydrogen ion (H+) at a molality of m H + , and m θ is the standard molality (1 mol kg1). Note that the pH is defined by IUPAC in terms of the single ion quantities and so IUPAC regard Equation (1) as a ‘notional definition’. The development of primary pH standards utilises a ‘primary method of measurement’ that is based on the Harned cell, which comprises a hydrogen electrode and a silver/silver-chloride electrode in a cell containing hydrochloric acid electrolyte and without a liquid junction [2]. Debye–Hückel theory [3] is used for the required chloride ion activity coefficient estimation via the Bates–Guggenheim convention with the latter restricted to ionic strengths of less than 0.1 mol kg1 [4]. This leads to uncertainties of at least 0.003 in pH. It is noteworthy that the seawater has a high ionic strength (I ~0.7 mol kg1) [5] so that pH measurements in seawater are expected to require specific procedures.
Seawater comprises about 97.2 percent of the Earth’s known water and covers approximately 71 percent of its surface. Seawater compositions vary with their biological content, as well as reflecting local coastal industry and geology [6]. pH is an important oceanographic parameter, which is essential for investigating the dynamic state of the chemical and biological processes. First, there is a close interplay between pH, chlorophyll-a (chl-a), and dissolved oxygen (DO) [7]. The pH value of seawater is normally 8.1 but can be higher for eutrophic waters [8] because of the emission of nitrogen- and phosphorous-containing species resulting from human activities [9]. A high pH may inhibit the photosynthesis of algae [10,11]. Chl-a is an important indicator for the presence of algae, notably for assessing eutrophication, and, via satellite imaging of fluorescence from plankton, concentrations. pH variations can thus reflect direct changes in chl-a concentration [7]. Note that phytoplankton are made up of both single-celled algae and cyanobacteria [12], the concentration of which can be monitored at the single entity level by fluoro-electrochemical microscopy [13]. Second, and of current vital importance, the pH of seawater is a significant reference for ocean acidification as a result of carbon emission and reflects its ecological effects [9,14]. Carbon uptake via seawater is a major sink of CO 2 , during which the formation of carbonic acid from atmospheric carbon dioxide lowers the pH of seawater (Equation (2)). For example, the pH of seawater is thought to have decreased from 8.2 before the Industrial Revolution in Western Europe to about 8.1 today [9].
CO 2 + H 2 O H 2 CO 3
Meanwhile, carbonate in seawater is important for marine life to build shells and skeletons. Under conditions of severe acidification, shells and skeletons can dissolve (Equation (3)).
H 2 CO 3 + CO 3 2   2 HCO 3
Third, pH is also directly linked to the solubility of heavy metals [15,16]. The lower the pH, the more toxic the water possibly is as the metals tend to be more soluble. Thus, significant attention needs to be paid to the pH variation of seawater in order to maintain the environmental ecological balance.
The concept and measurement of pH was initiated over a century ago [17] by Sorensen working in the Carlsberg Laboratory, leading ultimately to the IUPAC definition. The latter, however, is not recommended for seawater because of its high ionic strength. Instead, three scales were developed using proton concentration scales rather than the activity scale as defined by IUPAC [18,19,20,21,22]. Specifically, the three scales are the free hydrogen ion scale (Equation (4)), the total hydrogen ion scale (Equation (5)) and the seawater scale.
The free hydrogen ion scale [23,24,25] is defined by:
pH F = log m H +
where the total amount of H+ is calculated in terms of its concentration (molality) rather than activity. In contrast, the total hydrogen ion scale accounts better for the complex chemical environment of seawater in which SO 4 2 ions, if present, can react with H+ to form the ion HSO 4 [19,26], so in terms of the addition of HCl, the resulting H+ concentration is less since some protons form HSO 4 . With this definition:
pH T = log m H + log m HSO 4 = log { m H + [ 1 + m ( SO 4 2 ) / K ( m HSO 4 ) ] }
where m SO 4 2 is the stoichiometric concentration of sulphate and K( HSO 4 ) is the dissociation constant for bisulphate ion [18,21,25,27,28].
The seawater scale recognises the possible presence of both sulphate and fluoride ions [27,29], but this scale was suggested to be unhelpful by Dickson [30] in 1993, who suggested that fluoride should simply be treated as a minor acid base species [18]. Clearly, however, in reporting seawater measurement data it is necessary to state which units and scales are used.
Millero et al. [18] proposed an experimental approach in which pH was studied in terms of the proton concentration with a unit of kg-H2O−1, while the buffers were prepared in seawater using Bis(2-amino-2-methyl-1,3-propaneldiol), Tris(2-amino-2-hydroxymethyl-1,3-propaneldiol), Morpholine, or 2-Aminopyridine referring to the recipes suggested by Bates and co-workers [23,31,32,33]. Then, the corresponding potentials of the buffers with different pH were measured with a Harned cell approach and the resultant pH values were in good agreement with the total pH scale [30,31] Bates’s work provided a good insight for the results discussed below; Tris/HCl buffers prepared in synthetic seawater are applied for the experiments reported later in this paper.
In addition to optical fibre sensing applied for marine environment monitoring [34], spectrophotometry is commonly used to measure the pH of seawater [35,36]. Spectrophotometry is based on different absorbance characteristics of the basic and acidic forms of sulfonephthalein indicators, L2− and HL (from the secondary dissociation HL K 2 H + + L 2 ), the relative amounts of which alter measurably within the range of pH values seen in normal seawater environments. The selection of the specific indicator used, commonly a sulfonephthalein derivative, ref. [37] is decided by the specific pH range of candidate analyte. The log of the secondary dissociation constant (log K2) of the sulfonephthalein indicator should be comparable to the expected pH of the sample solution, i.e., (log K2 (indicator)−1) < pH (sample) ≤ log K2 (indicator) [36,38]. For example, bromocresol green (K2 ≈ 10−4.4) [38,39] is appropriate for acidified samples used in determinations of seawater alkalinity [40], while thymol blue (K1 ≈ 10−8.6) [41] is most appropriate for surface waters, where generally 7.90 ≤ pH ≤ 8.40 [36,42]. The relationship between the pH and the measured parameters is represented by Equation (6):
pH = pH 2 + log [ L 2 ] / [ HL ] = pH 2 + log ( A λ A λ Min A λ Max A λ )
where pH 2 = log K 2 , K 2 is the HL dissociation constant; A λ is the absorbance at wavelength λ and is related to pathlength (l), total indicator concentration (DT) and molar absorbance ( a λ ) through the well-known Beer-Lambert relationship A λ = a λ * D T * l [38,41].
It is noteworthy that spectrophotometry can realise measurements to within ±0.001 pH units while potentiometry has a precision no better than ±0.02 pH units depending on multiple parameters [20,43]. In terms of potentiometric techniques for pH sensing, a H+ ion-selective glass electrode-based pH meter is common in the laboratory. However, it requires regular calibrations by standard buffers. More importantly, the use of low ionic strength buffers to calibrate a glass electrode for use in high ionic strength solutions, namely seawater, may cause errors [19,21]. Beyond the glass pH meter, in the case of potentiometric titrations, an all-solid-state ion-selective electrode (ISE), with functionalised multiwalled carbon nanotubes being drop casted on a glassy carbon electrode, were developed by Cuartero et al. [44]. This ISE was applied in a 600 mM NaCl to mimic seawater environments. However, similarly to the glass pH meter, calibrations are recommended to be made every hour prior to and during the measurements to compensate for electrode drift and for changes in temperature. Finally, pH is calculated referring to the measured potential E using the calibrated linear relationship (Equation (7)):
E = E 0 + s × log [ a 1 ( H + ) ]
where the slope s is equal to 2.303 × RT zF (R is the gas constant, T is the temperature, z is the charge of the ion, and F the Faraday constant) based on the Nernst equation [44].
Even when conducted with the greatest expertise and diligence, potentiometry simply reports a single number from which it is often difficult, if not impossible, to ascertain the quality or validity of the measurement (Figure 1). This consideration is especially important in complex matrixes such as seawater and blood where electrode fouling is often encountered. In response to this need, we have suggested the use of voltammetry where the response in the form of a current-voltage plot allows for a measure of the quality of response to be judged [45,46,47,48]. The concept is shown schematically in Figure 1 from which it is apparent that the peak shape and width allow for a measure of measurement ’quality’ and for deciding whether the electrode needs to be repositioned, cleaned, or replaced. For example, as shown by the right part of Figure 1, the black voltammogram obtained by amperometry is better-defined than the red one and the associated measurement is more reliable.
Whilst amperometric pH sensors have found wide application [49,50,51,52,53,54,55], there has been only limited application of amperometric pH measurements in seawater, although Sisodia et al. [56] recently reported an electropolymerised 2-(methylthio)phenol modified glassy carbon based electrode as an voltammetric pH sensor in seawater that had a sub-Nernstian response in buffers (pH = 4–9.2) of 51 mV/pH unit. The measured pH (8.28) of seawater using the electrode had a good match compared to that obtained by a conventional glass pH probe (8.30).
In this paper we develop a metal oxide microelectrode for amperometric pH detection based on pH-sensitive anodic iridium oxide film (AIROF) synthesised by cyclic voltammetry in seawater on the surface of an iridium wire. Noteworthy is that in contrast to the iridium oxide with a near-Nernstian response (ca. 60 mV per pH unit) prepared by other methods, e.g., sol-gel [57,58] chemistry, sputtering [59,60], and thermal methods [61,62], AIROF formed on the bespoke electrode is able to respond with a super-Nernstian slope as reported [63,64,65]. The observed pH responses are summarised in Table S1 Supplementary Materials. Second, the bespoke sensor is calibration-free. All the electrochemical reactions investigated in this project take place in a three-electrode system [66]. The basis of calibration free amperometric pH measurement is the recording of two or more voltammetric peaks with different sensitivity to pH. Then the difference of the associated peak potentials, if measured in the same voltammogram at essentially the same time, is independent of any drift for example in the reference potential [49,52,67,68]. In the case of the iridium wire-based sensors, the analytical pH responses arise from the pH dependency of the potential of the strongly pH sensitive Ir3+/4+ redox couple measured relative to the much less pH-sensitive hydrogen underpotential re-oxidation. As the potentials of these redox reactions are collected during one measurement and only the relative potentials between them are used analytically, the stability and accuracy of the reference electrode are not important. Linear sweep voltammetry was investigated first, followed by square wave voltammetry to explore the relative sensitivity of the pH dependency to the two techniques. The super-Nernstian relationship coupled with the capability of assessing the measurement quality imply the validity and merit of the bespoke sensor.

2. Experimental Section

Chemicals and Reagents. Solutions were prepared using deionised water with a resistivity of 18.2 MΩ cm at 298 K (Millipore, Millipak Express 20, Watford, UK). All chemicals were of analytical grade and were used as received without any further purification. Three synthetic seawater samples with defined pH values were prepared for the calibration of a HACH LANGE Sension+ PH31 pH meter, one of 2-Aminopyridine (99.0%, Sigma-Aldrich, Saint Louis, MO, USA), Tris(hydroxymethyl) Aminomethane (Tris, 99.0%, Sigma-Aldrich, Saint Louis, MO, USA), and 2-Amino-2-methyl-1,3-propanediol (Bis, >99%, Alfa Aesar, Heysham, Lancashire, UK) was dissolved in synthetic seawater separately with a molarity of 0.08 M. These solutions have been shown to give good correlation with the total pH scale as discussed above [18,30]. The composition of synthetic seawater and corresponding buffers is presented in Table 1 following a literature recipe [30]. Sodium chloride (NaCl, 99.5%), potassium chloride (KCl, 99.5%), magnesium chloride (MgCl2, 98%), calcium chloride (CaCl2, 97%), and sodium sulphate (Na2SO4, 99%) were purchased from Sigma-Aldrich. The 0.04 M equimolar buffers were finally obtained by adding 0.04 M hydrochloric acid (Fisher Scientific UK Limited, Loughborough, Leicestershire, UK~37%) to synthetic seawater. The pH values of ‘standard seawater buffers’ were defined as 6.77, 8.07, and 8.81, respectively, for 2-Aminopyridine, Tris, and Bis. To study the pH dependency of the bespoke electrode, various buffer solutions were prepared with their pH values adjusted by adding a trace of HCl.
Electrochemical apparatus and methods. Electrochemical measurements were performed using a μAutolab II potentiostat (Metrohm-Autolab BV, Utrecht, The Netherlands). A standard three-electrode set-up was used, consisting of a saturated calomel reference electrode (SCE + 0.244 V vs. SHE, BASi Inc., West Lafayette, IN, USA), a graphite rod counter electrode, and an iridium wire (0.1 mm in diameter, GoodFellow, UK) as the working electrode. The Ir electrode was pretreated by heating the metal using a Bunsen burner for 10 s to remove surface contamination and impurities. The electrochemical set up was thermostated at a constant value of 25.0 ± 0.2 °C. High purity N2 flow (BOC Gases plc, UK) was used to remove oxygen from aqueous solutions as needed prior to the electrochemical measurements. Cyclic voltammetry (CV) was used to study the electrochemical behaviour of the Ir electrode and for the potential cycling activation. Linear sweep voltammetry (LSV) and square wave voltammetry (SWV) were conducted to determine the pH dependency of in situ modified Ir wire after a potential cycling activation.

3. Results and Discussion

In the following sections, we first analyse the voltammetry of an iridium wire in synthetic seawater under conditions of controlled pH. We demonstrate that it is possible to reproducibly form layers of iridium oxide in synthetic seawater and assign the various pH-sensitive redox couples, which are subsequently used as the basis for the amperometric calibration-free pH sensing without the need for any degassing to remove dissolved oxygen. Next, potential cycling is developed as a simple method of electrode activation directly within seawater and this is optimised in terms of the potential window used. Further electrode optimisation is made in respect of recording the various relevant redox couples pertinent to pH measurements and characterising the corresponding pH dependency of a calibration-free sensor. Linear sweep voltammetry was investigated first, followed by square wave voltammetry to improve sensitivity and precision.

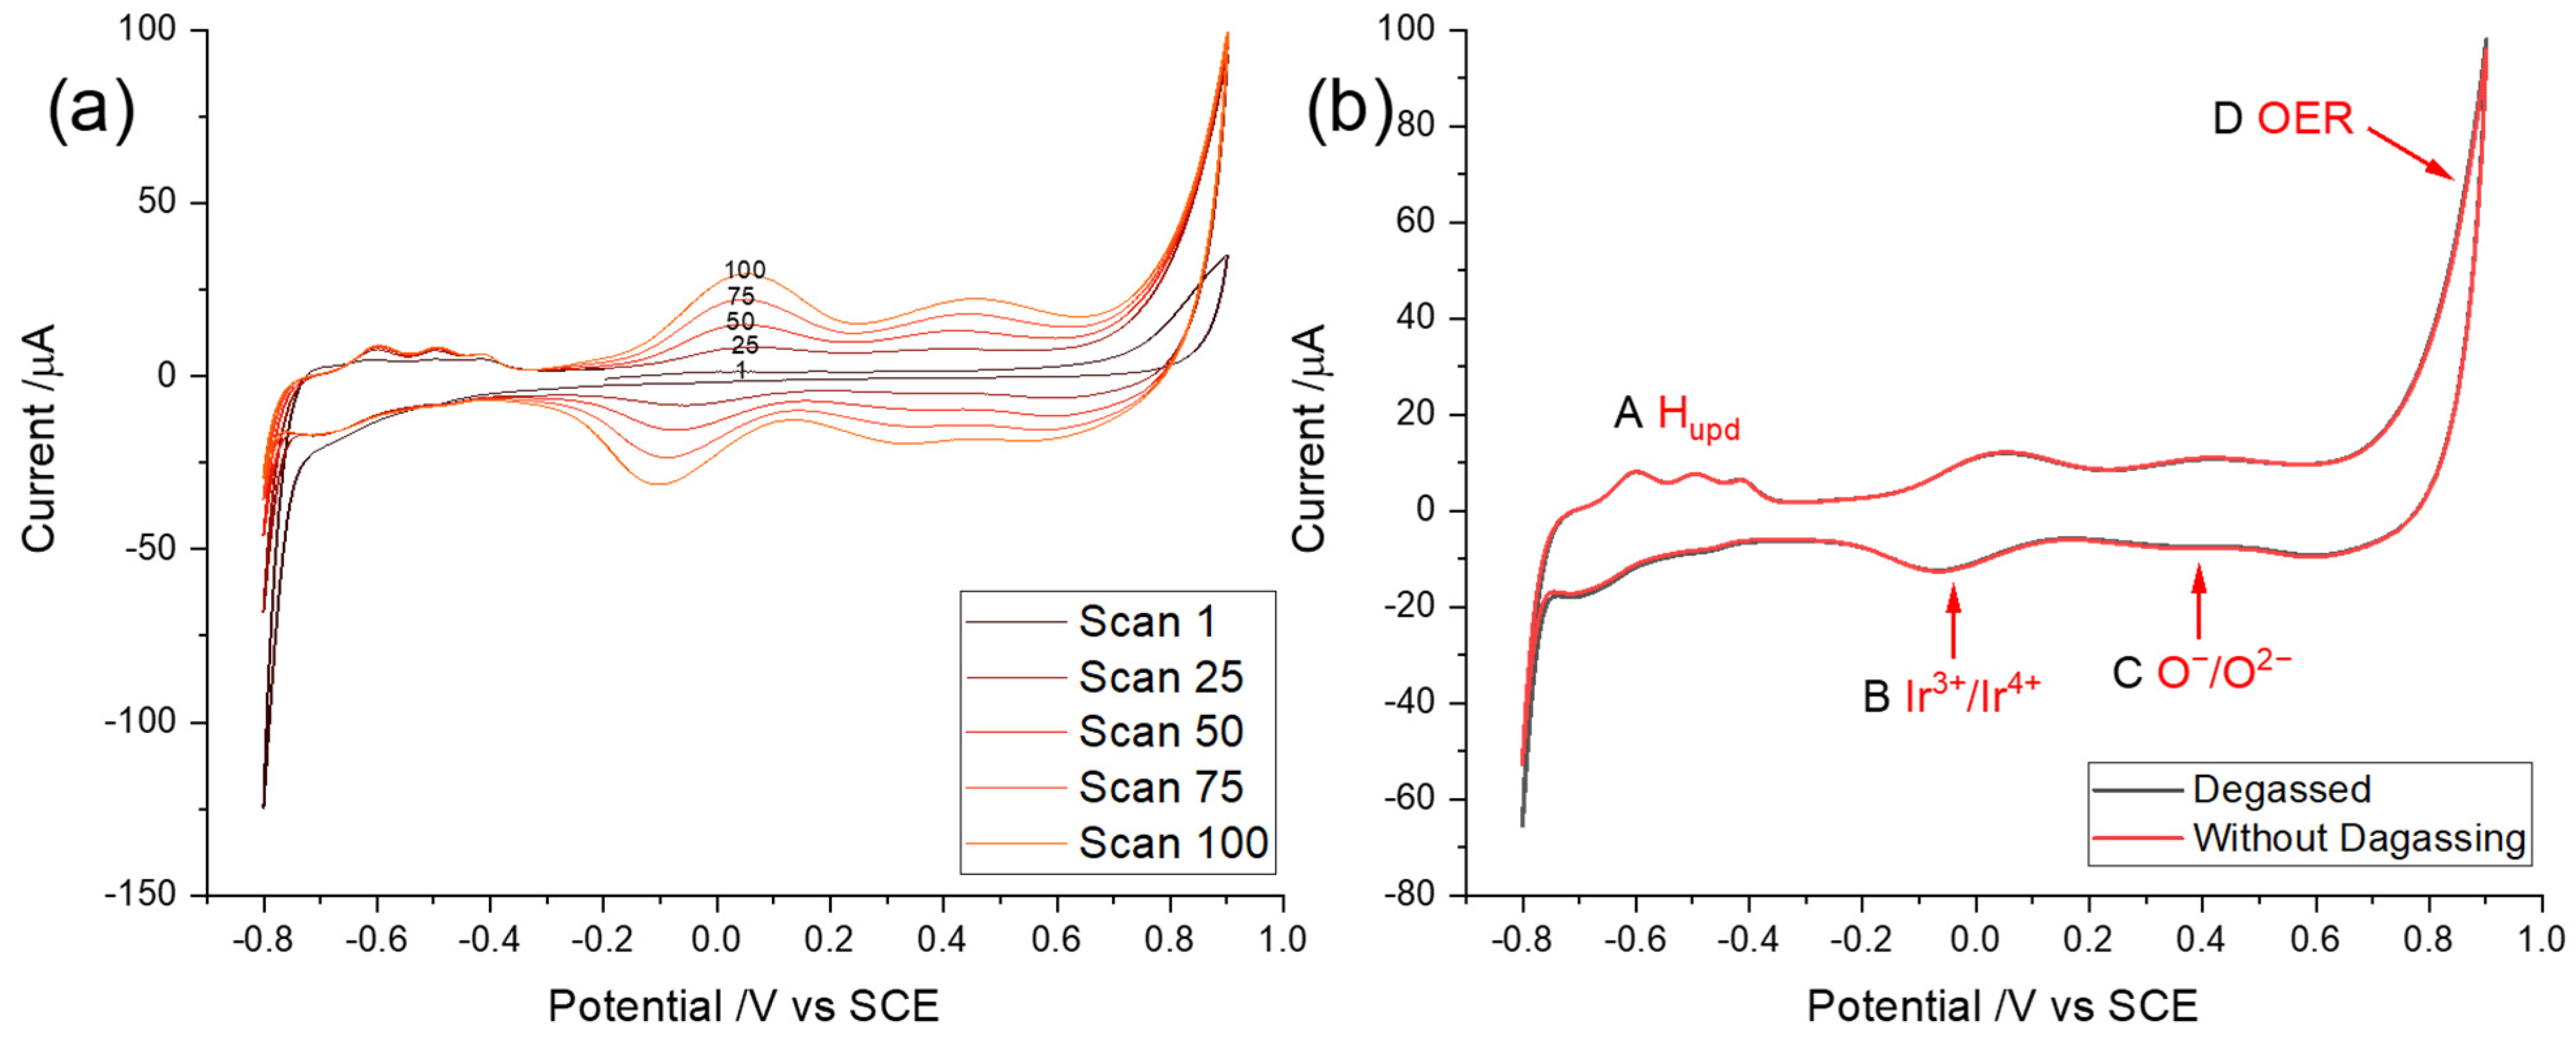
3.1. Cyclic Voltammetry of Iridium and Iridium Oxides

Cyclic voltammetry was conducted to study the formation of iridium oxides on the surface of an iridium wire and other redox reactions that occur during potential cycling. It was discovered that to ensure reproducible data, the surface of the Ir wire should be free of oxide prior to voltammetric measurements. Accordingly, as reported in previously [48], the Ir surface was treated by pre-flaming to renew the surface of the metal electrode between experiments. To explore the voltammetric behaviour of an Ir wire and the effect of degassing, the pre-flamed Ir electrode was first immersed in air-saturated synthetic seawater buffered by Tris(hydroxymethyl) Aminomethane/HCl to give a pH close to typical natural seawater (8.1 [9]), and then the same process was repeated in a degassed solution. Cyclic voltammetry was conducted for 100 cycles starting at a potential of −0.2 V vs. SCE with scan reversal at a potential of 0.9 V with a subsequent sweep to −0.8 V vs. SCE where the potential was again reversed as shown in Figure 2a. In Figure 2b, the 40th scan of cyclic voltammograms obtained in synthetic seawater with and without degassing are overlaid. It is thought that this procedure leads to the steady build-up of a surface layer, the thickness of which increases with each potential cycle, which displays several redox features in conventional electrolytes [69,70,71] and are closely mirrored in the data obtained in seawater as shown in Figure 2. Note that comparison of the data with and without degassing shows no difference of peak shape or numbers of peaks between the two, with four clearly discernible voltammetric features labelled as A, B, C, and D. This comparison implies that degassing has no effect on the voltammetry and represents an important step in respect of developing amperometric pH measurements for direct use in seawater without the need for removal of oxygen from dissolved air.
Feature A was assigned to the re-oxidation of underpotential deposited (UPD) adsorbed hydrogen, Hupd, formed at very negative potentials (more negative than −0.32 V vs. SCE). It is notable that it is a one proton–one electron transfer reaction with the reductive formation described by Equation (8) and the oxidative desorption by Equation (9) [72,73,74,75]:
M ( s ) + H 3 O + + e M H ad + H 2 O 1 2 H 2 + M H 2 O ad
M H ad H + + e + M
where M is an empty adsorption site on the surface.
Feature B was attributed to an Ir(III/IV) redox transition, previously confirmed by XPS [48,70,71,76], associated with the formation of hydrous oxides, where the oxidation peak is at a potential of ca. 0.08 V vs. SCE and the reduction peak is at ca −0.04 V vs. SCE. Note that this process involves various possible redox reactions and the exact stoichiometric composition of the hydrous film is reported as hard to determine [47,65,77]. The redox process is known to involve numbers of electrons and protons with a ratio of 2:3 leading to a “super-Nernstian” pH dependency of ca 89 mV per pH unit [47,78,79], as implied in the reaction suggested by Olthuis et al. [65]:
Ir 2 O ( OH ) 3 O 3 3 + 3 H + + 2 e 2 Ir ( OH ) 2 O + H 2 O
where “super-Nernstian” means a response of greater than 60 mV per pH unit. The average transfer of 1.5 protons per electron are understood in terms of two iridium ions each gaining an electron and the associated oxide ions gaining three. Note that the redox reaction between Ir 2 O ( OH ) 3 O 3 3 and Ir ( OH ) 2 O is denoted as Ir(III/IV) for simplification in this paper.
Feature C shows an oxidation peak at about 0.42 V with the corresponding reductive peak at 0.37 V vs. SCE. Pickup et al. [80] and Kasian et al. [81] suggested that the redox couple in Feature C can be attributed to further oxidation of the Ir hydrous oxides, e.g., from Ir (IV) to Ir (V/VI), while Pfeifer et al. [70,71,76] assigned it to the oxidation of the oxide anion O2, contained in the IrOx matrix in form of adsorbed OH groups, to O:
IrO x O II H IrO x O I + H + + e
Feature D is related to the oxygen evolution reaction (OER) [70]:
2 H 2 O O 2 + 4 H + + 4 e
As the number of potential cycles increases as shown in Figure 2a, a build-up of the Ir hydrous oxide layer was inferred with scans increasing because of the repeated redox process as explained by the mechanism reported in the previous paper [48]. It is noteworthy that the four features are all pH sensitive but have different pH dependencies, which is significant for the development below of a bespoke pH sensor for seawater in respect to facilitating calibration-free measurements.

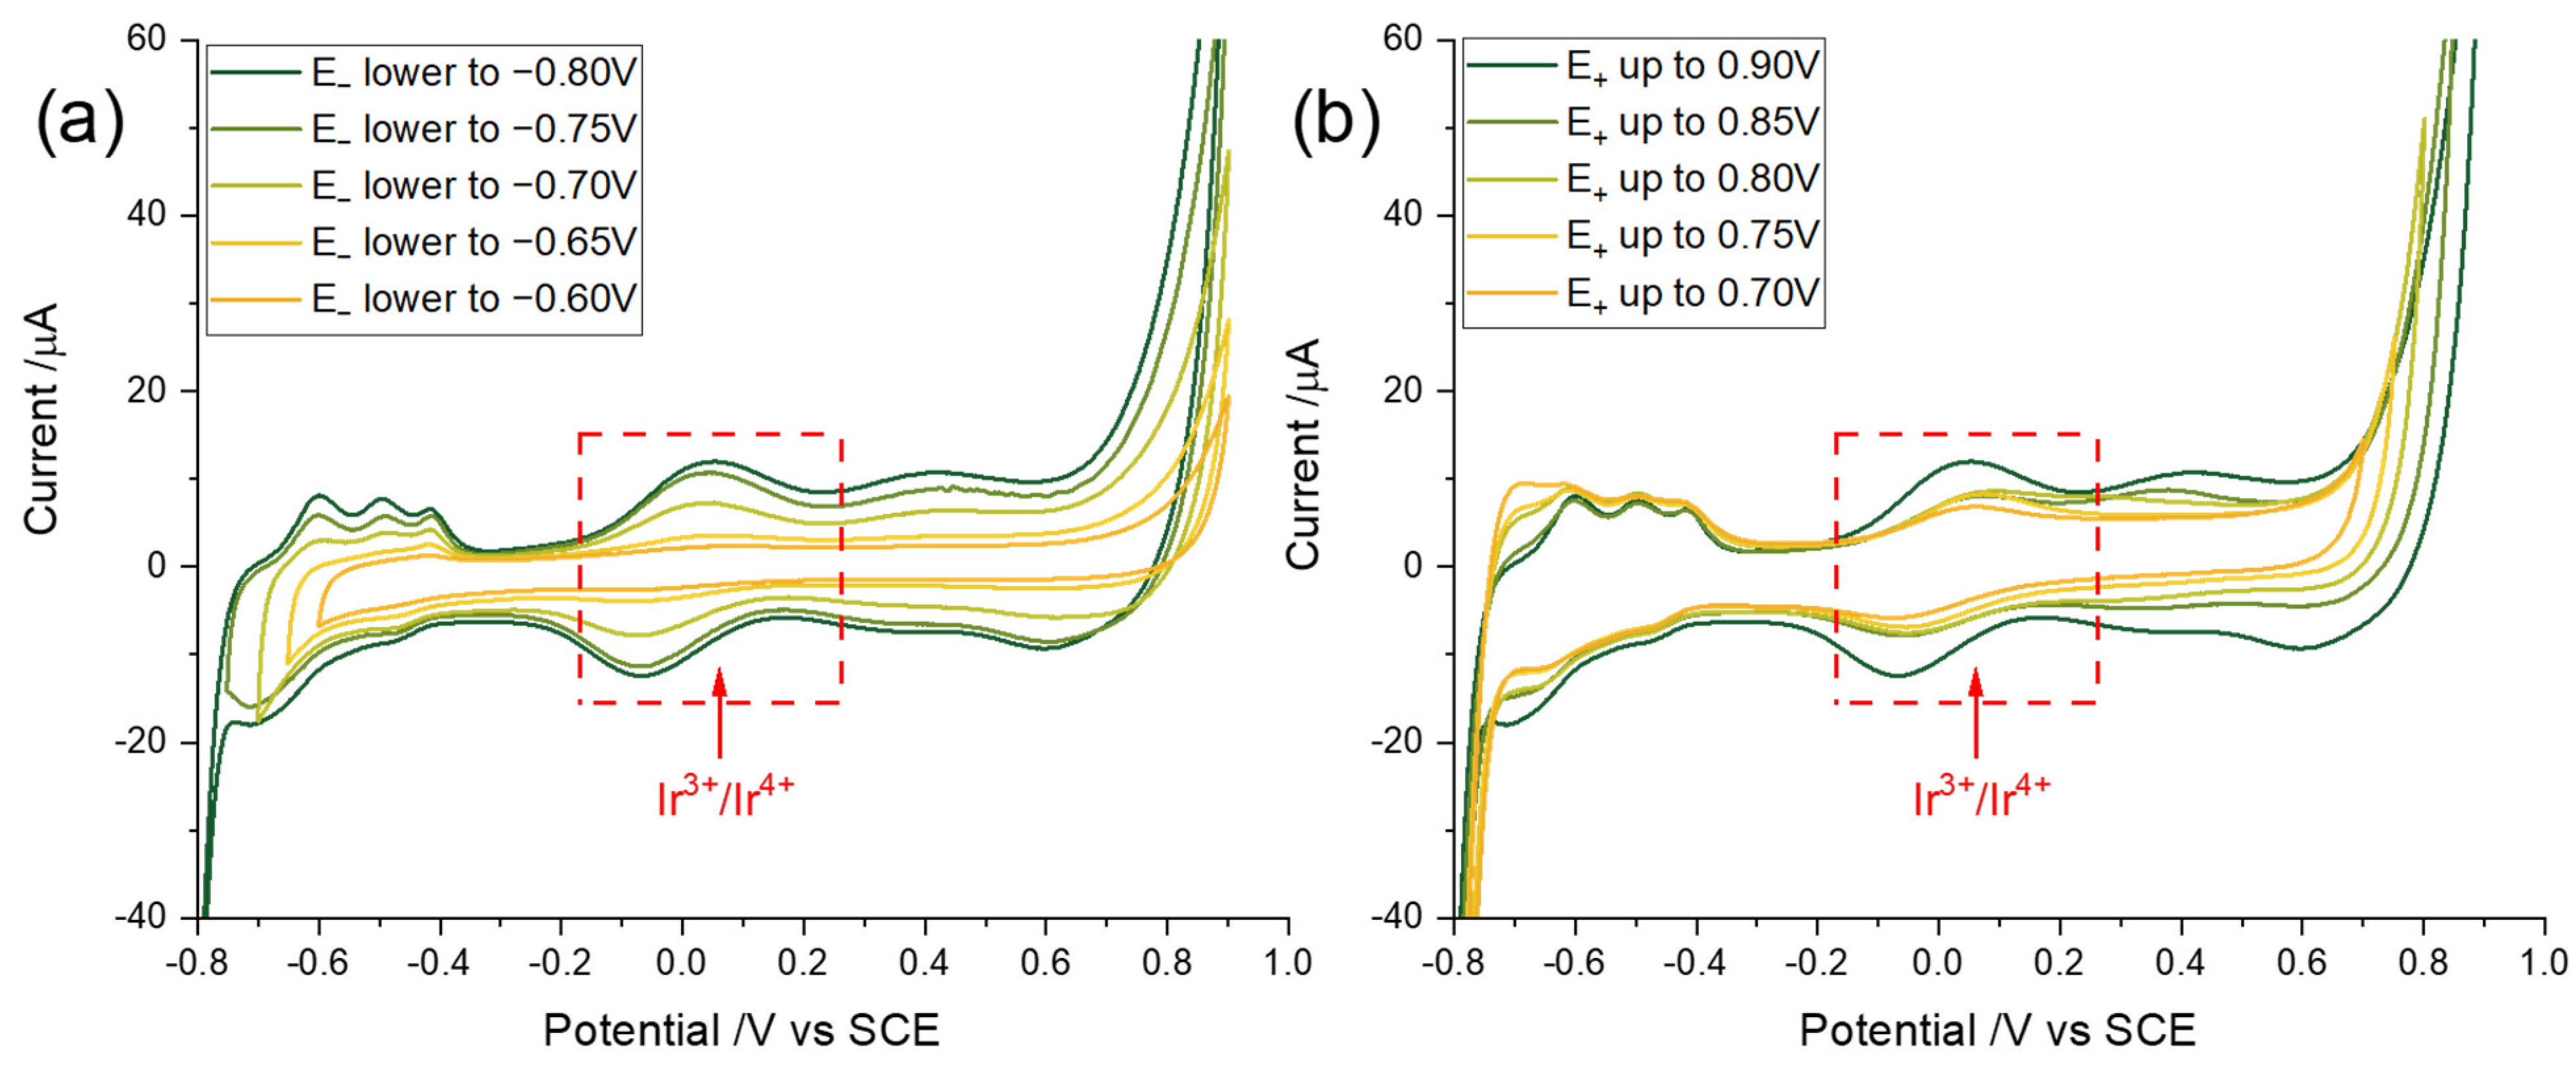
3.2. Optimization of Potential Cycling Activation

The different redox processes encountered during potential cycling were identified and explained in the previous section. To obtain better resolved pH-sensitive redox couples and improve the sensitivity in respect of pH detection, the most effective potential window of potential cycling was studied in the following. To be specific, the effect of the cathodic limit potential was investigated first, followed by that of the anodic limit potential.
As shown in Figure 3a, cyclic voltammograms with different potential windows using a pre-flamed Ir wire were measured at a scan rate of 0.5 Vs−1 in an air-saturated Tris/HCl solution prepared in synthetic seawater (pH = 8.14, corresponding to natural seawater [9]). Note that as the potential window shifts as pH changes, conducting the optimisation in synthetic seawater of a typical and average pH results in a potential window applicable to a wide range of seawaters, the pH of which can vary from 7.5 to 8.5 depending on the local conditions [43]. The cyclic voltammetry starts at a potential of −0.2 V and is first swept anodically to a fixed potential of 0.9 V, then swept to different cathodic limits varying from −0.8 V to −0.6 V vs. SCE. To find the optimised cathodic potential, the 40th cycles of each voltammogram were displayed in Figure 3a. Figure 3b shows the 40th scans of the CVs with the cathodic potential being fixed at −0.8 V, while the anodic potential was progressively increased to 0.7 V from 0.9 V vs. SCE.
The signal to the background level of the most dominant Ir(III/IV) redox couple is assigned to be the reference for determining the effectiveness of the potential window as it is the best defined and most prominent. The effectiveness was judged on the basis that the higher the signal to background level, the better for pH detection. In Figure 3a, the redox couple of the 40th cycle becomes better defined with a reductive limit of −0.8 V whilst, in Figure 3b, the highest resolution is achieved with an anodic potential limit extended to 0.9 V. It is significant that the anodic limit has a greater effect on Feature C compared to the cathodic limit. To be more specific, the trend for Feature C to disappear was more obvious as the anodic side was narrowed while the Feature B stayed relatively constant. Pfeifer et al. [70] reported that the IrOxOI− formed during the redox reaction in Feature C is the catalyst for OER (Equation (13)):
IrO x O I + H 2 O IrO x O I O I H + H + + e IrO x + O 2 + 2 H + + 3 e
Thus, the redox feature of interest correlates with the onset of the ORR. Meanwhile, the trend of signal to background level improvement gets less significant when the potential limit is extended either more anodically or cathodically, consistent with literature reports [80,82]. Noting that Pickup et al. [80] reported that the hydrous oxide begins to dissolve when more positive potentials were applied, so no further extension of the potential window was explored. Considering the data in Figure 3, we infer that potential sweeps within the ranges (A) −0.6 V to −0.8 V (Hupd region) and (B) 0.7 V to 0.9 V (OER region) are both important for the growth of the Ir hydrous oxide. To be specific, anodic sweeps to 0.9 V and cathodic to −0.8 V vs. SCE must be embraced by the potential window, so that the in situ fabrication method of an Ir wire responds well to pH.

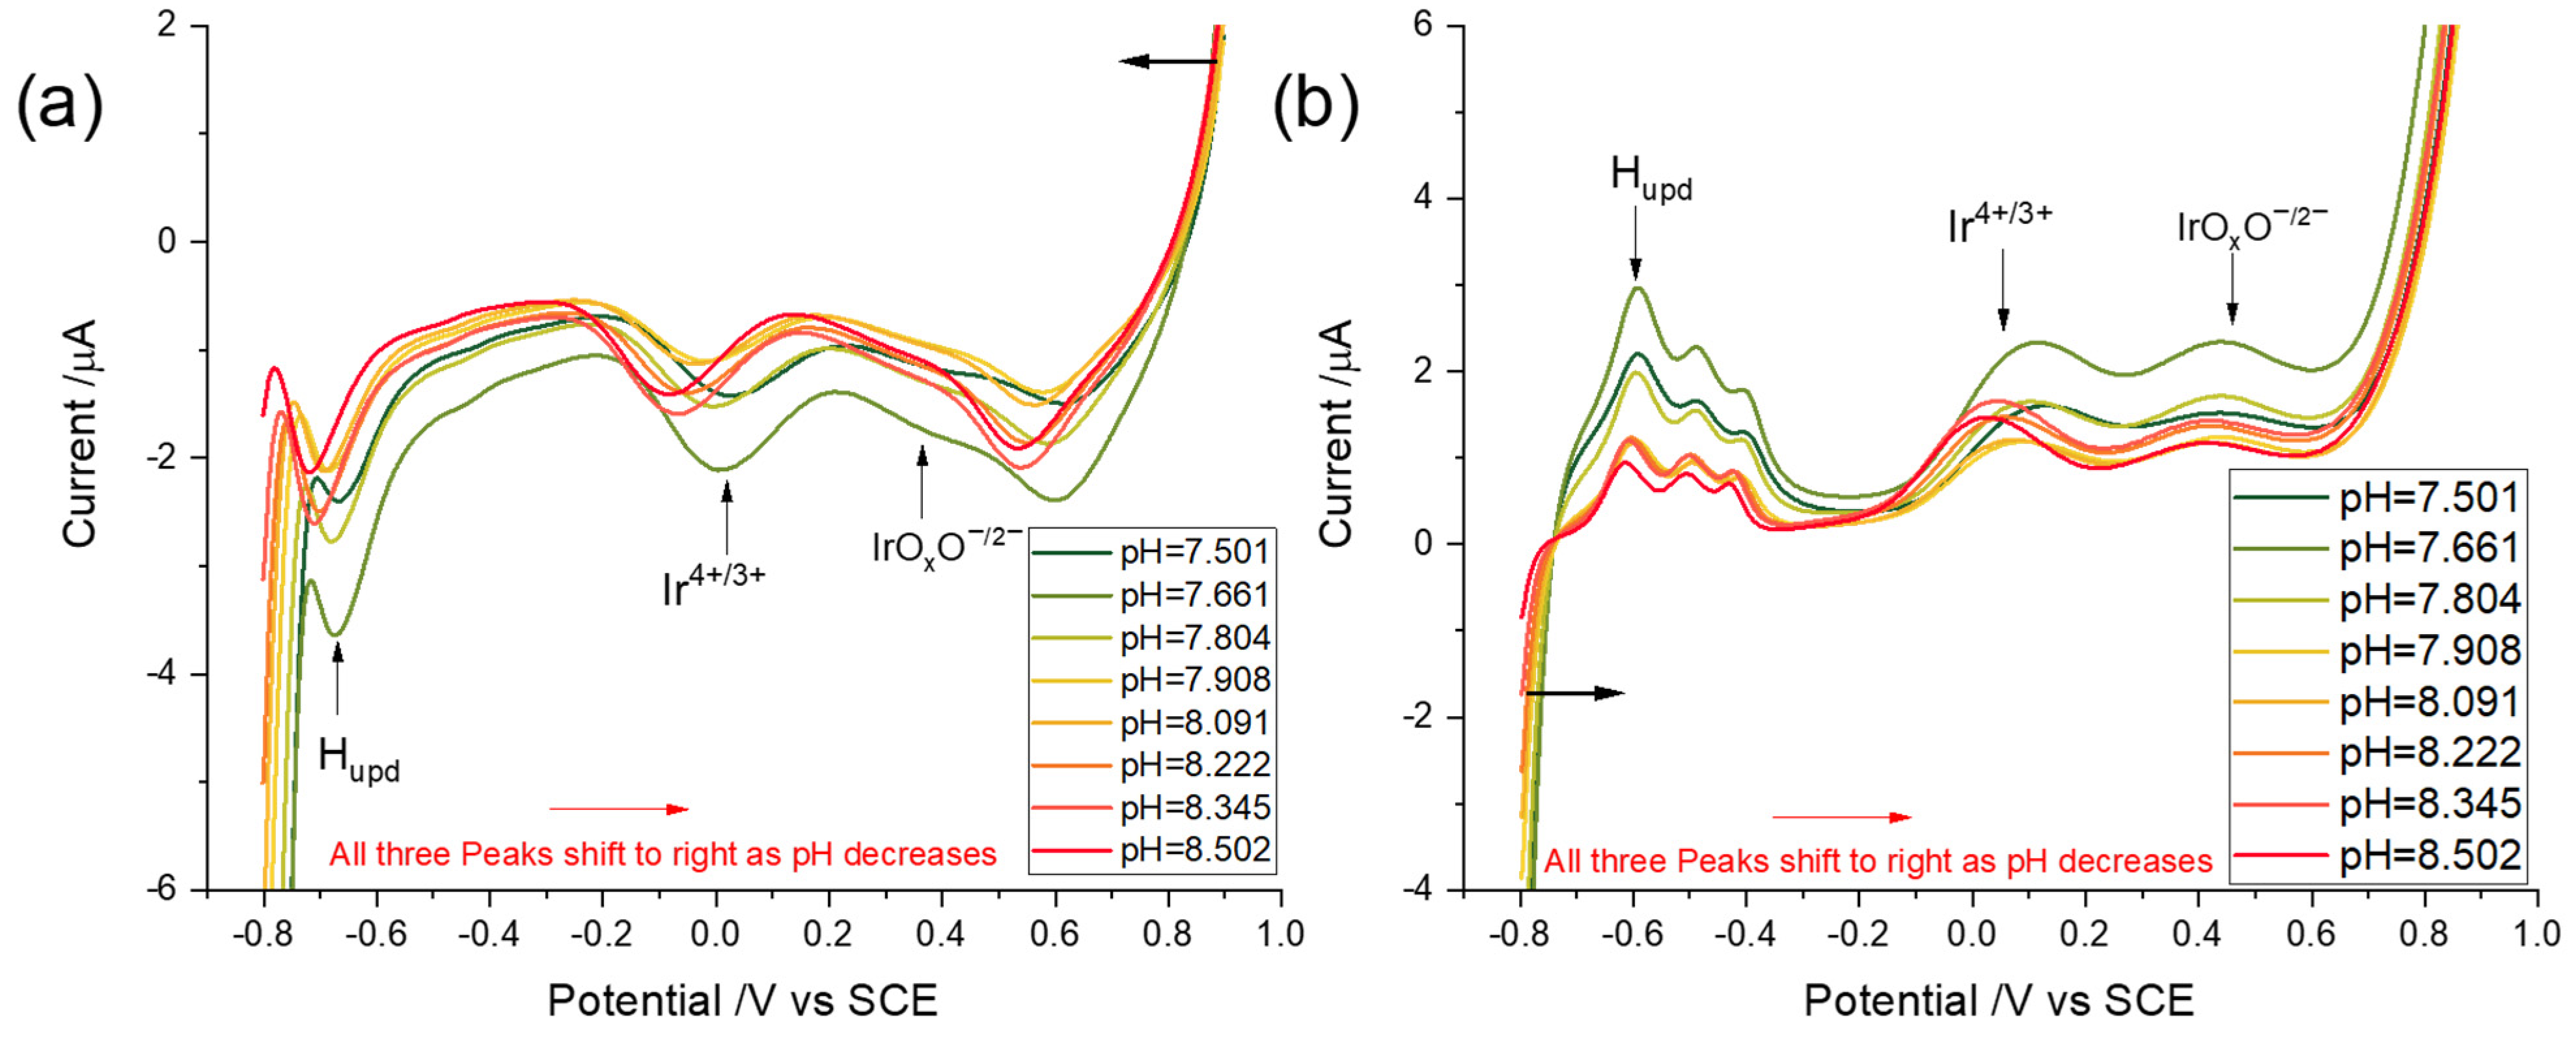
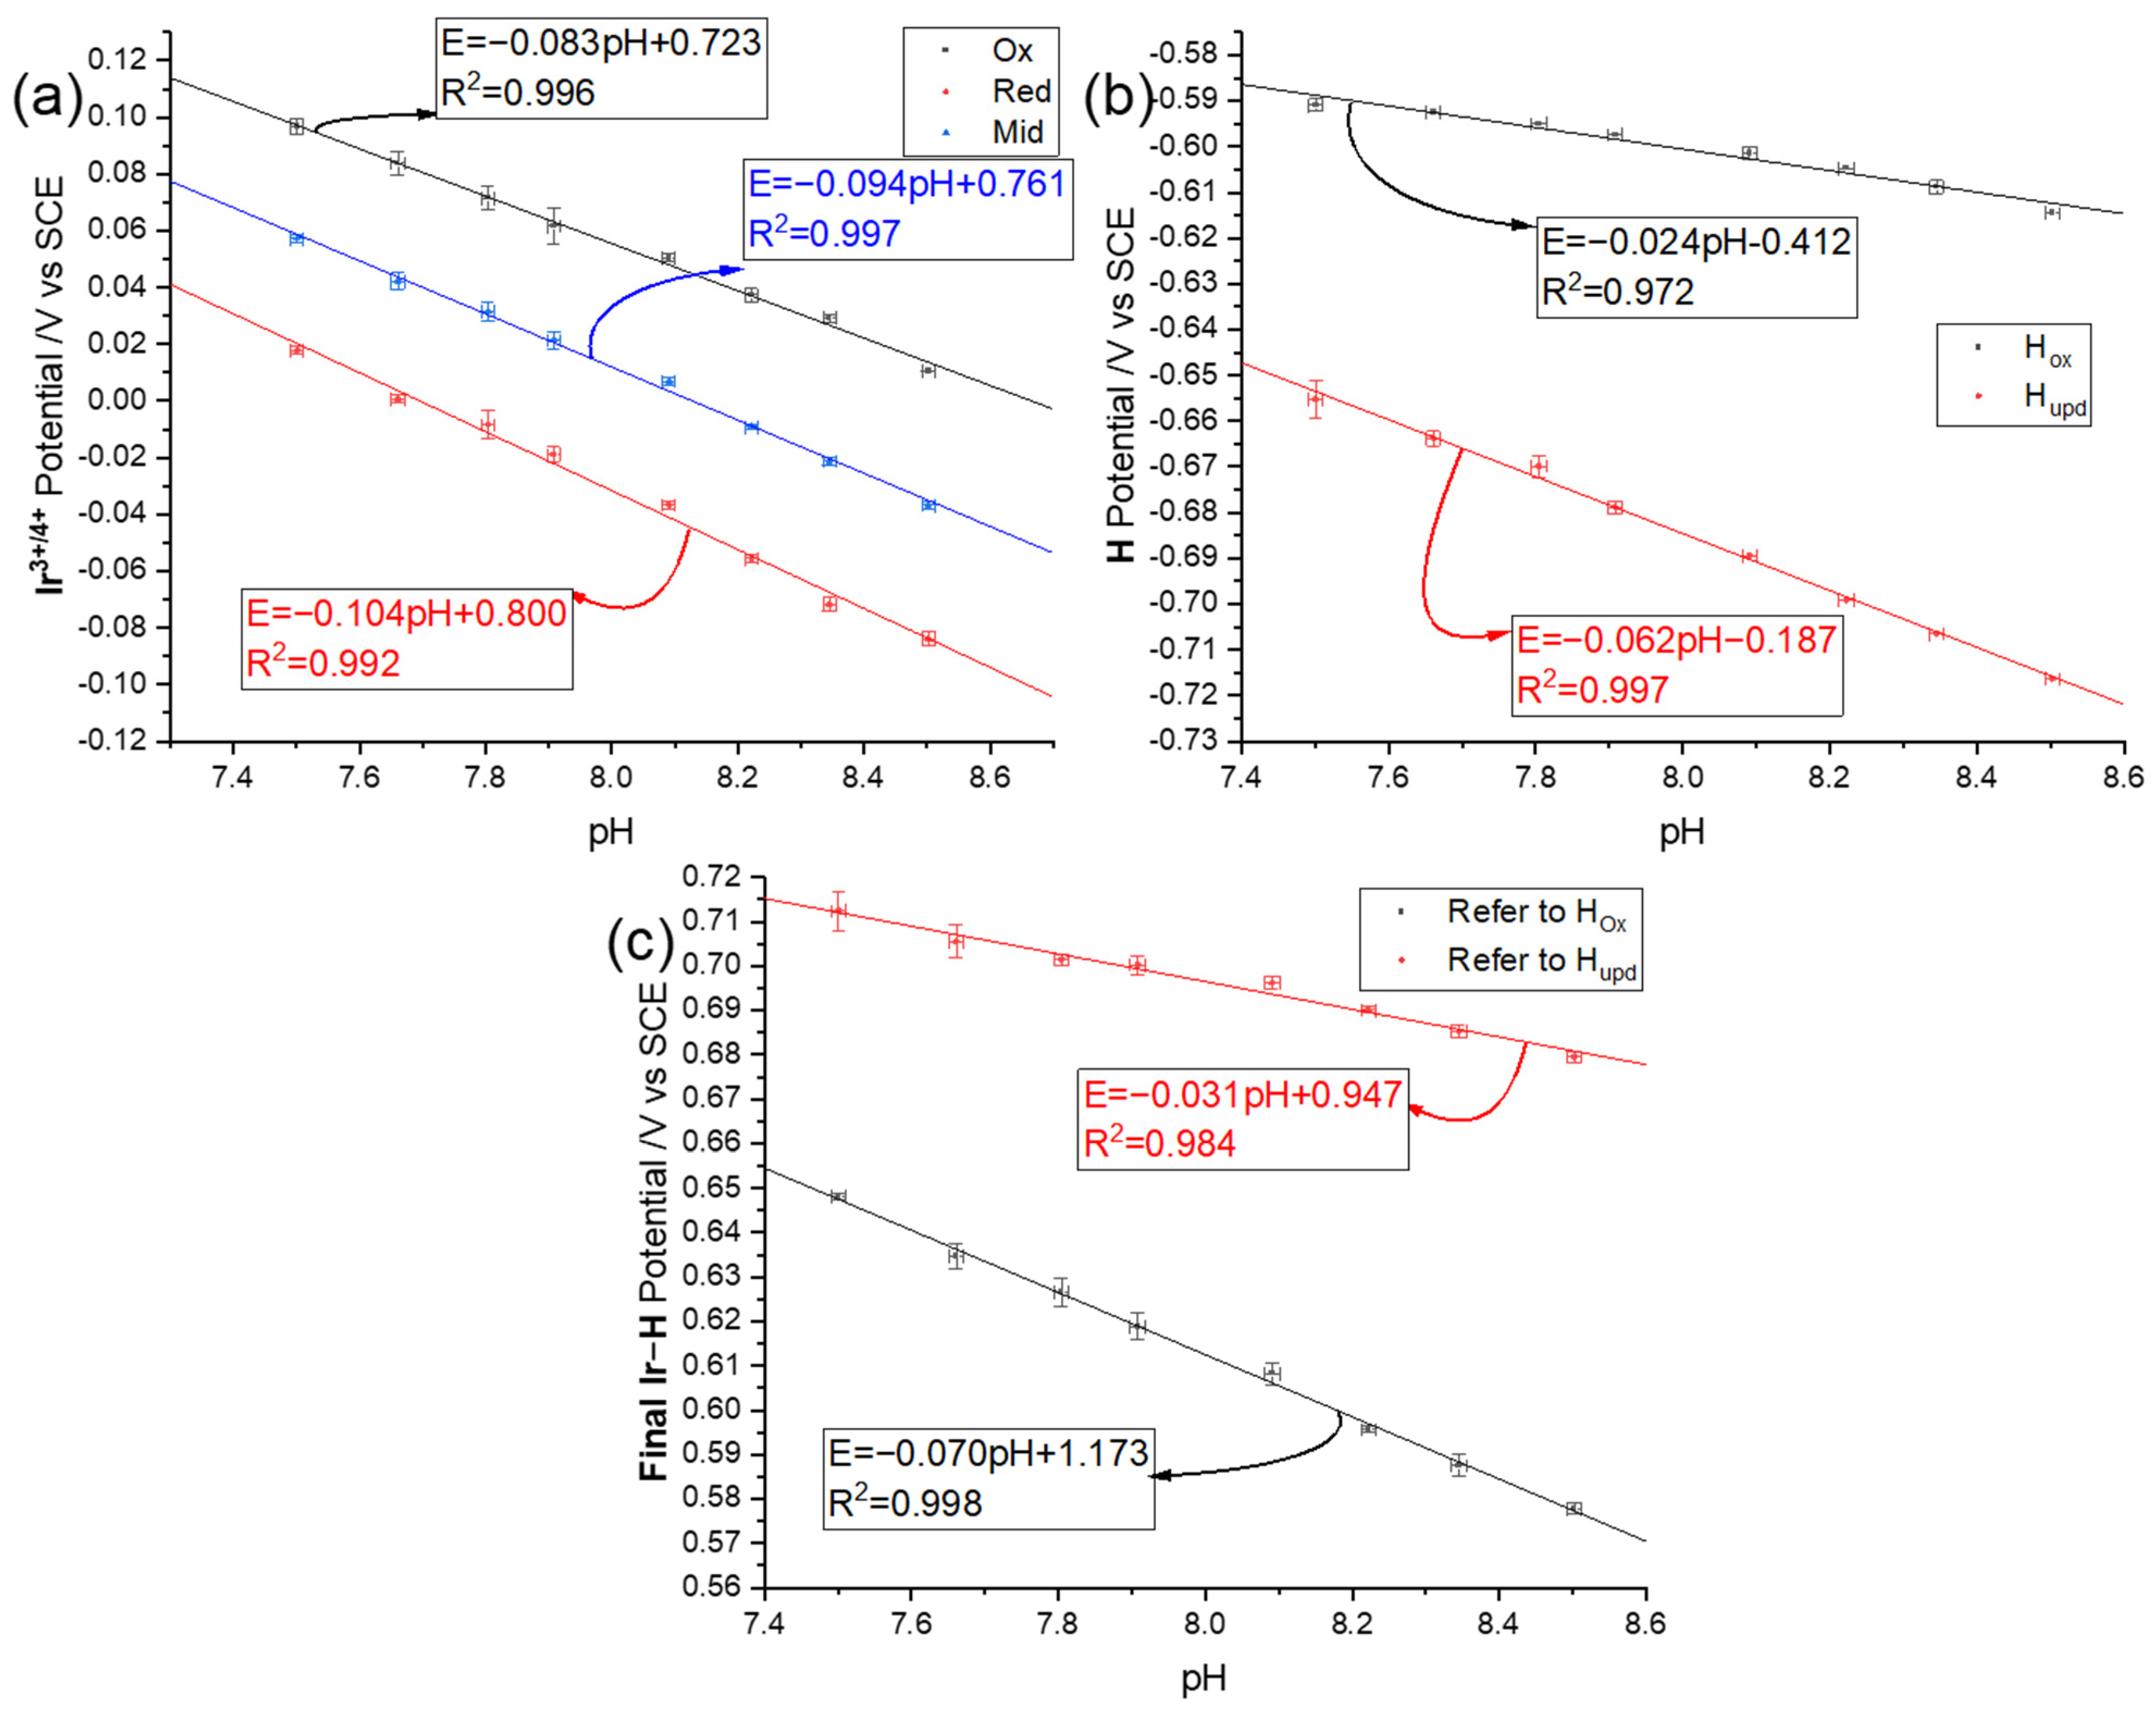
3.3. pH Dependency of the Voltammetric Responses of the Iridium Hydrous Oxide Layers

Following the activation of the Ir wire by potential cycling under the potential window optimised above, the pH dependencies of the two redox signals within the iridium hydrous oxide layer (Ir3+/4+, IrO x O I / IrO x O II H ) and the H underpotential deposition are investigated for the pH range 7.5–8.5 in this section. Linear sweep voltammetry (LSV) was first applied, followed by square wave voltammetry (SWV) to explore the relative sensitivity of the pH dependency to the two techniques.

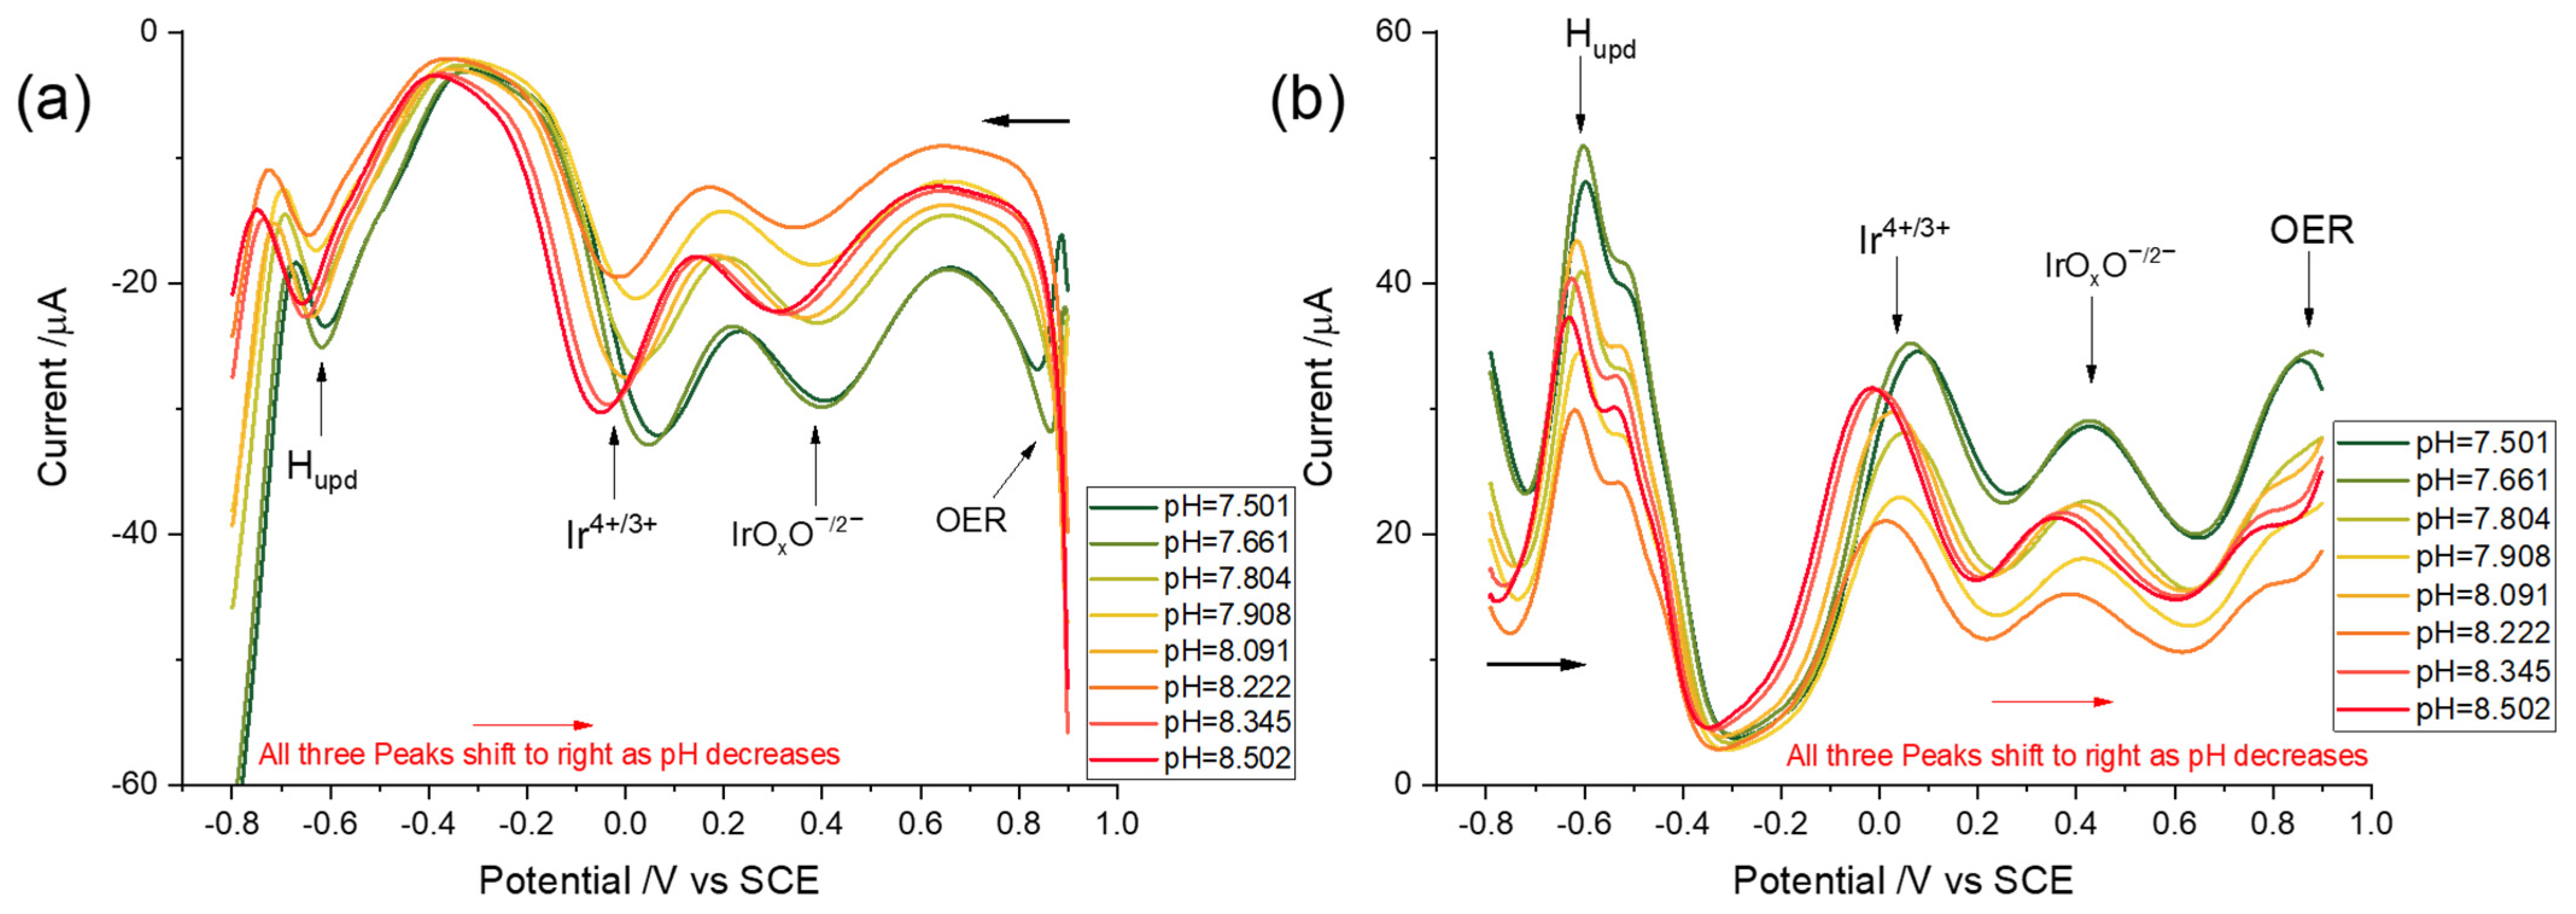
3.3.1. Linear Sweep Voltammetry

Prior to the measurements, the pHs of buffers with pH = 7.50–8.50 were measured by a pH meter calibrated by ‘standard seawater buffers’, which were defined as discussed above, using the total hydrogen ion scale with an uncertainty of 0.01. LSVs were first scanned cathodically from 0.90 to −0.80 V vs. SCE at a scan rate of 0.5 Vs−1 obtaining reduction peaks for IrO x O I and Ir4+ and for the formation of adsorbed (upd) hydrogen (Figure 4a). Then, scans were immediately reversed to 0.90 V generating the corresponding oxidation peaks (Figure 4b). All measurements were repeated more than three times. The pH-sensitive redox couples obtained in synthetic seawater in the range of pH from 7.50–8.50 had peak potentials which shifted towards more negative potentials as the pH increased for both oxidative and reductive scans. The reduction peak of Ir4+ shifted from ca 0.018 to −0.084 V when pH increased from 7.50 to 8.50, while Hupd signal moved from −0.66 to −0.72 V (Figure 4a). For re-oxidation peaks, that of Ir (III) occurred at ca 0.097 V vs. SCE for pH = 7.50, and then shifted to 0.011 V when pH = 8.50, while the signals of H desorption moved from −0.59 V to −0.61 V when pH increased from 7.50 to 8.50. The IrO x O I / IrO x O II H LSV redox peak obtained by CV was not apparent by LSV so that its pH dependency was not studied in this section. Thus, SWV was used to increase the signal sensitivity, which will be discussed in the next section.
To analyse the data, the oxidation and reduction peak potentials of Ir(III/IV) (Figure 5a) and Hupd/Hox were recorded with the corresponding midpoint potentials of Ir(III/IV) being calculated. Ir(III/IV) redox reaction showed a super-Nernstian relationship (93.7 ± 2.1 mV per pH unit), which is a clear merit of the iridium oxide approach to pH sensing. Meanwhile, the super-Nernstian pH dependency agrees with the equilibria proposed by Olthuis et al. [65] as indicated in Equation (10), namely three proton–two electron transfer reaction. In Figure 5b, the Hupd peak showed a near-Nernstian response (62.3 ± 1.5 mV per pH unit). As discussed in Section 1, the pH dependency is consistent with the expected one proton–one electron transfer [74,75]. The best-defined reoxidation peak pointed by an arrow was studied and resulted in less pH sensitivity (23.6 ± 1.6 mV per pH unit). To develop a calibration-free sensor, the super-Nernstian redox couple of Ir(III/IV) was reported relative to one or another of the less pH-sensitive H redox signals (Equation (14) or Equation (15)):
y potential = mid Ir E ( H ox )
y potential = mid Ir E ( H upd )
In this way, the reported response becomes independent of the reference electrode value and hence of any drift in the latter, for example, because of electrode fouling or variable liquid junction potentials. Figure 5c shows the experimental data analysed according to both Equations (14) and (15). The slope using Hox as the reference signal was 70.1 ± 1.4 mV per pH unit, while it was 31.3 ± 1.6 mV per pH unit referring to Hupd peak potentials. One can conclude that referring to Hox results in a higher pH sensitivity with a smaller uncertainty. In the next section, SWV was explored to identify any possible improvements in the analytical responses.

3.3.2. Square Wave Voltammetry

In this section, the signal-to-background ratio of the redox peaks of interest was explored using square wave voltammetry (SWV) following potential cycling activation of the iridium wire. The optimisation of the SWV parameters, including frequency, step potential, and amplitude, was implemented to obtain the best-defined square wave voltammograms for pH measurements as identified elsewhere [48]. The optimised SWV parameters, namely a frequency of 90 Hz, an amplitude of 60 mV, and a step potential of 1 mV, were applied for pH measurements in synthetic seawater with various pHs. First, an iridium wire was activated by potential cycling activation with a potential window between −0.80 V and 0.90 V vs. SCE at a scan rate of 0.5 Vs−1 for 40 cycles in synthetic seawater solutions (pH = 7.50–8.50). Then, SWVs with optimised parameters were conducted following in situ activation. All measurements were repeated three times. The reduction peaks were recorded first, which initially swept to the negative potential, −0.80 V vs. SCE, from 0.90 V (Figure 6a), and the scans were then reversed to obtain oxidation peaks (Figure 6b). The peak potentials of the resulting pH-sensitive redox couples shifted towards more negative potentials as the pH increased for both oxidative and reductive scans. Interestingly, whilst a peak attributable to the IrO x O I / IrO x O II H redox couple was not apparent in the linear sweep voltammetry, it was apparent in the SWV because of the increased resolution. The redox couples occurred at similar potentials as observed in the CVs, with physically insignificant differences of the order of 10−3 V. To be more specific in terms of pH dependency, the reduction peak occurred at ca 0.42 V vs. SCE in a pH = 7.50 seawater and shifted to ca 0.33 V when the pH was 8.50. Meanwhile, the reduction peak of Ir4+ shifted from ca 0.044 to −0.062 V, and the Hupd signal moved from −0.60 to −0.65 V when the pH increased from 7.50 to 8.50 (Figure 6a). In the cases of the reoxidation peaks, that of IrO x O II H appeared at ca 0.44 V vs. SCE for pH = 7.50 and shifted to 0.36 V when pH = 8.50, while the Ir(III) oxidation peaks were shifted from ca 0.058 to −0.027 V. The signals of H oxidation moved from −0.59 V to −0.63 V when pH increased from 7.50 to 8.50 (Figure 6b). Note that capacitive effects can cause illusory peak-like features in addition to OER at high potentials by SWV, which do not appear on LSV.
Figure 7a and IrO x O I / IrO x O II H (Figure 7b) being calculated. The pH dependencies of Hupd and H oxidation are shown in Figure 7c. Similar to the results obtained by LSV, Ir(III/IV) showed a super-Nernstian relationship, 96.9 ± 2.0 mV. It is noteworthy that IrO x O I / IrO x O II H redox reactions also showed a super-Nernstian pH dependency (85.4 ± 5.4 mV per pH unit), which is in contrast to the one proton–one electron transfer mechanism (Nernstian) proposed by Pfizer (Equation (11). However, because the formed iridium hydrous oxide is amorphous, it is difficult to deduce the precise mechanism and stoichiometric composition [81,83,84]. For consistency and convenience, we refer to this redox couple as IrO x O I / IrO x O II H in the following but note the uncertainty in assignment. The Hupd peak showed a close Nernstian relationship (52.0 ± 1.6 mV per pH unit), again consistent with a one proton–one electron transfer mechanism [74,75], while the best-defined reoxidation peak highlighted by the arrow in Figure 7 had a weaker pH sensitivity, being 34.7 ± 1.2 mV per pH unit. Equation (14) was again used to calculate the pH dependency to facilitate calibration-free sensing using SWV, being 61.8 ± 1.7 mV per pH unit referring to Hox. It was concluded that SWV offered no benefit over LSV, with a small loss of sensitivity and a slightly higher uncertainty and requiring more complex and costly instrumentation.

4. Conclusions

We have made and validated a bespoke pH sensor for use in seawater based on an iridium wire electrode. The pH sensitive Ir oxide electrode is formed and activated using an in situ fabrication method in synthetic seawater under neutral conditions by potential cycling. This method can facilitate, by virtue of the in situ method of formation, remote and more diverse pH measurements in contrast to formation via electrodeposition [47,85,86], sol-gel [57,58] chemistry, sputtering [59,60], or thermal methods [61,62], which often require complex conditions and processes; notably, a pre-treatment, hydroxylation [47,87,88], is required for the latter three methods. The optimised potential cycling regime creates three pH-sensitive redox couples on the electrode surface, namely Ir(III/IV), Hupd/Hox, and IrO x O I / IrO x O II H . The former two are used so as to realise a calibration-free measurement as coded in Equation (14). The combination of the measurements removes the effects of drift of the reference electrode since both couple as measured almost simultaneously relative to the same arbitrary reference electrode and the difference of the potentials leads to a calibration-free pH sensor, responding to the total pH scale [18,30], for use in seawater showing a super-Nernstian response of 70.1 ± 1.4 mV per pH unit at 25 °C over the pH range of 7.50 to 8.50 corresponding to the usual range found in seawater [8,43].

Supplementary Materials

The following supporting information can be downloaded at: https://www.mdpi.com/article/10.3390/s22093286/s1, Table S1: Performance of iridium oxide-based pH electrodes made by different methods. References [89,90] are cited in the Supplementary Materials.

Author Contributions

Methodology, Y.C.; Resources, Y.C.; Supervision, R.C.; Writing–original draft, Y.C.; Writing–review & editing, R.C. All authors have read and agreed to the published version of the manuscript.

Funding

This research received no external funding.

Institutional Review Board Statement

Not applicable.

Informed Consent Statement

Not applicable.

Data Availability Statement

The study did not report any data.

Conflicts of Interest

The authors declare no conflict of interest.

References

  1. Mills, I. Quantities, Units and Symbols in Physical Chemistry; Blackwell Science: Oxford, UK; Boston, MA, USA; CRC Press: Boca Raton, FL, USA, 1993. [Google Scholar]
  2. Buck, R.; Rondinini, S.; Covington, A.; Baucke, F.; Brett, C.M.; Camoes, M.; Milton, M.; Mussini, T.; Naumann, R.; Pratt, K. Measurement of pH. Definition, standards, and procedures (IUPAC Recommendations 2002). Pure Appl. Chem. 2002, 74, 2169–2200. [Google Scholar] [CrossRef] [Green Version]
  3. Hückel, E.; Debye, P. The theory of electrolytes: I. lowering of freezing point and related phenomena. Phys. Z 1923, 24, 1. [Google Scholar]
  4. Bates, R.G.; Vijh, A.K. Determination of pH: Theory and practice. J. Electrochem. Soc. 1973, 120, 263C. [Google Scholar] [CrossRef]
  5. Hunter, Y.R.; Kuwabara, J.S. Ionic strength and DOC determinations from various freshwater sources to the San Francisco Bay. Bull. Environ. Contam. Toxicol. 1994, 52, 311–318. [Google Scholar] [CrossRef] [PubMed]
  6. Guo, Y.; Compton, R.G. A bespoke chloride sensor for seawater: Simple and fast with a silver electrode. Talanta 2021, 232, 122502. [Google Scholar] [CrossRef] [PubMed]
  7. Zang, C.; Huang, S.; Wu, M.; Du, S.; Scholz, M.; Gao, F.; Lin, C.; Guo, Y.; Dong, Y. Comparison of Relationships Between pH, Dissolved Oxygen and Chlorophyll a for Aquaculture and Non-aquaculture Waters. Water Air Soil Pollut. 2011, 219, 157–174. [Google Scholar] [CrossRef]
  8. Scholz, M. Wetland Systems to Control Urban Runoff; Elsevier: Amsterdam, The Netherlands, 2015. [Google Scholar]
  9. U.S. Environmental Protection Agency. Available online: https://www.epa.gov/ (accessed on 6 December 2021).
  10. Bowmer, K.H.; Muirhead, W.A. Inhibition of algal photosynthesis to control pH and reduce ammonia volatilization from rice floodwater. Fertil. Res. 1987, 13, 13–29. [Google Scholar] [CrossRef]
  11. Jin, L.; Wang, Z.; Zhu, X.; Zhang, Y.; Sheng, L. Environmental Ecology; HigherEducation: Beijing, China, 1992. [Google Scholar]
  12. Fondriest Environmental Learning Centre. Algae, Phytoplankton and Chlorophyll. Available online: https://www.fondriest.com/environmental-measurements/parameters/water-quality/algae-phytoplankton-and-chlorophyll (accessed on 12 December 2021).
  13. Yang, M.; Batchelor-Mcauley, C.; Chen, L.; Guo, Y.; Zhang, Q.; Rickaby, R.E.M.; Bouman, H.A.; Compton, R.G. Fluoro-electrochemical microscopy reveals group specific differential susceptibility of phytoplankton towards oxidative damage. Chem. Sci. 2019, 10, 7988–7993. [Google Scholar] [CrossRef] [Green Version]
  14. Halevy, I.; Bachan, A. The geologic history of seawater pH. Science 2017, 355, 1069–1071. [Google Scholar] [CrossRef] [PubMed]
  15. Chuan, M.C.; Shu, G.Y.; Liu, J.C. Solubility of heavy metals in a contaminated soil: Effects of redox potential and pH. Water Air Soil Pollut. 1996, 90, 543–556. [Google Scholar] [CrossRef]
  16. Bourg, A.C.M.; Loch, J.P.G. Mobilization of Heavy Metals as Affected by pH and Redox Conditions; Springer: Berlin/Heidelberg, Germany, 1995; pp. 87–102. [Google Scholar]
  17. Sörensen, S.; Palitzsch, S. Sur le mesurage de la concentration en ions hydrogene de l’eau de mer. C. R. 1910, 9, 8. [Google Scholar]
  18. Millero, F.J.; Zhang, J.-Z.; Fiol, S.; Sotolongo, S.; Roy, R.N.; Lee, K.; Mane, S. The use of buffers to measure the pH of seawater. Mar. Chem. 1993, 44, 143–152. [Google Scholar] [CrossRef]
  19. Dickson, A. pH scales and proton-transfer reactions in saline media such as sea water. Geochim. Cosmochim. Acta 1984, 48, 2299–2308. [Google Scholar] [CrossRef]
  20. Culberson, C. Direct potentiometry. In Marine Electrochemistry; Whitfield, M., Jagner, D., Eds.; Wiley: Chichester, UK, 1981; pp. 187–261. [Google Scholar]
  21. Millero, F.J. The pH of estuarine waters. Limnol. Oceanogr. 1986, 31, 839–847. [Google Scholar] [CrossRef] [Green Version]
  22. Whitfield, M.; Butler, R.; Covington, A. The determination of ph in estuarine waters. 1. Definition of ph scales and the selection of buffers. Oceanol. Acta 1985, 8, 423–432. [Google Scholar]
  23. Ramette, R.W.; Culberson, C.H.; Bates, R.G. Acid-base properties of tris (hydroxymethyl) aminomethane (Tris) buffers in sea water from 5 to 40 degree C. Anal. Chem. 1977, 49, 867–870. [Google Scholar] [CrossRef]
  24. Bates, R.; Culberson, C. Hydrogen ions and the thermodynamic state of marine systems. In The Fate of Fossil Fuel CO2 in the Oceans; Anderson, N.R., Malahoff, A., Eds.; Plenum Press: New York, NY, USA, 1977; pp. 45–61. [Google Scholar]
  25. Khoo, K.; Ramette, R.W.; Culberson, C.H.; Bates, R.G. Determination of hydrogen ion concentrations in seawater from 5 to 40 degree C: Standard potentials at salinities from 20 to 45%. Anal. Chem. 1977, 49, 29–34. [Google Scholar] [CrossRef]
  26. Hansson, I. A new set of pH-scales and standard buffers for sea water. Deep Sea Res. Oceanogr. Abstr. 1973, 20, 479–491. [Google Scholar] [CrossRef]
  27. Dickson, A.; Riley, J. The estimation of acid dissociation constants in seawater media from potentionmetric titrations with strong base. I. The ionic product of water—Kw. Mar. Chem. 1979, 7, 89–99. [Google Scholar] [CrossRef]
  28. Dickson, A.G. Thermodynamics of the dissociation of boric acid in synthetic seawater from 273.15 to 318.15 K. Deep Sea Res. Part A Oceanogr. Res. Pap. 1990, 37, 755–766. [Google Scholar] [CrossRef]
  29. Dickson, A.; Millero, F.J. A comparison of the equilibrium constants for the dissociation of carbonic acid in seawater media. Deep Sea Res. Part A Oceanogr. Res. Pap. 1987, 34, 1733–1743. [Google Scholar] [CrossRef]
  30. Dickson, A.G. pH buffers for sea water media based on the total hydrogen ion concentration scale. Deep Sea Res. Part I Oceanogr. Res. Pap. 1993, 40, 107–118. [Google Scholar] [CrossRef]
  31. Bates, R.G.; Calais, J.G. Thermodynamics of the dissociation of Bis H+ in seawater from 5 to 40 °C. J. Solut. Chem. 1981, 10, 269–279. [Google Scholar] [CrossRef]
  32. Bates, R.G.; Erickson, W.P. Thermodynamics of the dissociation of 2-aminopyridinium ion in synthetic seawater and a standard for pH in marine systems. J. Solut. Chem. 1986, 15, 891–901. [Google Scholar] [CrossRef]
  33. Czerminski, J.B.; Dickson, A.G.; Bates, R.G. Thermodynamics of the dissociation of morpholinium ion in seawater from 5 to 40 °C. J. Solut. Chem. 1982, 11, 79–89. [Google Scholar] [CrossRef]
  34. Min, R.; Liu, Z.; Pereira, L.; Yang, C.; Sui, Q.; Marques, C. Optical fiber sensing for marine environment and marine structural health monitoring: A review. Opt. Laser Technol. 2021, 140, 107082. [Google Scholar] [CrossRef]
  35. Byrne, R.H.; Breland, J.A. High precision multiwavelength pH determinations in seawater using cresol red. Deep Sea Res. Part A Oceanogr. Res. Pap. 1989, 36, 803–810. [Google Scholar] [CrossRef]
  36. Clayton, T.D.; Byrne, R.H. Spectrophotometric seawater pH measurements: Total hydrogen ion concentration scale calibration of m-cresol purple and at-sea results. Deep Sea Res. Part I Oceanogr. Res. Pap. 1993, 40, 2115–2129. [Google Scholar] [CrossRef]
  37. Hudson-Heck, E.; Byrne, R.H. Purification and characterization of thymol blue for spectrophotometric pH measurements in rivers, estuaries, and oceans. Anal. Chim. Acta 2019, 1090, 91–99. [Google Scholar] [CrossRef] [PubMed]
  38. Byrne, R.; Robert-Baldo, G.; Thompson, S.; Chen, C. Seawater pH measurements: An at-sea comparison of spectrophotometric and potentiometric methods. Deep Sea Res. Part A Oceanogr. Res. Pap. 1988, 35, 1405–1410. [Google Scholar] [CrossRef]
  39. King, D.W.; Kester, D.R. Determination of seawater pH from 1.5 to 8.5 using colorimetric indicators. Mar. Chem. 1989, 26, 5–20. [Google Scholar] [CrossRef]
  40. Breland, J.; Byrne, R. Spectrophotometric determination of the total alkalinity of sea water using bromocresol green. Deep-Sea Res. 1993, 40, 629–641. [Google Scholar] [CrossRef]
  41. Byrne, R.H. Standardization of standard buffers by visible spectrometry. Anal. Chem. 1987, 59, 1479–1481. [Google Scholar] [CrossRef]
  42. Takahashi, T.; Broecker, W.S.; Bainbridge, A.E.; Weiss, R.F. Carbonate chemistry of the Atlantic, Pacific and Indian Oceans: The Results of the Geosecs Expeditions, 1972–1978; Lamont-Doherty Geological Observatory: Palisades, NY, USA, 1980. [Google Scholar]
  43. Dickson, A.G. The measurement of sea water pH. Mar. Chem. 1993, 44, 131–142. [Google Scholar] [CrossRef]
  44. Cuartero, M.; Pankratova, N.; Cherubini, T.; Crespo, G.A.; Massa, F.; Confalonieri, F.; Bakker, E. In Situ Detection of Species Relevant to the Carbon Cycle in Seawater with Submersible Potentiometric Probes. Environ. Sci. Technol. Lett. 2017, 4, 410–415. [Google Scholar] [CrossRef]
  45. Compton, R.G.; Batchelor-Mcauley, C.; Chaisiwamongkhol, K.; Vatish, M.; Kennedy, S. Method for Determining Human Blood pH. Patent Number WO/2020/217056, 29 October 2020. [Google Scholar]
  46. Chaisiwamongkhol, K.; Batchelor-Mcauley, C.; Compton, R.G. Amperometric micro pH measurements in oxygenated saliva. Analyst 2017, 142, 2828–2835. [Google Scholar] [CrossRef]
  47. Chaisiwamongkhol, K.; Batchelor-Mcauley, C.; Compton, R.G. Optimising amperometric pH sensing in blood samples: An iridium oxide electrode for blood pH sensing. Analyst 2019, 144, 1386–1393. [Google Scholar] [CrossRef] [PubMed]
  48. Chen, Y.; Li, X.; Li, D.; Batchelor-McAuley, C.; Compton, R.G. A simplified methodology: pH sensing using an in situ fabricated Ir electrode under neutral conditions. J. Solid State Electrochem. 2021, 25, 2821–2833. [Google Scholar] [CrossRef]
  49. Lawrence, N.S.; Pagels, M.; Hackett, S.F.; McCormack, S.; Meredith, A.; Jones, T.G.; Wildgoose, G.G.; Compton, R.G.; Jiang, L. Triple component carbon epoxy pH probe. Electroanal. Int. J. Devoted Fundam. Pract. Asp. Electroanal. 2007, 19, 424–428. [Google Scholar] [CrossRef]
  50. Streeter, I.; Leventis, H.C.; Wildgoose, G.G.; Pandurangappa, M.; Lawrence, N.S.; Jiang, L.; Jones, T.G.; Compton, R.G. A sensitive reagentless pH probe with a ca. 120 mV/pH unit response. J. Solid State Electrochem. 2004, 8, 718–721. [Google Scholar] [CrossRef]
  51. Wildgoose, G.G.; Pandurangappa, M.; Lawrence, N.S.; Jiang, L.; Jones, T.G.J.; Compton, R.G. Anthraquinone-derivatised carbon powder: Reagentless voltammetric pH electrodes. Talanta 2003, 60, 887–893. [Google Scholar] [CrossRef]
  52. Leventis, H.C.; Streeter, I.; Wildgoose, G.G.; Lawrence, N.S.; Jiang, L.; Jones, T.G.J.; Compton, R.G. Derivatised carbon powder electrodes: Reagentless pH sensors. Talanta 2004, 63, 1039–1051. [Google Scholar] [CrossRef] [PubMed]
  53. Wildgoose, G.G.; Leventis, H.C.; Streeter, I.; Lawrence, N.S.; Wilkins, S.J.; Jiang, L.; Jones, T.G.; Compton, R.G. Abrasively immobilised multiwalled carbon nanotube agglomerates: A novel electrode material approach for the analytical sensing of pH. ChemPhysChem 2004, 5, 669–677. [Google Scholar] [CrossRef] [PubMed]
  54. Phair, J.; Newton, L.; McCormac, C.; Cardosi, M.F.; Leslie, R.; Davis, J. A disposable sensor for point of care wound pH monitoring. Analyst 2011, 136, 4692. [Google Scholar] [CrossRef] [PubMed]
  55. Dai, C.; Chan, C.-W.I.; Barrow, W.; Smith, A.; Song, P.; Potier, F.; Wadhawan, J.D.; Fisher, A.C.; Lawrence, N.S. A Route to Unbuffered pH Monitoring: A Novel Electrochemical Approach. Electrochim. Acta 2016, 190, 879–886. [Google Scholar] [CrossRef]
  56. Sisodia, N.; Miranda, M.; McGuinness, K.L.; Wadhawan, J.D.; Lawrence, N.S. Intra- and Inter-molecular Sulf- hydryl Hydrogen Bonding: Facilitating Proton Transfer Events for Determination of pH in Sea Water. Electroanalysis 2020, 33, 559–562. [Google Scholar] [CrossRef]
  57. Nguyen, C.; Rao, S.; Yang, X.; Dubey, S.; Mays, J.; Cao, H.; Chiao, J.-C. Sol-Gel Deposition of Iridium Oxide for Biomedical Micro-Devices. Sensors 2015, 15, 4212–4228. [Google Scholar] [CrossRef] [PubMed] [Green Version]
  58. Huang, W.-D.; Cao, H.; Deb, S.; Chiao, M.; Chiao, J.C. A flexible pH sensor based on the iridium oxide sensing film. Sens. Actuators A Phys. 2011, 169, 1–11. [Google Scholar] [CrossRef]
  59. Kuo, L.-M.; Chou, Y.-C.; Chen, K.-N.; Lu, C.-C.; Chao, S. A precise pH microsensor using RF-sputtering IrO2 and Ta2O5 films on Pt-electrode. Sens. Actuators B Chem. 2014, 193, 687–691. [Google Scholar] [CrossRef]
  60. Kreider, K.G.; Tarlov, M.J.; Cline, J.P. Sputtered thin-film pH electrodes of platinum, palladium, ruthenium, and iridium oxides. Sens. Actuators B Chem. 1995, 28, 167–172. [Google Scholar] [CrossRef]
  61. Ardizzone, S.; Carugati, A.; Trasatti, S. Properties of thermally prepared iridium dioxide electrodes. J. Electroanal. Chem. Interfacial Electrochem. 1981, 126, 287–292. [Google Scholar] [CrossRef]
  62. Hitchman, M.L.; Ramanathan, S. A field-induced poising technique for promoting convergence of standard electrode potential values of thermally oxidized iridium pH sensors. Talanta 1992, 39, 137–144. [Google Scholar] [CrossRef]
  63. Kinoshita, E.; Ingman, F.; Edwall, G.; Thulin, S.; Gła̧b, S. Polycrystalline and monocrystalline antimony, iridium and palladium as electrode material for pH-sensing electrodes. Talanta 1986, 33, 125–134. [Google Scholar] [CrossRef]
  64. Hitchman, M.L.; Ramanathan, S. Evaluation of iridium oxide electrodes formed by potential cycling as pH probes. Analyst 1988, 113, 35–39. [Google Scholar] [CrossRef] [PubMed]
  65. Olthuis, W.; Robben, M.A.M.; Bergveld, P.; Bos, M.; Van Der Linden, W.E. pH sensor properties of electrochemically grown iridium oxide. Sens. Actuators B Chem. 1990, 2, 247–256. [Google Scholar] [CrossRef] [Green Version]
  66. Compton, R.G.; Banks, C.E. Understanding Voltammetry; World Scientific: Singapore, 2018. [Google Scholar]
  67. Xiong, L.; Batchelor-McAuley, C.; Compton, R.G. Calibrationless pH sensors based on nitrosophenyl and ferrocenyl co-modified screen printed electrodes. Sens. Actuators B Chem. 2011, 159, 251–255. [Google Scholar] [CrossRef]
  68. Jiang, L.I.; Jones Timothy Gareth, J.; Compton, R.; Lawrence, N.; Wildgoose Gregory, G.; Pandurangappa, M.; Mullins Oliver, C.; Meredith, A. Electro-Chemical pH Sensor. European Patent EP 1702208 B1, 22 December 2004. [Google Scholar]
  69. Pickup, P.G.; Birss, V.I. The electrochemistry of iridium oxide films in some nonaqueous solvents. J. Electrochem. Soc. 1988, 135, 41. [Google Scholar] [CrossRef]
  70. Pfeifer, V.; Jones, T.E.; Velasco Velez, J.J.; Arrigo, R.; Piccinin, S.; Havecker, M.; Knop-Gericke, A.; Schlogl, R. In situ observation of reactive oxygen species forming on oxygen-evolving iridium surfaces. Chem. Sci. 2017, 8, 2143–2149. [Google Scholar] [CrossRef] [Green Version]
  71. Pfeifer, V.; Jones, T.E.; Velasco Velez, J.J.; Massue, C.; Greiner, M.T.; Arrigo, R.; Teschner, D.; Girgsdies, F.; Scherzer, M.; Allan, J.; et al. The electronic structure of iridium oxide electrodes active in water splitting. Phys. Chem. Chem. Phys. 2016, 18, 2292–2296. [Google Scholar] [CrossRef] [PubMed] [Green Version]
  72. Dubouis, N.; Grimaud, A. The hydrogen evolution reaction: From material to interfacial descriptors. Chem. Sci. 2019, 10, 9165–9181. [Google Scholar] [CrossRef] [PubMed] [Green Version]
  73. Jerkiewicz, G. Electrochemical Hydrogen Adsorption and Absorption. Part 1: Under-potential Deposition of Hydrogen. Electrocatalysis 2010, 1, 179–199. [Google Scholar] [CrossRef]
  74. Yang, X.; Nash, J.; Oliveira, N.; Yan, Y.; Xu, B. Understanding the pH Dependence of Underpotential Deposited Hydrogen on Platinum. Angew. Chem. 2019, 131, 17882–17887. [Google Scholar] [CrossRef]
  75. Zheng, J.; Sheng, W.; Zhuang, Z.; Xu, B.; Yan, Y. Universal dependence of hydrogen oxidation and evolution reaction activity of platinum-group metals on pH and hydrogen binding energy. Sci. Adv. 2016, 2, e1501602. [Google Scholar] [CrossRef] [PubMed] [Green Version]
  76. Pfeifer, V.; Jones, T.E.; Velasco Vélez, J.J.; Massué, C.; Arrigo, R.; Teschner, D.; Girgsdies, F.; Scherzer, M.; Greiner, M.T.; Allan, J.; et al. The electronic structure of iridium and its oxides. Surf. Interface Anal. 2016, 48, 261–273. [Google Scholar] [CrossRef] [Green Version]
  77. Burke, L.D.; Lyons, M.E.; O’Sullivan, E.J.M.; Whelan, D.P. Influence of hydrolysis on the redox behaviour of hydrous oxide films. J. Electroanal. Chem. Interfacial Electrochem. 1981, 122, 403–407. [Google Scholar] [CrossRef]
  78. Carroll, S.; Baldwin, R.P. Self-calibrating microfabricated iridium oxide pH electrode array for remote monitoring. Anal. Chem. 2010, 82, 878–885. [Google Scholar] [CrossRef]
  79. Burke, L.D.; Mulcahy, J.K.; Whelan, D.P. Preparation of an oxidized iridium electrode and the variation of its potential with pH. J. Electroanal. Chem. Interfacial Electrochem. 1984, 163, 117–128. [Google Scholar] [CrossRef]
  80. Pickup, P.G.; Birss, V.I. A model for anodic hydrous oxide growth at iridium. J. Electroanal. Chem. Interfacial Electrochem. 1987, 220, 83–100. [Google Scholar] [CrossRef] [Green Version]
  81. Kasian, O.; Grote, J.-P.; Geiger, S.; Cherevko, S.; Mayrhofer, K.J.J. The Common Intermediates of Oxygen Evolution and Dissolution Reactions during Water Electrolysis on Iridium. Angew. Chem. Int. Ed. 2018, 57, 2488–2491. [Google Scholar] [CrossRef] [PubMed]
  82. Angerstein-Kozlowska, H.; Conway, B.E.; Sharp, W.B.A. The real condition of electrochemically oxidized platinum surfaces: Part I. Resolution of component processes. J. Electroanal. Chem. Interfacial Electrochem. 1973, 43, 9–36. [Google Scholar] [CrossRef]
  83. Kluge, R.M.; Haid, R.W.; Bandarenka, A.S. Assessment of active areas for the oxygen evolution reaction on an amorphous iridium oxide surface. J. Catal. 2021, 396, 14–22. [Google Scholar] [CrossRef]
  84. Sanchez Casalongue, H.G.; Ng, M.L.; Kaya, S.; Friebel, D.; Ogasawara, H.; Nilsson, A. In Situ Observation of Surface Species on Iridium Oxide Nanoparticles during the Oxygen Evolution Reaction. Angew. Chem. 2014, 126, 7297–7300. [Google Scholar] [CrossRef] [Green Version]
  85. Baur, J.E.; Spaine, T.W. Electrochemical deposition of iridium (IV) oxide from alkaline solutions of iridium (III) oxide. J. Electroanal. Chem. 1998, 443, 208–216. [Google Scholar] [CrossRef]
  86. Salimi, A.; Hyde, M.E.; Banks, C.E.; Compton, R.G. Boron doped diamond electrode modified with iridium oxide for amperometic detection of ultra trace amounts of arsenic (III). Analyst 2004, 129, 9–14. [Google Scholar] [CrossRef]
  87. Tarlov, M.J.; Semancik, S.; Kreider, K.G. Mechanistic and response studies of iridium oxide pH sensors. Sens. Actuators B Chem. 1990, 1, 293–297. [Google Scholar] [CrossRef]
  88. Wang, M.; Yao, S.; Madou, M. A long-term stable iridium oxide pH electrode. Sens. Actuators B Chem. 2002, 81, 313–315. [Google Scholar] [CrossRef]
  89. Głab, S.; Hulanicki, A.; Edwall, G.; Ingman, F. Metal-Metal Oxide and Metal Oxide Electrodes as pH Sensors. Crit. Rev. Anal. Chem. 1989, 21, 29–47. [Google Scholar] [CrossRef]
  90. Yao, S.; Wang, M.; Madou, M. A pH electrode based on melt-oxidized iridium oxide. J. Electrochem. Soc. 2001, 148, H29. [Google Scholar] [CrossRef]
Figure 1. A schematic diagram to contrast potentiometric and amperometric measurements (see text).
Sensors 22 03286 g001
Figure 2. (a) Cyclic voltammograms showing the activation of an Ir wire at a scan rate of 0.5 Vs−1 for multiple cycles. The start potential was −0.2 V vs. SCE in air-saturated synthetic seawater with pH = 8.1. (b) Overlaid 40th cyclic voltammograms in synthetic seawater with pH = 8.1 using an Ir wire at a scan rate of 0.5 Vs−1; degassed: black line, without degassing: red line.
Sensors 22 03286 g002
Figure 3. Cyclic voltammograms of the 40th cycle SCE in air-saturated synthetic seawater with pH = 8.14 starting at a potential of −0.2 V for activation of an Ir wire with different (a) cathodic and (b) anodic potentials at a scan rate of 0.5 Vs−1.
Sensors 22 03286 g003
Figure 4. Linear sweep voltammograms with a scan rate of 0.5 Vs−1 using an activated iridium wire electrode with varying pH of different buffers ranging from 7.50 to 8.50 (a) reduction and (b) oxidation.
Sensors 22 03286 g004
Figure 5. Plots of oxidation (black dots), reduction (red dots) peak, and midpoint (blue dots) potentials against pH value with the latter read from a pH meter (defined using total hydrogen ion scale) (a) IrIII/IV (b) Hupd/ox, and (c) IrIII/IV midpoints pH dependency referring to either Hupd or Hox; x-axis error-bar is the uncertainty of pH measured by a pH meter.
Sensors 22 03286 g005
Figure 6. Square wave voltammograms (frequency 90 Hz, step potential 1 mV, and amplitude 60 mV) response using an activated iridium wire electrode in synthetic seawater with varying pHs ranging from 7.50 to 8.50 (a) reduction and (b) oxidation.
Sensors 22 03286 g006
Figure 7. Plots of oxidation (black dots), reduction (red dots) peak, and midpoint (blue dots) potentials against pH value with the latter read from a pH meter (defined using total hydrogen ion scale) (a) IrIII/IV (b)   IrO x O I / IrO x O II H (c) Hupd/Hox and (d) IrIII/IV midpoints pH dependency referring to Hox; x-axis error-bar is the uncertainty of pH measured by a pH meter.
Sensors 22 03286 g007
Table 1. Chemical composition of synthetic seawater.
ConstituentMolesWeight/g in 0.5 LFinal pH
Synthetic SeawaterNaCl0.38811.32N/A
KCl0.0110.39
MgCl20.0552.61
CaCl20.0110.60
Na2SO40.0292.08
HCl0.041.73 (mL in vol.)
One of2-Aminopyrine0.083.766.77
Tris0.084.848.07
Bis0.084.208.81
Publisher’s Note: MDPI stays neutral with regard to jurisdictional claims in published maps and institutional affiliations.

