
Toward Accurate Indoor Positioning: An RSS-Based Fusion of UWB and Machine-Learning-Enhanced WiFi †


Abstract
:1. Introduction
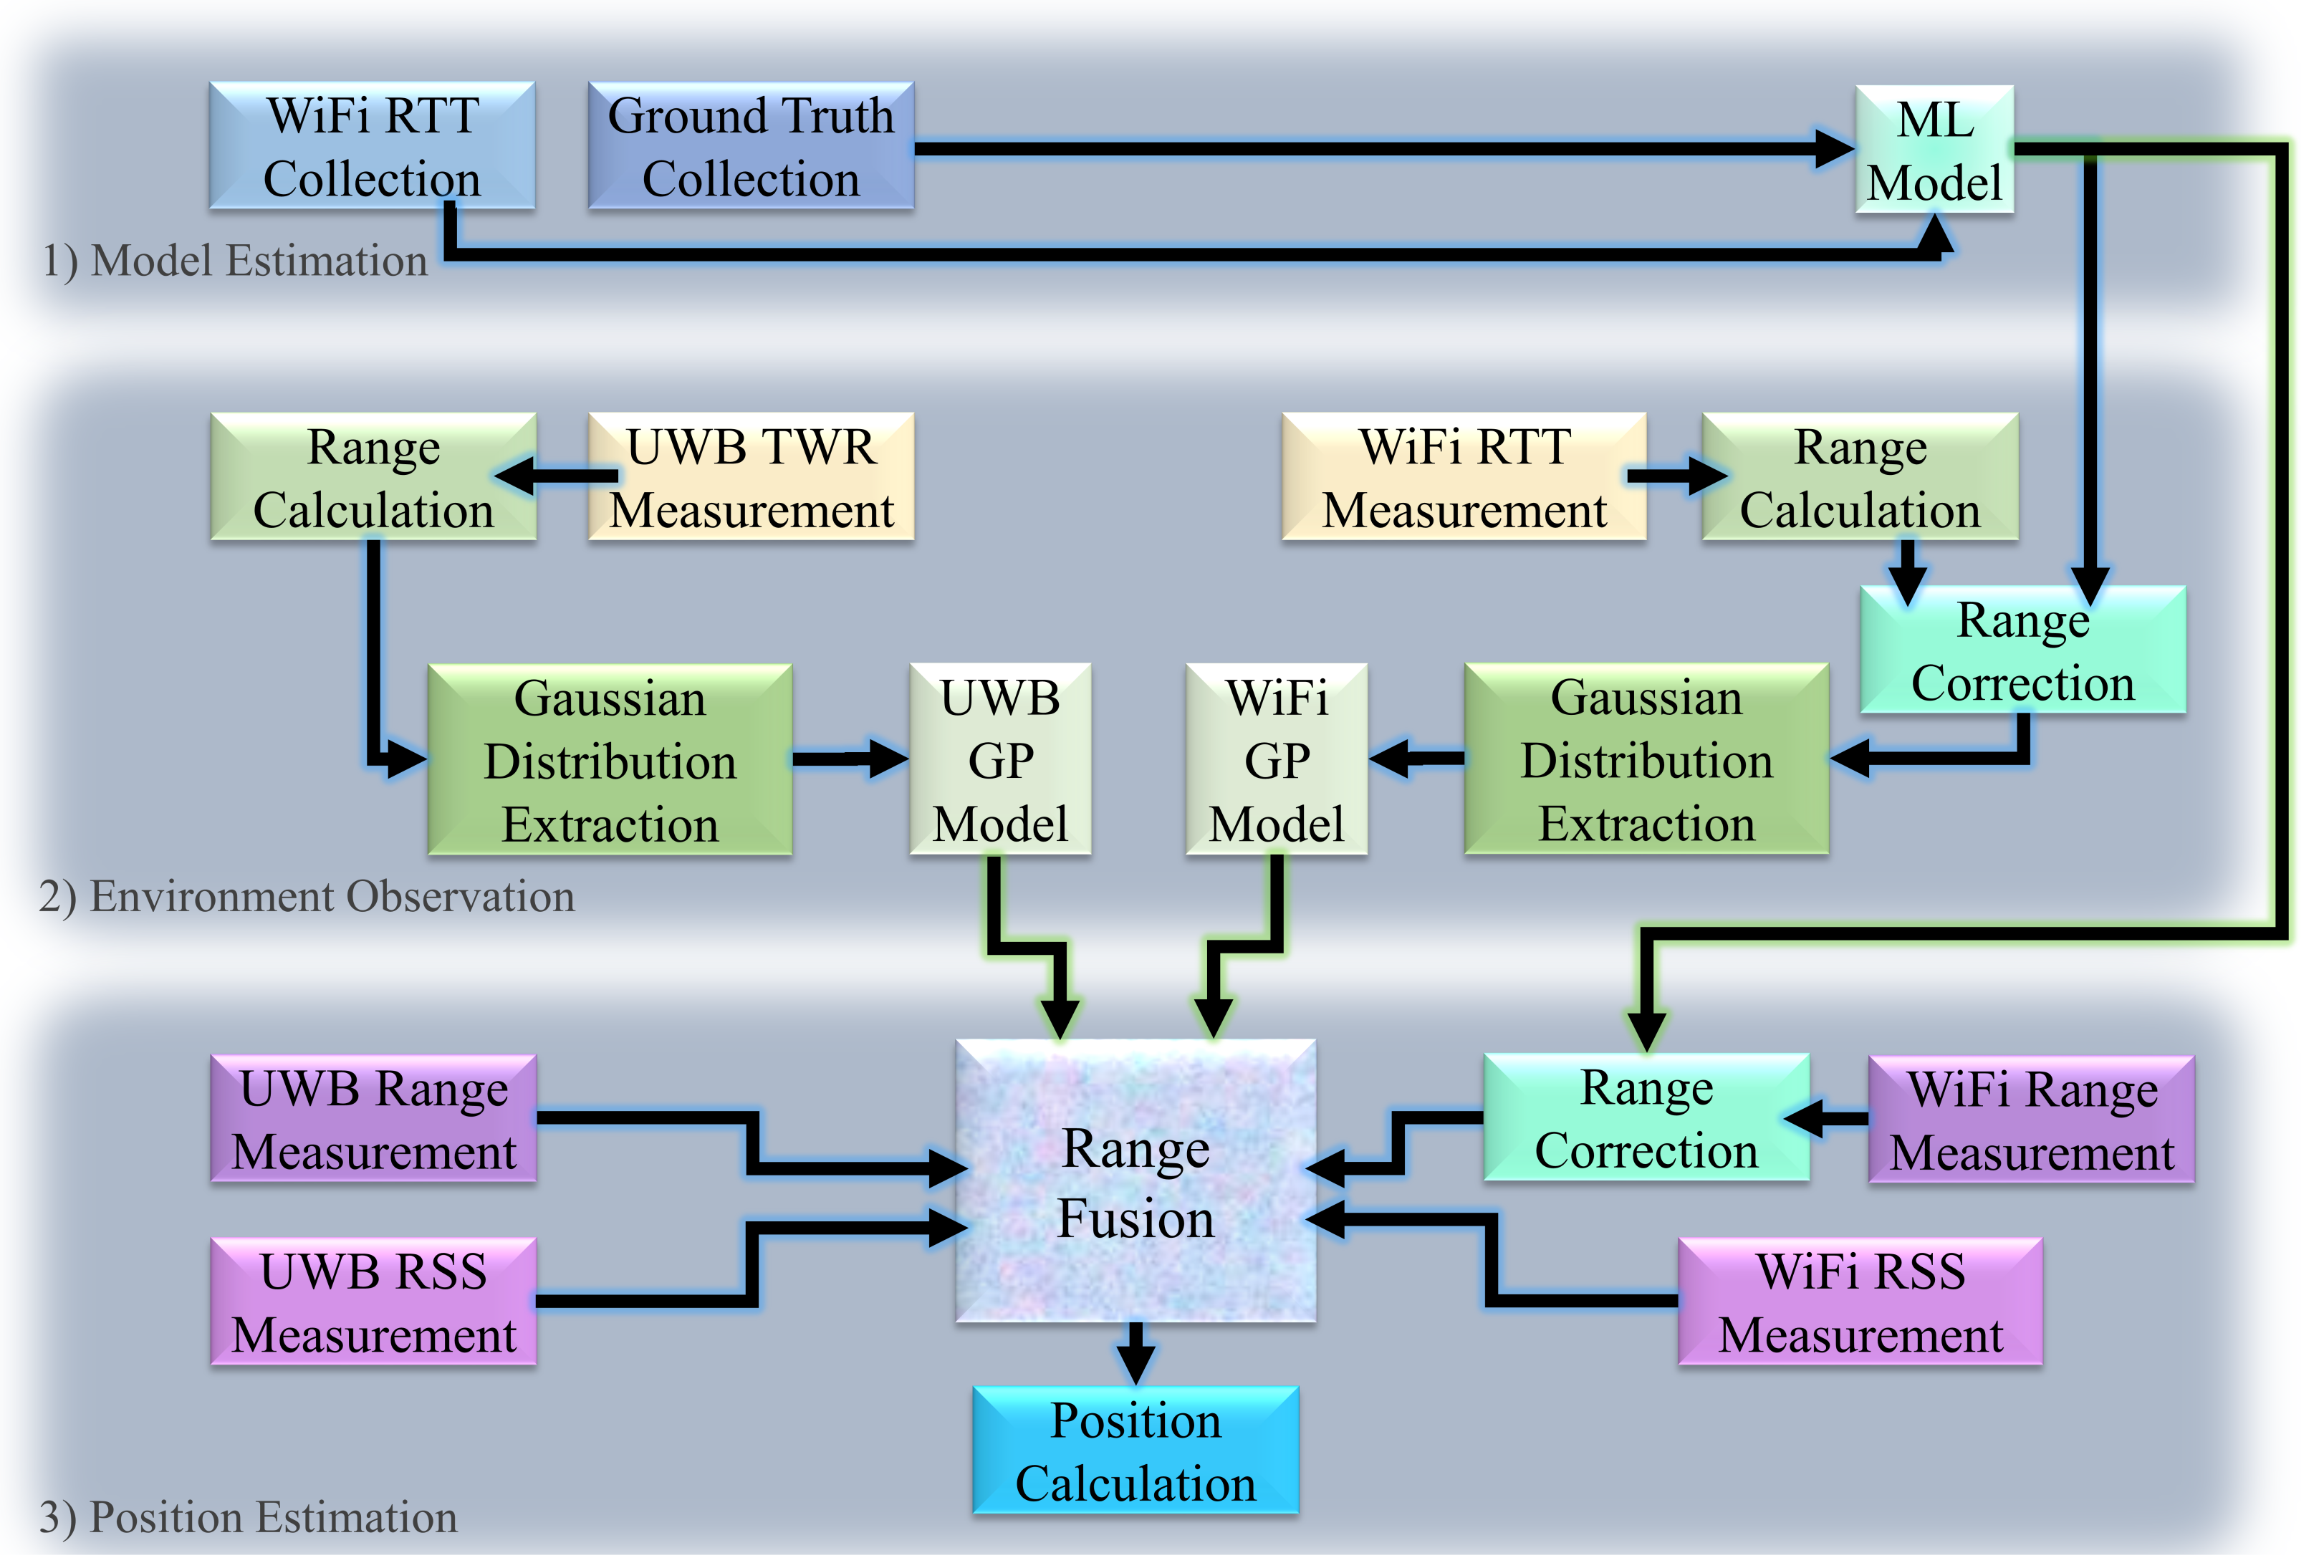
- We propose a method with three phases to enhance WiFi-based range measurements, to extract a model for environment observation, and to improve position estimation by way of sensor fusion.
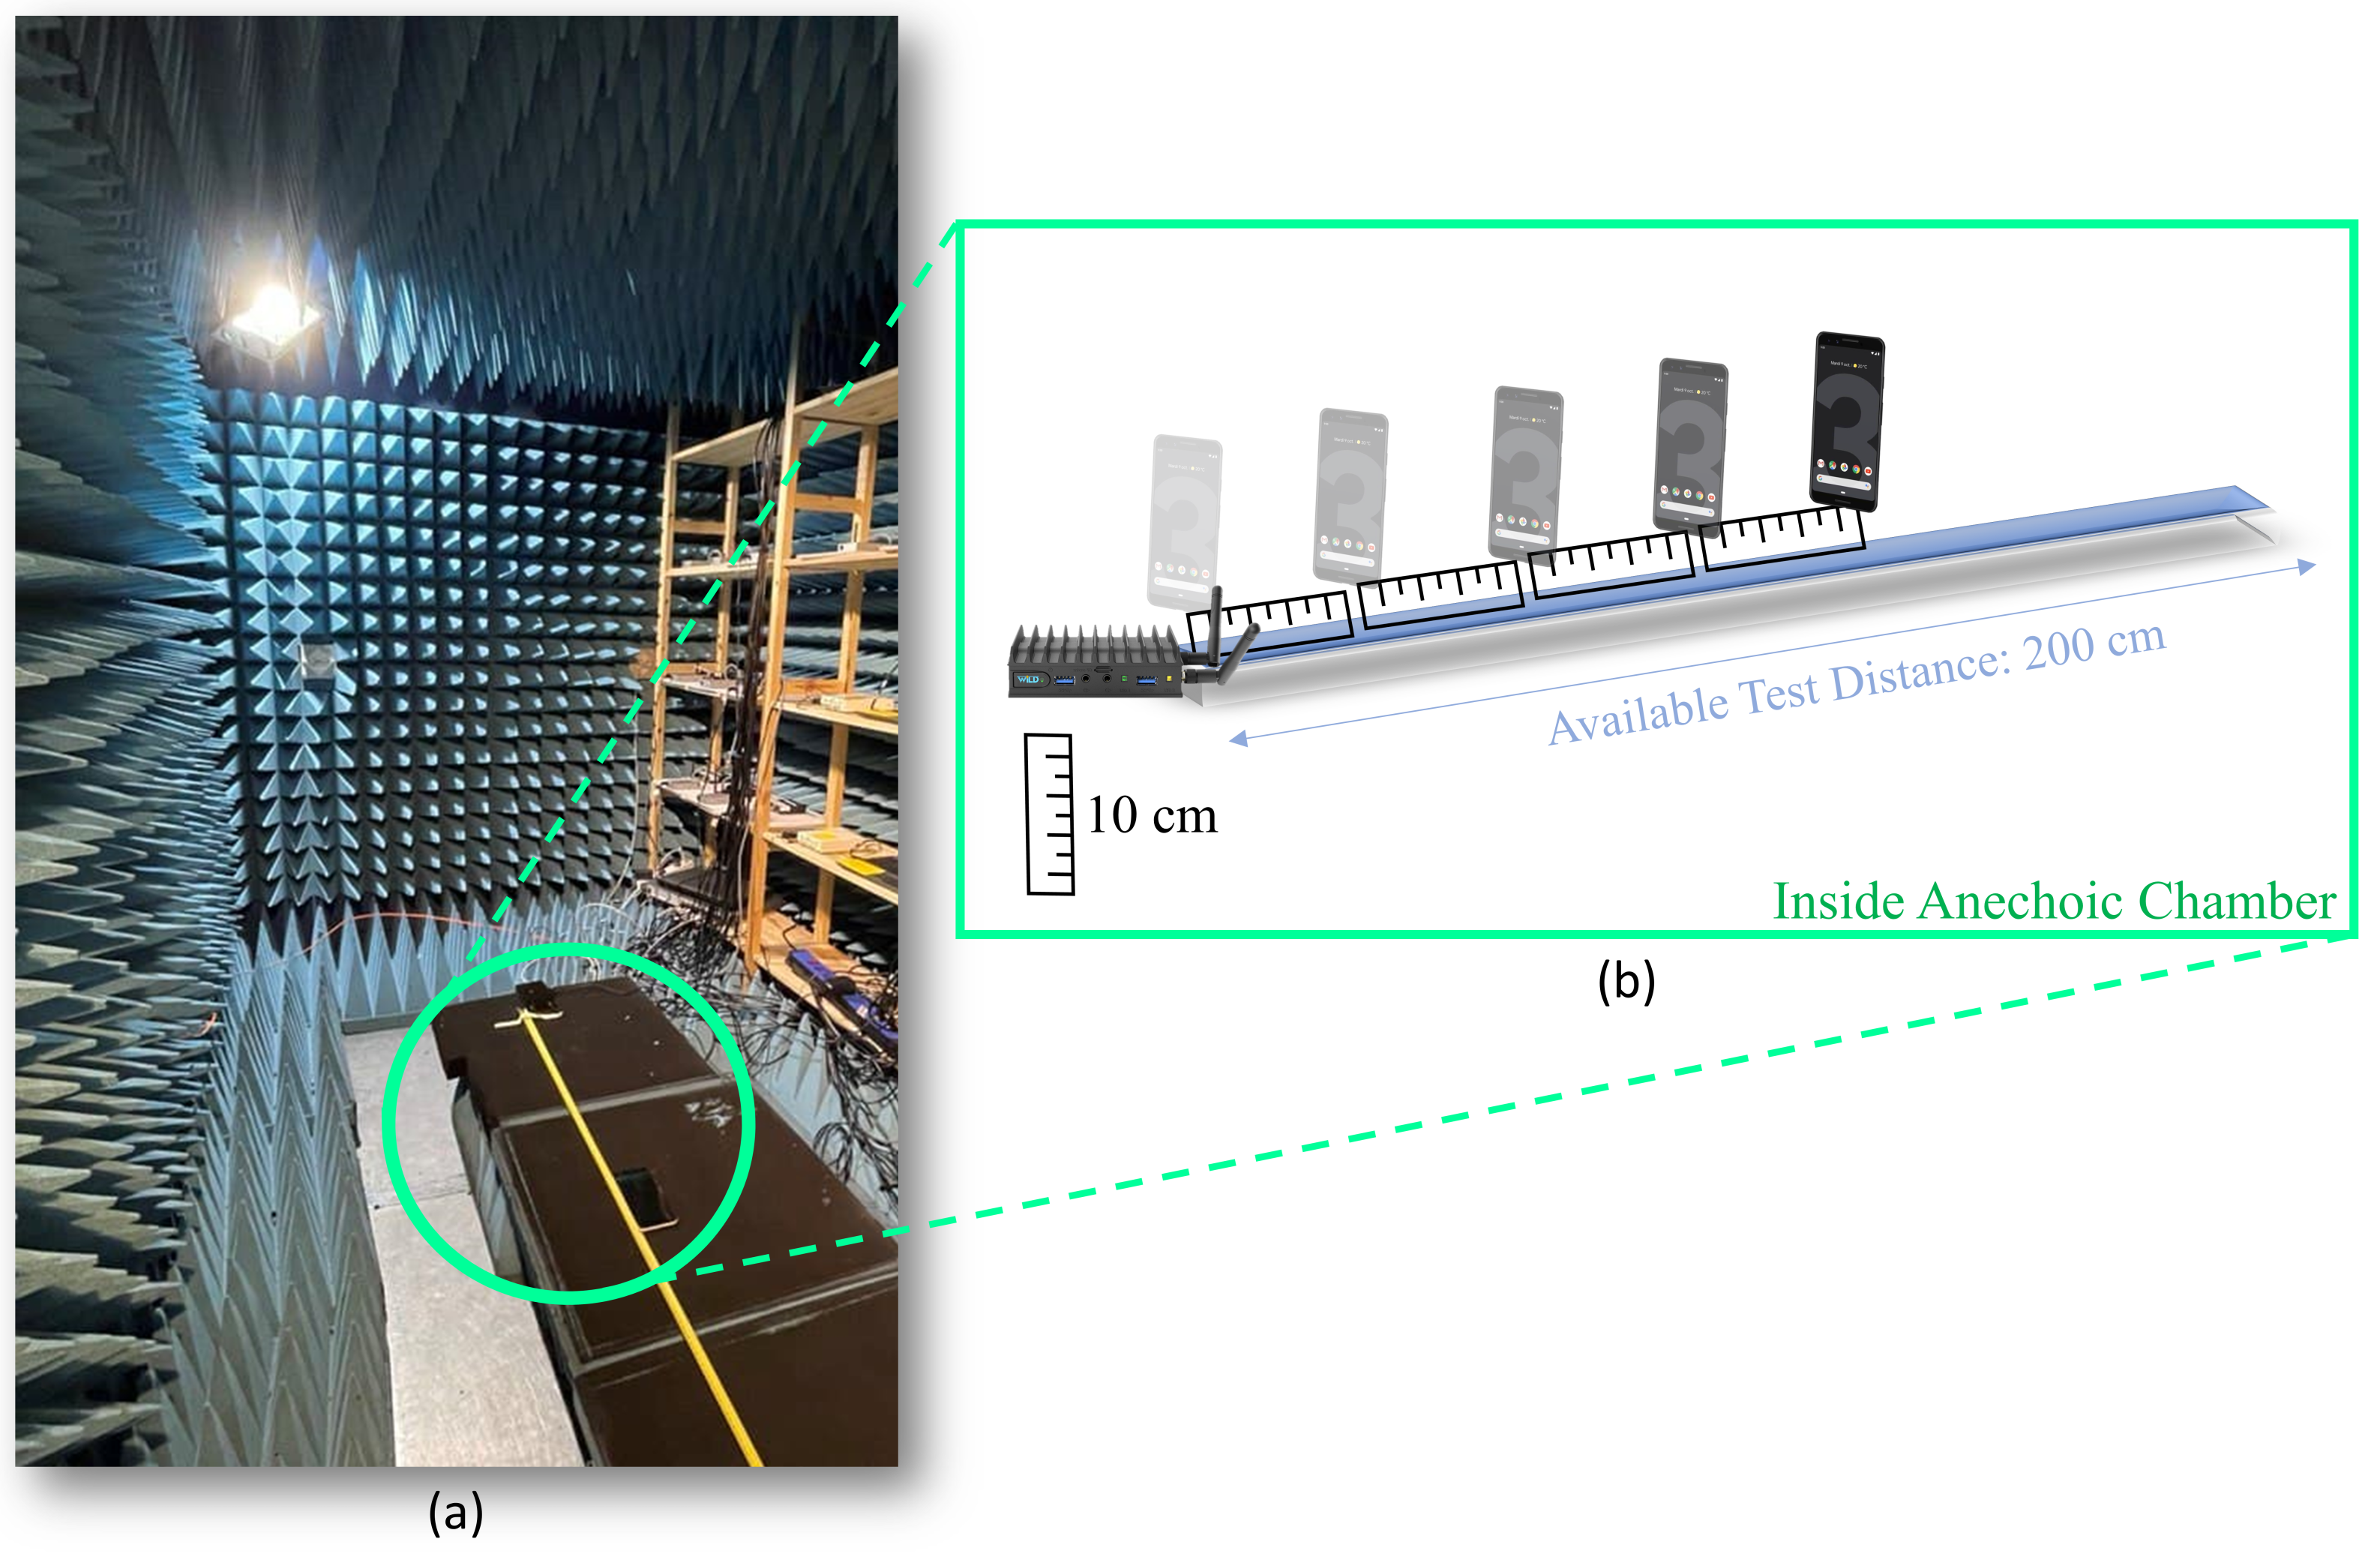
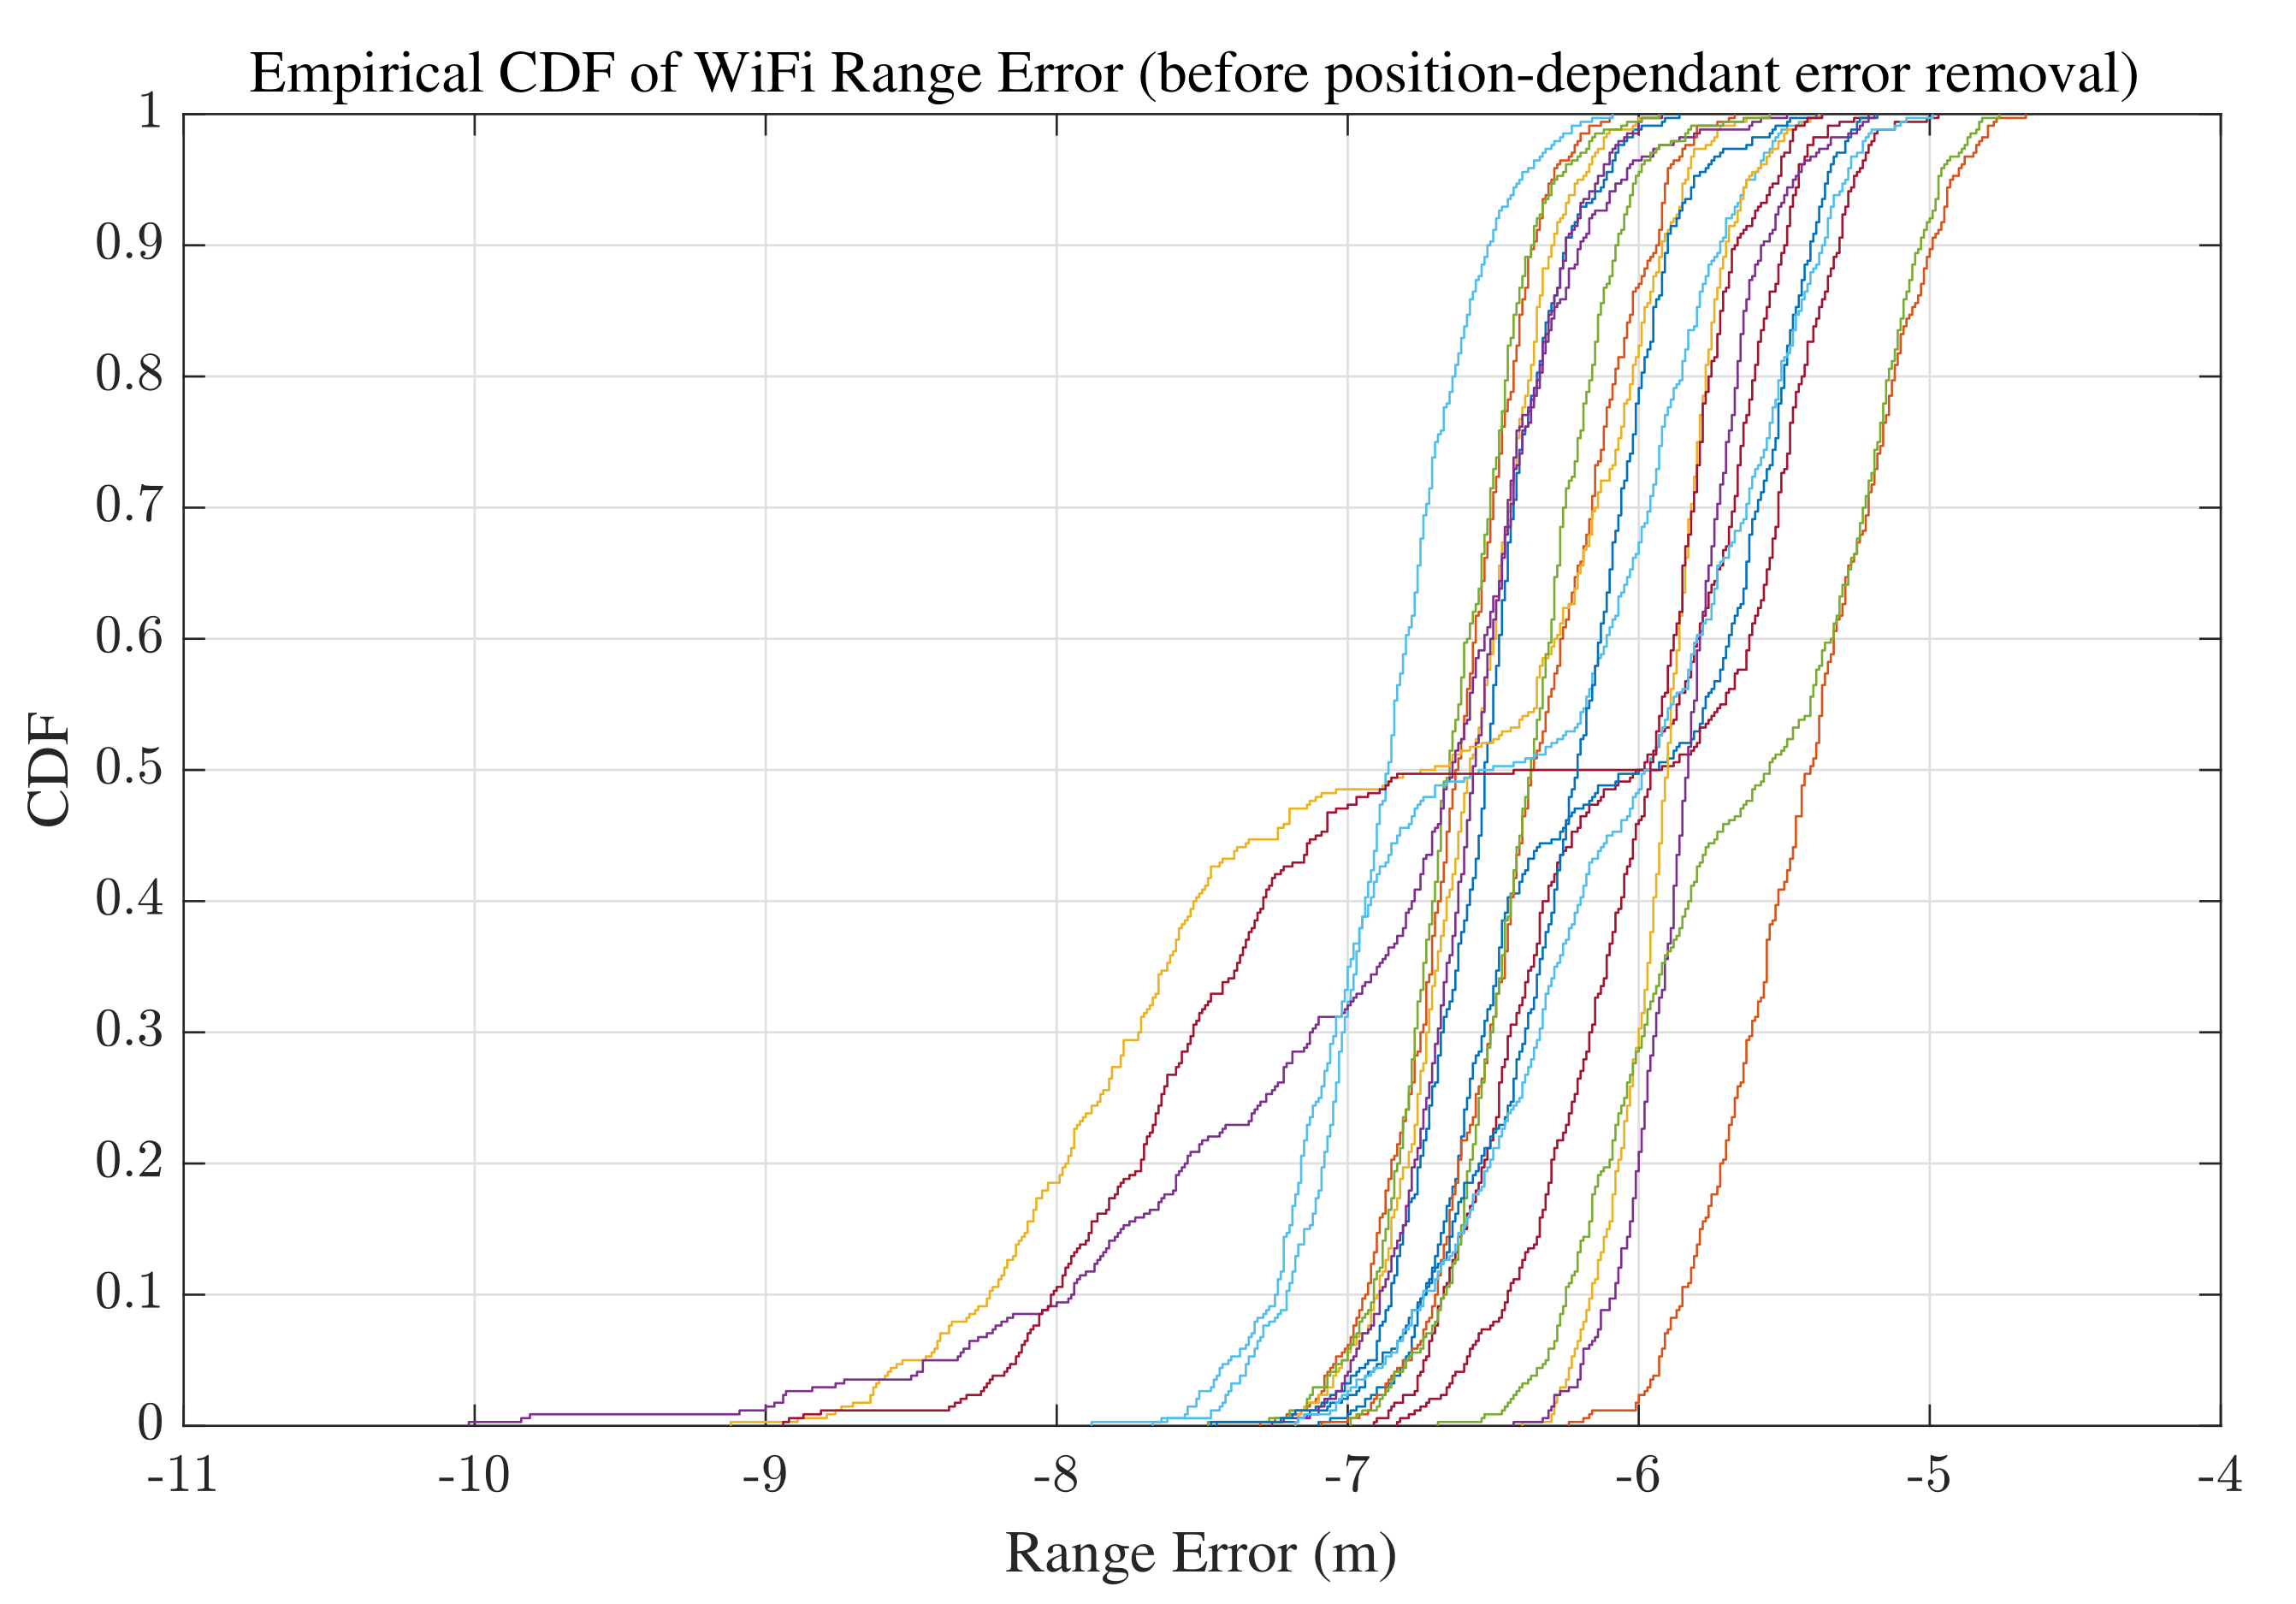
- We investigate the behavior of WiFi devices by analyzing range measurements using data analysis methods. We analyze data collected in an environment with nearly zero multi-path effect (an anechoic chamber), as well as in a real indoor environment with a significant multi-path effect.
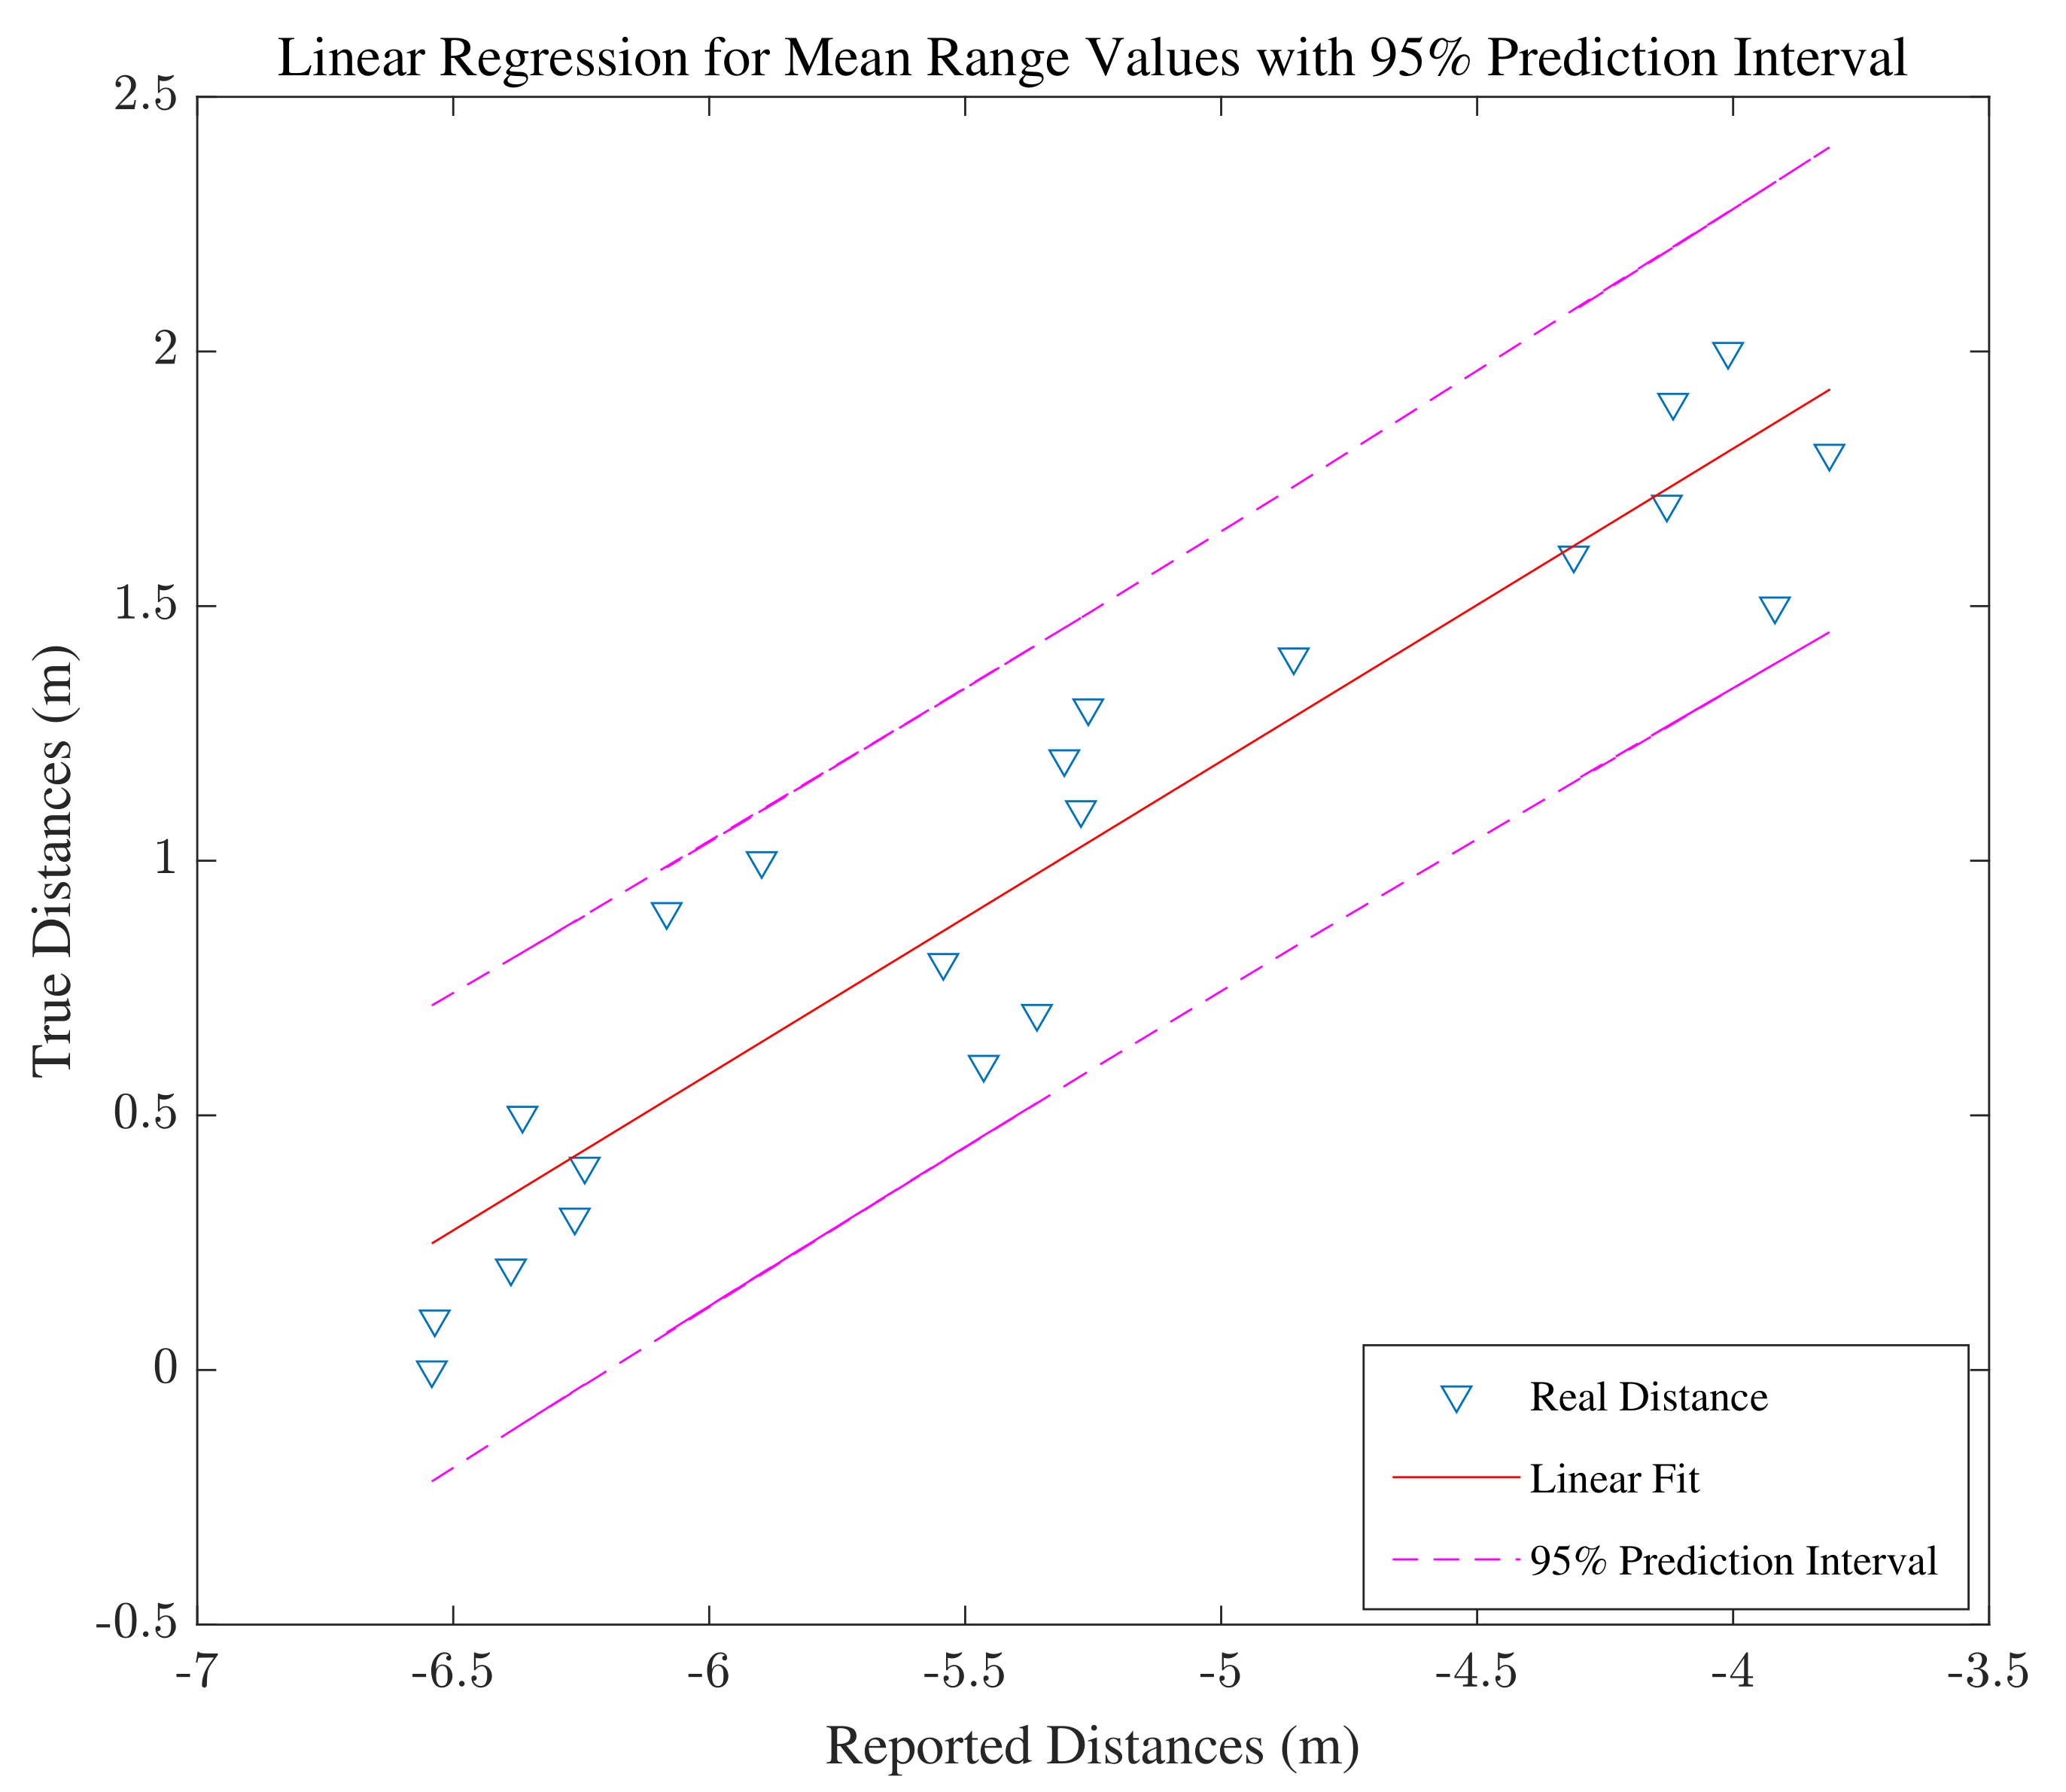
- We estimate different ML models to solve the WiFi position-dependent problem that we earlier observed. We take advantage of a supervised learning method to correct the range measurements.
- After correction of WiFi-based range measurements, we utilize a Gaussian Process (GP) as a generic supervised learning method to model the environment. For the implementation of the GP, we utilize random variables for range measurements indexed by time to extract the required variables for sensor fusion.
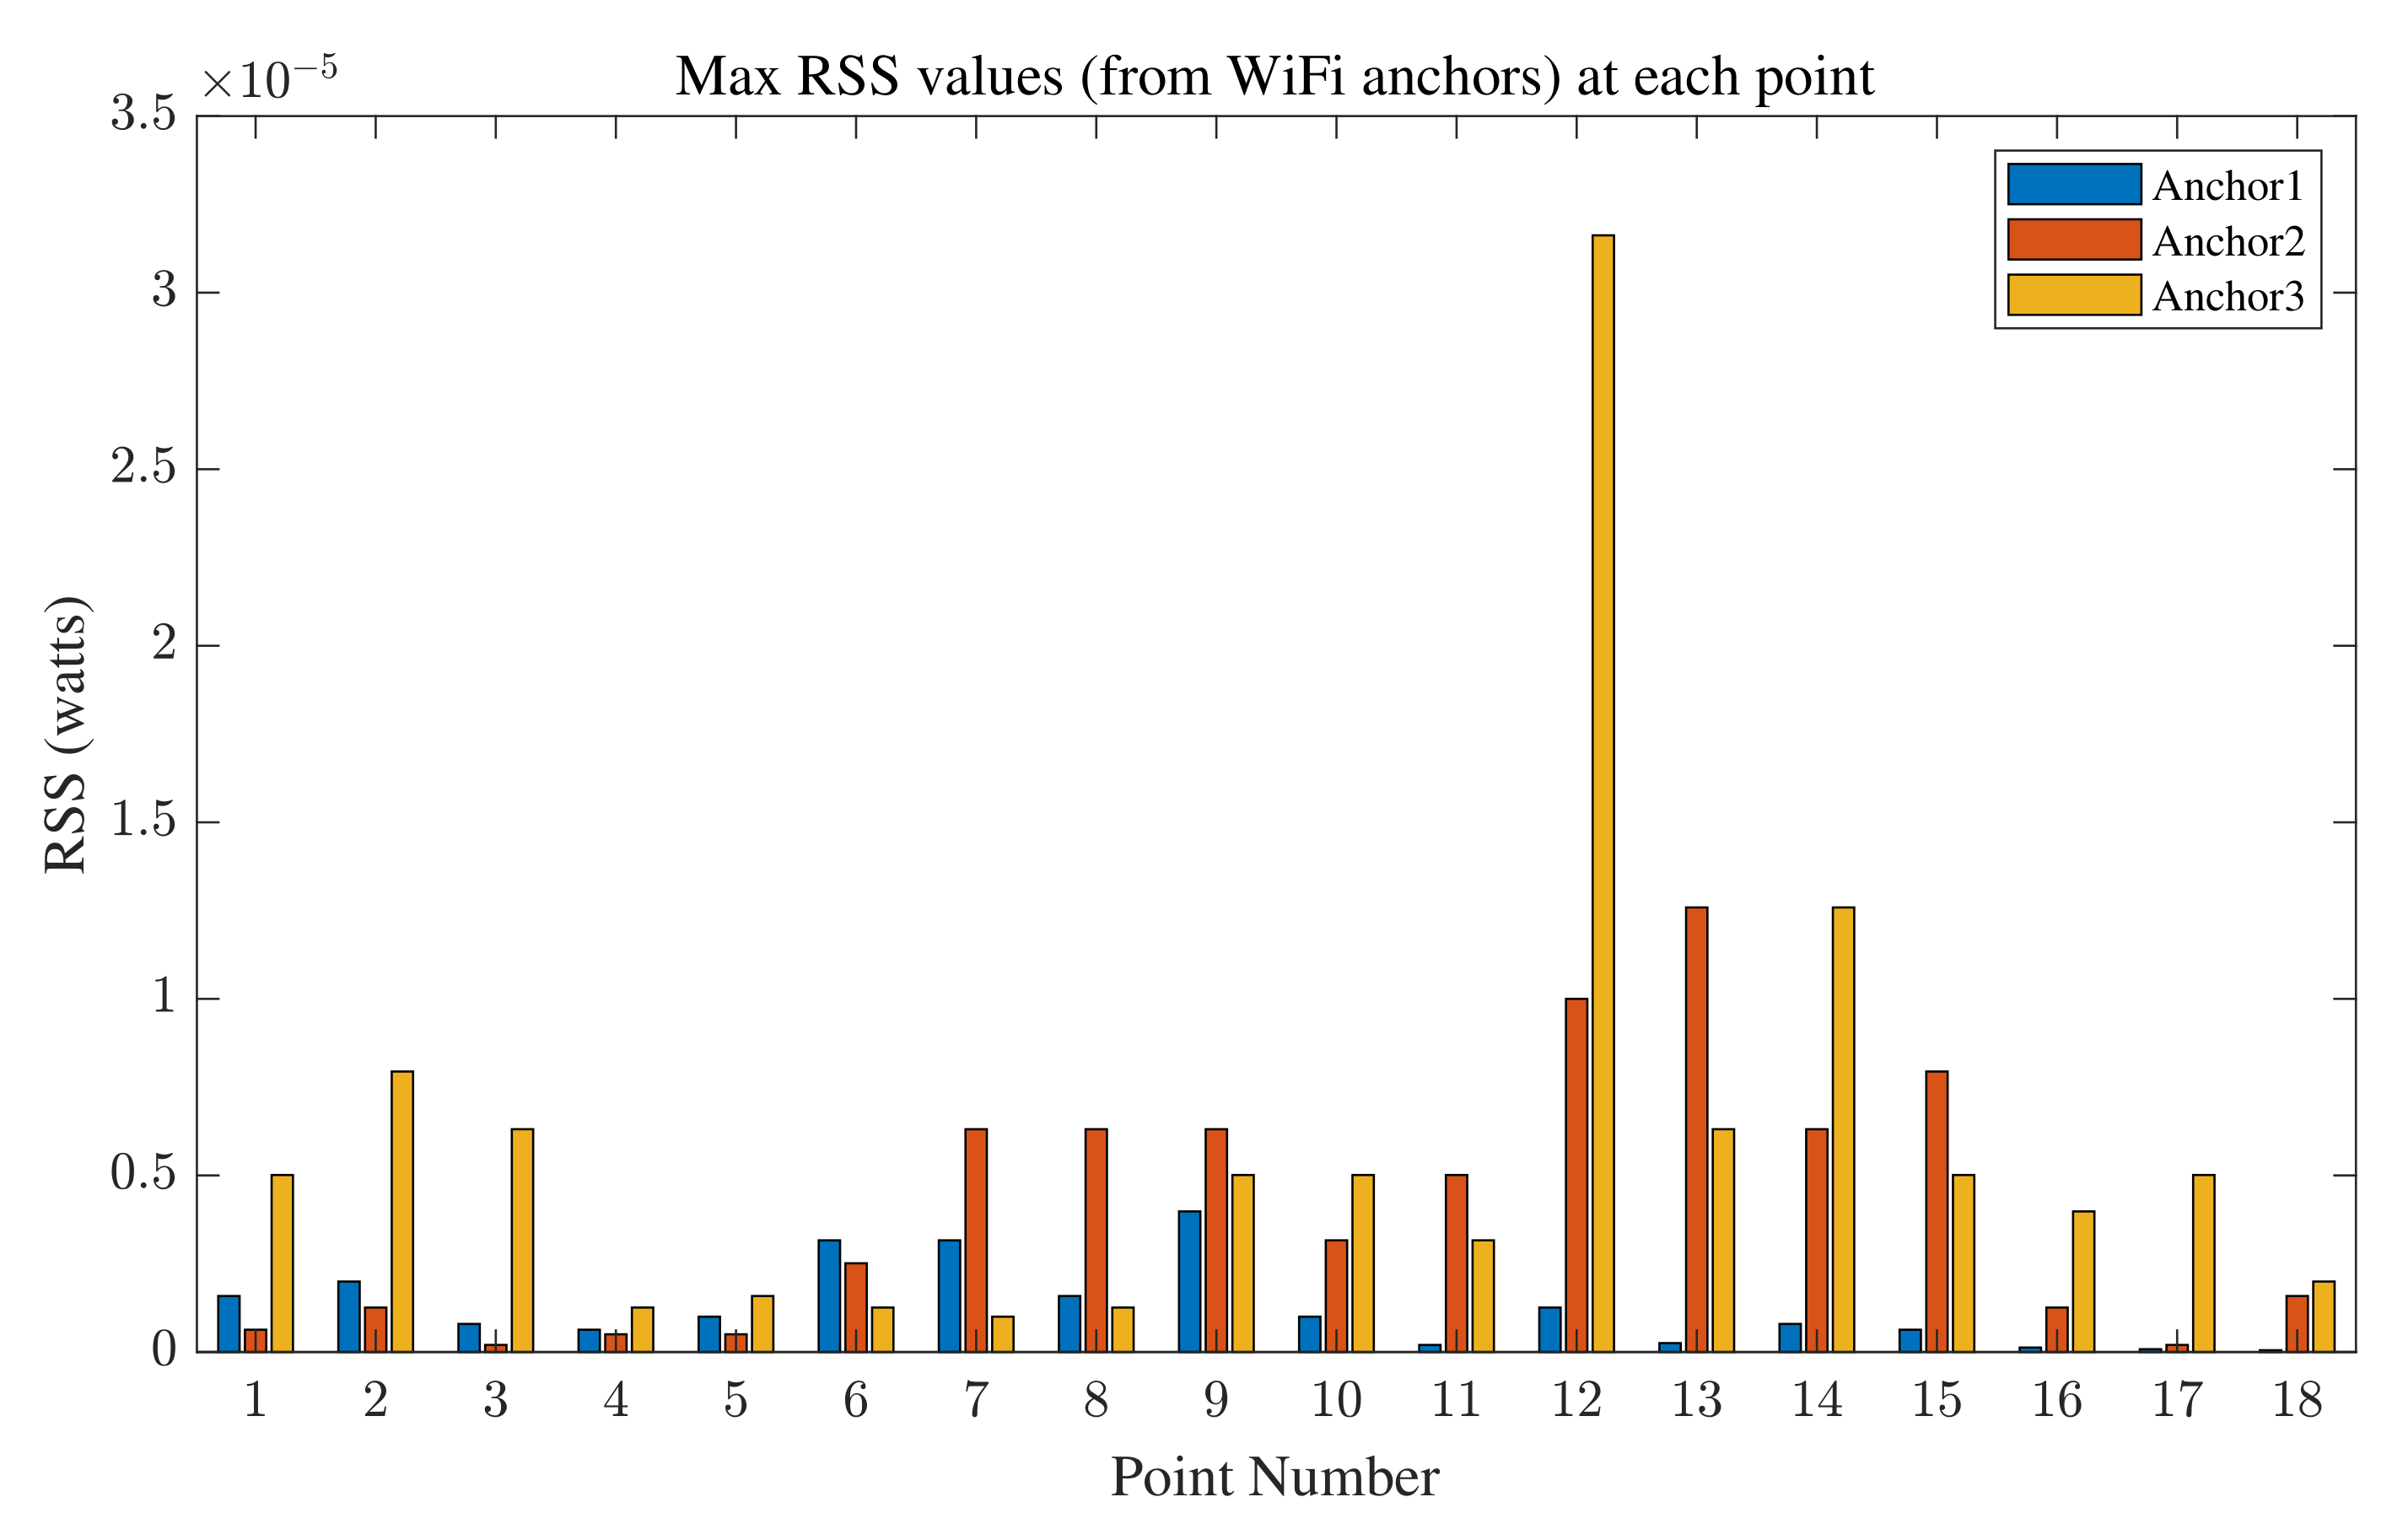
- In addition to the variables extracted using GP, we take advantage of the effect of RSS on positioning accuracy to improve the proposed range fusion algorithm.
- To evaluate the proposed method, we implement the setups and the algorithm for position estimation in an indoor environment. We consider the separate use of UWB and WiFi as the baseline for our work to show that the range fusion method can provide better results in terms of accuracy.
2. Overview of WiFi RTT and UWB TWR
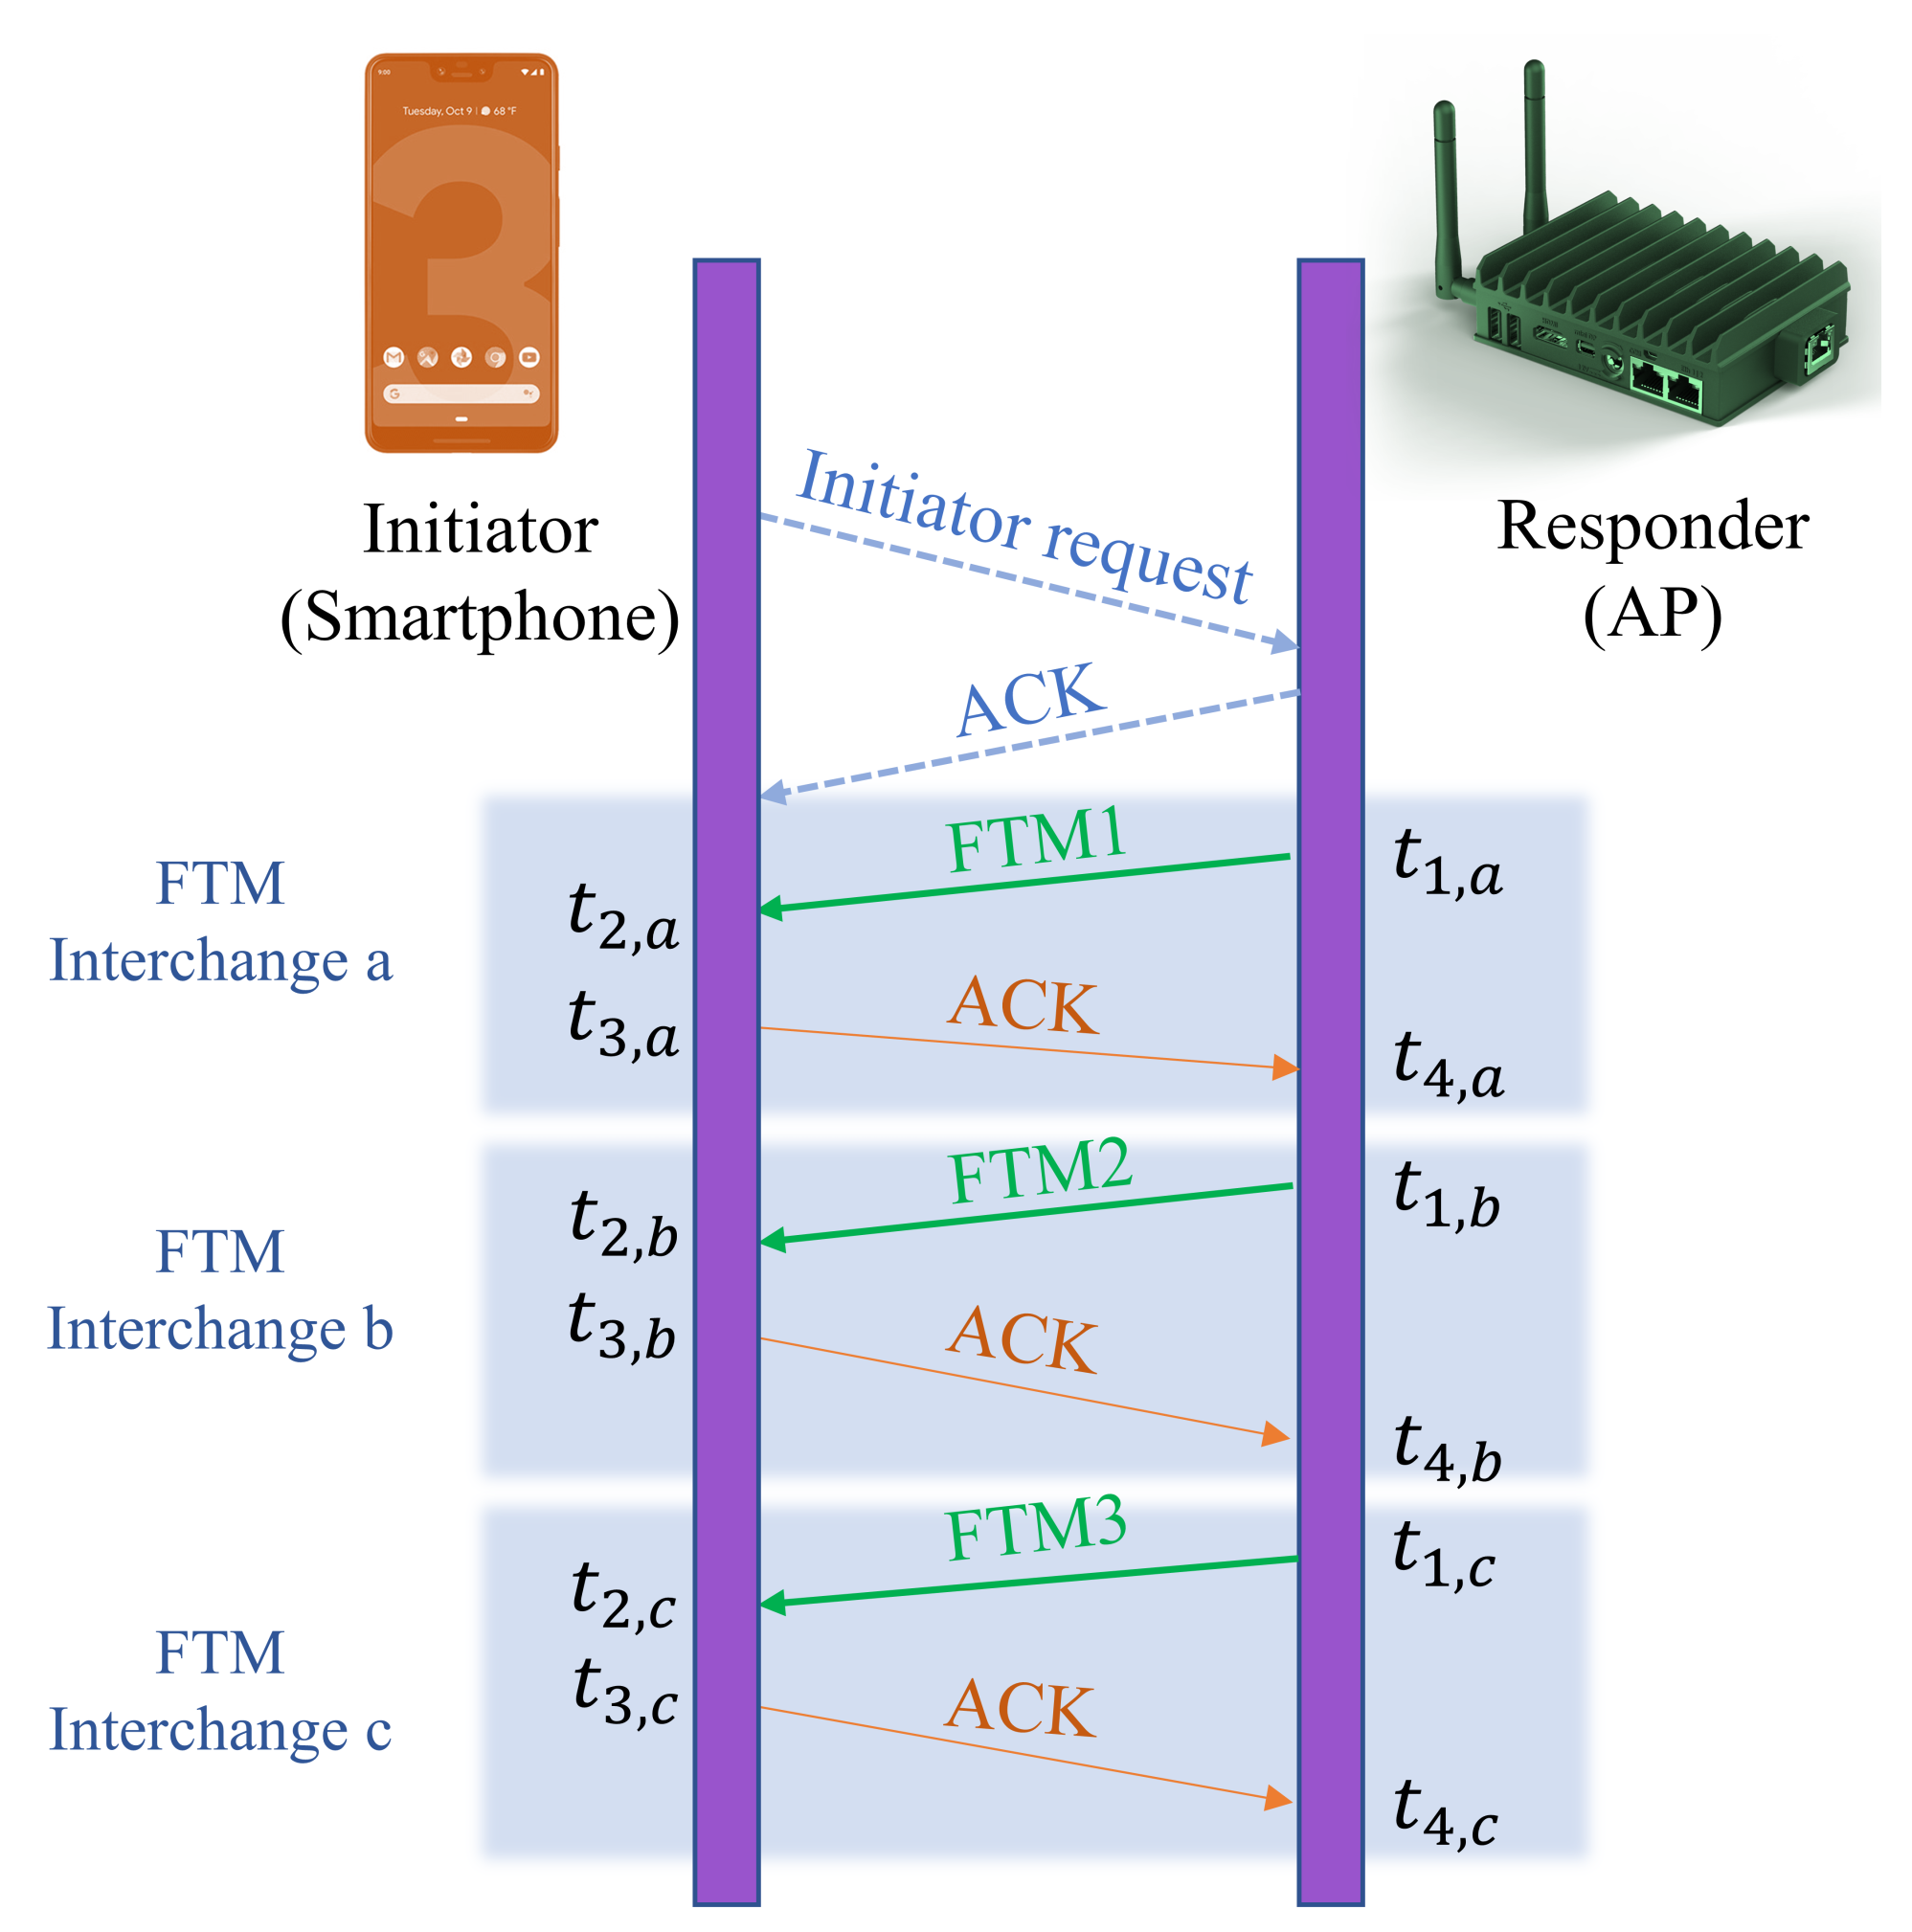
2.1. Utilizing WiFi Signals for Range Measurement
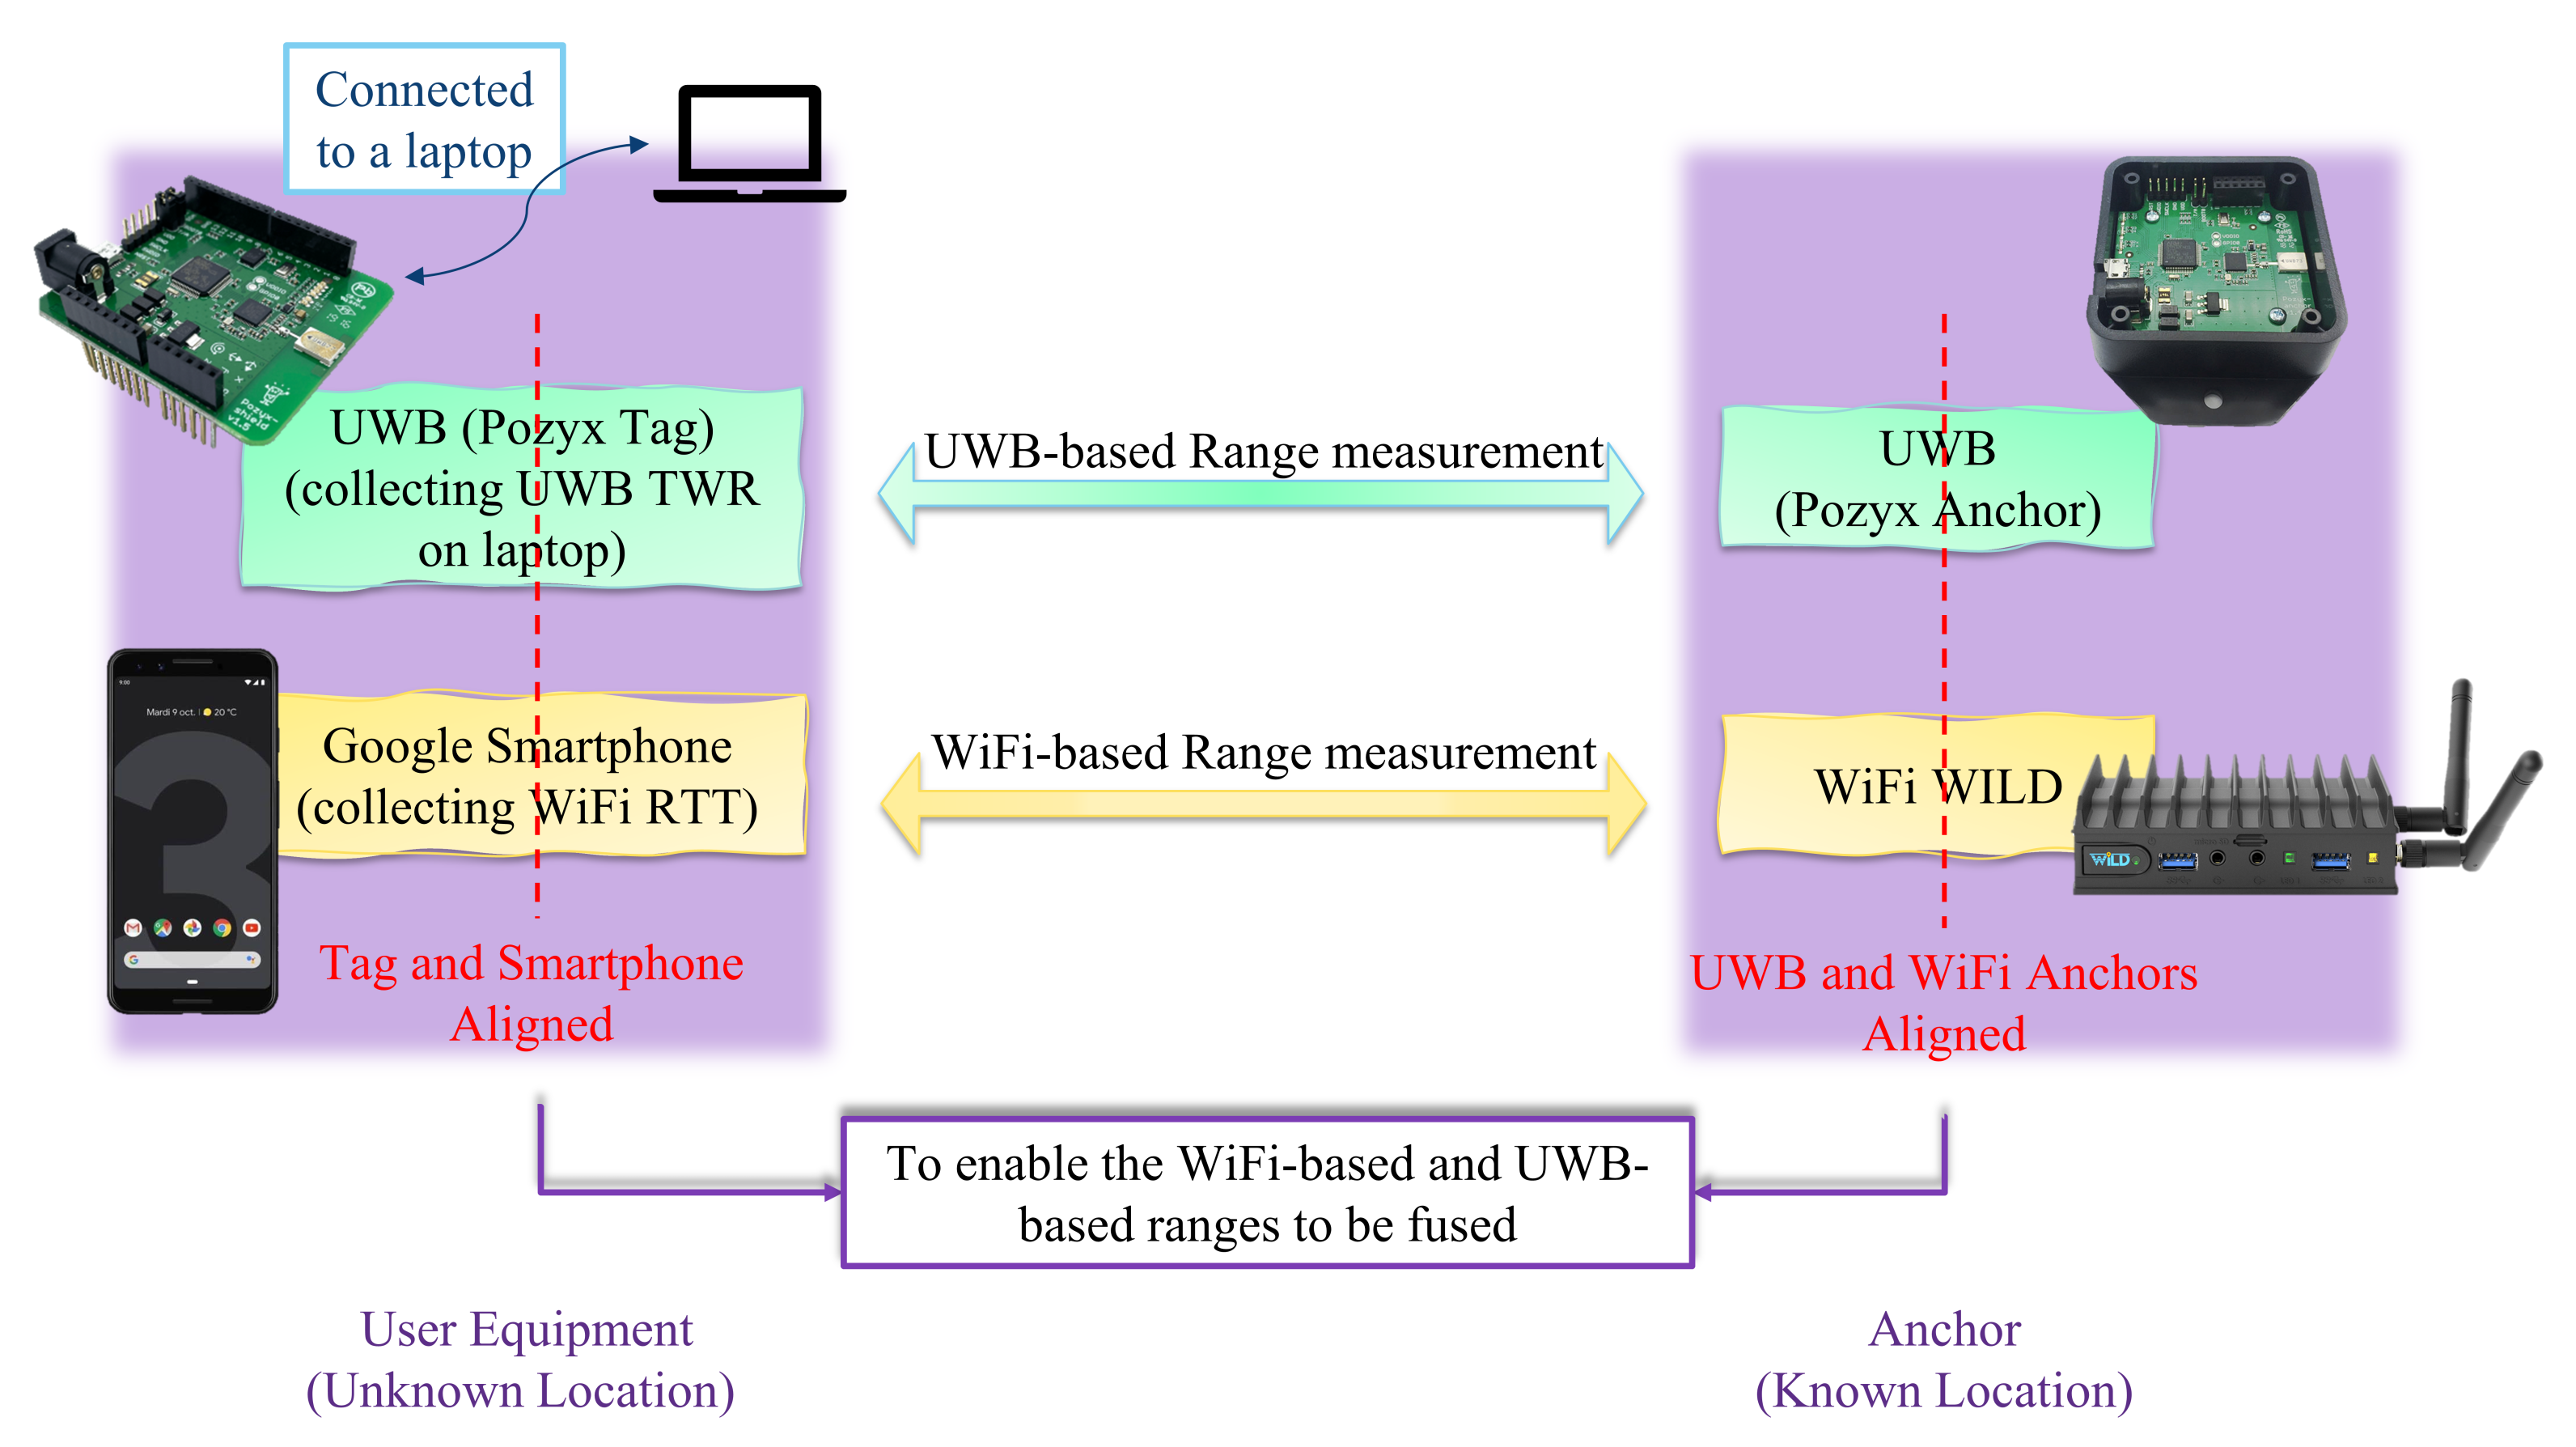
2.2. Range Measurement Using UWB TWR
3. Proposed Procedure
3.1. Phase 1: Model Estimation
3.1.1. Data Collection in an Anechoic Chamber
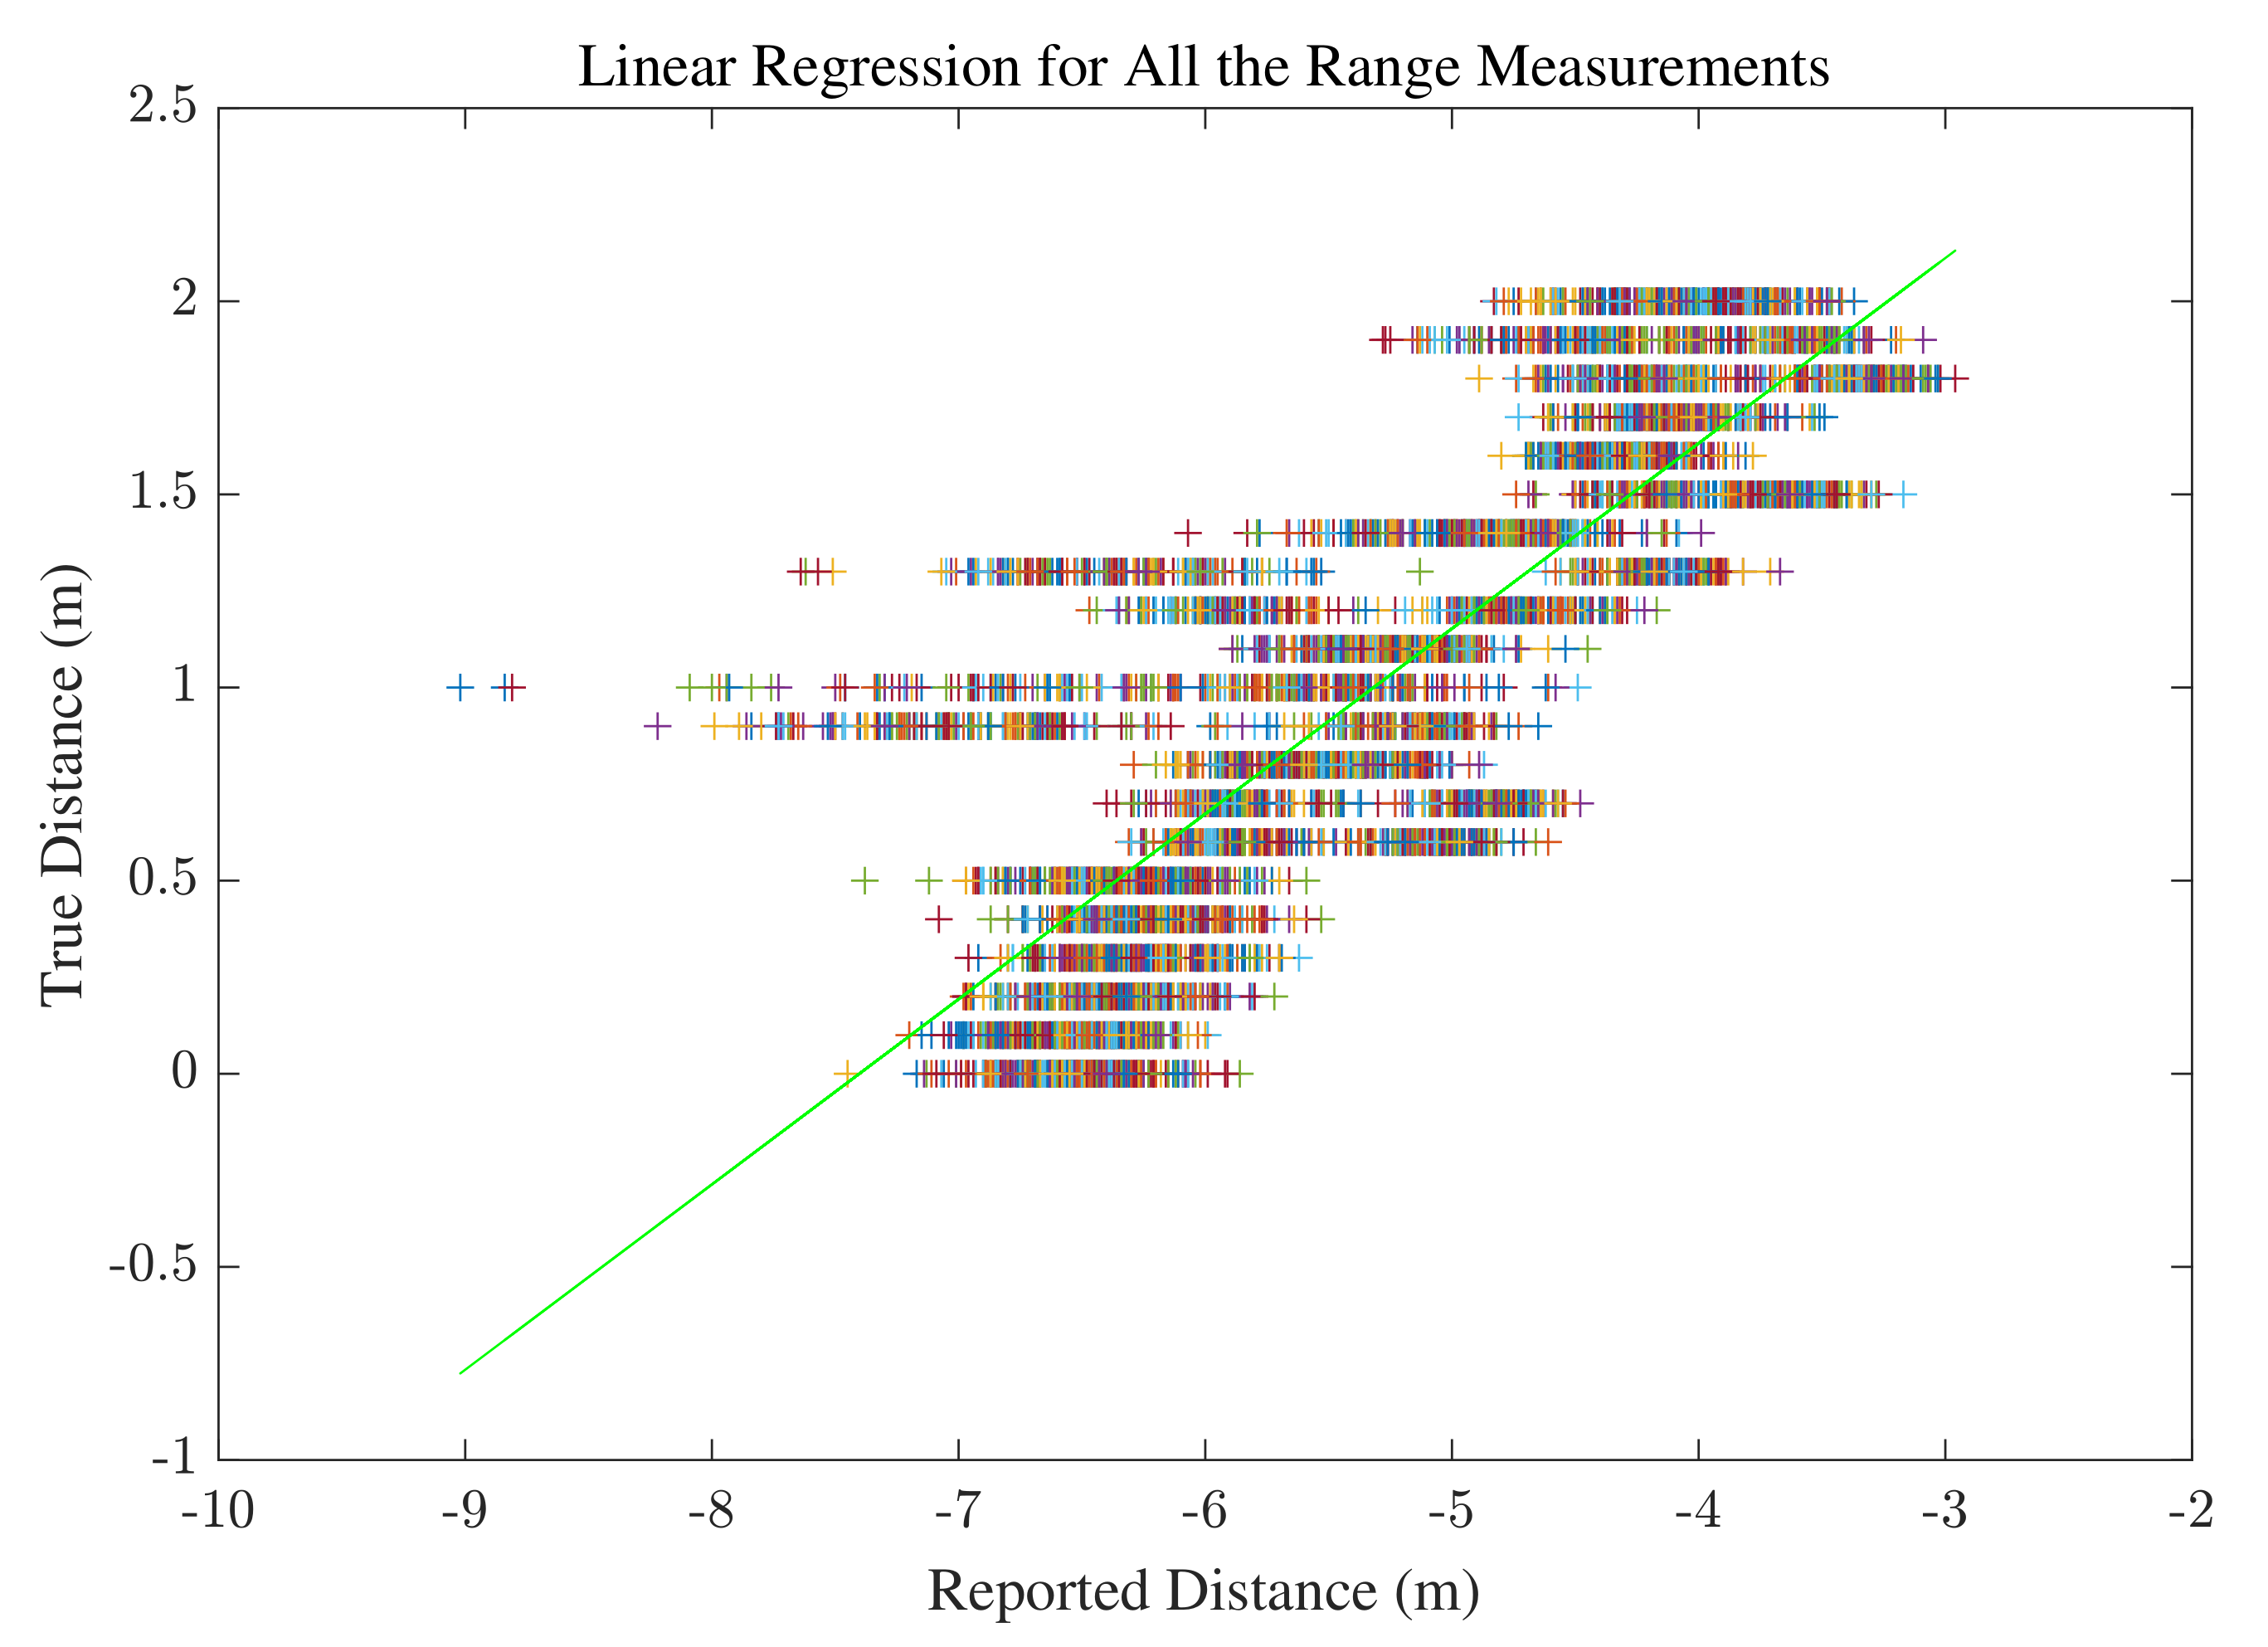
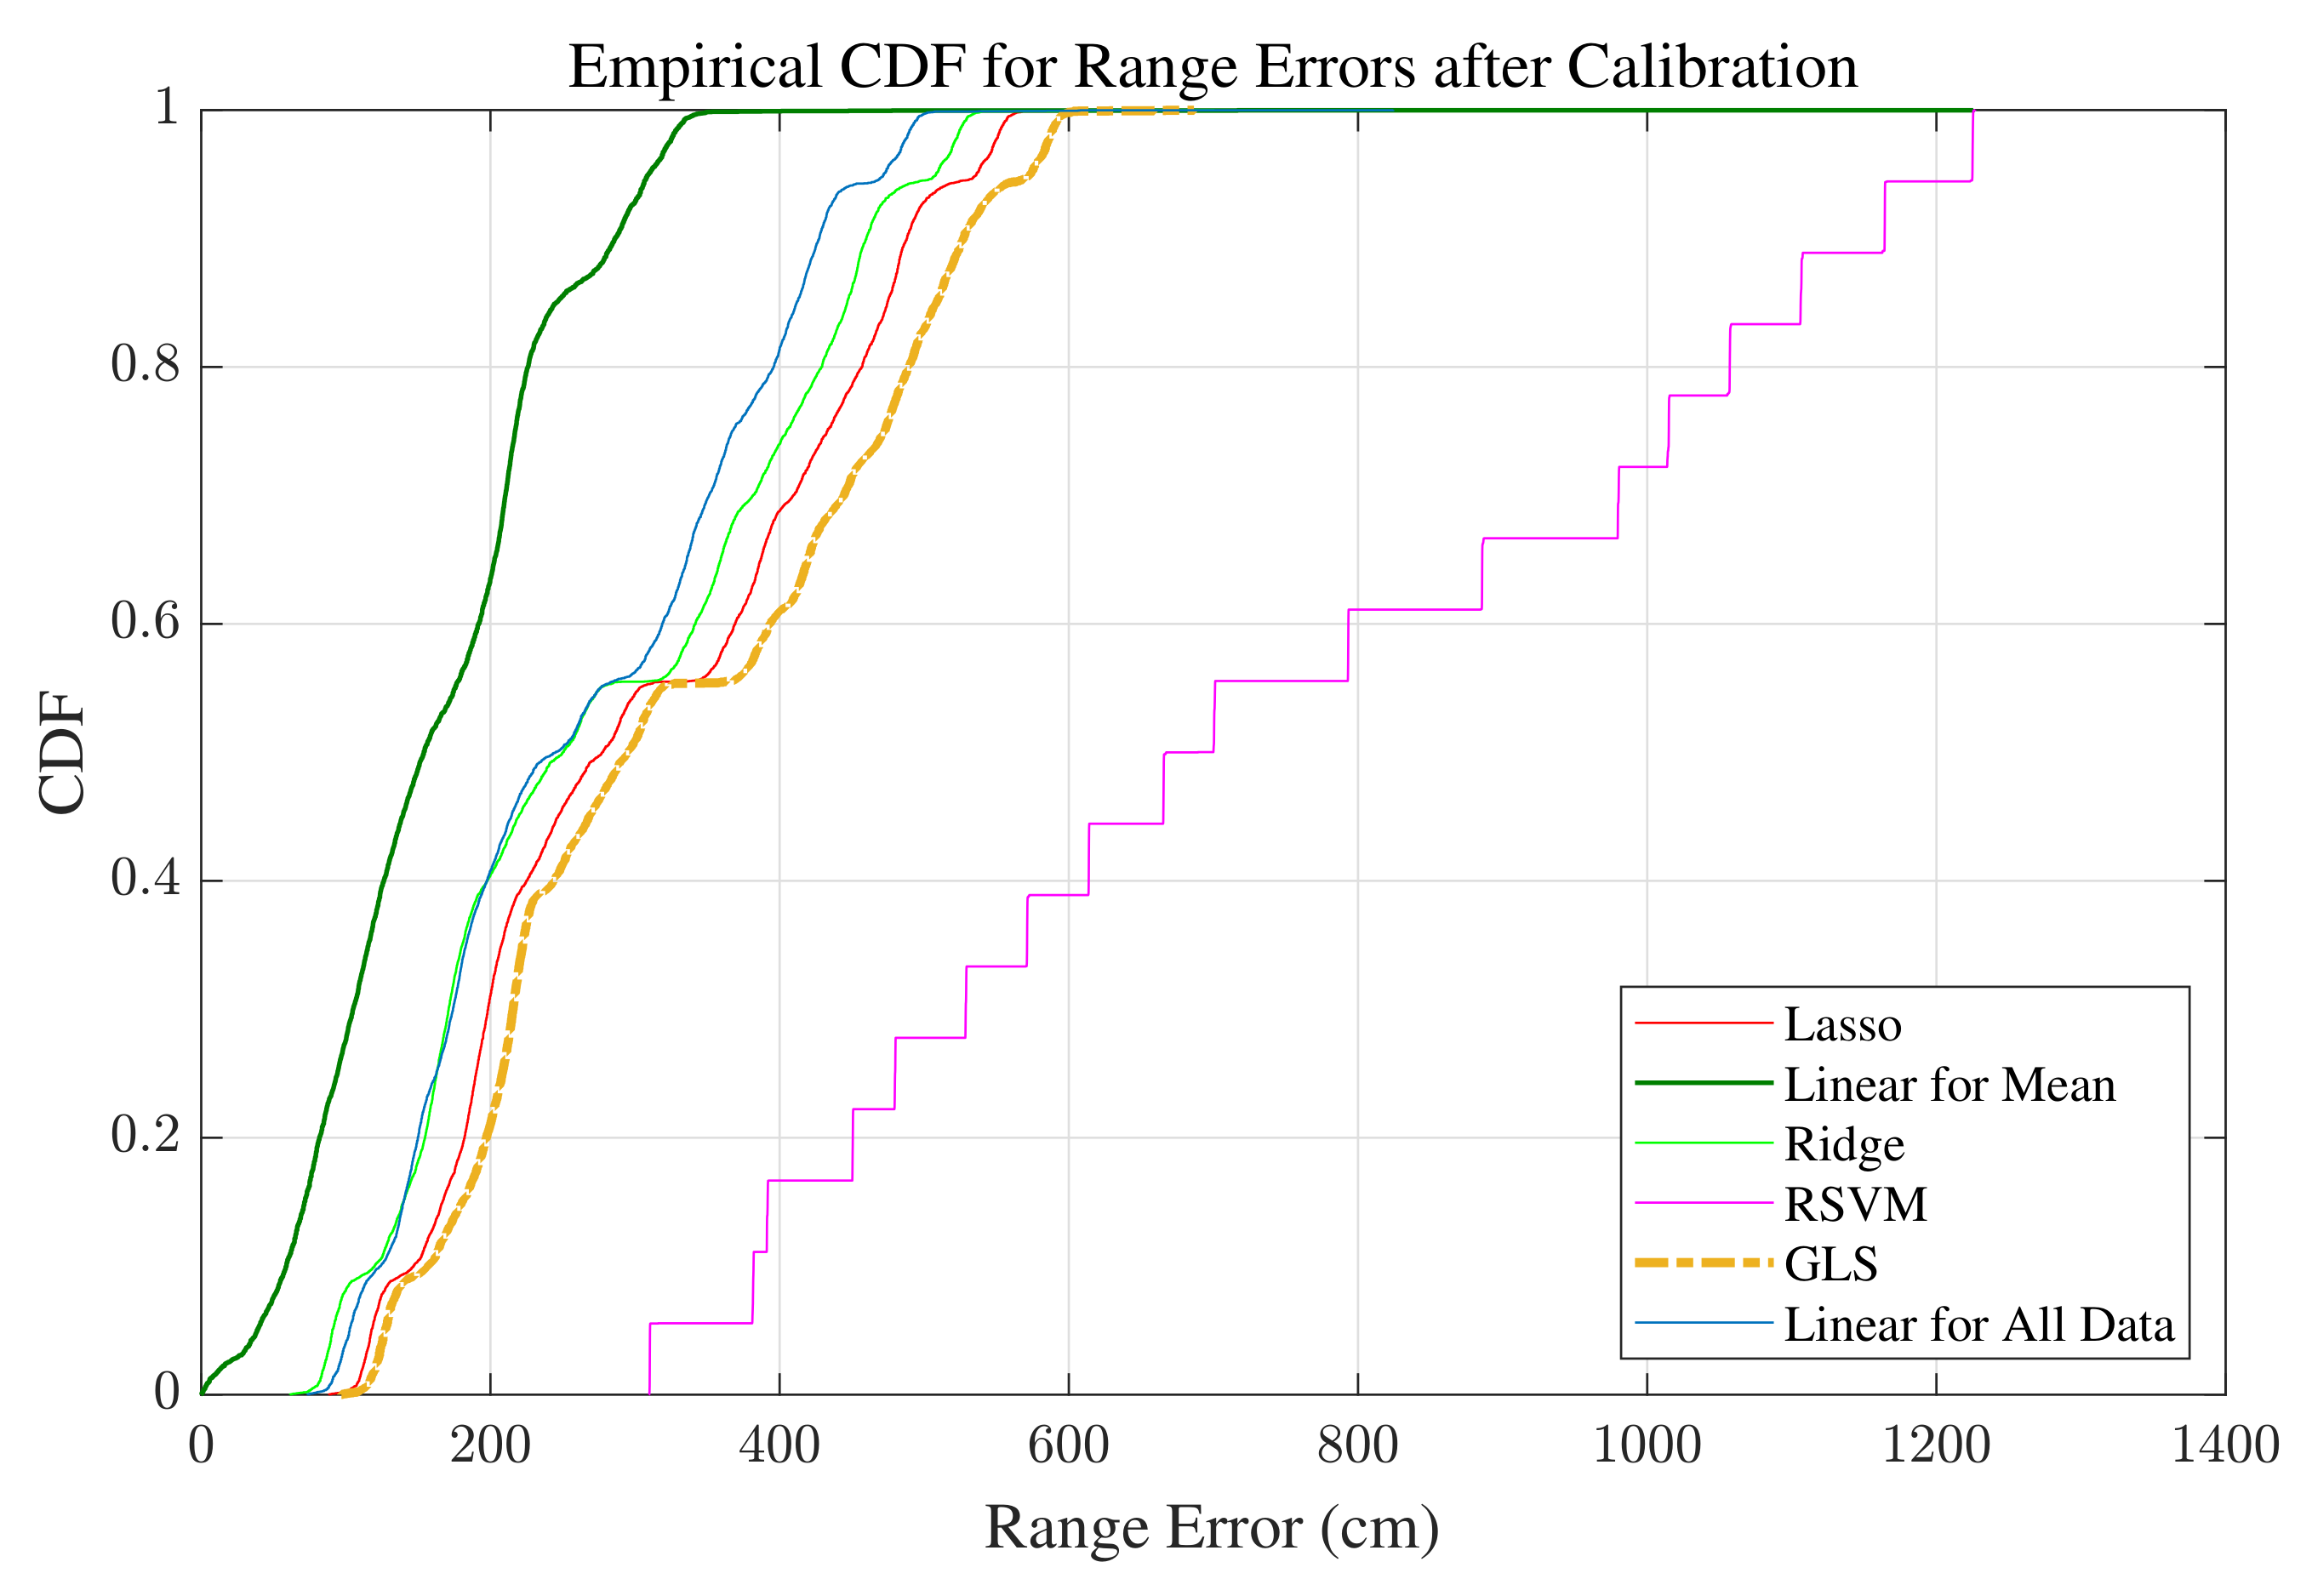
3.1.2. Range Correction using Machine Learning
3.2. Phase 2: Environment Observation
Trilateration Method
3.3. Phase 3: Position Estimation
Range Fusion
- The GP model parameters extracted from environment observation and device behavior in phase 2.
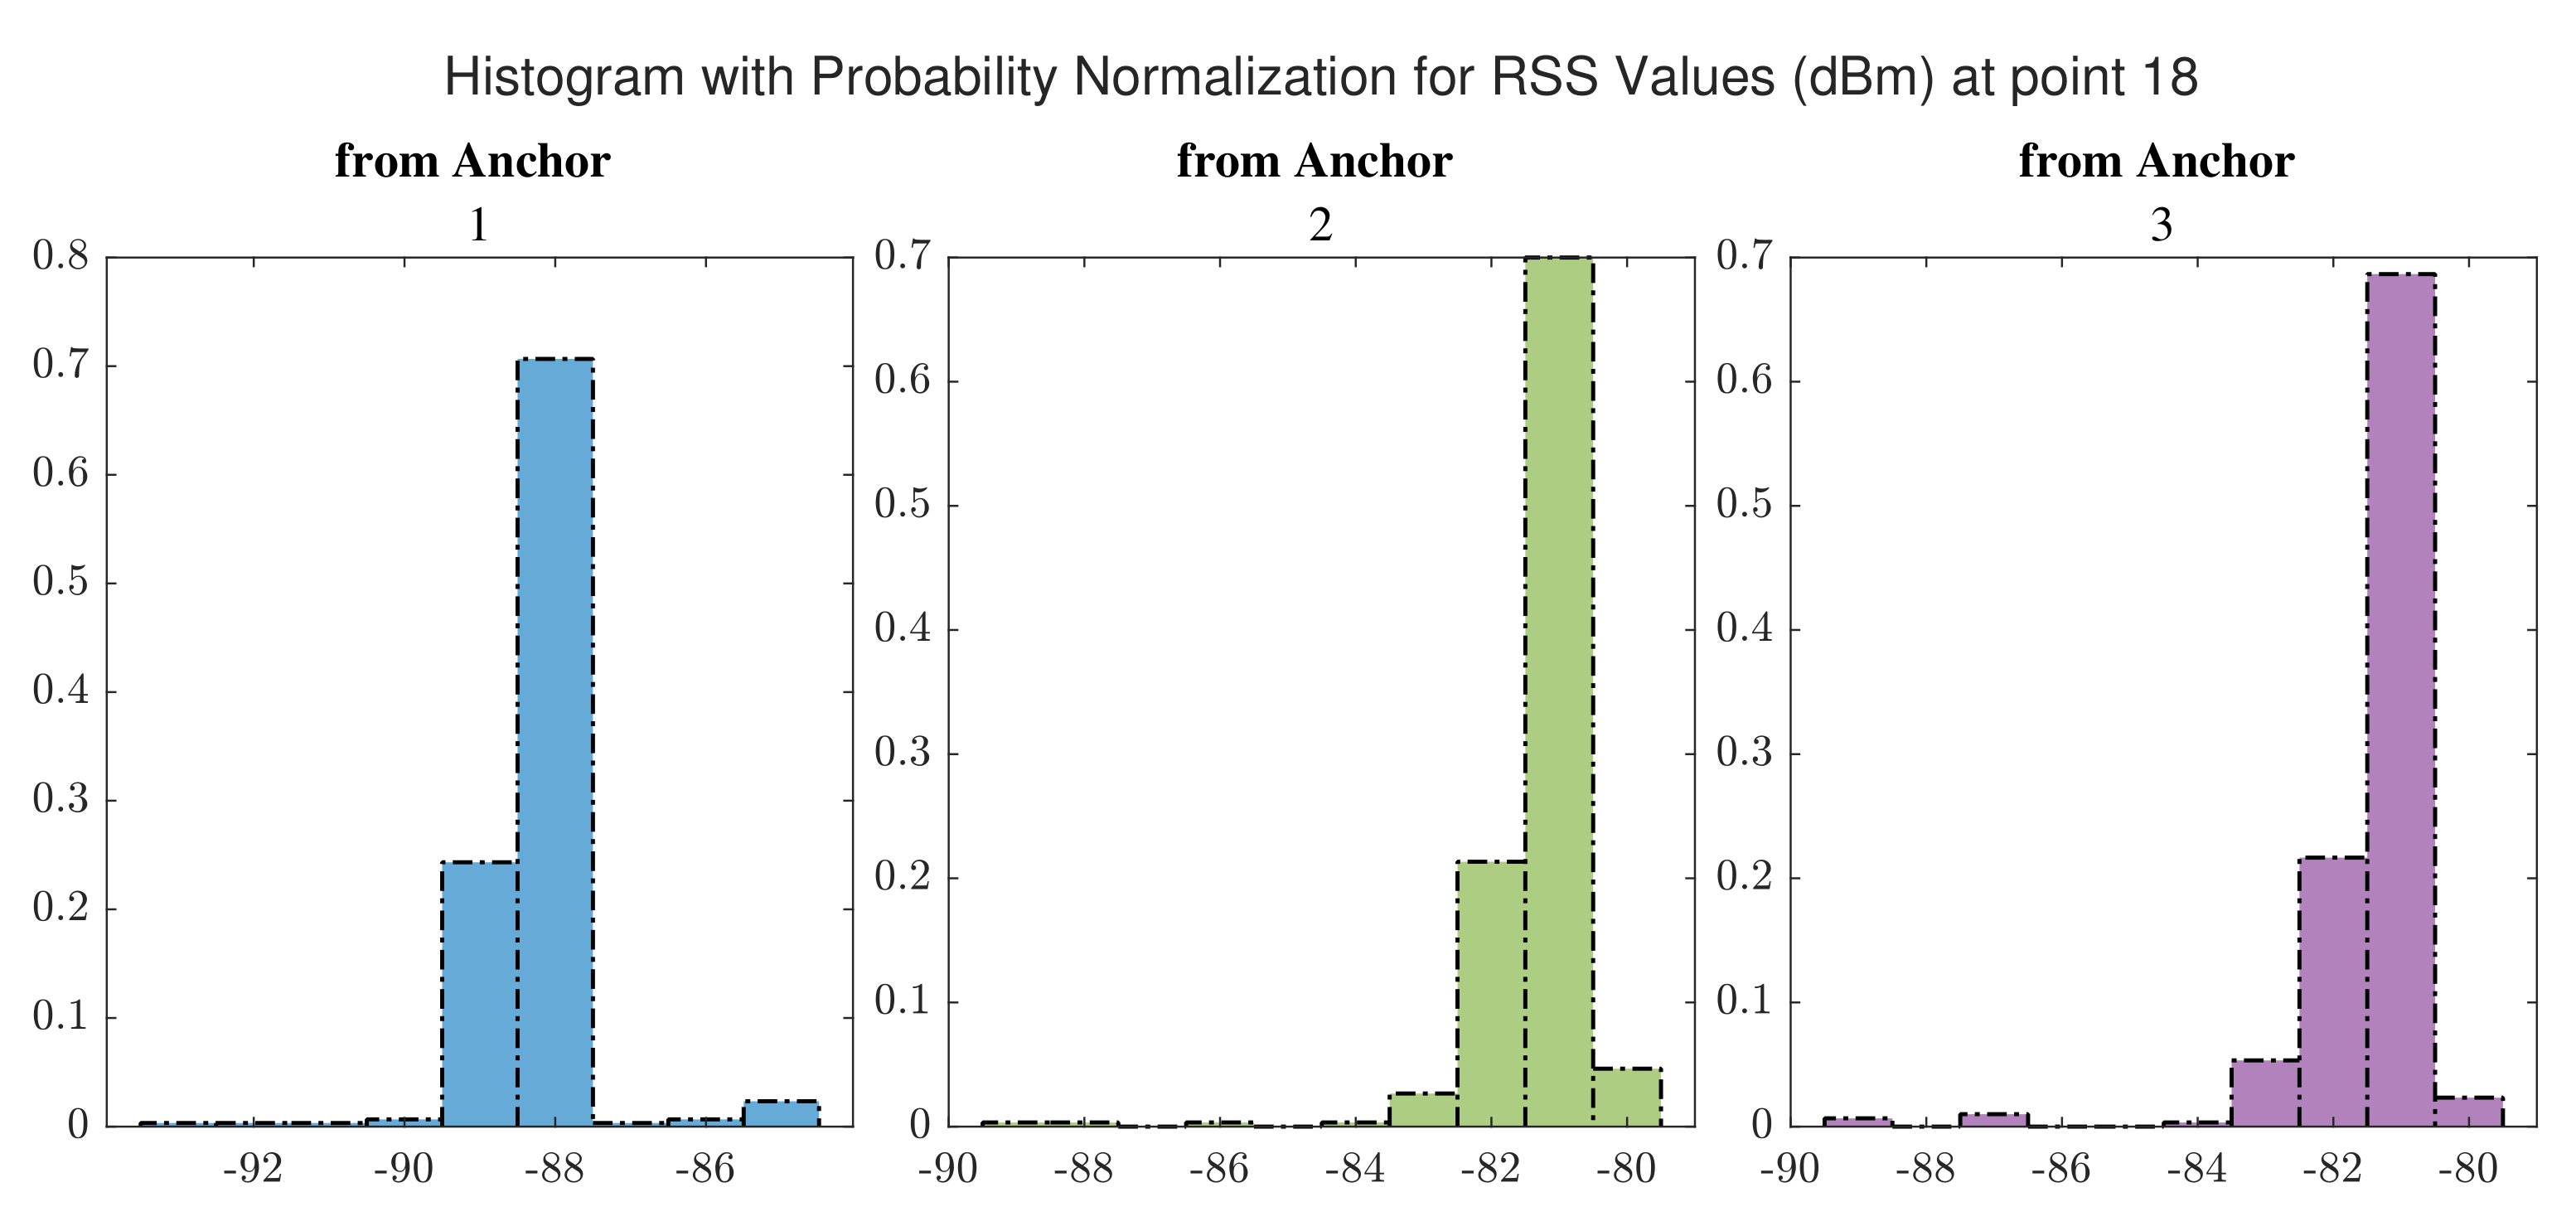
- The RSS values corresponding to the range measurements.
| Algorithm 1 Range Fusion Method. |
Input: The ML model estimated in the model estimation phase; The behavior of the devices (mean and variance of the error in range measurement; The trueness and precision (generated in the environment observation phase). Output: Fused range values.
|
4. Implementations and Evaluations
4.1. Positioning Based on WiFi RTT
4.2. Positioning Based on UWB TWR
4.3. Positioning with Fused Range Measurements Using the Proposed Method
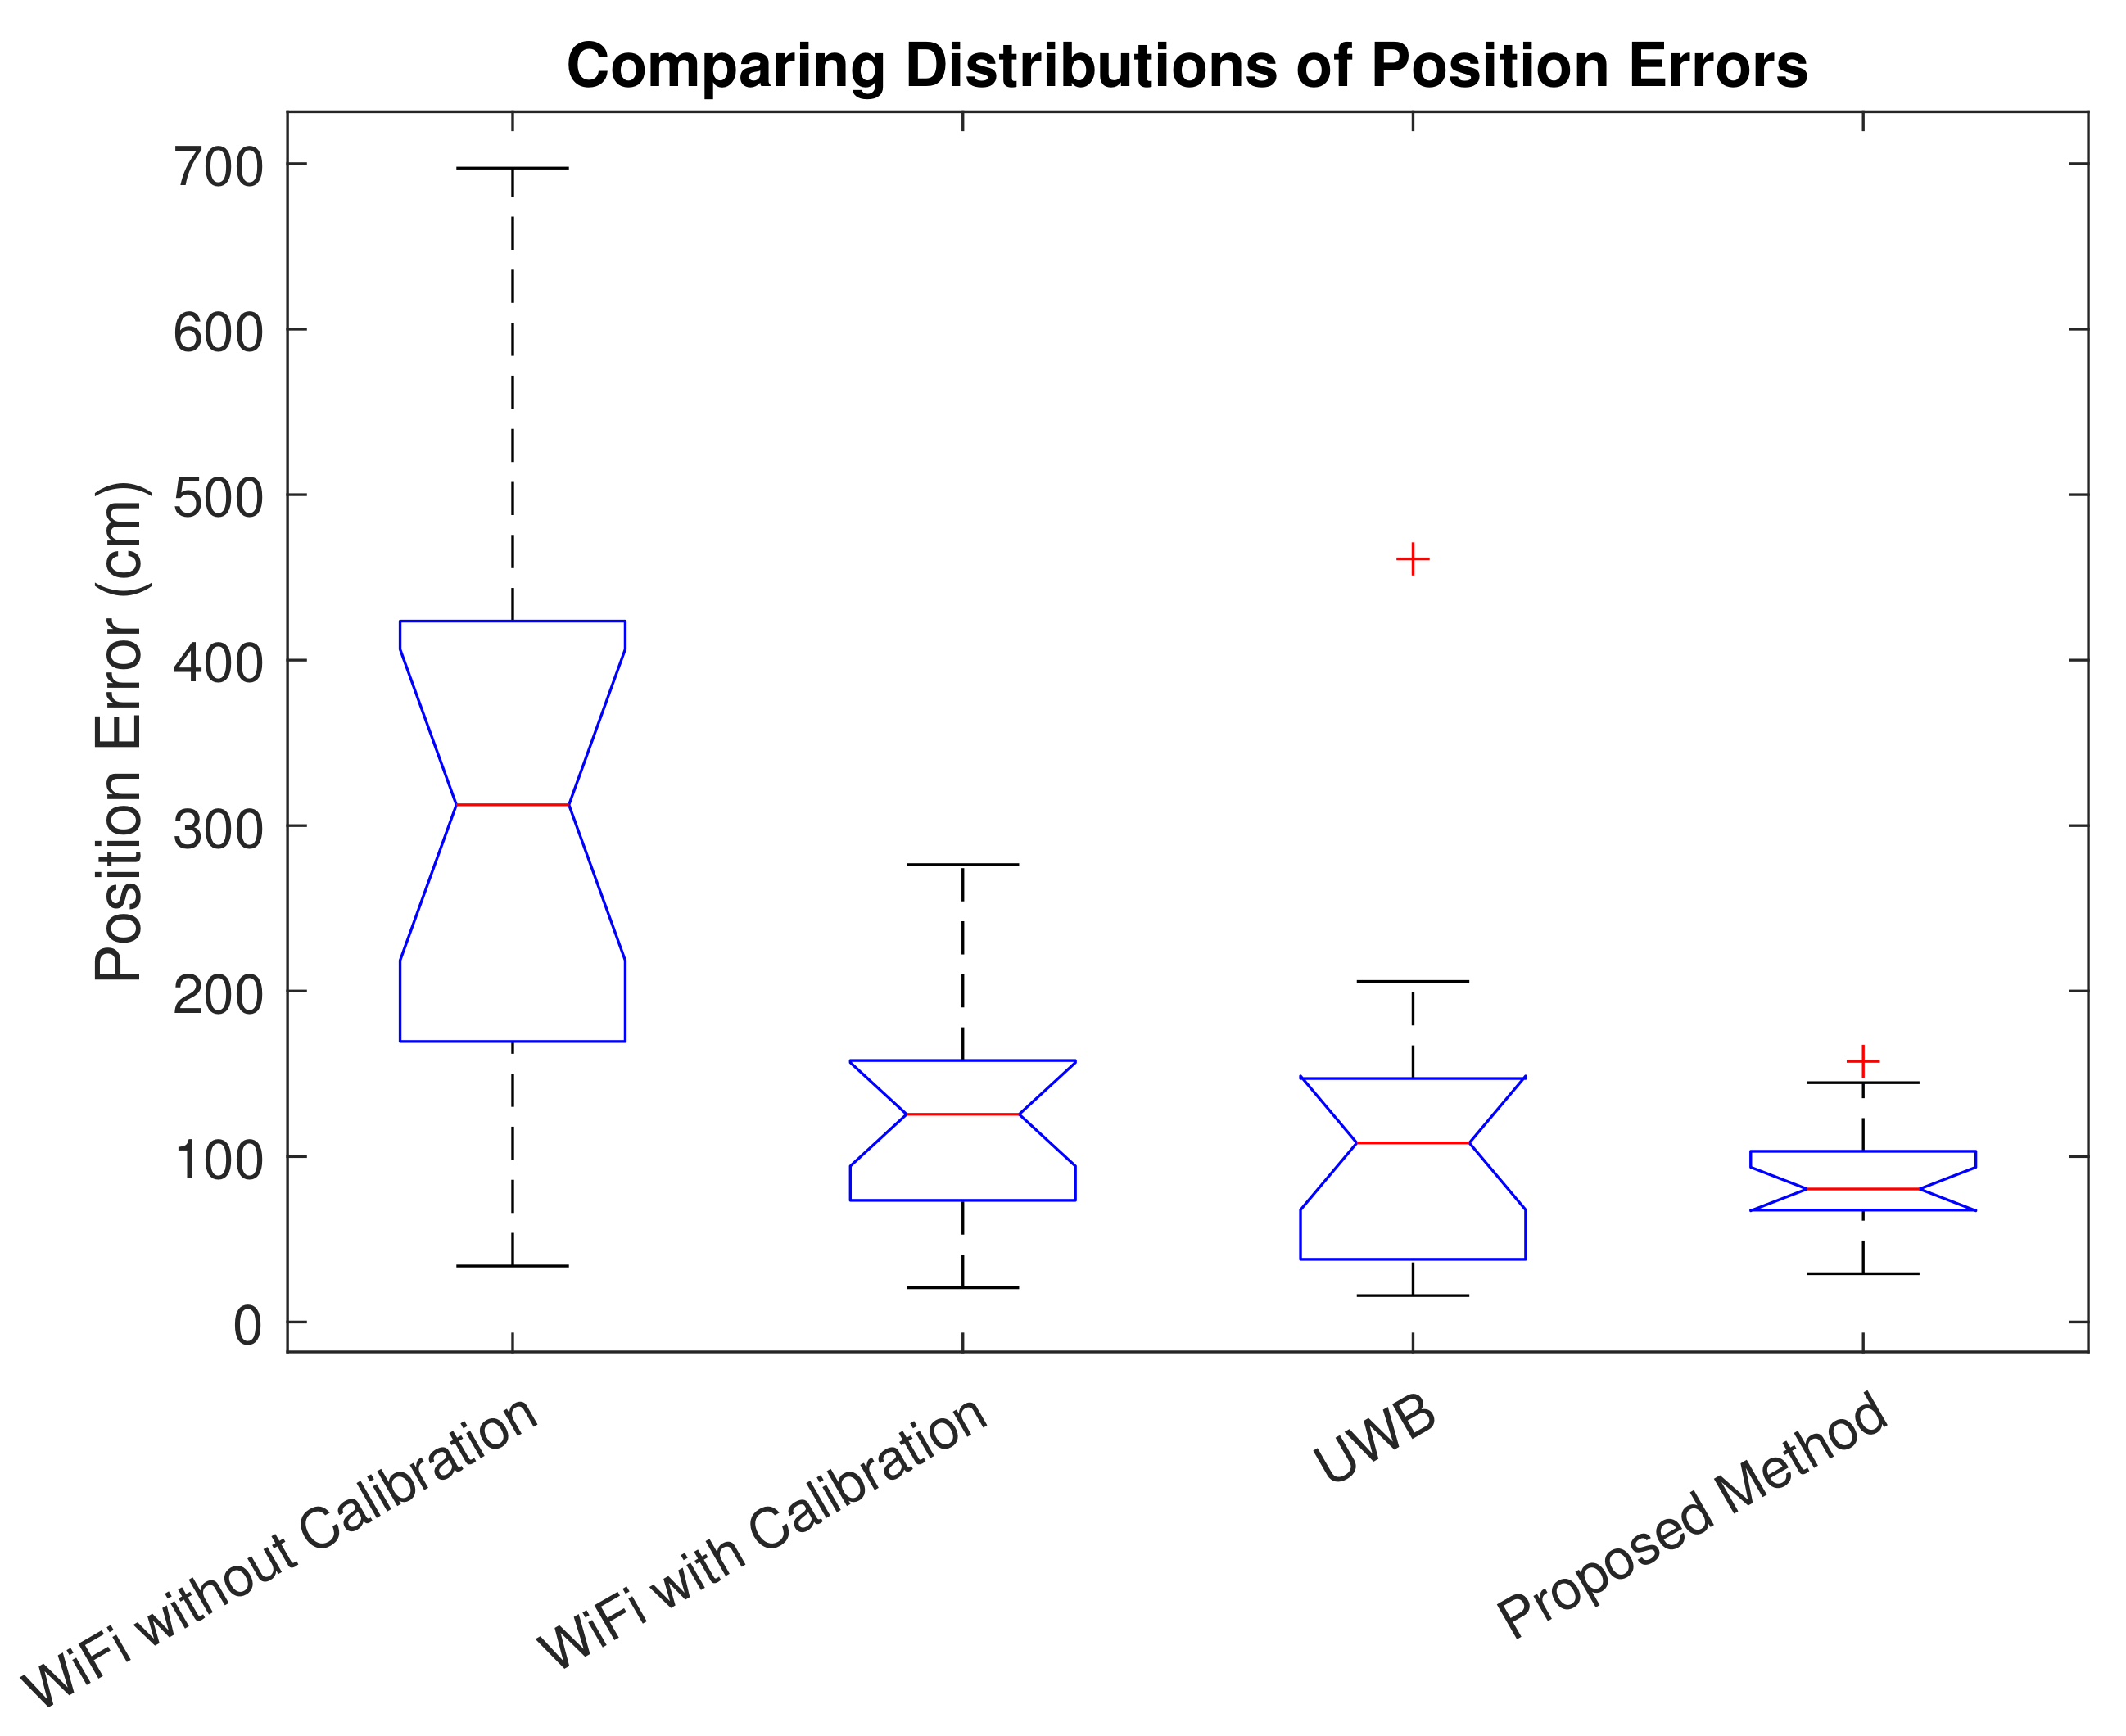
4.4. Comparison
4.5. Issues and Costs of Implementation
5. Discussion and Conclusions
Author Contributions
Funding
Institutional Review Board Statement
Informed Consent Statement
Data Availability Statement
Acknowledgments
Conflicts of Interest
References
- Groves, P. Principles of GNSS, Inertial, and Multisensor Integrated Navigation Systems, 2nd ed.; Artech House: Boston, MA, USA, 2013. [Google Scholar]
- Efatmaneshnik, M.; Alam, N.; Kealy, A.; Dempster, A. A Fast Multidimensional Scaling Filter for Vehicular Cooperative Positioning. J. Navig. 2012, 65, 223–243. [Google Scholar] [CrossRef]
- Rykała, L.; Typiak, A.; Typiak, R. Research on Developing an Outdoor Location System Based on the Ultra-Wideband Technology. Sensors 2020, 20, 6171. [Google Scholar] [CrossRef] [PubMed]
- Zeng, Q.; Kan, Y.; Tao, X.; Hu, Y. LiDAR Positioning Algorithm Based on ICP and Artificial Landmarks Assistance. Sensors 2021, 21, 7141. [Google Scholar] [CrossRef]
- Golestanian, M.; Poellabauer, C. VariLoc: Path Loss Exponent Estimation and Localization Using Multi-Range Beaconing. IEEE Commun. Lett. 2019, 23, 724–727. [Google Scholar] [CrossRef]
- Wang, J.J.; Hwang, J.G.; Park, J.G. A novel indoor ranging method using weighted altofrequent RSSI measurements. In Proceedings of the 11th International Conference on Signal Processing and Communication Systems, Surfers Paradise, Australia, 13–15 December 2017; pp. 1–5. [Google Scholar] [CrossRef]
- Dvorecki, N.; Bar-Shalom, O.; Banin, L.; Amizur, Y. A machine learning approach for Wi-Fi RTT ranging. In Proceedings of the 2019 International Technical Meeting of The Institute of Navigation, Reston, VA, USA, 28–31 January 2019; pp. 435–444. [Google Scholar] [CrossRef]
- Wang, W.; Huang, J.; Cai, S.; Yang, J. Design and Implementation of Synchronization-free TDOA Localization System Based on UWB. Radioengineering 2019, 27, 320–330. [Google Scholar] [CrossRef]
- Ridolfi, M.; Van de Velde, S.; Steendam, H.; De Poorter, E. Analysis of the Scalability of UWB Indoor Localization Solutions for High User Densities. Sensors 2018, 18, 1875. [Google Scholar] [CrossRef] [PubMed] [Green Version]
- Liu, H.; Darabi, H.; Banerjee, P.; Liu, J. Survey of Wireless Indoor Positioning Techniques and Systems. IEEE Trans. Syst. Man Cybern. Part C (Appl. Rev.) 2007, 37, 1067–1080. [Google Scholar] [CrossRef]
- Horn, B.K. Doubling the Accuracy of Indoor Positioning: Frequency Diversity. Sensors 2020, 20, 1489. [Google Scholar] [CrossRef] [Green Version]
- Gentner, C.; Ulmschneider, M.; Kuehner, I.; Dammann, A. WiFi-RTT Indoor Positioning. In Proceedings of the IEEE/ION Position, Location and Navigation Symposium, Portland, OR, USA, 20–23 April 2020; pp. 1029–1035. [Google Scholar] [CrossRef]
- Ando, H.; Sekoguchi, S.; Ikegami, K.; Yoshitake, H.; Baba, H.; Myojo, T.; Ogami, A. Combining Indoor Positioning Using Wi-Fi Round Trip Time with Dust Measurement in the Field of Occupational Health. Sensors 2021, 21, 7261. [Google Scholar] [CrossRef]
- Wu, M.; Yin, Z.; Wu, Z. NRCS-CE: A Noise-Resistance UWB Channel Estimation Method for WSN and IoT Applications. In Proceedings of the IEEE 92nd Vehicular Technology Conference (VTC2020-Fall), Victoria, BC, Canada, 4–7 October 2020; pp. 1–5. [Google Scholar] [CrossRef]
- Huang, L.; Yu, B.; Li, H.; Zhang, H.; Li, S.; Zhu, R.; Li, Y. HPIPS: A High-Precision Indoor Pedestrian Positioning System Fusing WiFi-RTT, MEMS, and Map Information. Sensors 2020, 20, 6795. [Google Scholar] [CrossRef]
- Silva, P.M.F.e. Signals of Opportunity for Positioning Purposes. Ph.D. Thesis, Tampere University of Technology, Tampere, Finland, 2018. [Google Scholar]
- Retscher, G.; Gikas, V.; Hofer, H.; Perakis, H.; Kealy, A. Range Validation of UWB and Wi-Fi for Integrated Indoor Positioning. Appl. Geomat. 2019, 11, 187–195. [Google Scholar] [CrossRef] [Green Version]
- Friedrich, J.; Tiemann, J.; Wietfeld, C. Accurate multi-zone UWB TDOA localization utilizing cascaded wireless clock synchronization. In Proceedings of the International Conference on Indoor Positioning and Indoor Navigation (IPIN), Lloret de Mar, Spain, 29 November–2 December 2021; pp. 1–8. [Google Scholar] [CrossRef]
- Rodriguez-Martinez, C.; Torres-Sospedra, J. Revisiting the analysis of hyperparameters in k-NN for Wi-Fi and BLE fingerprinting: Current status and general results. In Proceedings of the International Conference on Indoor Positioning and Indoor Navigation (IPIN), Lloret de Mar, Spain, 29 November–2 December 2021; pp. 1–8. [Google Scholar] [CrossRef]
- Carvalho, E.C.; Ferreira, B.V.; Filho, G.P.R.; Gomes, P.H.; Freitas, G.M.; Vargas, P.A.; Ueyama, J.; Pessin, G. Towards a Smart Fault Tolerant Indoor Localization System Through Recurrent Neural Networks. In Proceedings of the 2019 International Joint Conference on Neural Networks (IJCNN), Budapest, Hungary, 14–19 July 2019; pp. 1–7. [Google Scholar] [CrossRef]
- IEEE Std 802.11-2020 (Revision of IEEE Std 802.11-2016); IEEE Standard for Information Technology–Telecommunications and Information Exchange between Systems—Local and Metropolitan Area Networks–Specific Requirements—Part 11: Wireless LAN Medium Access Control (MAC) and Physical Layer (PHY) Specifications. IEEE Computer Society LAN/MAN Standards Committee: Washington, DC, USA, 2021; pp. 1–4379. Available online: https://ieeexplore.ieee.org/document/9363693 (accessed on 20 June 2021). [CrossRef]
- Hashem, O.; Youssef, M.; Harras, K.A. WiNar: RTT-based sub-meter indoor localization using commercial devices. In Proceedings of the IEEE International Conference on Pervasive Computing and Communications (PerCom), Austin, TX, USA, 23–27 March 2020; pp. 1–10. [Google Scholar]
- Guo, G.; Chen, R.; Ye, F.; Peng, X.; Liu, Z.; Pan, Y. Indoor Smartphone Localization: A Hybrid WiFi RTT-RSS Ranging Approach. IEEE Access 2019, 7, 176767–176781. [Google Scholar] [CrossRef]
- Ma, C.; Wu, B.; Poslad, S.; Selviah, D.R. Wi-Fi RTT Ranging Performance Characterization and Positioning System Design. IEEE Trans. Mob. Comput. 2022, 21, 740–756. [Google Scholar] [CrossRef]
- Cao, H.; Wang, Y.; Bi, J.; Xu, S.; Si, M.; Qi, H. Indoor Positioning Method Using WiFi RTT Based on LOS Identification and Range Calibration. ISPRS Int. J. -Geo-Inf. 2020, 9, 627. [Google Scholar] [CrossRef]
- Banin, L.; Schatzberg, U.; Amizur, Y. WiFi FTM and Map information fusion for accurate positioning. In Proceedings of the International Conference on Indoor Positioning and Indoor Navigation (IPIN), Madrid, Spain, 4–7 October 2016. [Google Scholar]
- Klus, R.; Klus, L.; Talvitie, J.; Pihlajasalo, J.; Torres-Sospedra, J.; Valkama, M. Transfer learning for convolutional indoor positioning systems. In Proceedings of the International Conference on Indoor Positioning and Indoor Navigation (IPIN), Lloret de Mar, Spain, 29 November–2 December 2021; pp. 1–8. [Google Scholar] [CrossRef]
- Klus, R.; Talvitie, J.; Valkama, M. Neural network fingerprinting and GNSS data fusion for improved localization in 5G. In Proceedings of the International Conference on Localization and GNSS (ICL-GNSS), Tampere, Finland, 1–3 June 2021; pp. 1–6. [Google Scholar] [CrossRef]
- Carvalho, E.; Faiçal, B.S.; Filho, G.P.R.; Vargas, P.A.; Ueyama, J.; Pessin, G. Exploiting the Use of Machine Learning in Two Different Sensor Network Architectures for Indoor Localization. In Proceedings of the 2016 IEEE International Conference on Industrial Technology (ICIT), Taipei, Taiwan, 14–17 March 2016; pp. 652–657. [Google Scholar] [CrossRef]
- Seong, J.H.; Lee, S.H.; Kim, W.Y.; Seo, D.H. High-Precision RTT-Based Indoor Positioning System Using RCDN and RPN. Sensors 2021, 21, 3701. [Google Scholar] [CrossRef]
- Alvarez-Merino, C.S.; Luo-Chen, H.Q.; Khatib, E.J.; Barco, R. Opportunistic Fusion of Ranges From Different Sources for Indoor Positioning. IEEE Commun. Lett. 2021, 25, 2260–2264. [Google Scholar] [CrossRef]
- Dabove, P.; Di Pietra, V.; Piras, M.; Jabbar, A.A.; Kazim, S.A. Indoor positioning using Ultra-wide band (UWB) technologies: Positioning accuracies and sensors’ performances. In Proceedings of the IEEE/ION Position, Location and Navigation Symposium (PLANS), Monterey, CA, USA, 23–26 April 2018. [Google Scholar] [CrossRef]
- Sayed, A.; Tarighat, A.; Khajehnouri, N. Network-Based Wireless Location: Challenges Faced in Developing Techniques for Accurate Wireless Location Information. IEEE Signal Process. Mag. 2005, 22, 24–40. [Google Scholar] [CrossRef]
- Mäkelä, M.; Rantanen, J.; Ilinca, J.; Kirkko-Jaakkola, M.; Kaasalainen, S.; Ruotsalainen, L. Cooperative environment recognition utilizing UWB waveforms and CNNs. In Proceedings of the European Navigation Conference (ENC), Dresden, Germany, 23–24 November 2020; pp. 1–8. [Google Scholar] [CrossRef]
- Vena, A.; Perret, E.; Tedjini, S. 1—Introduction to RFID Technologies. In Chipless RFID based on RF Encoding Particle; Elsevier: Amsterdam, The Netherlands, 2016; pp. 1–26. [Google Scholar] [CrossRef]
- Sidorenko, J.; Schatz, V.; Scherer-Negenborn, N.; Arens, M.; Hugentobler, U. Decawave UWB Clock Drift Correction and Power Self-Calibration. Sensors 2019, 19, 2942. [Google Scholar] [CrossRef] [Green Version]
- Vanhuysse, H. Analysis of Range and Accuracy of an UWB Indoor Localization System. Master’s Thesis, Master of Science in de Industriële Wetenschappen: Elektronica-ICT—Campus Schoonmeersen, Ghent, Belgium, 2019. [Google Scholar]
- Zha, Y.; Pu, W.; Chen, G.; Huang, Y.; Yang, J. A Minimum-Entropy Based Residual Range Cell Migration Correction for Bistatic Forward-Looking SAR. Information 2016, 7, 8. [Google Scholar] [CrossRef] [Green Version]
- Sakr, M.; Masiero, A.; El-Sheimy, N. LocSpeck: A Collaborative and Distributed Positioning System for Asymmetric Nodes Based on UWB Ad-Hoc Network and Wi-Fi Fingerprinting. Sensors 2020, 20, 78. [Google Scholar] [CrossRef] [Green Version]
- IEEE Std 802.15.4-2011 (Revision of IEEE Std 802.15.4-2006); IEEE Standard for Local and Metropolitan Area Networks–Part 15.4: Low-Rate Wireless Personal Area Networks (LR-WPANs). IEEE: Washington, DC, USA, 2011; pp. 1–314. Available online: https://ieeexplore.ieee.org/document/6012487 (accessed on 10 April 2022). [CrossRef]
- Di Pietra, V.; Dabove, P.; Piras, M. Loosely Coupled GNSS and UWB with INS Integration for Indoor/Outdoor Pedestrian Navigation. Sensors 2020, 20, 6292. [Google Scholar] [CrossRef] [PubMed]
- Pietra, V.D.; Dabove, P.; Piras, M.; Lingua, A. Evaluation of positioning and ranging errors for UWB indoor applications. In Proceedings of the International Conference on Indoor Positioning and Indoor Navigation (IPIN), Pisa, Italy, 30 September–3 October 2019. [Google Scholar]
- Grigulo, J.; Becker, L.B. Experimenting sensor nodes localization in WSN with UAV acting as mobile agent. In Proceedings of the IEEE 23rd International Conference on Emerging Technologies and Factory Automation (ETFA), Turin, Italy, 4–7 September 2018; Volume 1, pp. 808–815. [Google Scholar] [CrossRef]
- Álvarez Merino, C.S.; Luo-Chen, H.Q.; Khatib, E.J.; Barco, R. WiFi FTM, UWB and Cellular-Based Radio Fusion for Indoor Positioning. Sensors 2021, 21, 7020. [Google Scholar] [CrossRef] [PubMed]
- Kia, G.; Talvitie, J.; Ruotsalainen, L. RSS-based fusion of UWB and WiFi-based ranging for indoor positioning. In Proceedings of the International Conference on Indoor Positioning and Indoor Navigation (IPIN), Lloret de Mar, Spain, 29 November–2 December 2021. [Google Scholar]
- Caso, G.; Le, M.T.P.; De Nardis, L.; Di Benedetto, M.G. Performance Comparison of WiFi and UWB Fingerprinting Indoor Positioning Systems. Technologies 2018, 6, 14. [Google Scholar] [CrossRef] [Green Version]
- Van Herbruggen, B.; Fontaine, J.; Poorter, E.D. Anchor pair selection for error correction in Time Difference of Arrival (TDoA) Ultra Wideband (UWB) positioning systems. In Proceedings of the International Conference on Indoor Positioning and Indoor Navigation (IPIN), Lloret de Mar, Spain, 29 November–2 December 2021; pp. 1–8. [Google Scholar] [CrossRef]
- Wang, Y.; Xiu, C.; Zhang, X.; Yang, D. WiFi Indoor Localization with CSI Fingerprinting-Based Random Forest. Sensors 2018, 18, 2869. [Google Scholar] [CrossRef] [Green Version]
- Goodfellow, I.; Bengio, Y.; Courville, A. Deep Learning; MIT Press: Cambridge, MA, USA, 2016. Available online: http://www.deeplearningbook.org (accessed on 25 January 2022).
- Bishop, C.M. Pattern Recognition and Machine Learning; Springer Science+Business Media: New York, NY, USA, 2006; pp. 137–143. [Google Scholar]
- Emmert-Streib, F.; Dehmer, M. High-Dimensional LASSO-Based Computational Regression Models: Regularization, Shrinkage, and Selection. Mach. Learn. Knowl. Extr. 2019, 1, 21. [Google Scholar] [CrossRef] [Green Version]
- Lee, Y.; Park, J.S. Generalized Nonlinear Least Squares Method for the Calibration of Complex Computer Code Using a Gaussian Process Surrogate. Entropy 2020, 22, 985. [Google Scholar] [CrossRef]
- Zhang, J.; Liao, Y.; Wang, S.; Han, J. Study on Driving Decision-Making Mechanism of Autonomous Vehicle Based on an Optimized Support Vector Machine Regression. Appl. Sci. 2018, 8, 13. [Google Scholar] [CrossRef] [Green Version]
- Schmelling, M. Averaging Correlated Data. Phys. Scr. 1995, 51, 676–679. [Google Scholar] [CrossRef]
- Deisenroth, M.P.; Fox, D.; Rasmussen, C.E. Gaussian Processes for Data-Efficient Learning in Robotics and Control. IEEE Trans. Pattern Anal. Mach. Intell. 2015, 37, 408–423. [Google Scholar] [CrossRef] [Green Version]
- Rasmussen, C.E.; Williams, C.K.I. Gaussian Processes for Machine Learning (Adaptive Computation and Machine Learning); MIT Press: Cambridge, MA, USA, 2005. [Google Scholar]
- Dümbgen, F.; Oeschger, C.; Kolundžija, M.; Scholefield, A.; Girardin, E.; Leuenberger, J.; Ayer, S. Multi-modal probabilistic indoor localization on a smartphone. In Proceedings of the International Conference on Indoor Positioning and Indoor Navigation (IPIN), Pisa, Italy, 30 September–3 October 2019; pp. 1–8. [Google Scholar] [CrossRef]


| Signal and Technology | Advantages | Disadvantages |
|---|---|---|
| WiFi RTT | Low Cost [44], Better Energy Performance [46] | Device Dependent Errors [11], Not Widely Reported [13] |
| UWB TWR | High Precision [32], Robustness Against Multi-path [47] | High Cost [31], Not Strong Transmission in All Directions [16], Power Limitations and Restrictions [9] |
| Reference | Signal and Technology | Method | Mean Positioning Error |
|---|---|---|---|
| [25] | WiFi RTT | GPR and LOS/NLOS detection | |
| [30] | WiFi RTT | Fingerprinting, scanning environment, and ANN | |
| [23] | WiFi RTT and RSS | Kalman Filter-based fusion of RTT and RSS | |
| [7] | WiFi CIR and RTT | Finding first LOS path using ANN | (Ranging) |
| [15] | WiFi RTT and accelerometer | CNN for fingerprinting, map information, and particle filter for data fusion in a low multi-path environment | |
| [17] | UWB sensor, WiFi RTT, and RSS | Intelligent UWB checkpoints and fusion of WiFi RSS-, RTT-based distances | |
| [44] | Using WiFi and UWB anchors and LTE | Weighting different base stations | |
| The proposed method | WiFi RTT and UWB TWR | Device calibration and RSS-based fusion |
| Algorithm | WiFi without Calibration | WiFi with Calibration | UWB | Proposed Method |
|---|---|---|---|---|
| RMSE (cm) | 362 | 152 | 156 | 94 |
| Mean Error (cm) | 318 | 134 | 120 | 87 |
| Maximum Error (cm) | 697 | 276 | 461 | 158 |
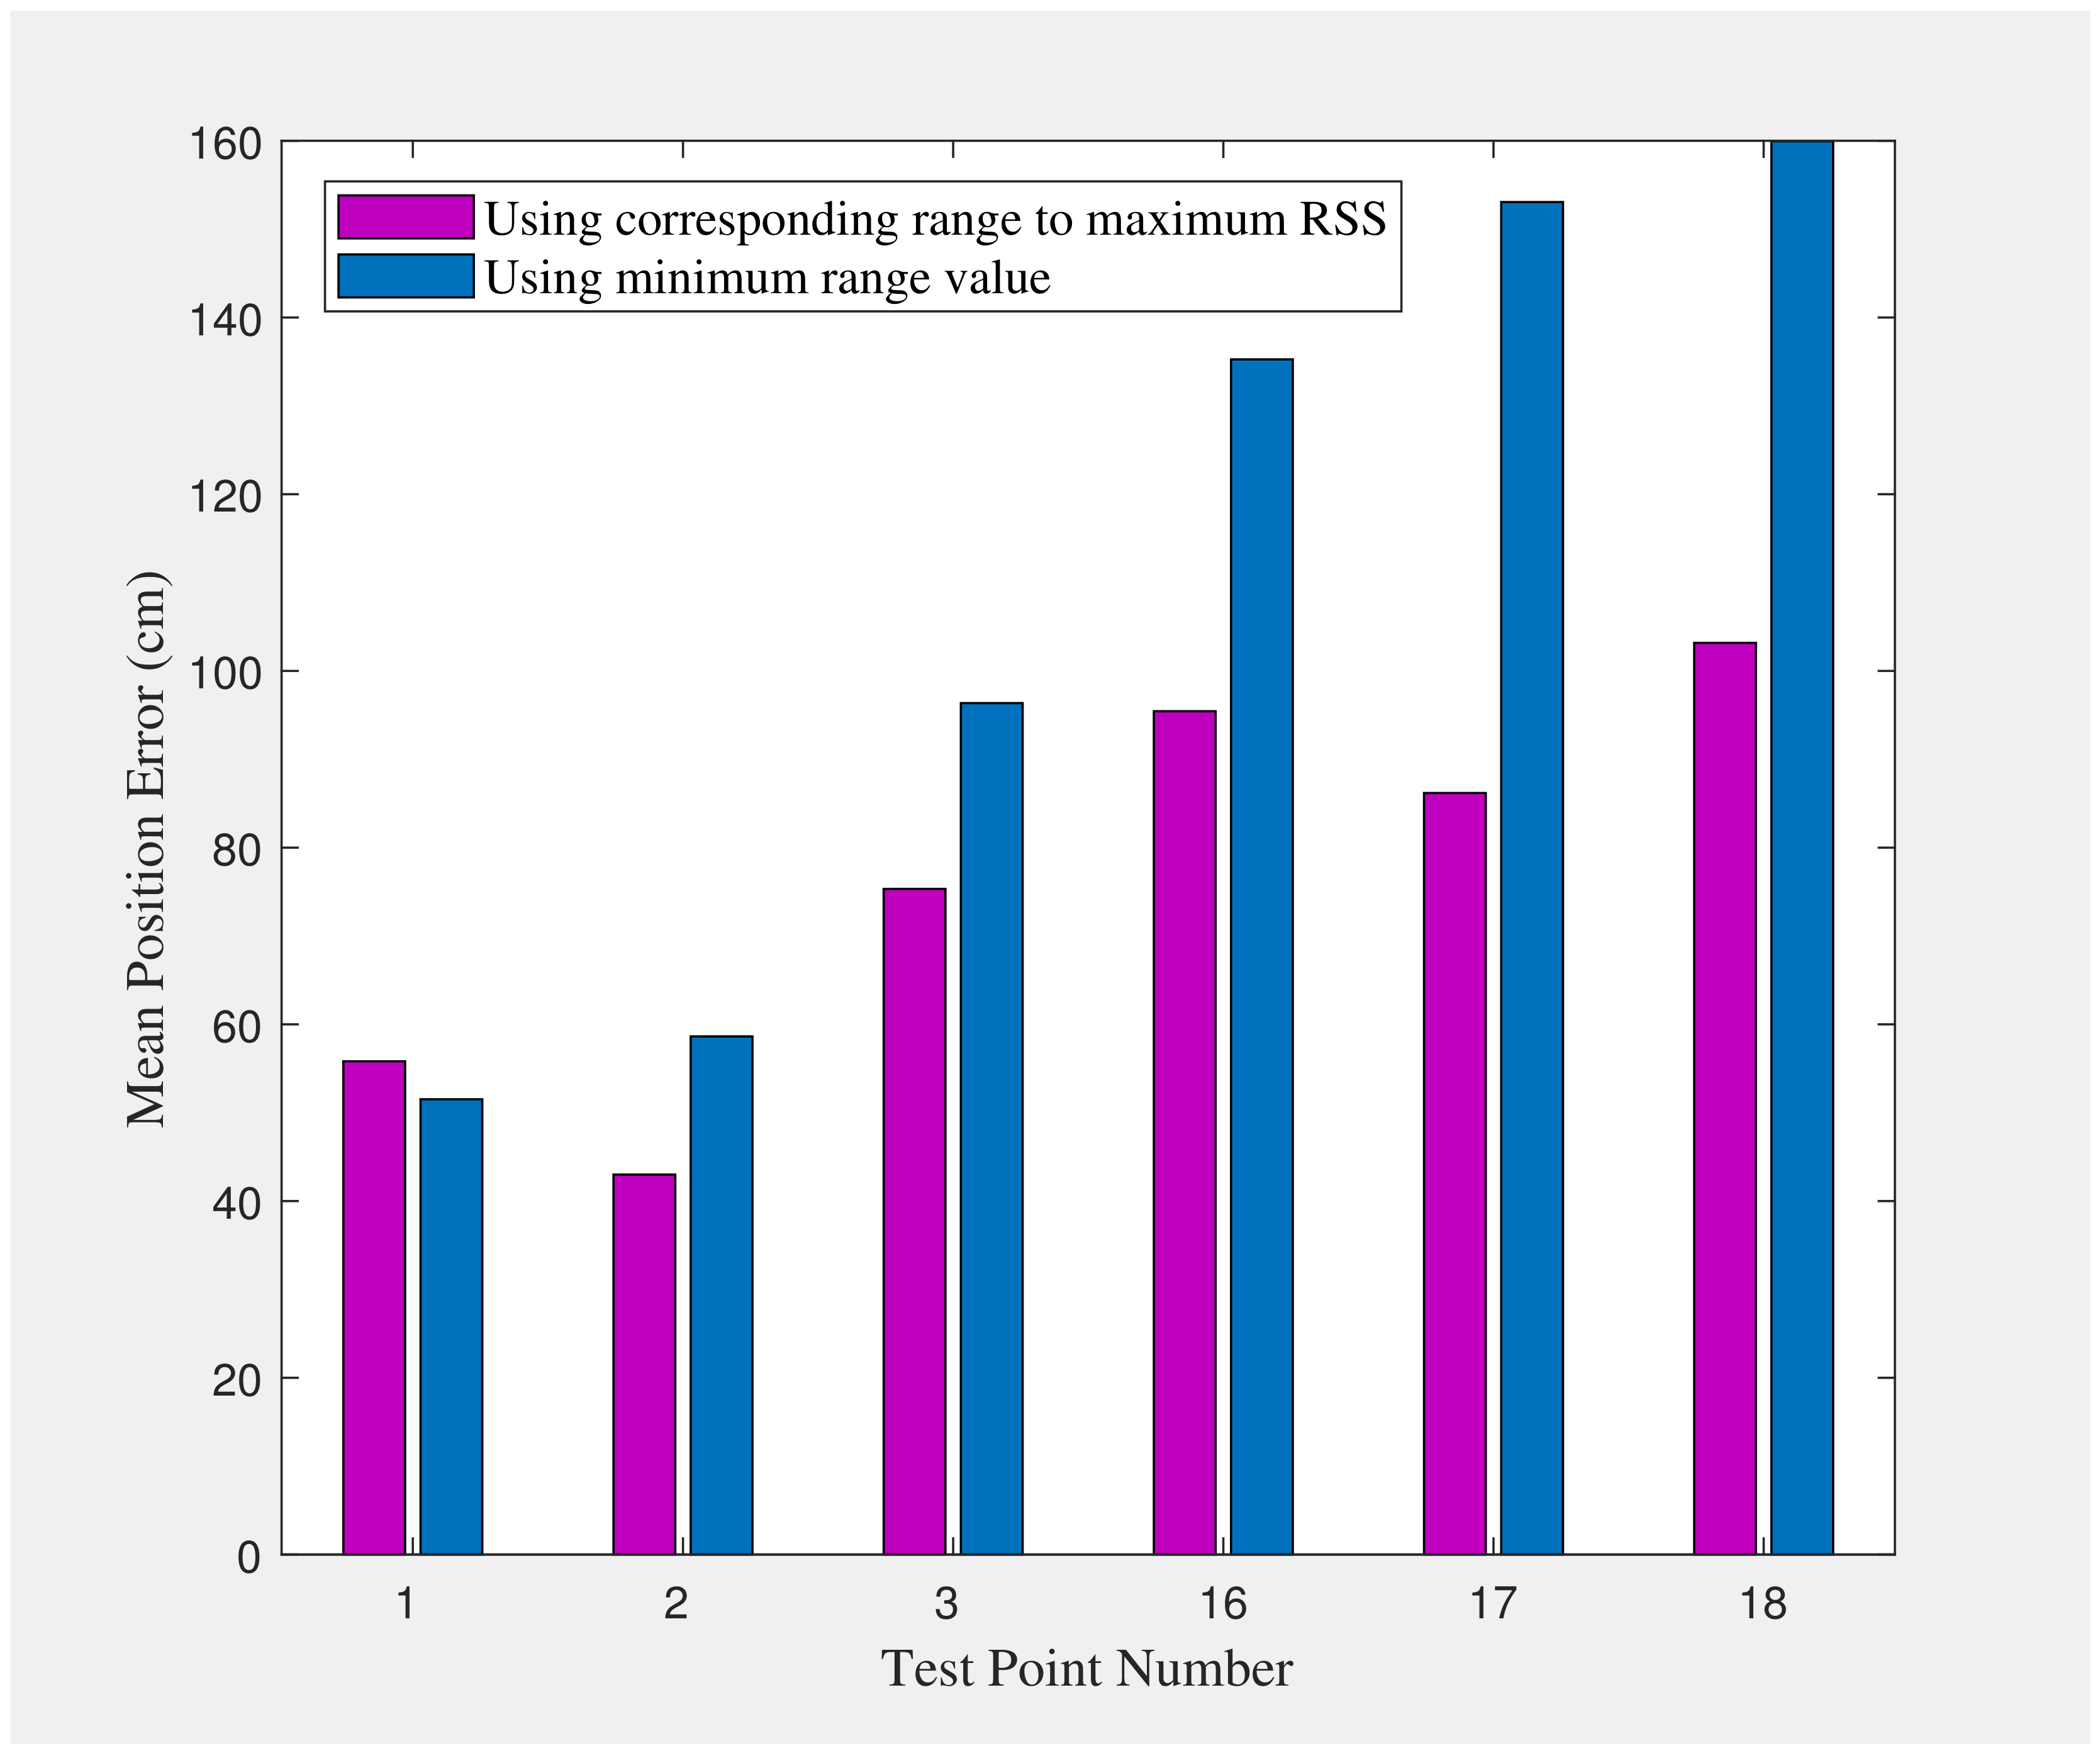
| Algorithm | Minimum Range | Average Range | Corresponding Range to Maximum RSS (Proposed) |
|---|---|---|---|
| RMSE (cm) | 116 | 135 | 94 |
| STD (cm) | 52 | 105 | 37 |
| Mean Error (cm) | 105 | 88 | 87 |
| Maximum Error (cm) | 220 | 448 | 158 |
Publisher’s Note: MDPI stays neutral with regard to jurisdictional claims in published maps and institutional affiliations. |
© 2022 by the authors. Licensee MDPI, Basel, Switzerland. This article is an open access article distributed under the terms and conditions of the Creative Commons Attribution (CC BY) license (https://creativecommons.org/licenses/by/4.0/).
Share and Cite
Kia, G.; Ruotsalainen, L.; Talvitie, J. Toward Accurate Indoor Positioning: An RSS-Based Fusion of UWB and Machine-Learning-Enhanced WiFi. Sensors 2022, 22, 3204. https://doi.org/10.3390/s22093204
Kia G, Ruotsalainen L, Talvitie J. Toward Accurate Indoor Positioning: An RSS-Based Fusion of UWB and Machine-Learning-Enhanced WiFi. Sensors. 2022; 22(9):3204. https://doi.org/10.3390/s22093204
Chicago/Turabian StyleKia, Ghazaleh, Laura Ruotsalainen, and Jukka Talvitie. 2022. "Toward Accurate Indoor Positioning: An RSS-Based Fusion of UWB and Machine-Learning-Enhanced WiFi" Sensors 22, no. 9: 3204. https://doi.org/10.3390/s22093204
APA StyleKia, G., Ruotsalainen, L., & Talvitie, J. (2022). Toward Accurate Indoor Positioning: An RSS-Based Fusion of UWB and Machine-Learning-Enhanced WiFi. Sensors, 22(9), 3204. https://doi.org/10.3390/s22093204