Author Contributions
Conceptualization, S.I. and M.F.K.; validation, S.I.; formal analysis, M.P.M.; investigation, J.J., A.A. and M.F.K.; data curation, S.I. and M.P.M.; writing—original draft preparation, S.I.; writing—review and editing, L.Z., M.Y.S. and M.F.K..; visualization, M.P.M.; supervision, L.Z., J.J., M.Y.S., A.A. and M.F.K.; project administration, M.F.K.; funding acquisition, M.F.K. All authors have read and agreed to the published version of the manuscript.
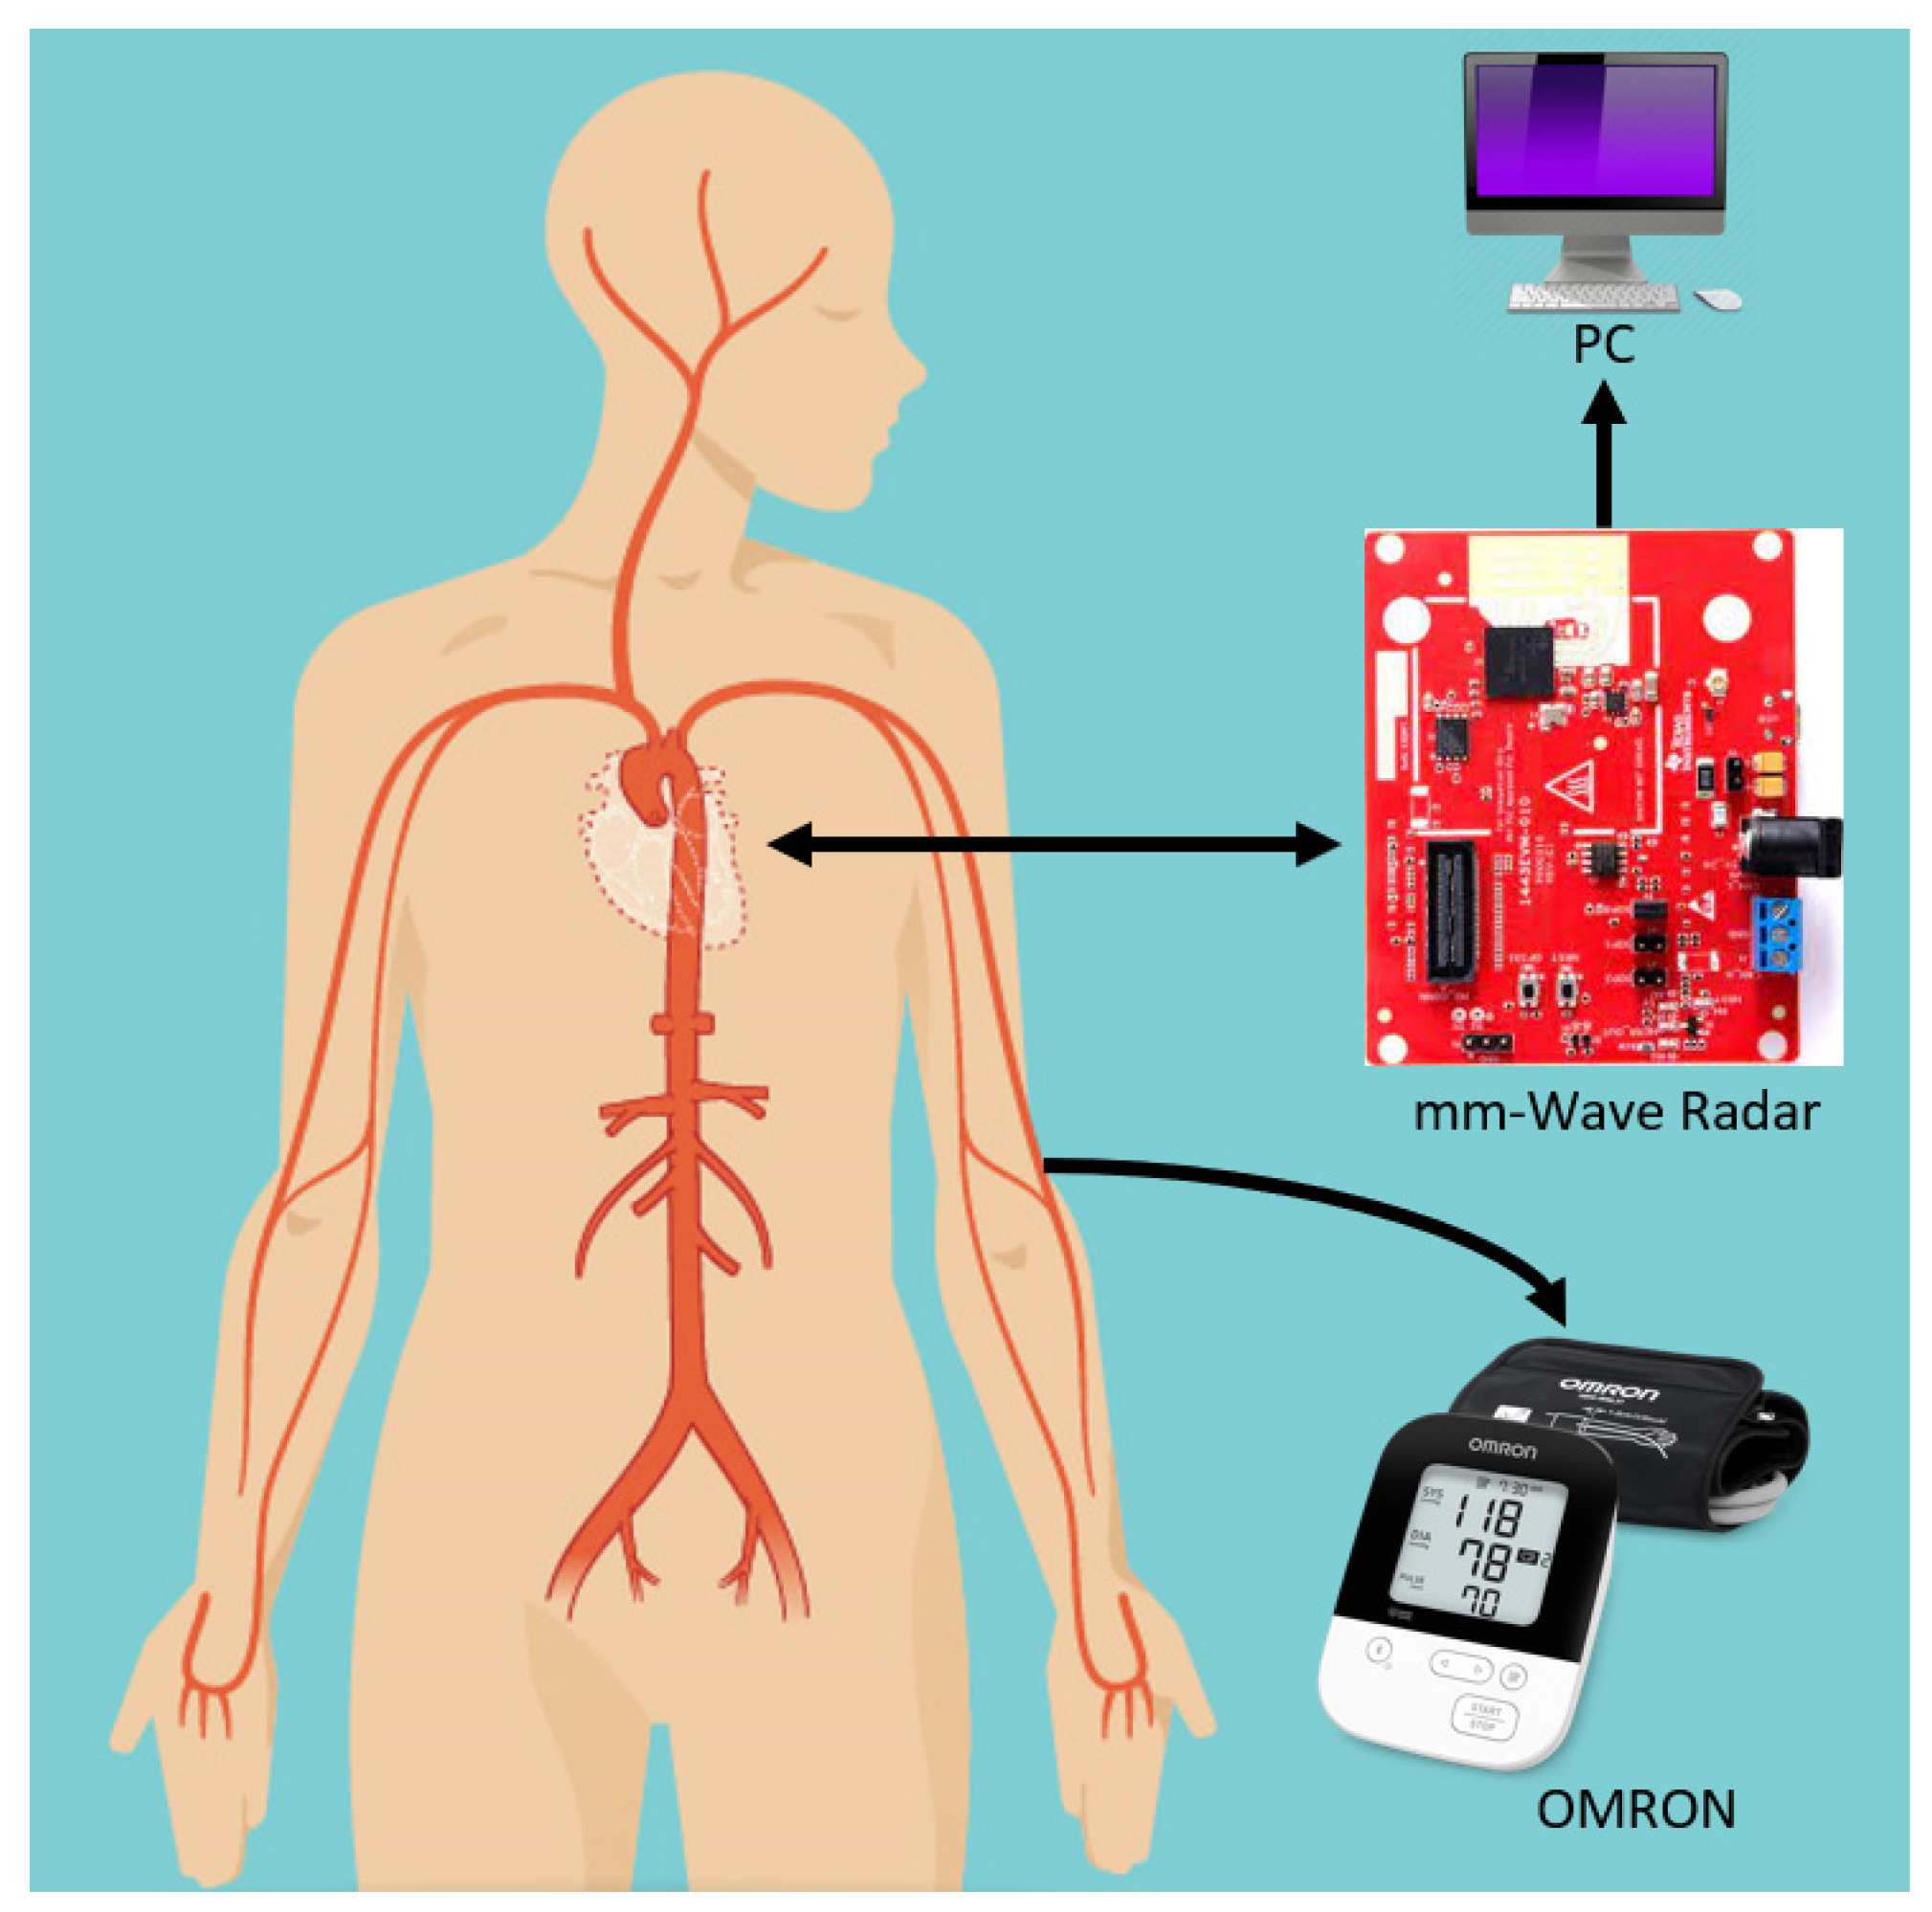
Figure 1.
Schematic of the proposed mm-wave radar system: an mm-wave radar is fixed at front of the subject while an Omron sphygmomanometer is attached, which simultaneously extracts pulse readings for verification. The radar data are recorded on a PC through a USB connection.
Figure 1.
Schematic of the proposed mm-wave radar system: an mm-wave radar is fixed at front of the subject while an Omron sphygmomanometer is attached, which simultaneously extracts pulse readings for verification. The radar data are recorded on a PC through a USB connection.
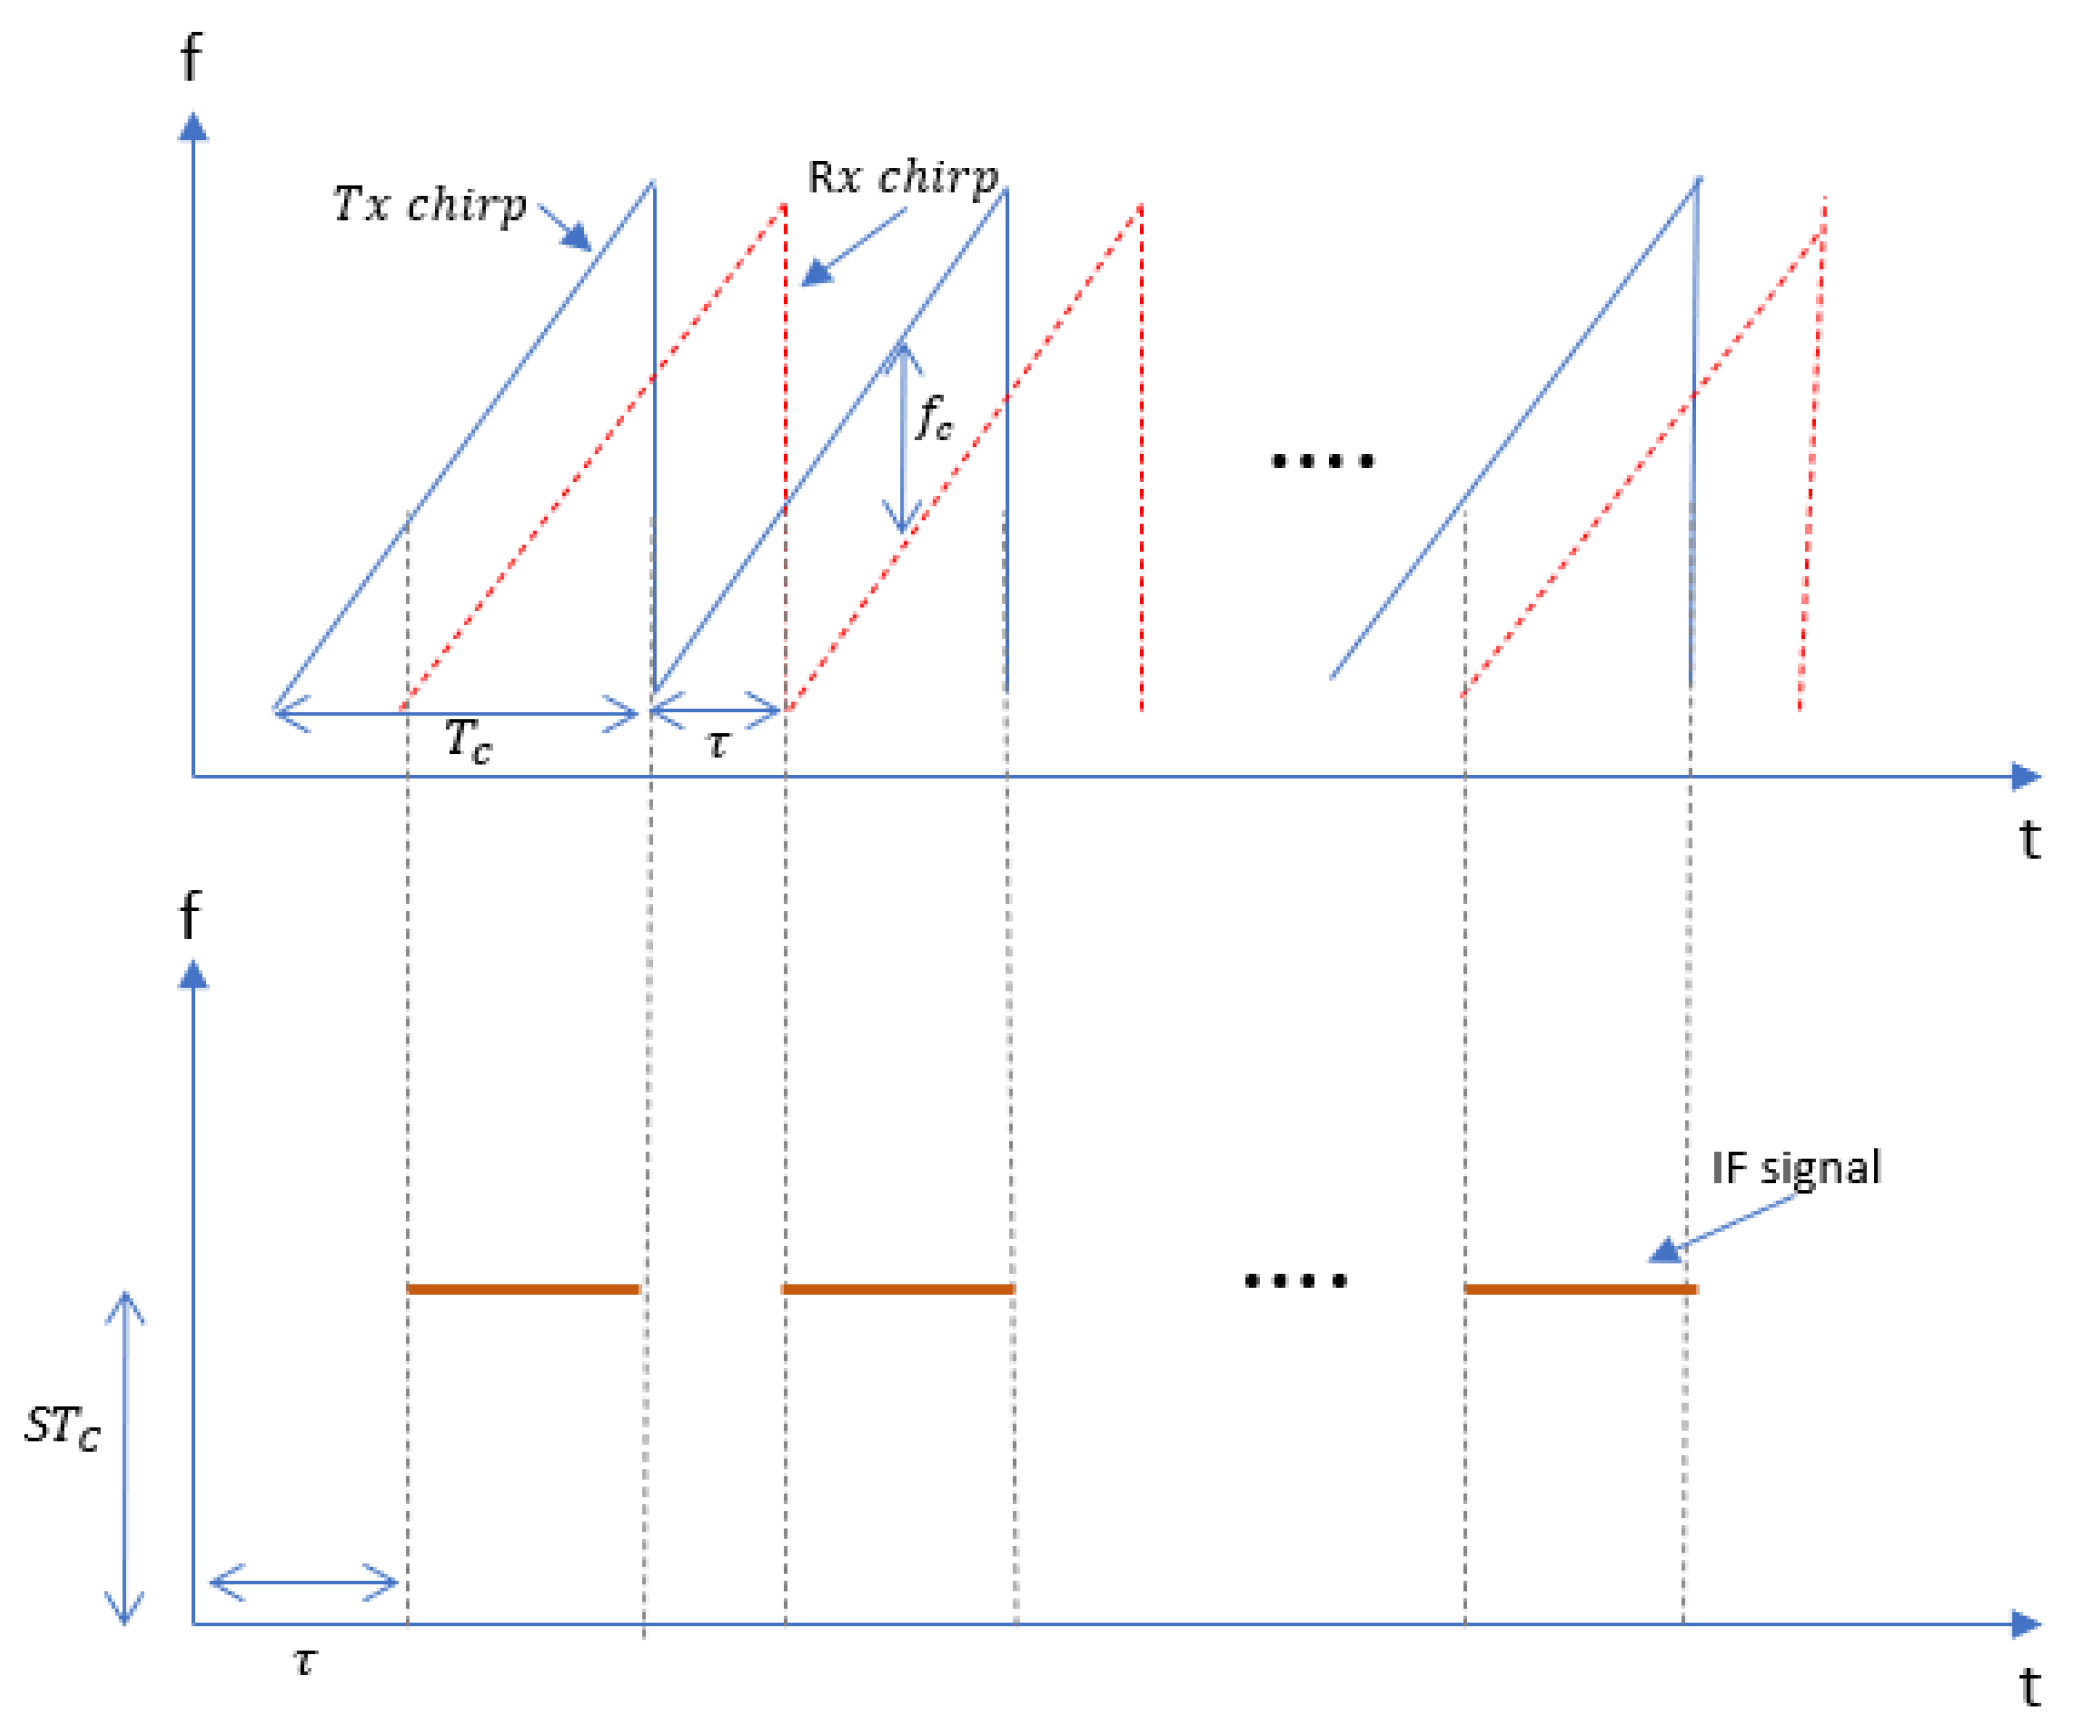
Figure 2.
Transmitted and received chirp signals where each chirp is a sinusoidal signal with a slope S and time delay between transmitted and received chirp when the sweeping bandwidth is S.
Figure 2.
Transmitted and received chirp signals where each chirp is a sinusoidal signal with a slope S and time delay between transmitted and received chirp when the sweeping bandwidth is S.
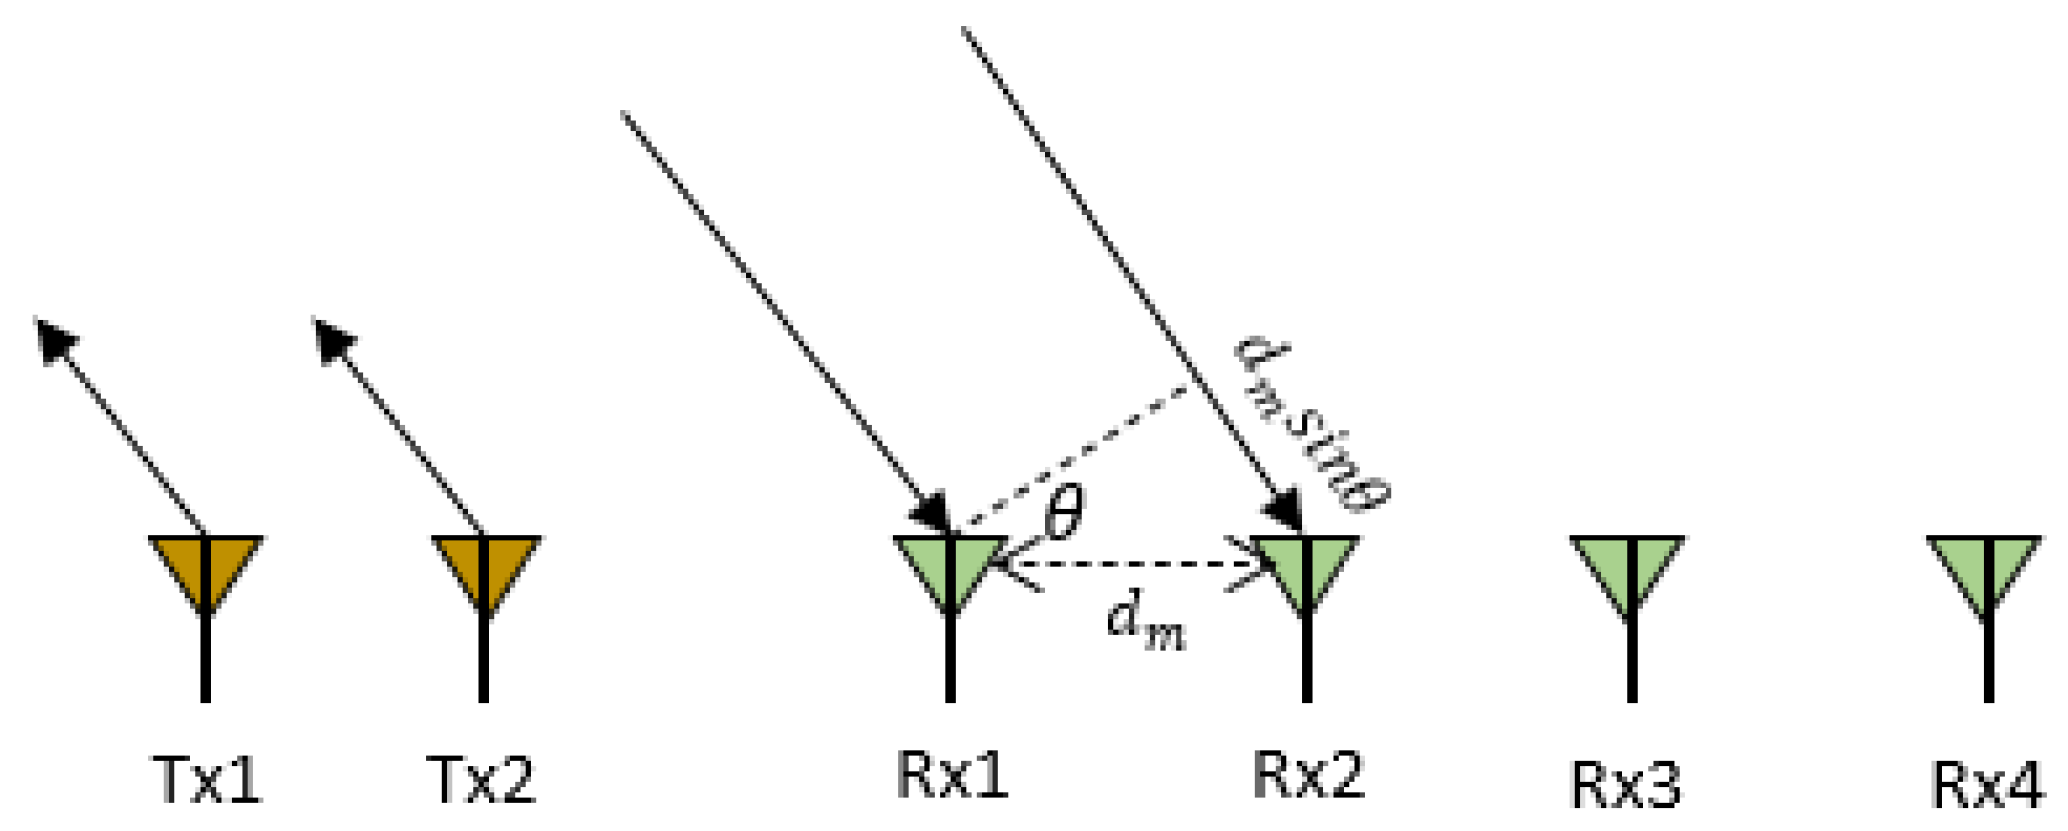
Figure 3.
A MIMO radar with two transmitting antennas (Tx) and four receiving antennas (Rx) where distance between two receiving antennas is and is the angle of arrival.
Figure 3.
A MIMO radar with two transmitting antennas (Tx) and four receiving antennas (Rx) where distance between two receiving antennas is and is the angle of arrival.
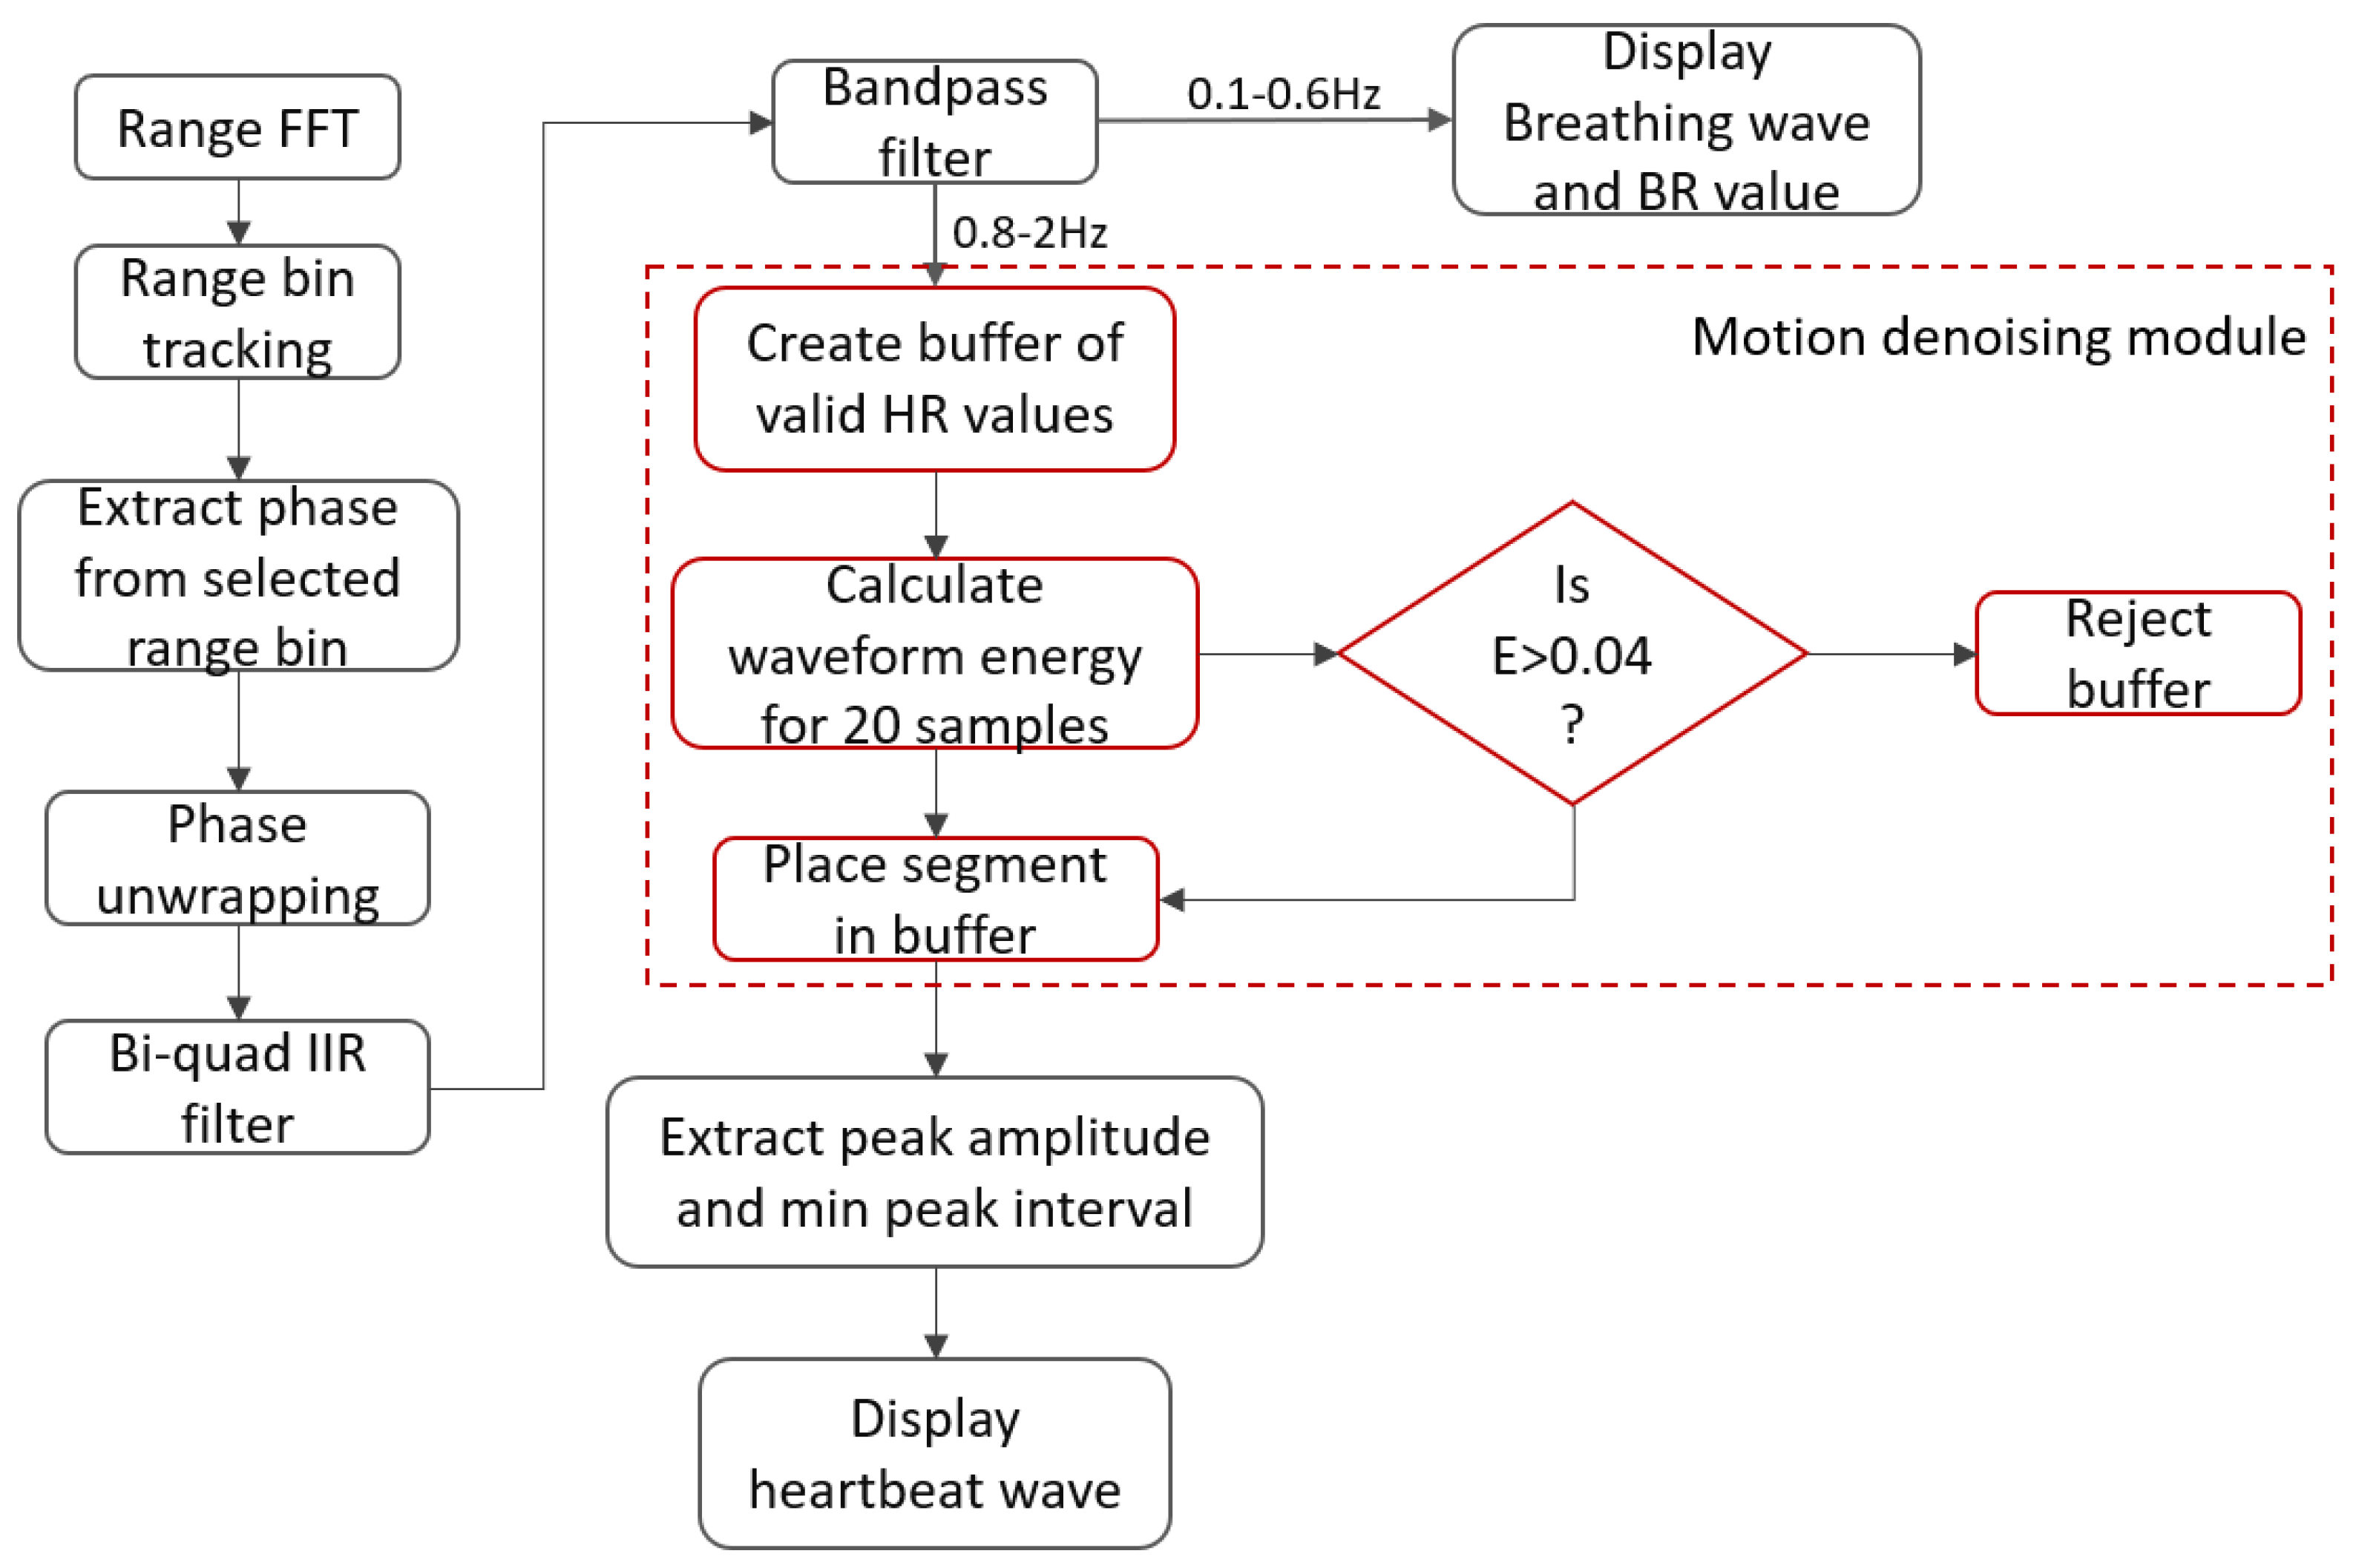
Figure 4.
Signal processing workflow: after applying the range FFT, for a single range bin, the angle FFTs are computed, upon which the phase shift is used to extract the heartbeat and breathing waves.
Figure 4.
Signal processing workflow: after applying the range FFT, for a single range bin, the angle FFTs are computed, upon which the phase shift is used to extract the heartbeat and breathing waves.
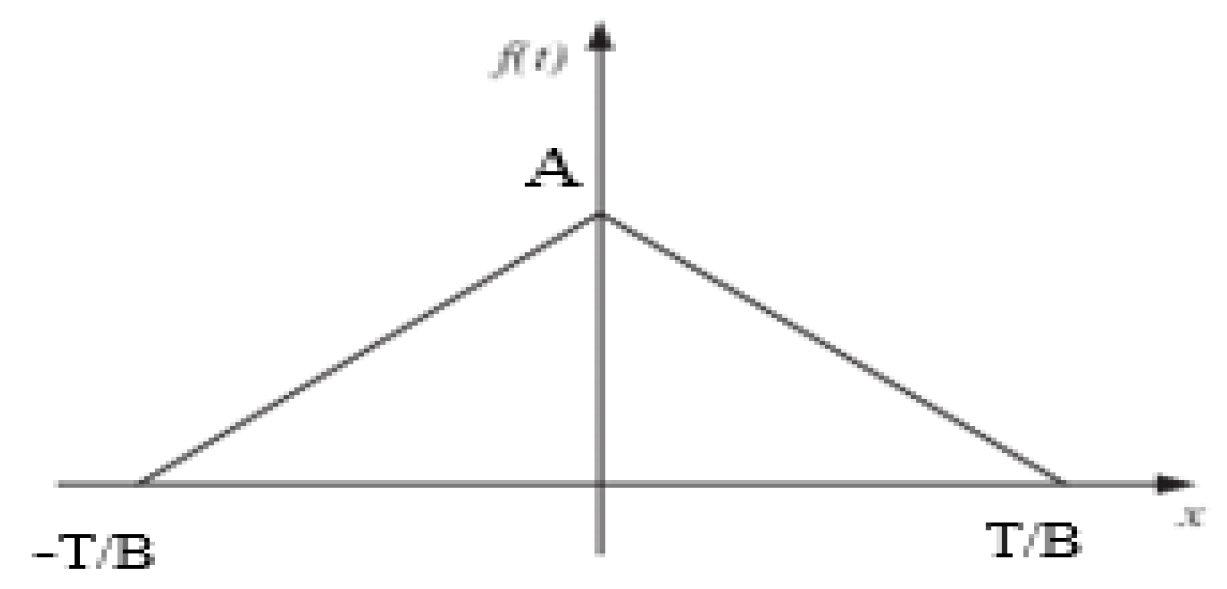
Figure 5.
Symmetric triangular wave function to model the QRS components of an ECG signal.
Figure 5.
Symmetric triangular wave function to model the QRS components of an ECG signal.
Figure 6.
Predict the onset of arrhythmia based on statistical features extracted from the phase signals of a localized range bin using an FMCW radar.
Figure 6.
Predict the onset of arrhythmia based on statistical features extracted from the phase signals of a localized range bin using an FMCW radar.
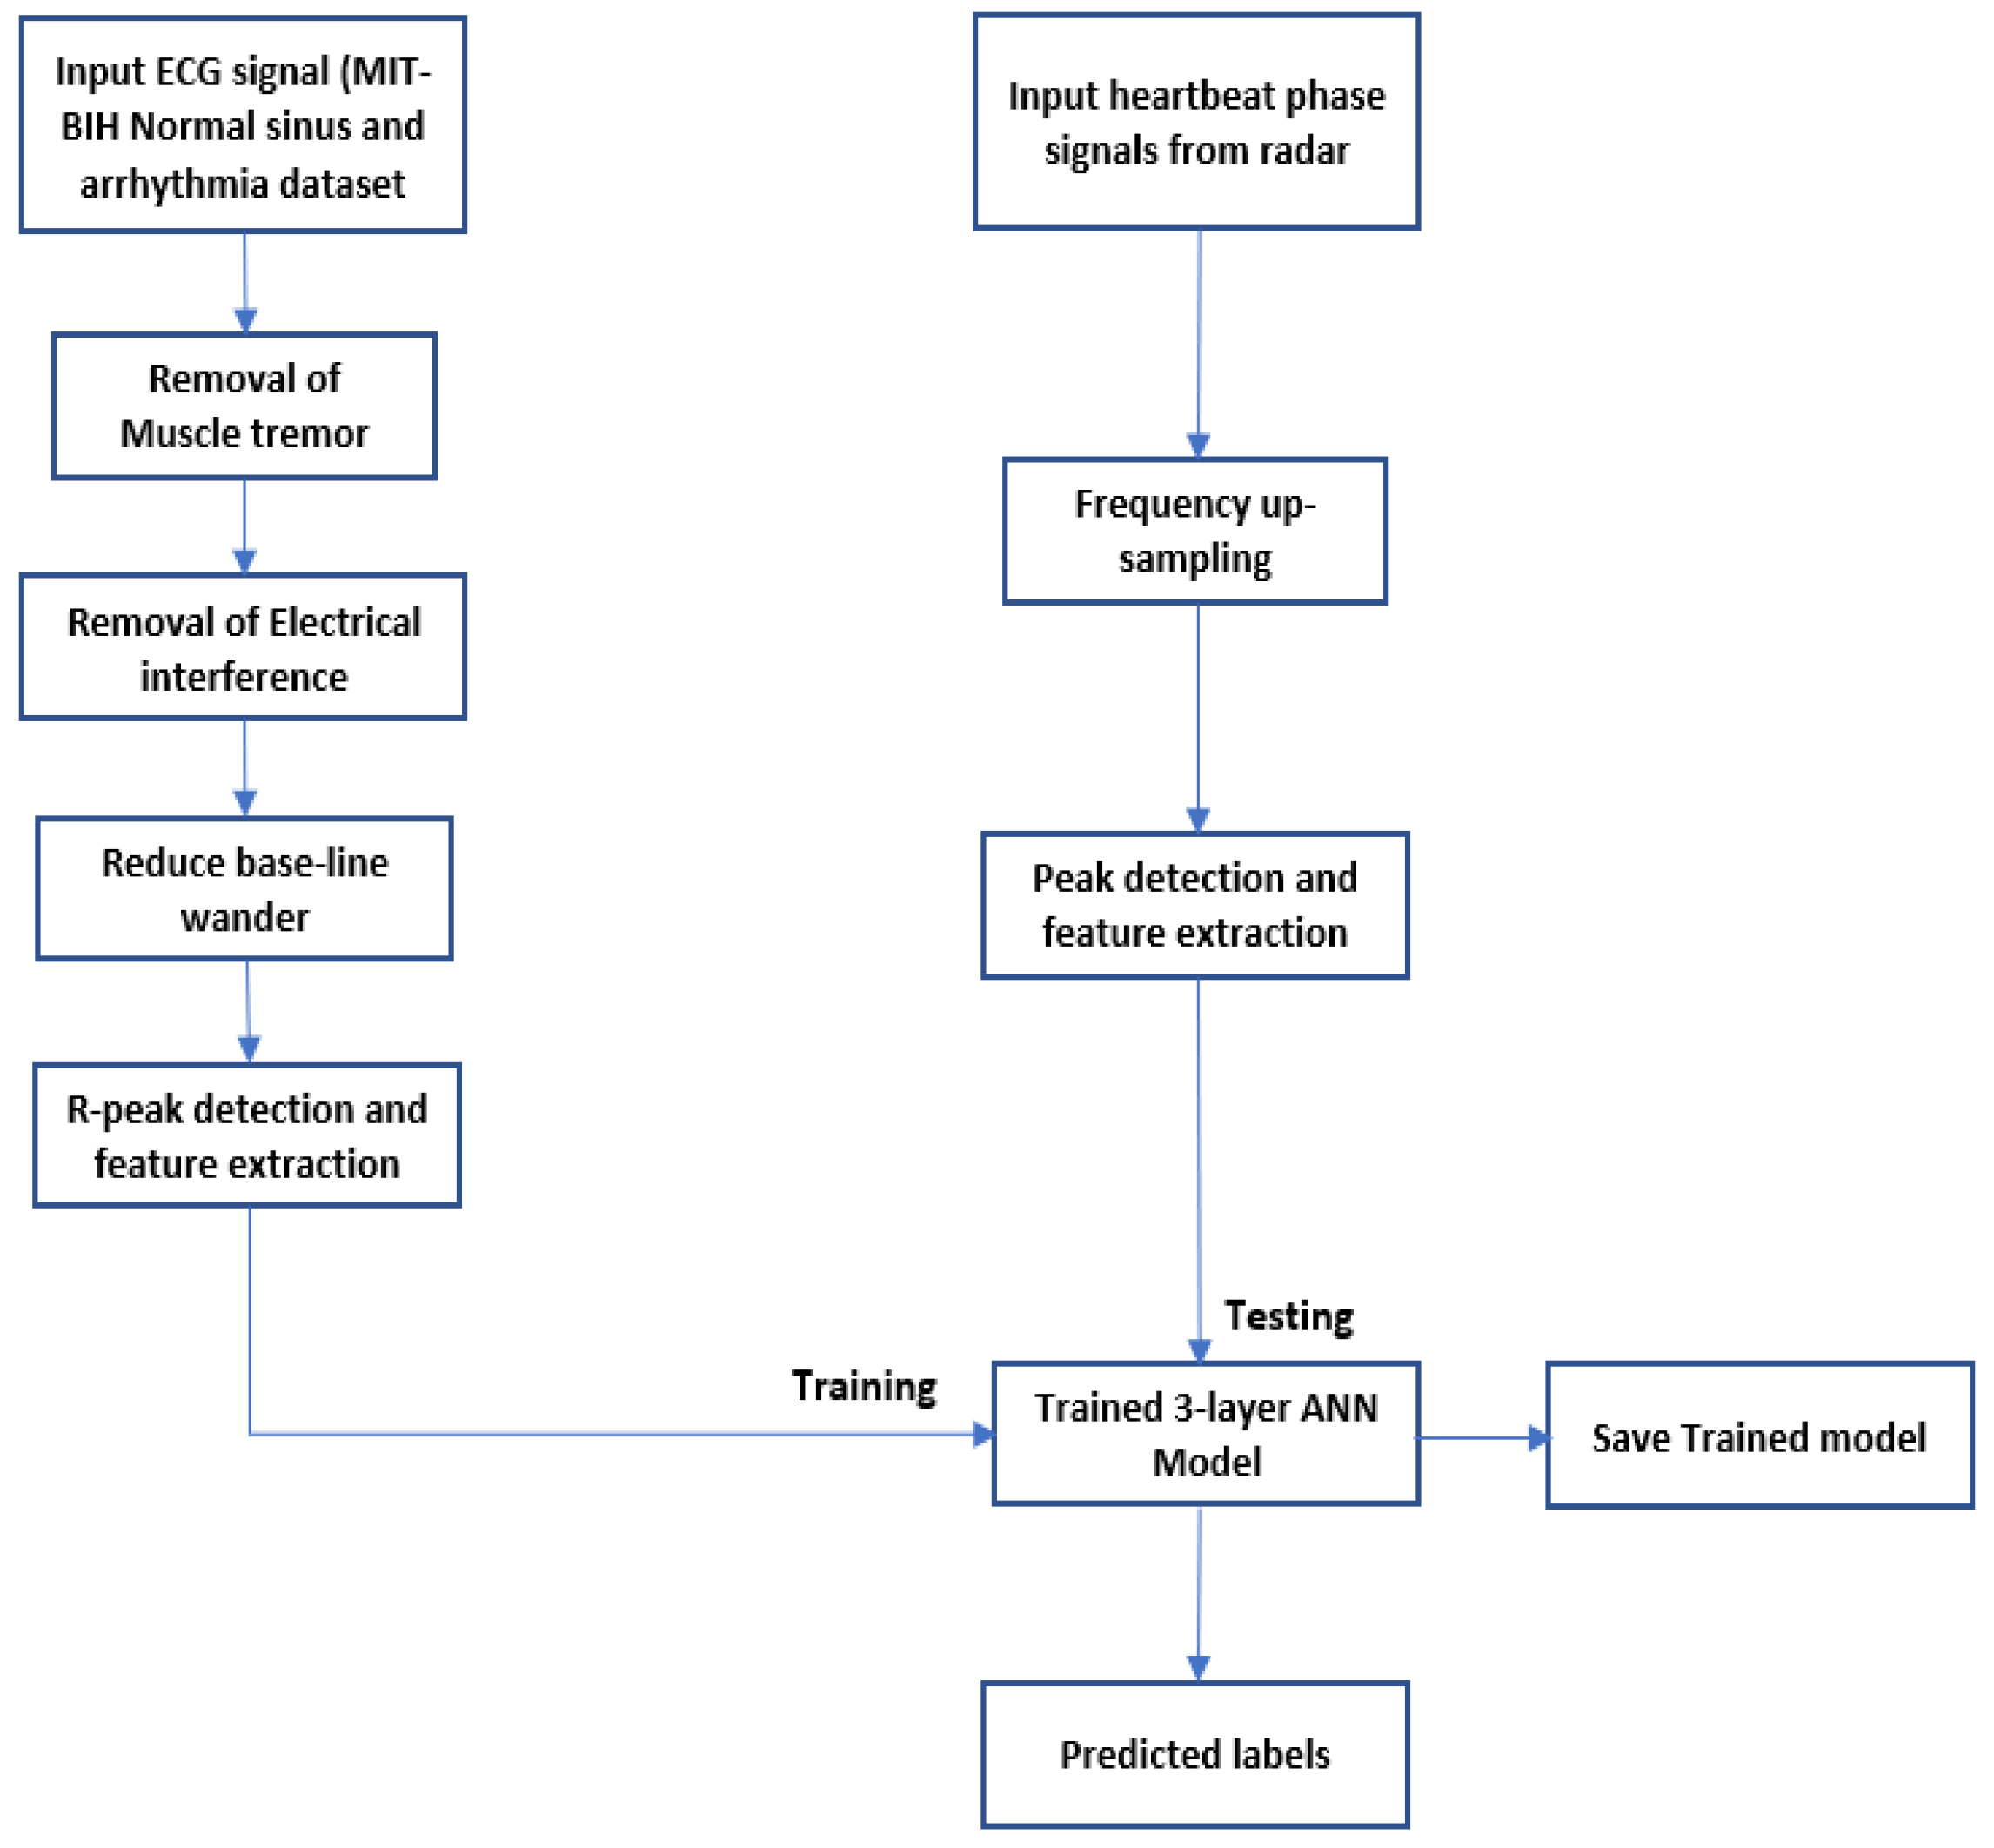
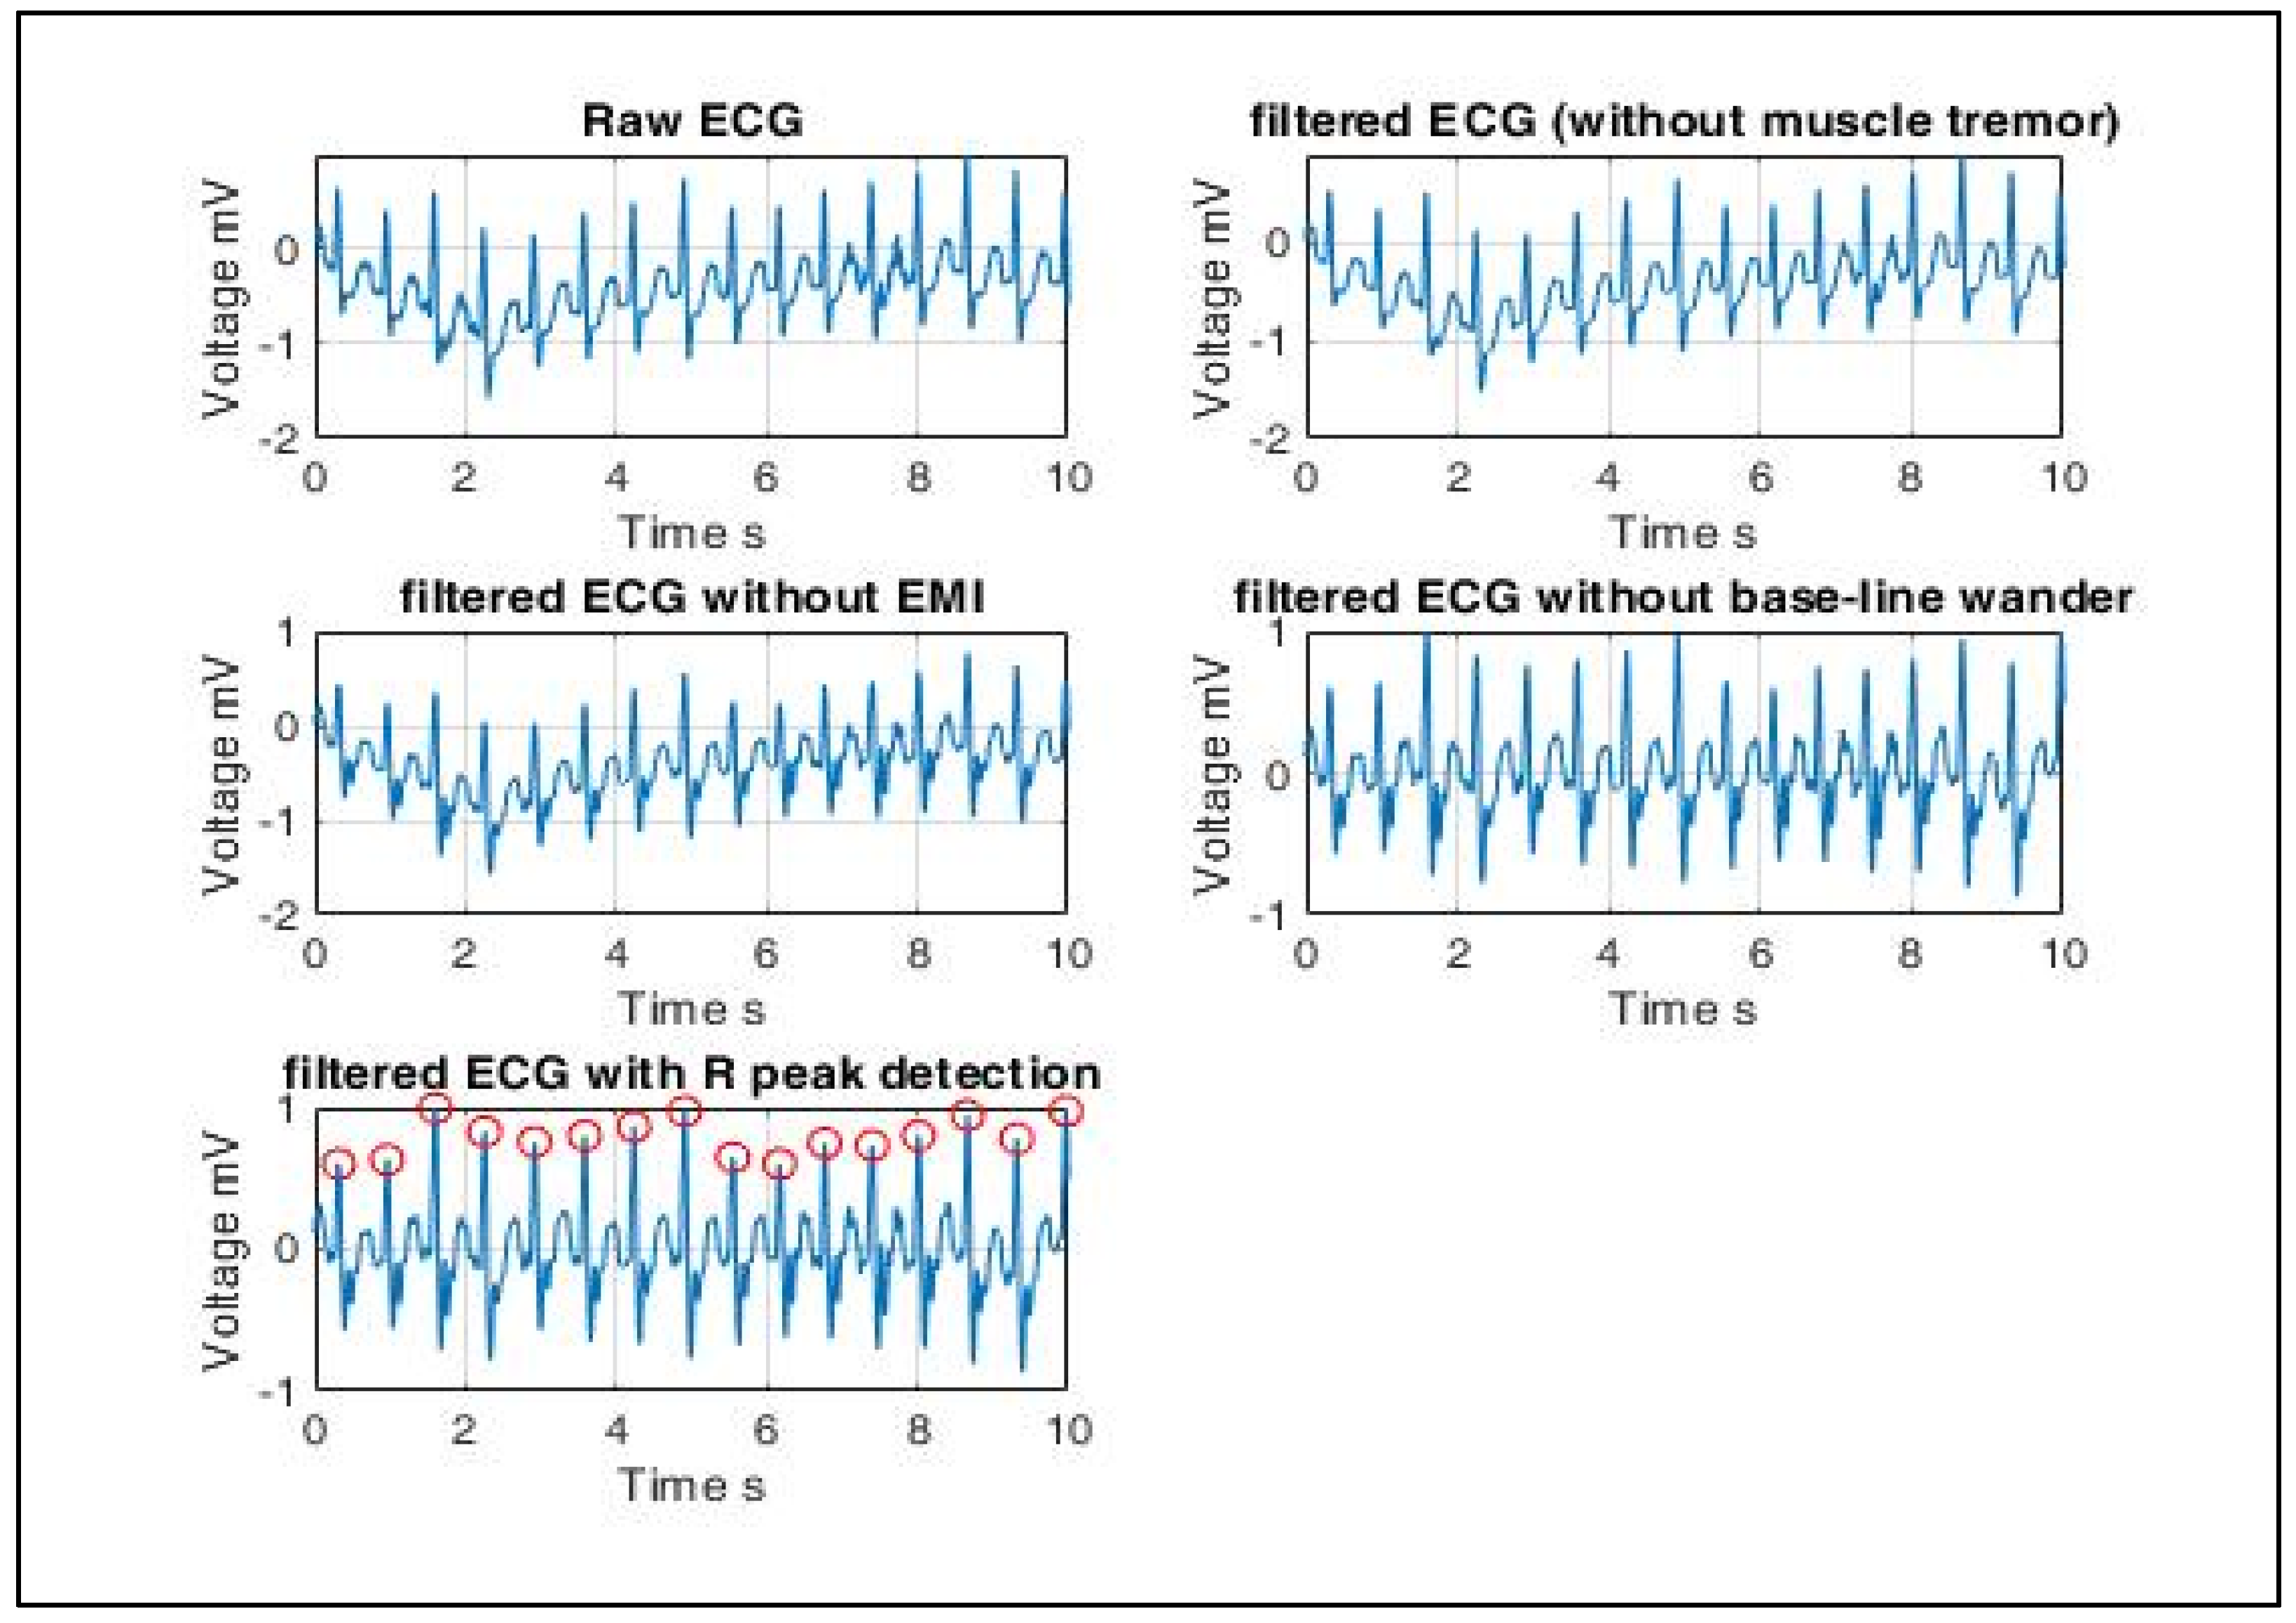
Figure 7.
ECG signal pre-processing (left to right): ECG signals are extracted using electrodes mounted on the body. Hence, some artifacts are filtered out before statistical features can be extracted from the ECG signal database. Artifacts include muscle tremor, electromagnetic interference (EMI) and base-line wander. Muscle tremor artifacts caused due to sudden body movements are high-frequency signals (30~300 Hz) that are removed by Butterworth low-pass filters. The 50 Hz electromagnetic interference is suppressed by a Butterworth band-stop filter. Baseline wander is an ultra-low frequency signal that ranges between 0 and 0.8 Hz that can be eliminated using a high-pass filter. Finally, the resultant R peaks of a QRS complex are detected, and only RR interval-based features are extracted since the radar-generated heartbeat phase signals are QRS equivalent signals.
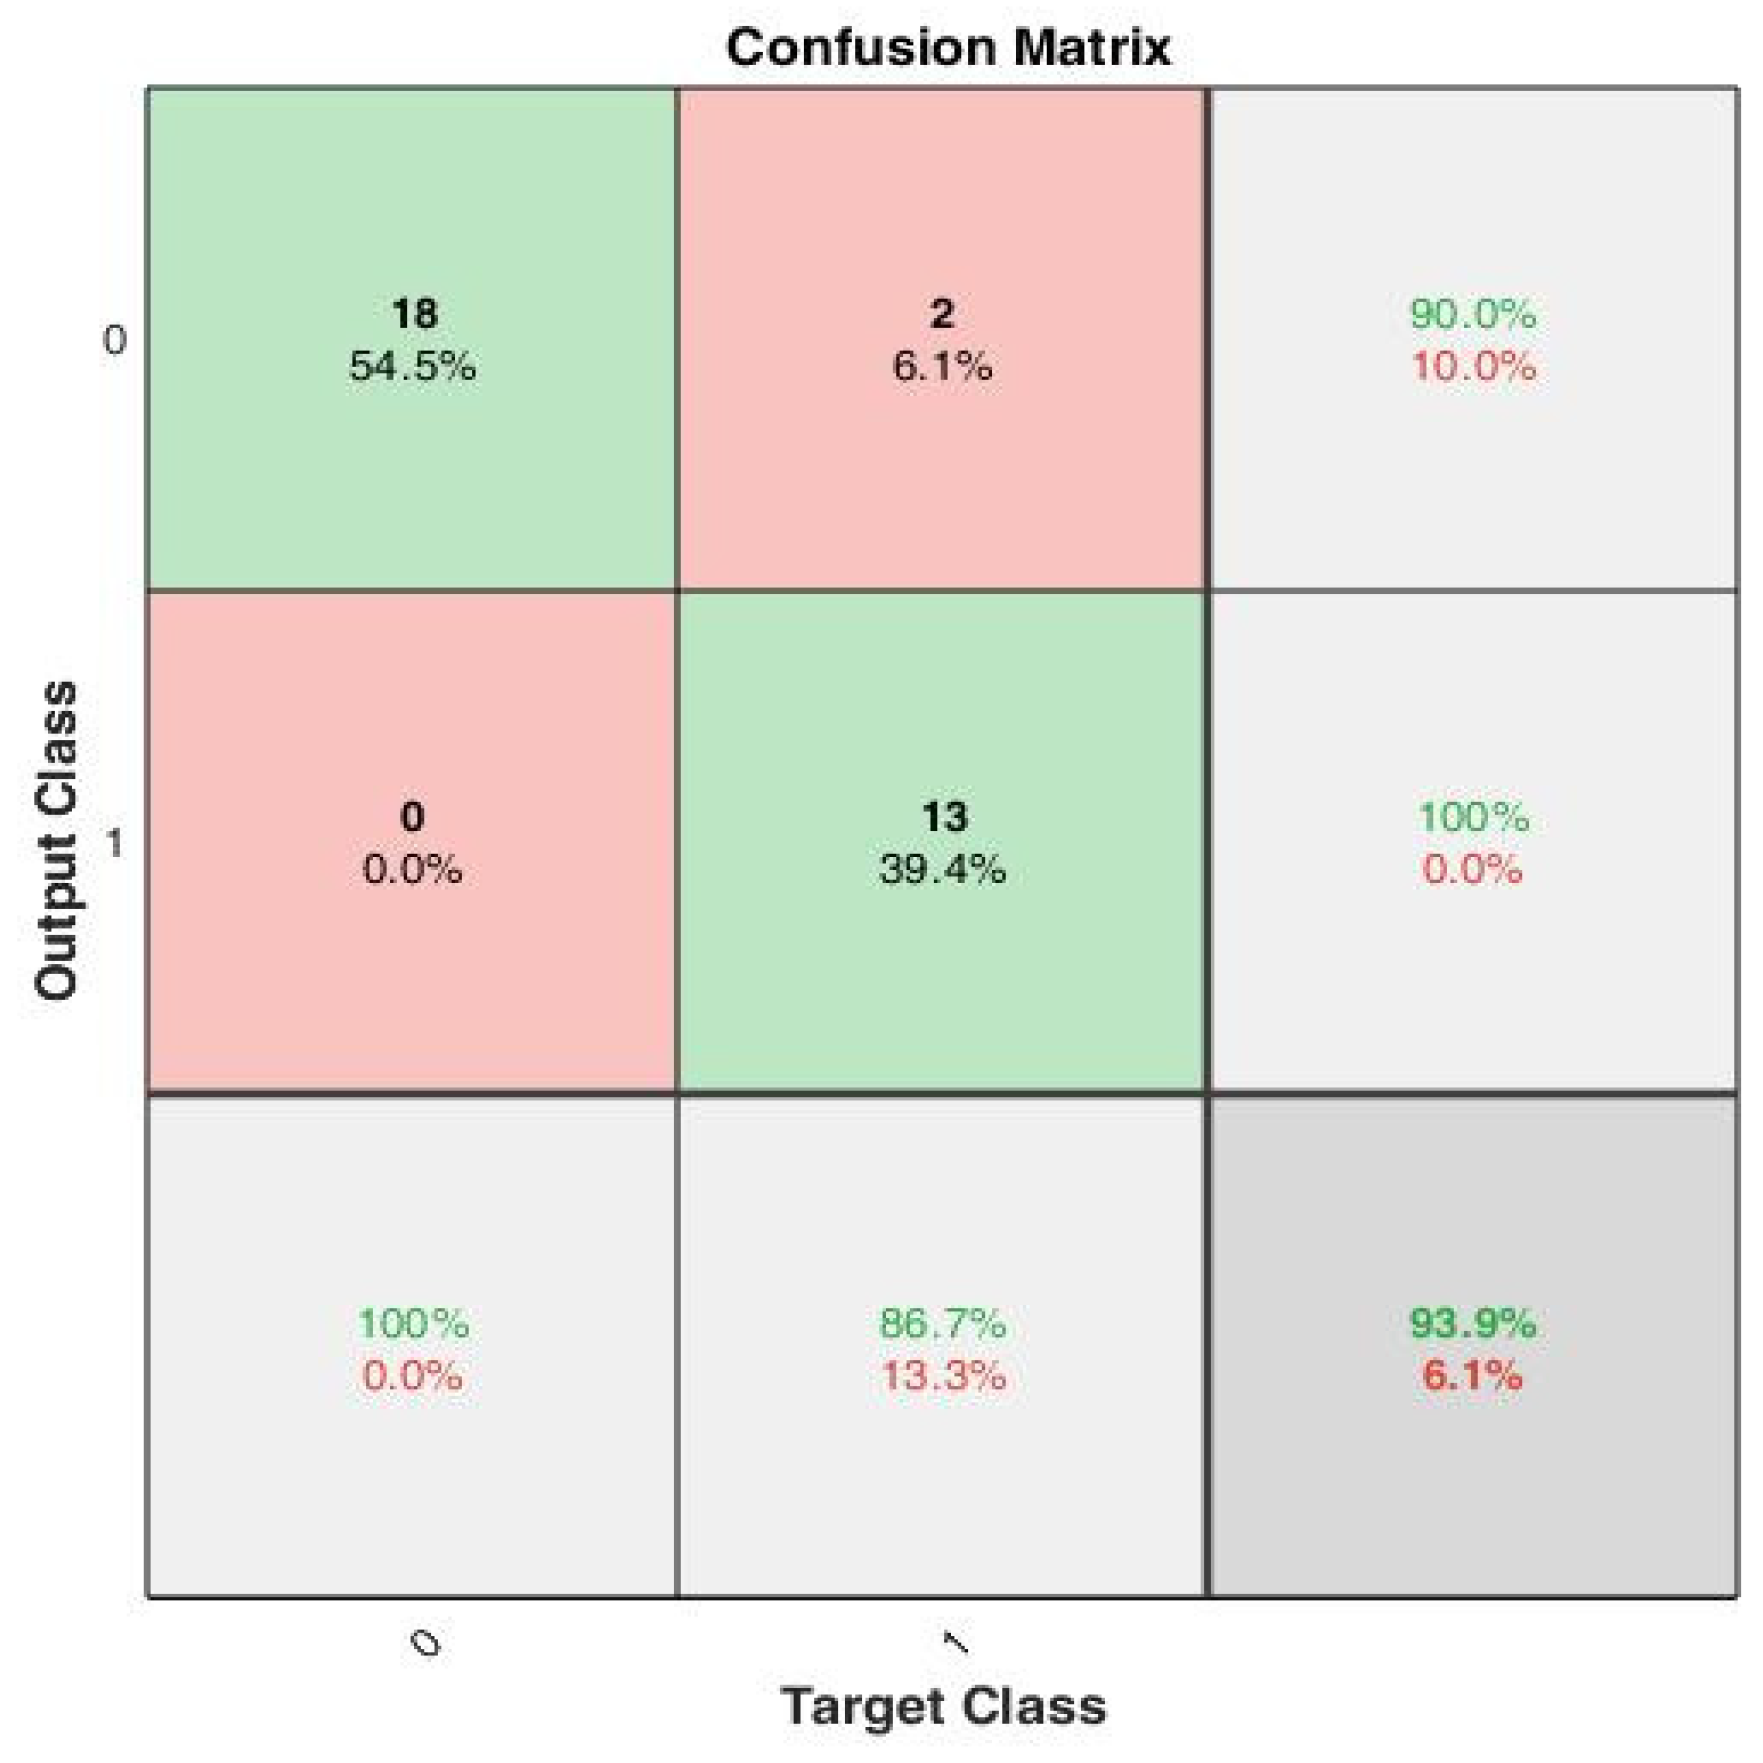
Figure 8.
A confusion matrix that summarizes the model performance with true positivity rate and true negativity rate, with accuracy of 100%, 90% and 93.9%, respectively.
Figure 8.
A confusion matrix that summarizes the model performance with true positivity rate and true negativity rate, with accuracy of 100%, 90% and 93.9%, respectively.
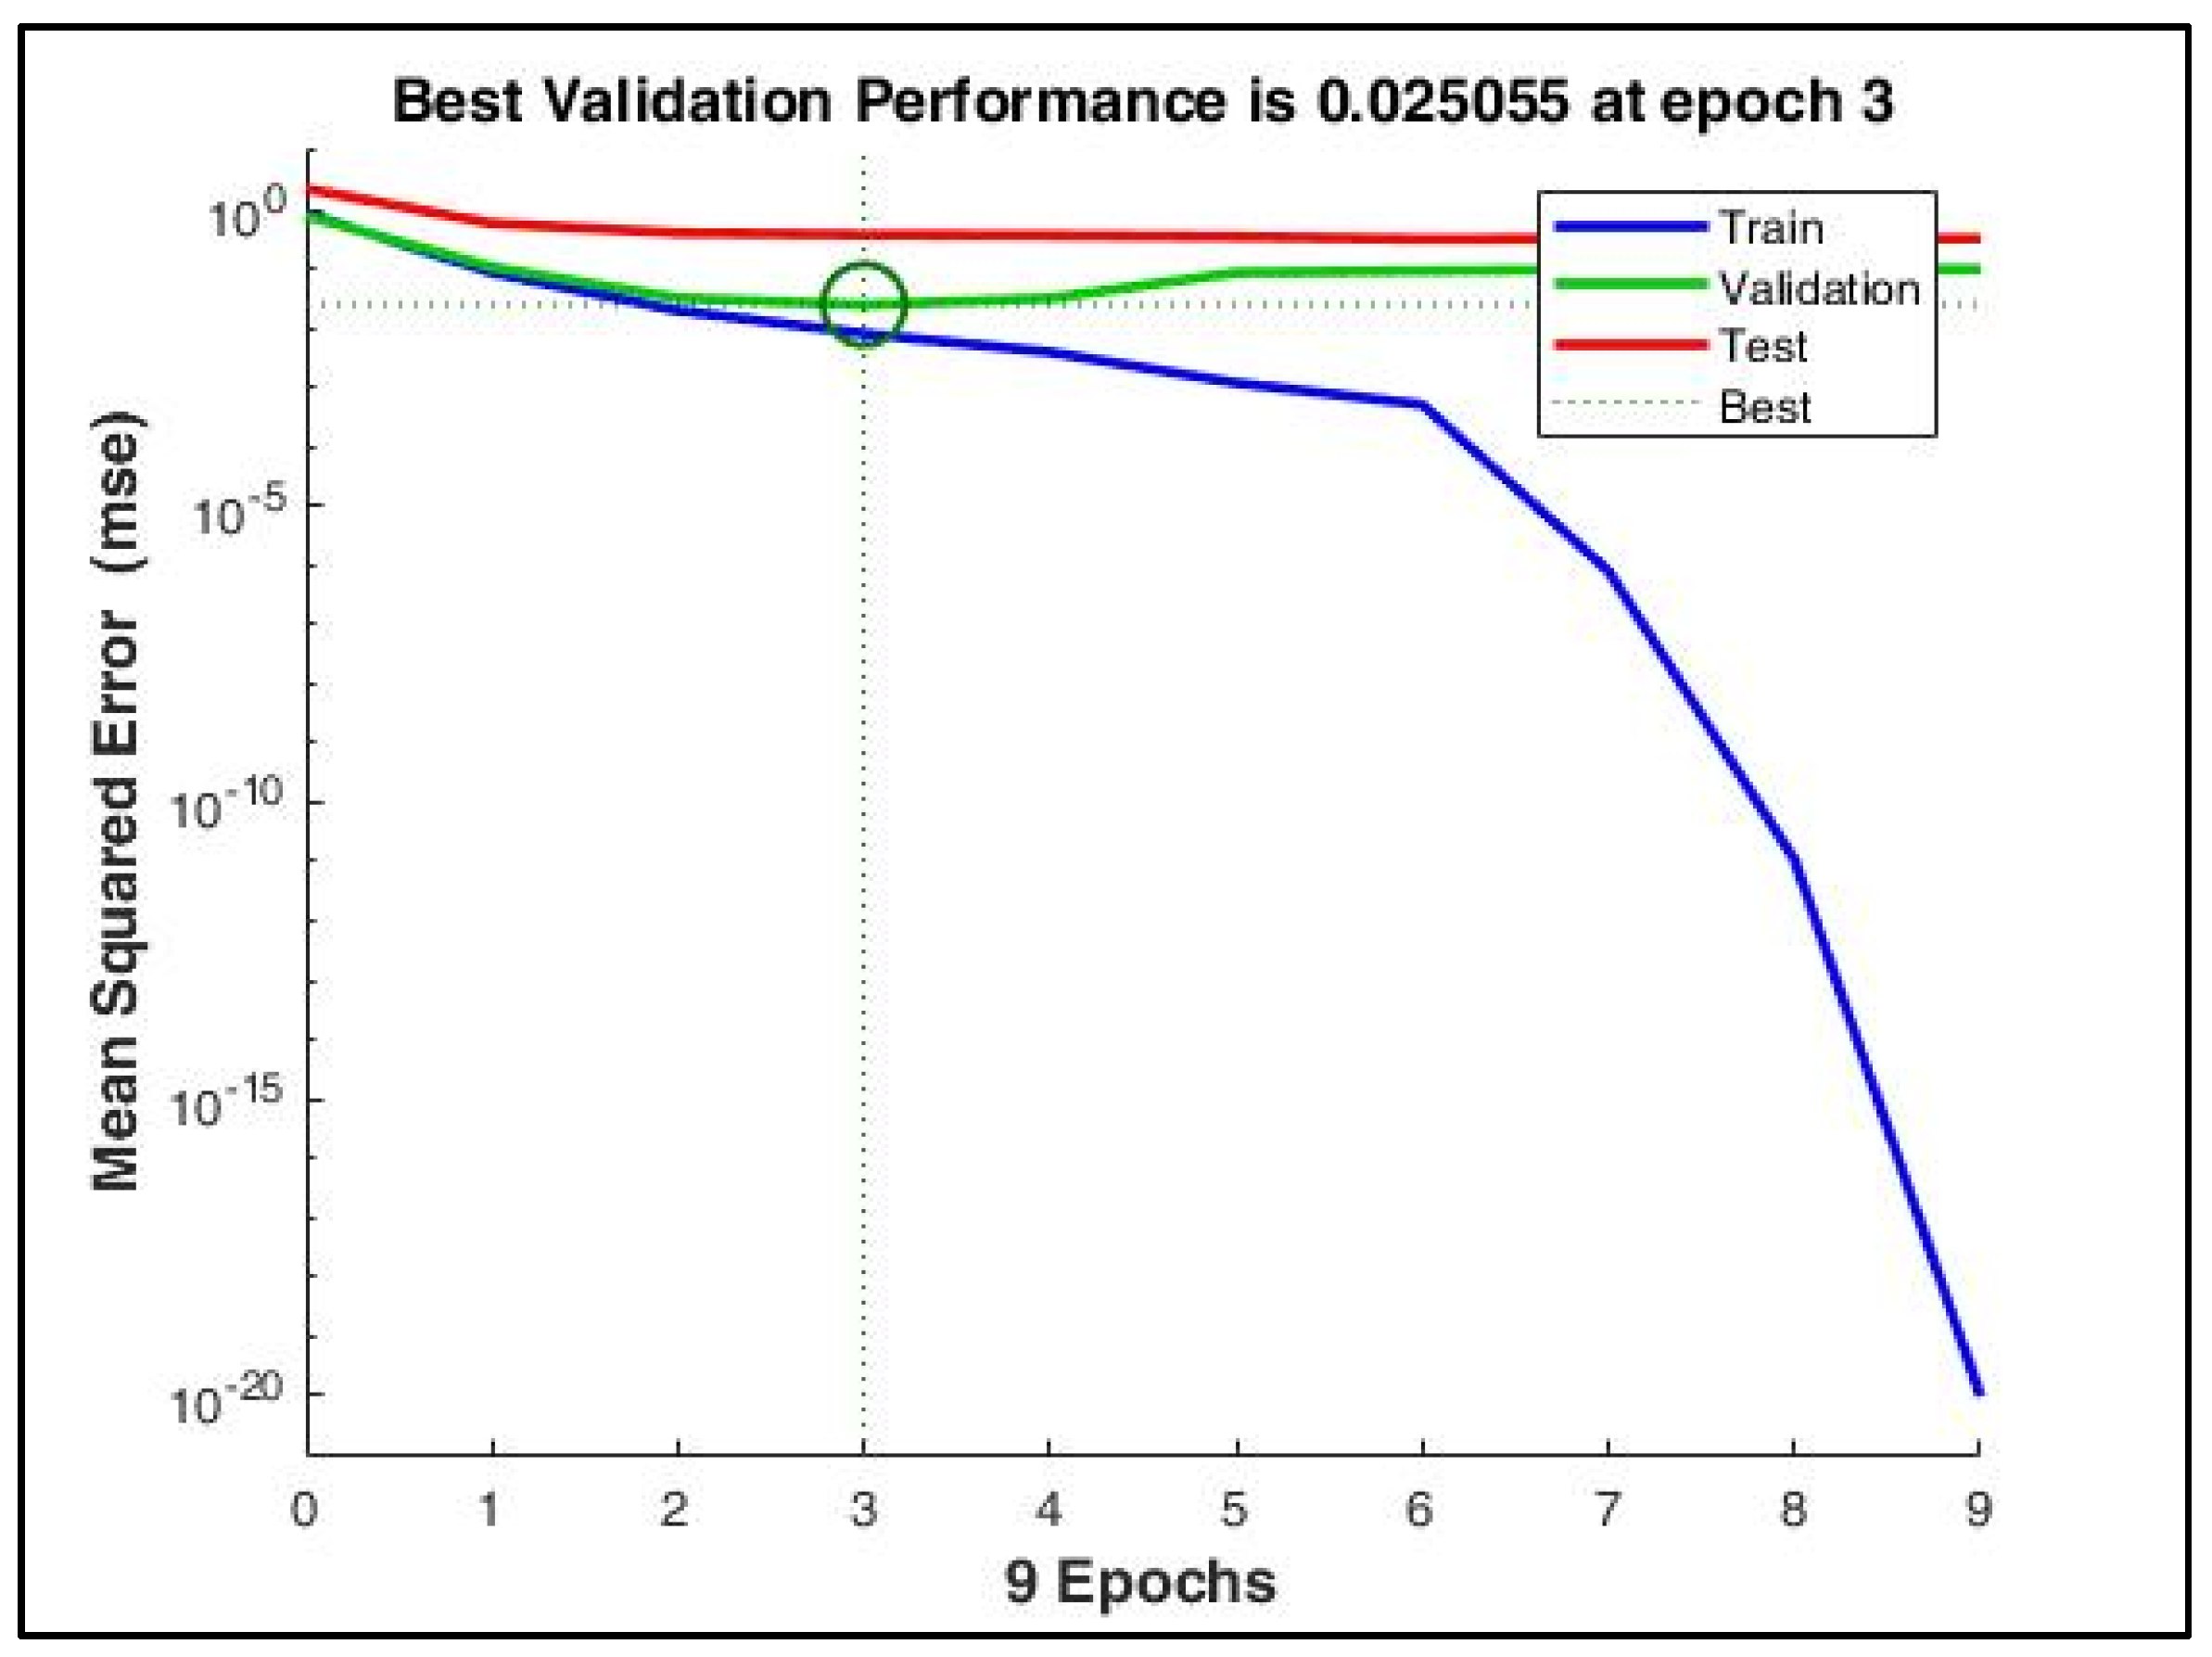
Figure 9.
The mean squared error during training reduced to a very low value at the 9th epoch. However, with early stopping enabled, the best performance was obtained at the 3rd epoch when the validation MSE = 0.025.
Figure 9.
The mean squared error during training reduced to a very low value at the 9th epoch. However, with early stopping enabled, the best performance was obtained at the 3rd epoch when the validation MSE = 0.025.
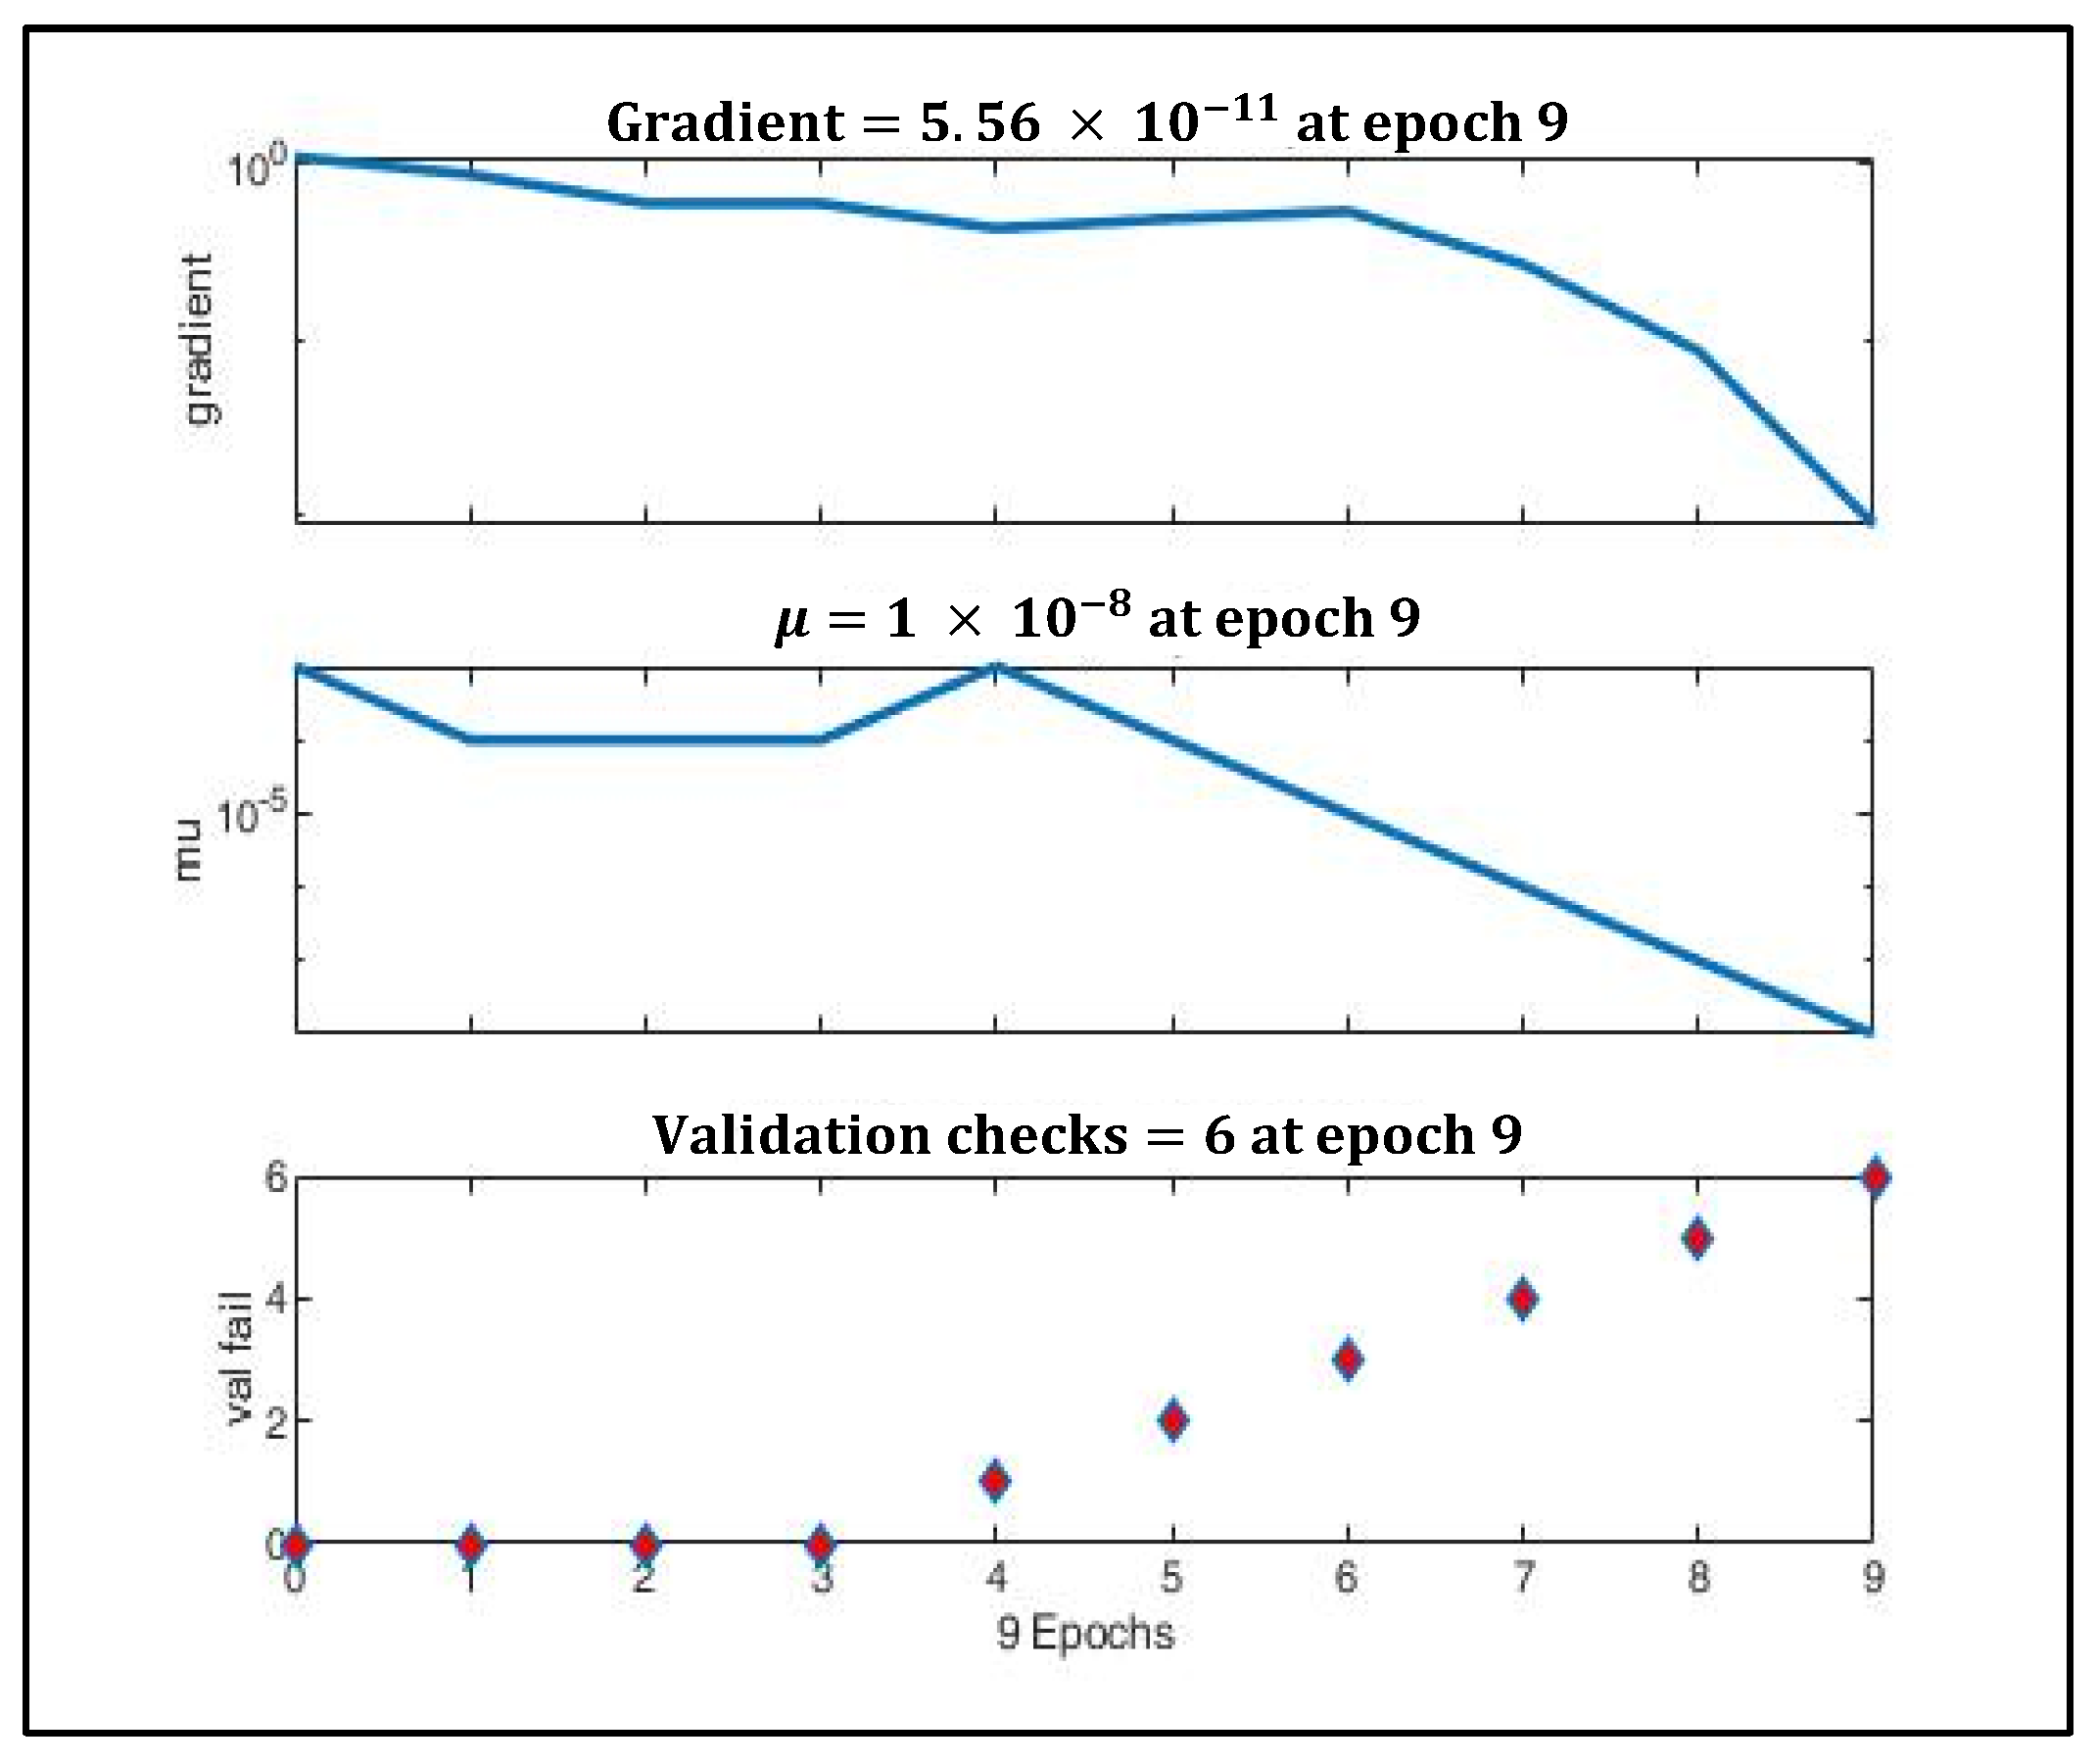
Figure 10.
Gradient optimization using gradient descent and momentum.
Figure 10.
Gradient optimization using gradient descent and momentum.
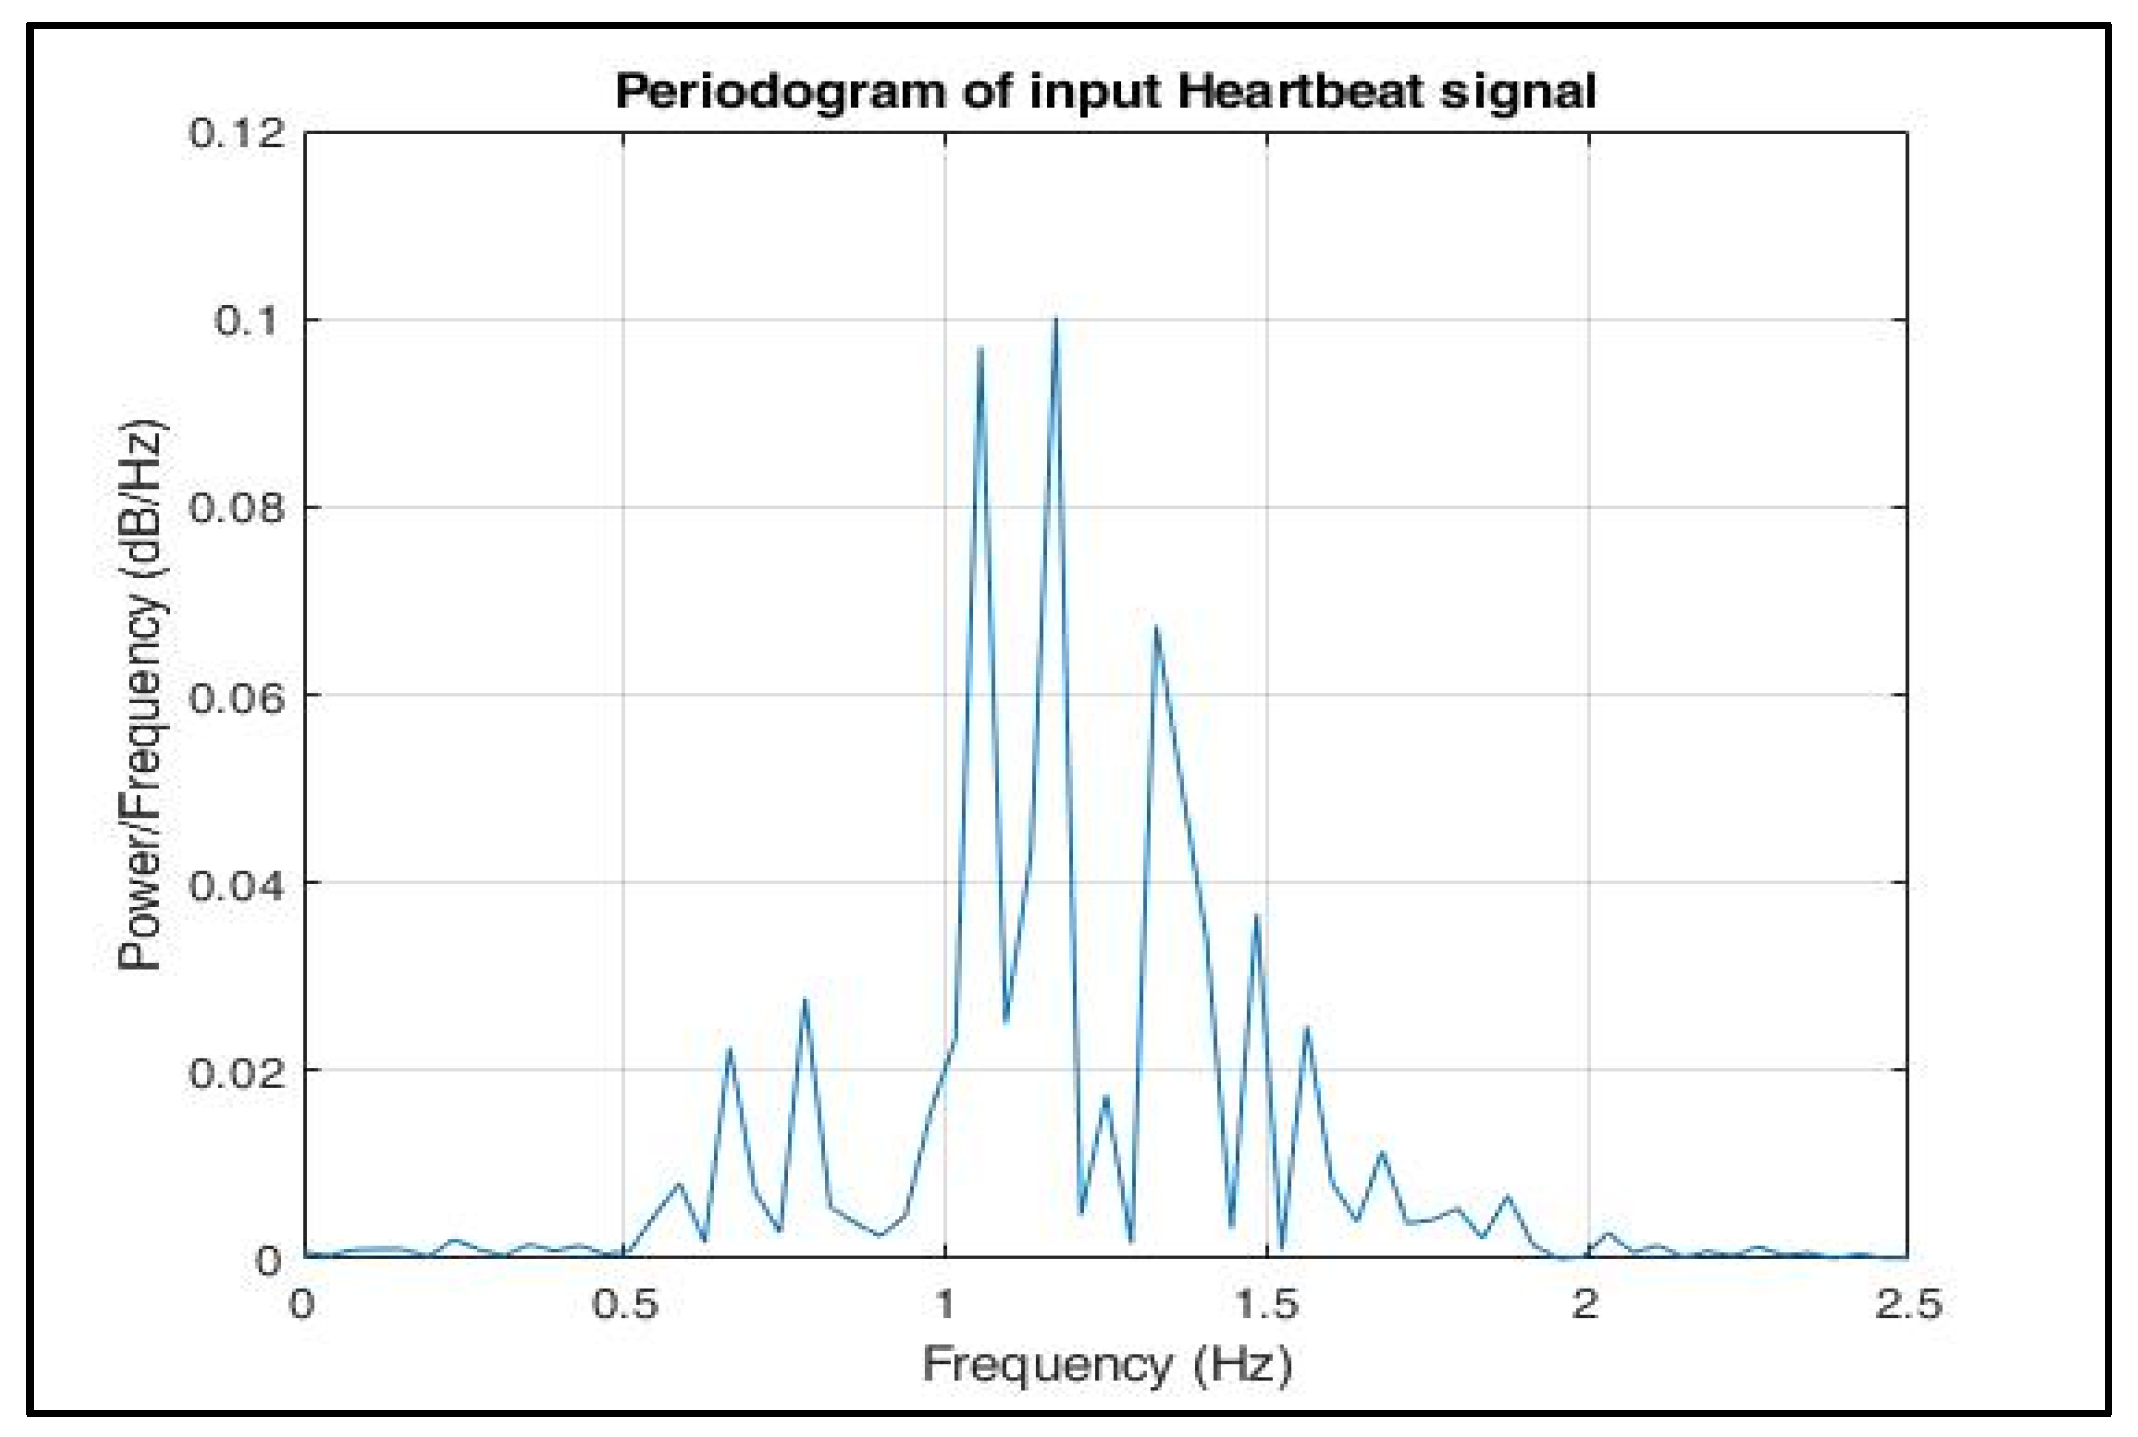
Figure 11.
Periodogram of input heartbeat phase signal.
Figure 11.
Periodogram of input heartbeat phase signal.
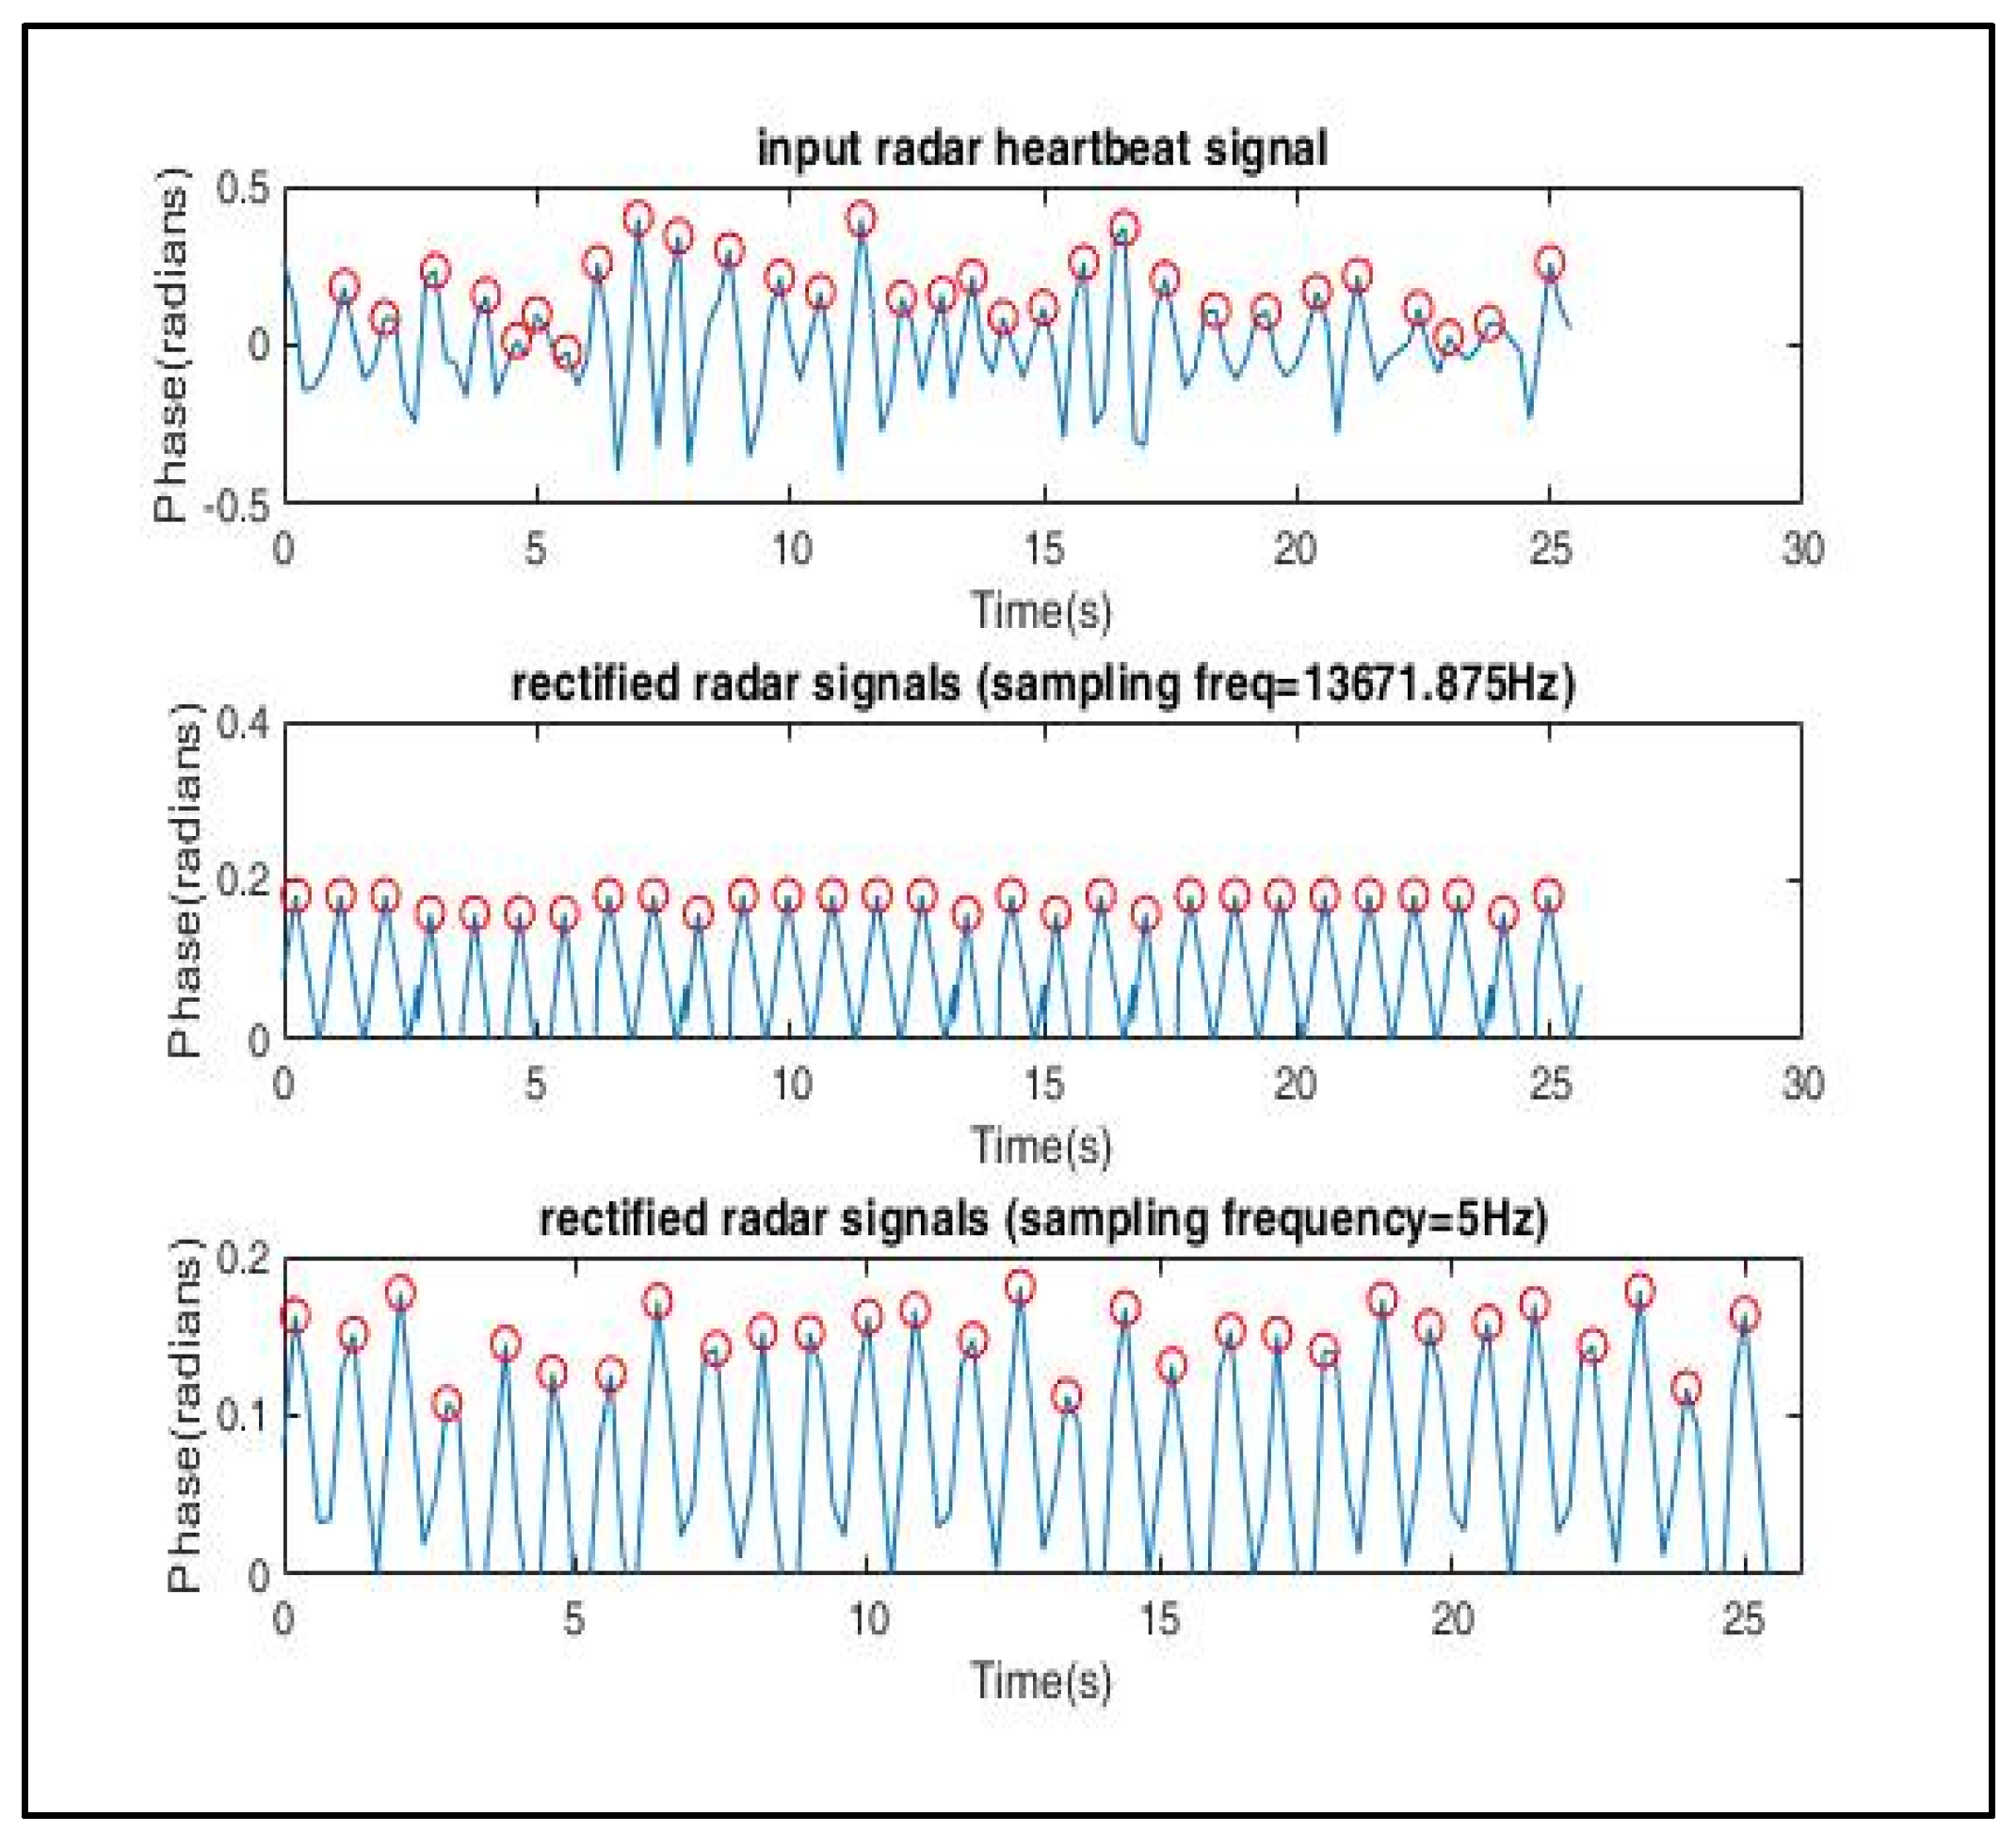
Figure 12.
Signal reconstruction using symmetric triangular wave function, which was then down sampled to 5 Hz to match the sampling frequency of the ECG signals used in the training dataset.
Figure 12.
Signal reconstruction using symmetric triangular wave function, which was then down sampled to 5 Hz to match the sampling frequency of the ECG signals used in the training dataset.
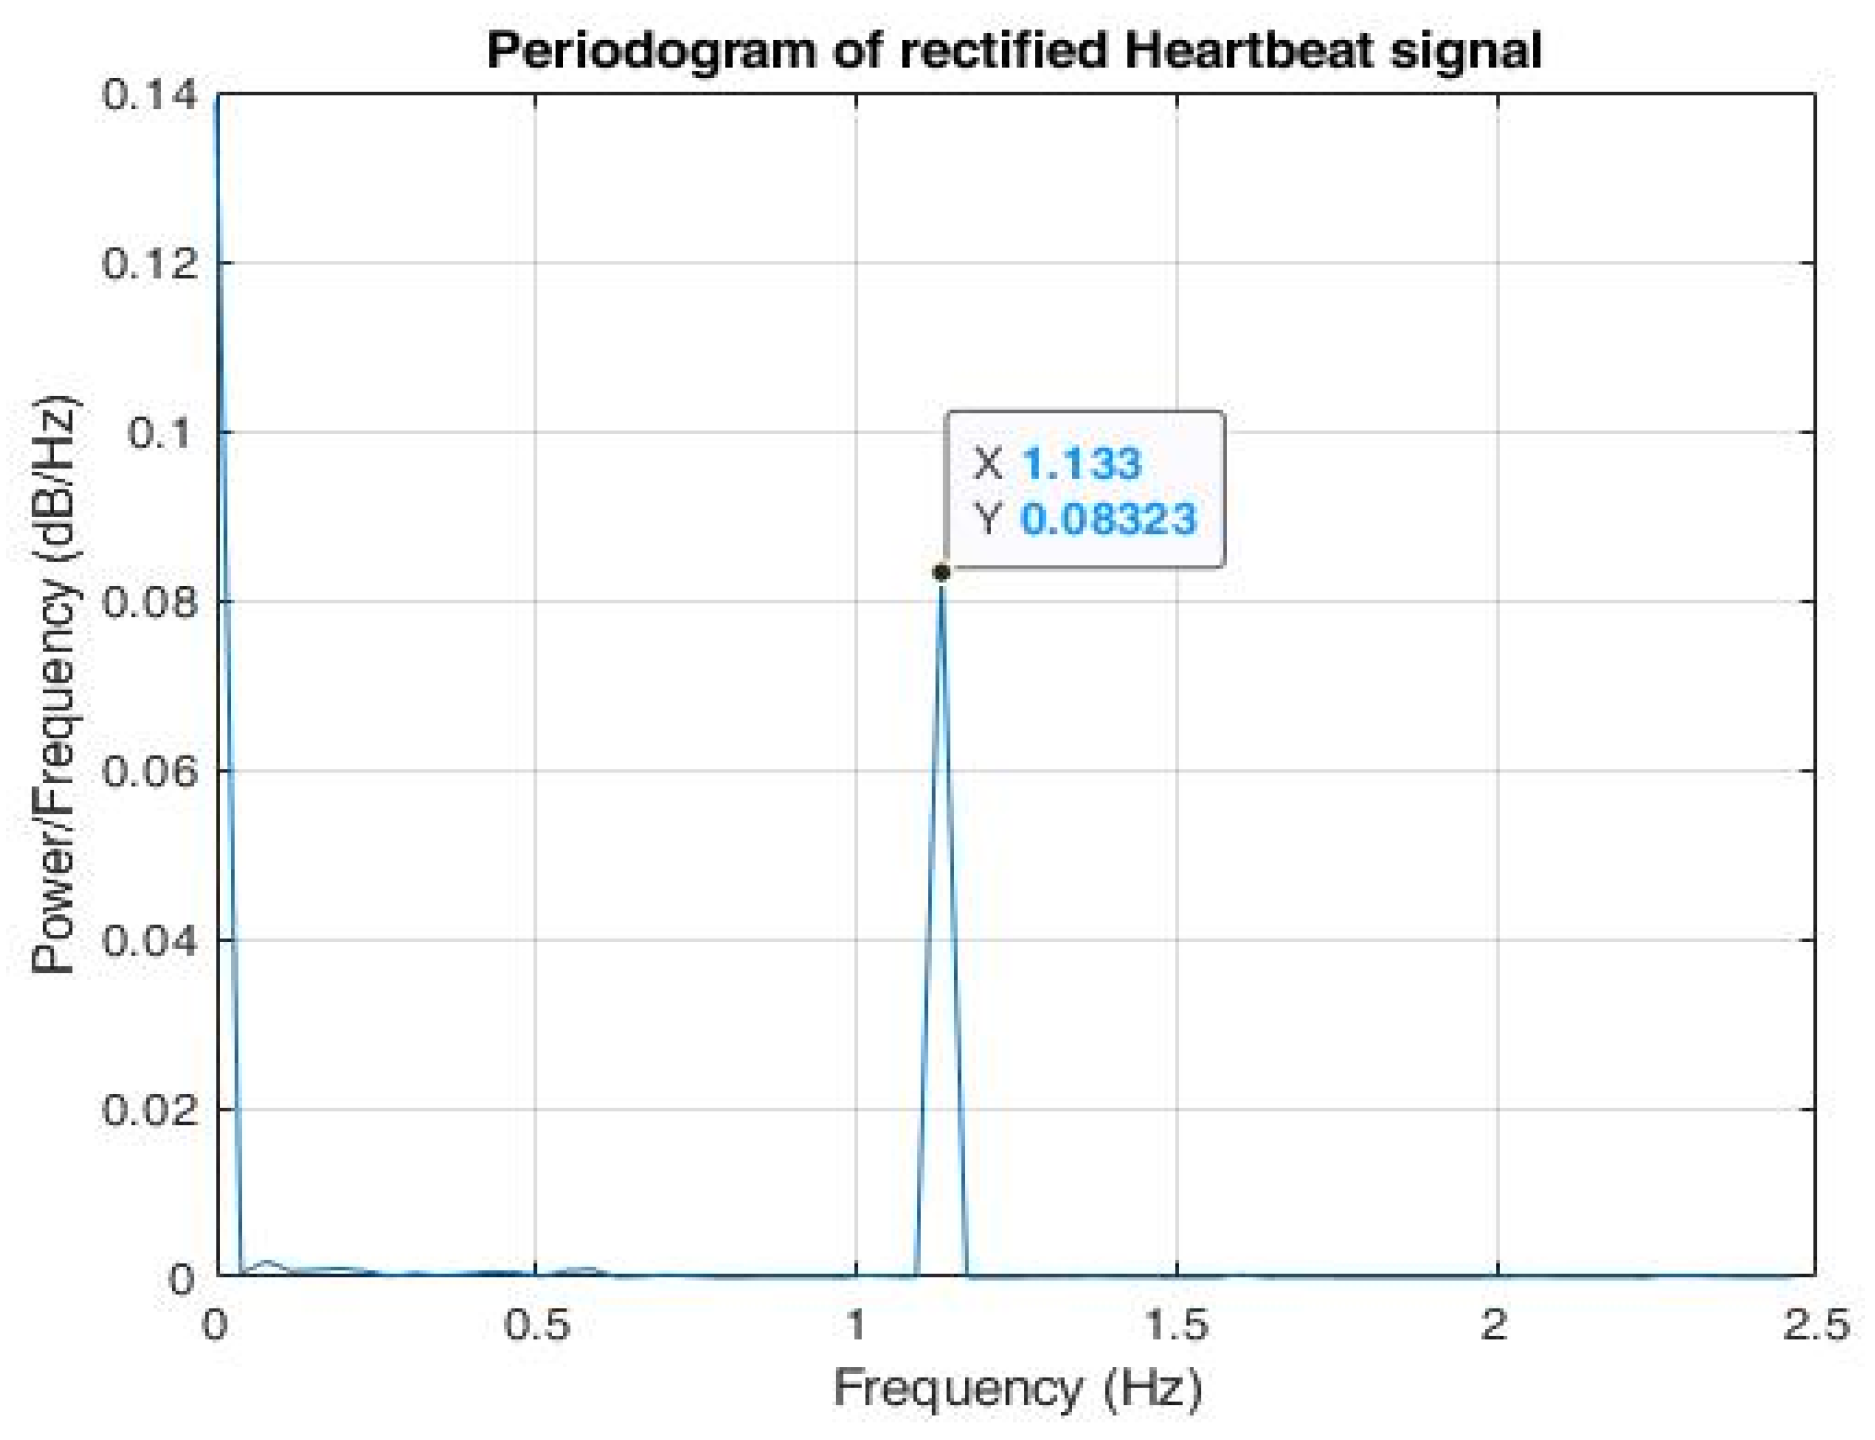
Figure 13.
Periodogram of reconstructed phase signal shows that maximal power spectral density (PSD) lies in the frequency = 1.133 Hz.
Figure 13.
Periodogram of reconstructed phase signal shows that maximal power spectral density (PSD) lies in the frequency = 1.133 Hz.
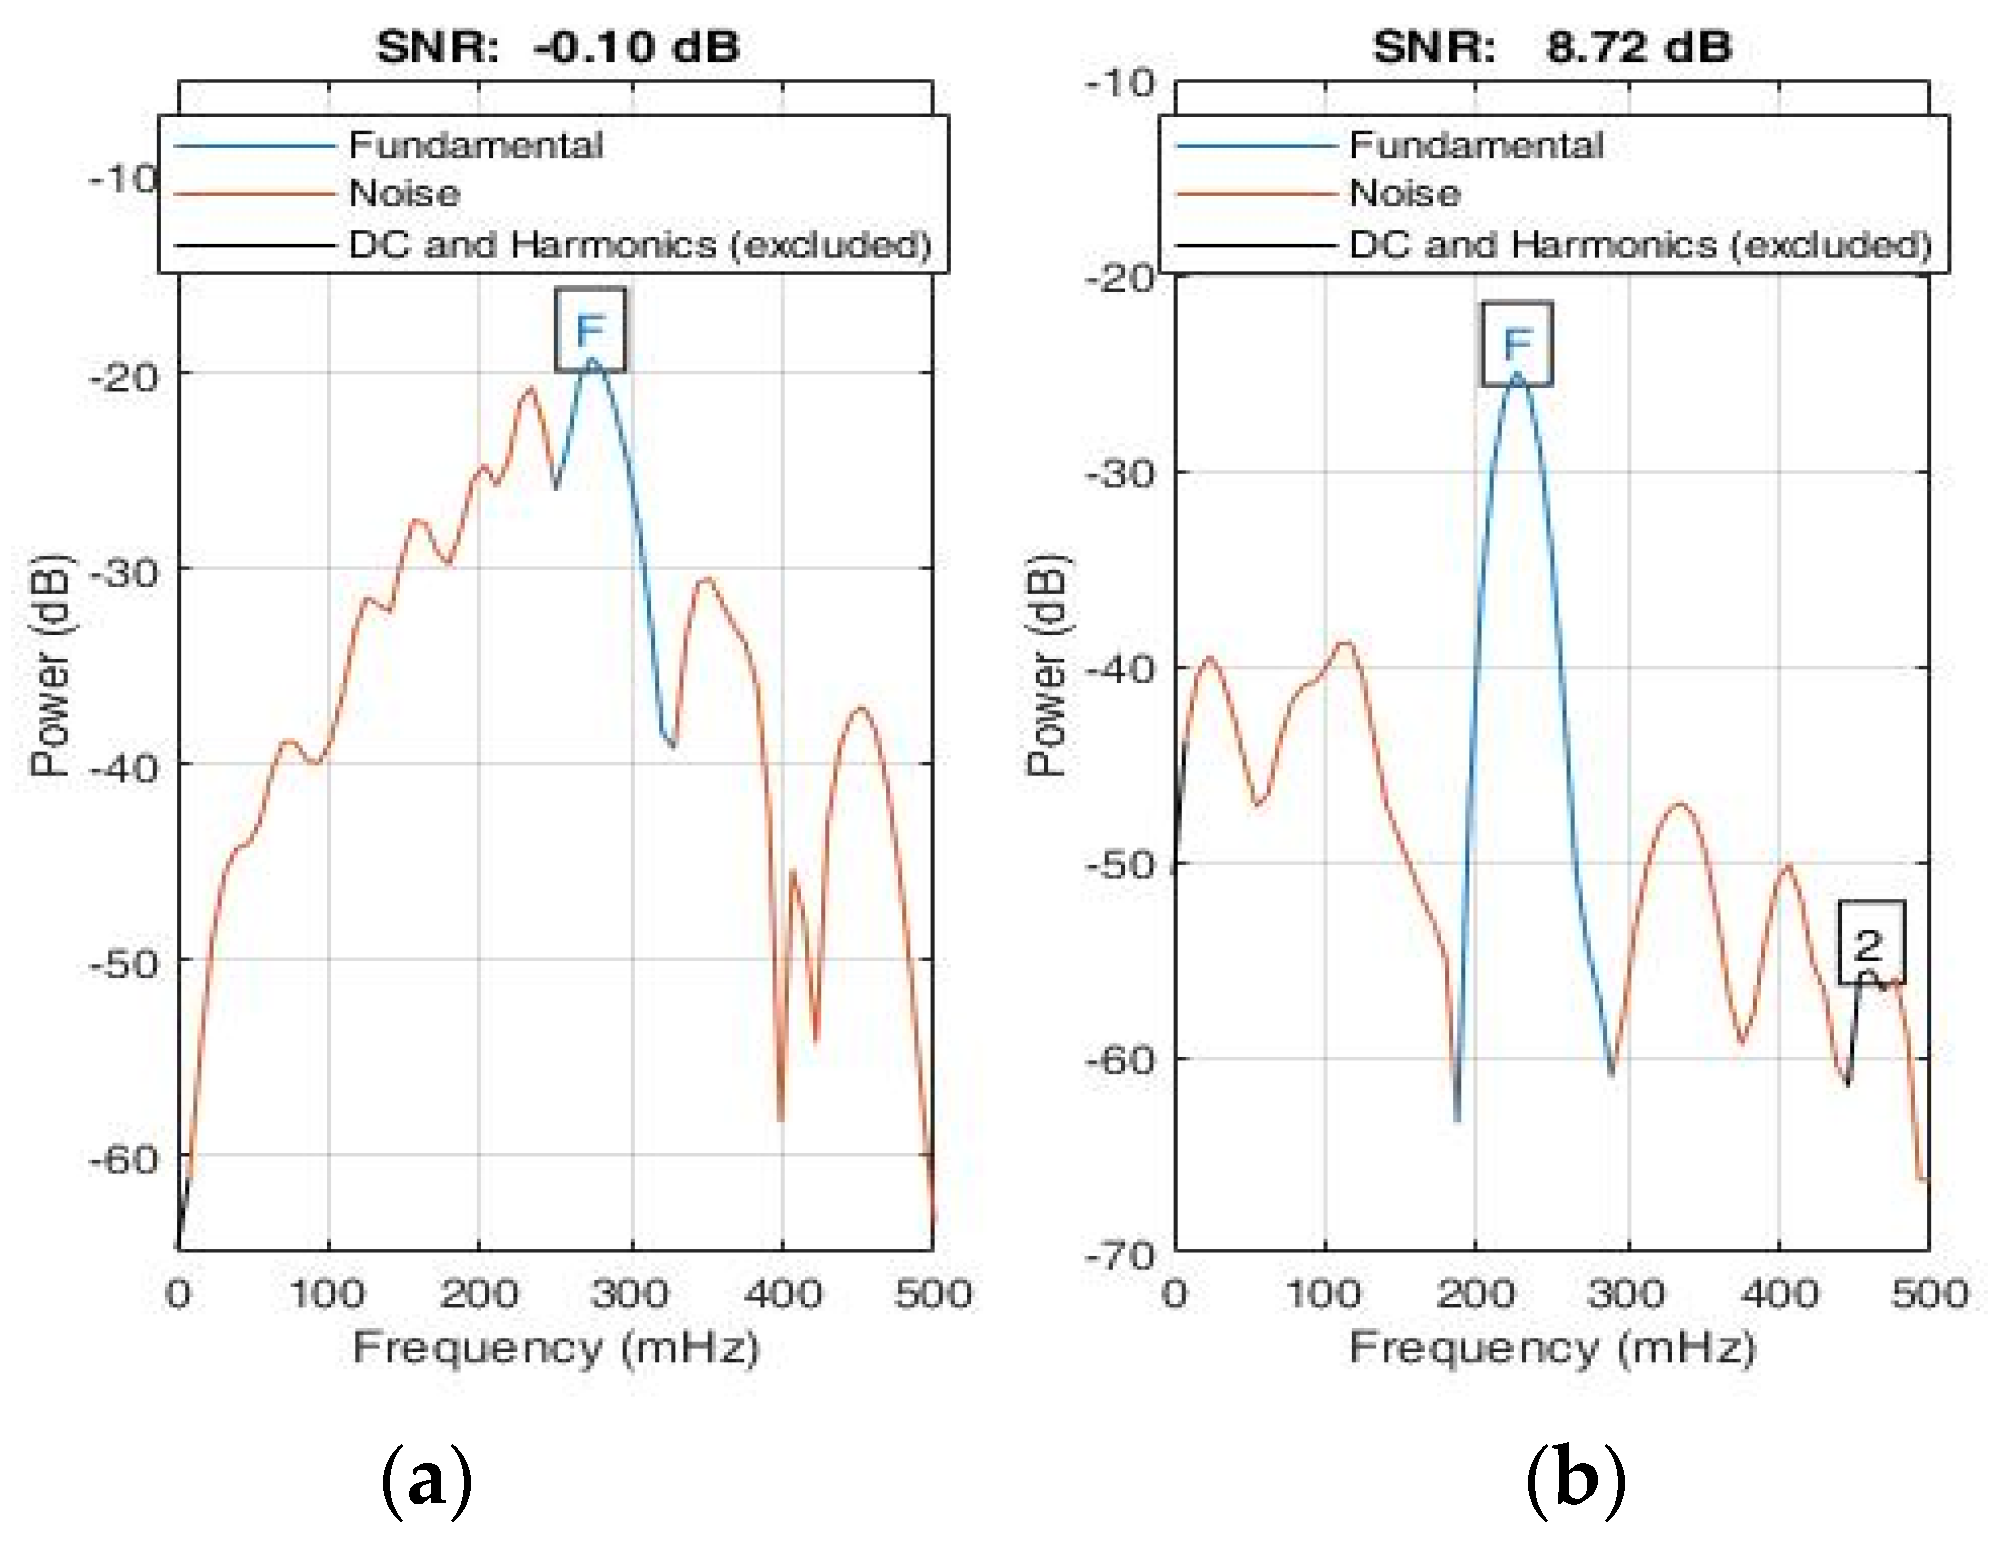
Figure 14.
Signal-to-noise ratio (a) SNR of input signal, (b) SNR of reconstructed signal using symmetrical triangular QRS wave function.
Figure 14.
Signal-to-noise ratio (a) SNR of input signal, (b) SNR of reconstructed signal using symmetrical triangular QRS wave function.
Table 1.
Vital signs measurement parameters.
Table 1.
Vital signs measurement parameters.
| Parameters | Value |
|---|
| Starting frequency | 77 GHz |
| Slow axis sampling | 20 Hz (chirps/s) |
| Chirp duration | 50 µs |
| ADC sampling rate | 2 Msps |
| Range resolution | 4.3 cm |
| Transmitted power | 10 dBm |
Table 2.
Model architecture where Kfold = 5, random seed = 42, loss function = MSE, optimizer = Levenberg–Marquardt algorithm, momentum = enabled, early stopping = 10 rounds, autotuning objective function = MSE, autotuning algorithm: grid search, BatchNorm = disabled.
Table 2.
Model architecture where Kfold = 5, random seed = 42, loss function = MSE, optimizer = Levenberg–Marquardt algorithm, momentum = enabled, early stopping = 10 rounds, autotuning objective function = MSE, autotuning algorithm: grid search, BatchNorm = disabled.
| Autotuned Parameters | Value |
|---|
| Input dense layer | 8 nodes |
| Hidden dense layer | 16 nodes |
| Output dense layer | 1 node |
| Learning rate | 0.01 |
| L1 Regularization | 0 |
| L2 Regularization | 0 |
| Epochs | 10 |
Table 3.
Evaluation metrics to compare cuff-based and radar-based HR monitoring.
Table 3.
Evaluation metrics to compare cuff-based and radar-based HR monitoring.
| Metric | OMRON | Radar |
|---|
| Avg HR | 74 | 74 |
| Variance | 13.95 | 8.5 |
| STD | 3.83 | 2.99 |
| R2 | | 0.164 |
| Root mean square error (RMSE) | | 2.81 |
| Mean absolute error (MAE) | | 1.9 |
| Median absolute error (MedAE) | | 2 |
Table 4.
Statistical evaluation of effect of orientation and distance on measurement.
Table 4.
Statistical evaluation of effect of orientation and distance on measurement.
| Distance (cm) | Orientation | Vital Sign | Upper Bound | Lower Bound | Outliers | Mean | MSE | MAE | medAE | SD |
|---|
| 30 | front | HR | 85.375 | 78.375 | 0 | 81.8 | 0.296 | 2.1 | 2 | 1.8 |
| BR | 13.25 | 7.25 | 0 | 10.6 | 0.124 | 0.96 | 0.9 | 1.2 |
| right | HR | 87.375 | 58.375 | 0 | 72.3 | 3.741 | 4.9 | 4 | 6.4 |
| BR | 8 | 8 | 3 | 8.1 | 0.029 | 0.36 | 0.1 | 0.6 |
| left | HR | 86.625 | 57.625 | 0 | 72.4 | 2.904 | 4.6 | 4 | 5.7 |
| BR | 10.5 | 6.5 | 2 | 9.7 | 1.061 | 2.12 | 1.5 | 3.4 |
| back | HR | 90.75 | 58.75 | 0 | 75.6 | 2.704 | 4.24 | 5 | 5.5 |
| BR | 32.75 | 0.75 | 0 | 17.6 | 3.424 | 4.76 | 3.9 | 6.2 |
| 60 | front | HR | 92.125 | 67.125 | 0 | 80.1 | 3.129 | 4.46 | 4 | 5.9 |
| BR | 14 | 6 | 0 | 10.4 | 0.144 | 1.12 | 1.4 | 1.3 |
| right | HR | 103.25 | 39.25 | 0 | 72 | 9.6 | 8.8 | 8.5 | 10 |
| BR | 15.875 | 4.875 | 1 | 10.7 | 0.701 | 2.24 | 1.7 | 2.8 |
| left | HR | 91 | 63 | 1 | 76 | 4.42 | 5.2 | 4 | 7 |
| BR | 19.625 | 2.625 | 1 | 11.9 | 2.009 | 3.66 | 2.9 | 4.7 |
| back | HR | 81.75 | 67.75 | 3 | 74.1 | 4.269 | 4.7 | 2 | 6.9 |
| BR | 29.5 | 3.5 | 0 | 16.5 | 1.905 | 3.9 | 3.5 | 4.6 |
| 90 | front | HR | 89.5 | 63.5 | 0 | 75.5 | 3.285 | 4.6 | 4 | 6 |
| BR | 10.5 | 6.5 | 1 | 8.8 | 0.076 | 0.64 | 0.5 | 0.9 |
| right | HR | 91.375 | 54.375 | 1 | 72.2 | 6.956 | 6.6 | 4.7 | 8.8 |
| BR | 16.5 | 4.5 | 2 | 12.9 | 4.649 | 5.24 | 3.9 | 7.2 |
| left | HR | 94.375 | 63.375 | 0 | 78.6 | 3.004 | 4.92 | 3.6 | 5.8 |
| BR | 24.75 | −3.25 | 1 | 12.1 | 7.029 | 6.54 | 4.6 | 8.8 |
| back | HR | 86.125 | 61.125 | 0 | 73.7 | 1.721 | 3.5 | 3.3 | 4.4 |
| BR | 30.375 | −4.625 | 0 | 13.2 | 1.996 | 3.76 | 4.8 | 4.7 |
| 120 | front | HR | 104.25 | 56.25 | 0 | 78.6 | 8.624 | 7.72 | 5.1 | 9.8 |
| BR | 14 | 6 | 0 | 9.9 | 0.129 | 1.1 | 1.1 | 1.2 |
| right | HR | 86.375 | 55.375 | 0 | 71.5 | 2.705 | 4.4 | 3.5 | 5.5 |
| BR | 19.5 | 1.5 | 0 | 11 | 1.5 | 3.4 | 3 | 4.1 |
| left | HR | 93.5 | 57.5 | 1 | 73.7 | 9.841 | 7.42 | 5.5 | 10 |
| BR | 23.25 | −0.75 | 2 | 12.9 | 5.169 | 5.86 | 4.4 | 7.6 |
| back | HR | 87.875 | 52.875 | 0 | 69 | 4.56 | 5.4 | 5.5 | 7.1 |
| BR | 36.25 | −5.75 | 0 | 15.2 | 2.636 | 4.6 | 5.8 | 5.4 |
| 150 | front | HR | 88.875 | 63.875 | 0 | 75.9 | 1.949 | 3.88 | 3.5 | 4.7 |
| BR | 12.75 | 6.75 | 0 | 9.6 | 0.144 | 1.04 | 0.6 | 1.3 |
| right | HR | 87.125 | 54.125 | 1 | 70.8 | 8.296 | 7.4 | 4.5 | 9.6 |
| BR | 19.875 | −9.125 | 0 | 7.3 | 3.041 | 4.44 | 4.5 | 5.8 |
| left | HR | 92.375 | 61.375 | 1 | 74.8 | 6.056 | 5.96 | 5 | 8.2 |
| BR | 31.25 | −18.75 | 0 | 7.9 | 6.509 | 6.5 | 7 | 8.5 |
| back | HR | 91.25 | 57.25 | 0 | 73.7 | 2.721 | 4.7 | 4.5 | 5.5 |
| BR | 34.625 | −2.375 | 0 | 16.8 | 5.156 | 6.16 | 5 | 7.6 |
Table 5.
Statistical evaluation of effect of movement.
Table 5.
Statistical evaluation of effect of movement.
| Distance (cm) | Activity | Vital Sign | Upper Bound | Lower Bound | Outliers | Mean | MSE | MAE | MedAE | SD |
|---|
| 20 | standing | HR | 74.88 | 71.88 | 4 | 72 | 62.8 | 5.4 | 1.5 | 8.35 |
| BR | 10.5 | 6.5 | 1 | 9 | 1.04 | 0.8 | 0.6 | 1.07 |
| walking | HR | 85.5 | 59.5 | 0 | 73 | 14.6 | 3.48 | 3.5 | 4.03 |
| BR | 28.88 | 3.875 | 2 | 18 | 52.3 | 5.68 | 4.4 | 7.62 |
| 40 | standing | HR | 77.5 | 65.5 | 0 | 72 | 6.56 | 2.2 | 1.8 | 2.7 |
| BR | 16.13 | 3.125 | 1 | 11 | 18.6 | 3.32 | 2.8 | 4.54 |
| walking | HR | 74.5 | 62.5 | 2 | 70 | 23.7 | 3.36 | 2.1 | 5.13 |
| BR | 34.5 | −3.5 | 0 | 17 | 49.6 | 5.4 | 4.5 | 7.42 |
| 60 | standing | HR | 88 | 64 | 2 | 74 | 38.4 | 4.84 | 4.2 | 6.53 |
| BR | 16.5 | 4.5 | 1 | 11 | 13.8 | 2.56 | 2 | 3.92 |
| walking | HR | 81.88 | 68.88 | 0 | 75 | 10.5 | 2.66 | 1.9 | 3.41 |
| BR | 29.63 | 0.625 | 0 | 14 | 23 | 3.88 | 4.5 | 5.06 |
Table 6.
Performance analysis of heart rate with respect to Omron device.
Table 6.
Performance analysis of heart rate with respect to Omron device.
| Distance | Activity | Vital Sign | Mean | MSE | MAE | medAE | SD | R Square |
|---|
| 20 | standing | HR | 72 | 97.61 | 7.72 | 4.9 | 8.353 | 0.285137 |
| walking | HR | 73 | 42.73 | 5.3 | 3.9 | 4.033 | 0.6193151 |
| 40 | standing | HR | 72 | 43.77 | 6.1 | 5.9 | 2.7 | 0.833473 |
| walking | HR | 70 | 84.53 | 8.22 | 7.9 | 5.131 | 0.688605 |
| 60 | standing | HR | 74 | 55.17 | 5.36 | 2.5 | 6.529 | 0.2274384 |
| walking | HR | 75 | 18.33 | 3.22 | 1.9 | 3.414 | 0.3641268 |
Table 7.
Performance analysis of breathing rate (with and without moving).
Table 7.
Performance analysis of breathing rate (with and without moving).
| Distance | Activity | Vital Sign | Mean | MSE | MAE | medAE | SD |
|---|
| 20 | standing | BR | 9 | 1.04 | 0.8 | 0.6 | 1.07497 |
| walking | BR | 18 | 52.29 | 5.68 | 4.4 | 7.62234 |
| 40 | standing | BR | 11 | 18.56 | 3.32 | 2.8 | 4.54117 |
| walking | BR | 17 | 49.6 | 5.4 | 4.5 | 7.42369 |
| 60 | standing | BR | 11 | 13.81 | 2.56 | 2 | 3.9172 |
| walking | BR | 14 | 23.04 | 3.88 | 4.5 | 5.05964 |
Table 8.
ECG signal specifications of the training dataset.
Table 8.
ECG signal specifications of the training dataset.
| Specifications | Normal Sinus Dataset | Arrhythmia Dataset |
|---|
| Sampling frequency (Hz) | 128 | 360 |
| Number of samples | 1280 | 3600 |
| Gain (adu/mV) | 200 | 200 |
| Baseline | 0 | 1024 |
Table 9.
Testing accuracies of 15 subjects: the average test accuracy was estimated to be 75% for 15 subjects. The coefficient of determination of 0.876 for the trained dataset is justified.
Table 9.
Testing accuracies of 15 subjects: the average test accuracy was estimated to be 75% for 15 subjects. The coefficient of determination of 0.876 for the trained dataset is justified.
| Subject ID | Age | Gender | Testing
Accuracy | Predicted | Actual | False
Positives |
|---|
| 1 | 22 | male | 60% | Normal | Normal | 4 |
| 2 | 24 | male | 90% | Normal | Normal | 1 |
| 3 | 23 | male | 60% | Normal | Normal | 4 |
| 4 | 30 | female | 80% | Normal | Normal | 2 |
| 5 | 20 | male | 100% | Normal | Normal | 0 |
| 6 | 25 | male | 60% | Normal | Normal | 4 |
| 7 | 50 | female | 90% | Normal | Normal | 1 |
| 8 | 45 | female | 100% | Normal | Normal | 0 |
| 9 | 68 | male | 60% | Arrhythmia | Arrhythmia | 4 |
| 10 | 69 | male | 80% | Arrhythmia | Arrhythmia | 2 |
| 11 | 69 | male | 70% | Arrhythmia | Arrhythmia | 3 |
| 12 | 51 | female | 20% | Arrhythmia | Arrhythmia | 8 |
| 13 | 83 | female | 80% | Arrhythmia | Arrhythmia | 2 |
| 14 | 51 | male | 80% | Arrhythmia | Arrhythmia | 2 |
| 15 | 63 | female | 90% | Arrhythmia | Arrhythmia | 1 |


 ,
, 


