
Wearable Bluetooth Triage Healthcare Monitoring System

 , ,
, , 
 ,
,  ,
,  ,
,  , and
, and
Abstract
:1. Introduction
2. Materials and Methods
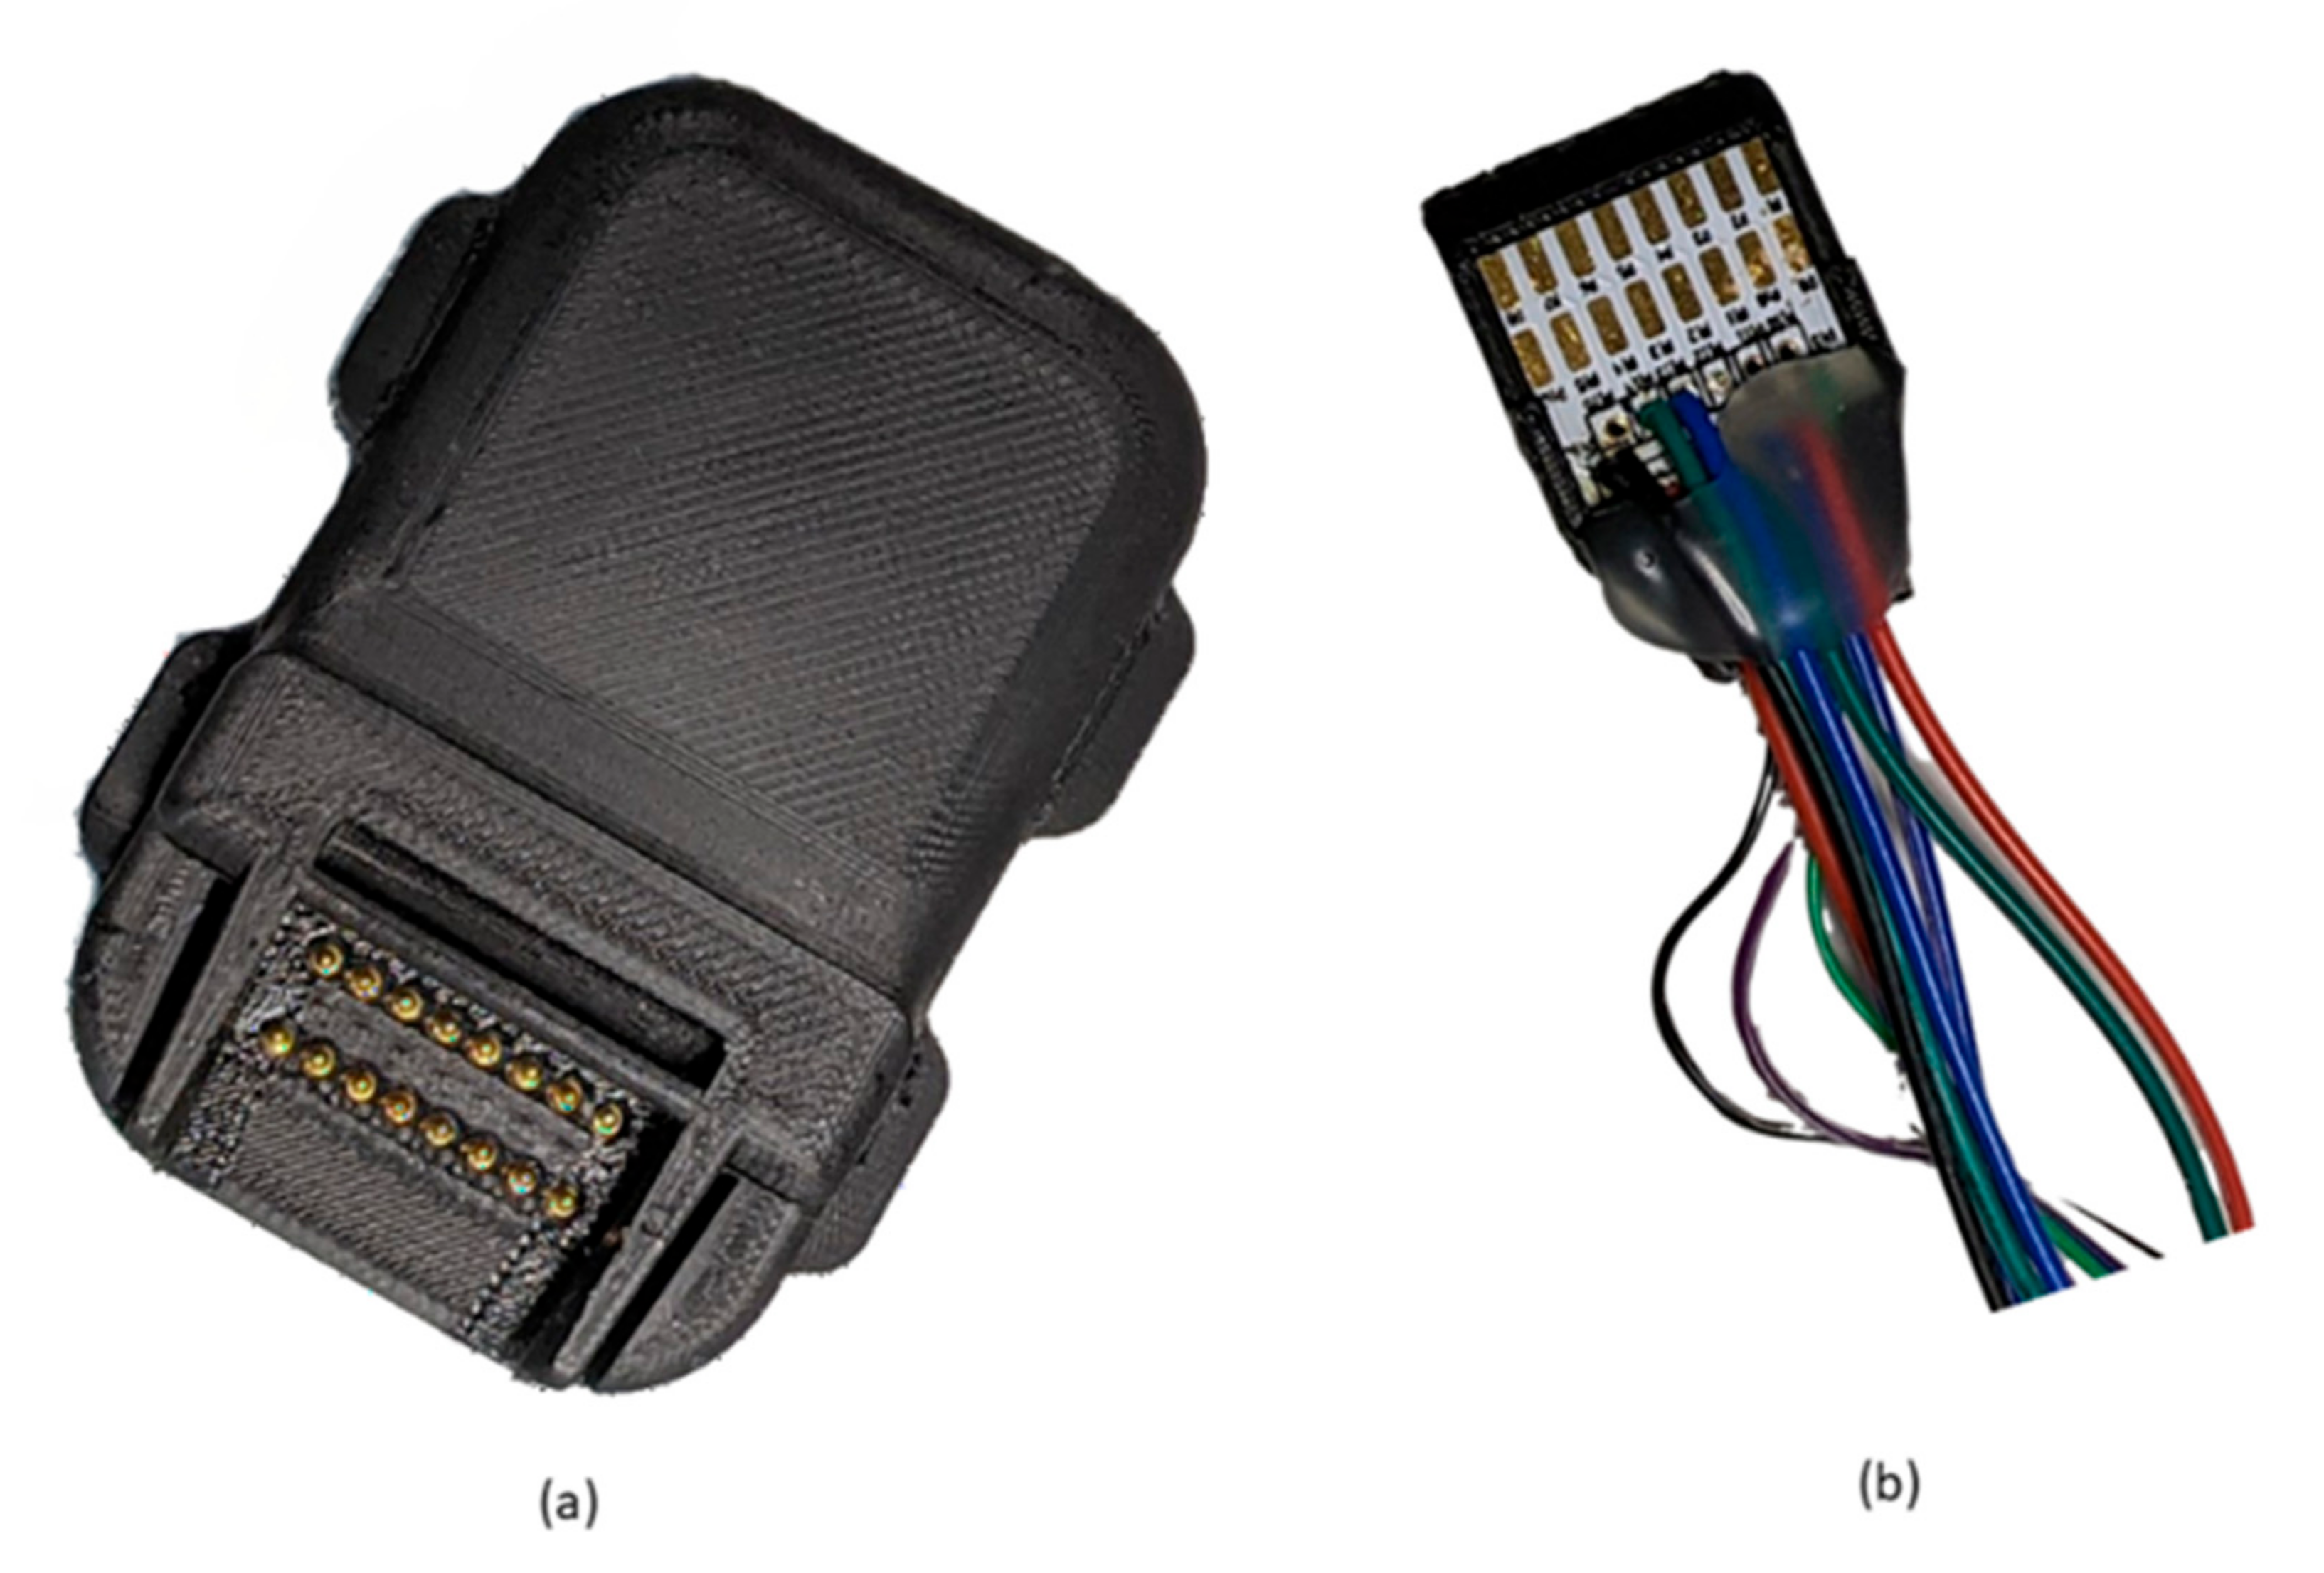
2.1. Design of the Bluetooth Device
2.1.1. Piezoelectric Sensor and Skin Interface
- (1)
- Pre-assembly and test of the piezo disk on the support PCB
- (2)
- Pre-pouring of silicone in the hemispherical part of the mold
- (3)
- When silicone starts to set (approximately ½ of the curing time) the assembly prepared at step 1 is firmly pressed is the still soft silicone having care placing it in the center and to run the wire in the dedicated channel
- (4)
- Pour additional silicone to cover and seal the sensor assembly inside the dome. The sealing is achieved by the silicone sticking onto itself over the edges of the piezo-PCB assembly.
2.1.2. Sensor Signal Conditioning
2.1.3. ADC, Body Temperature, ECG and Wireless Connectivity
2.2. Analysis of Proposed Sensor Performances in Cardiac and Respiratory Monitoring
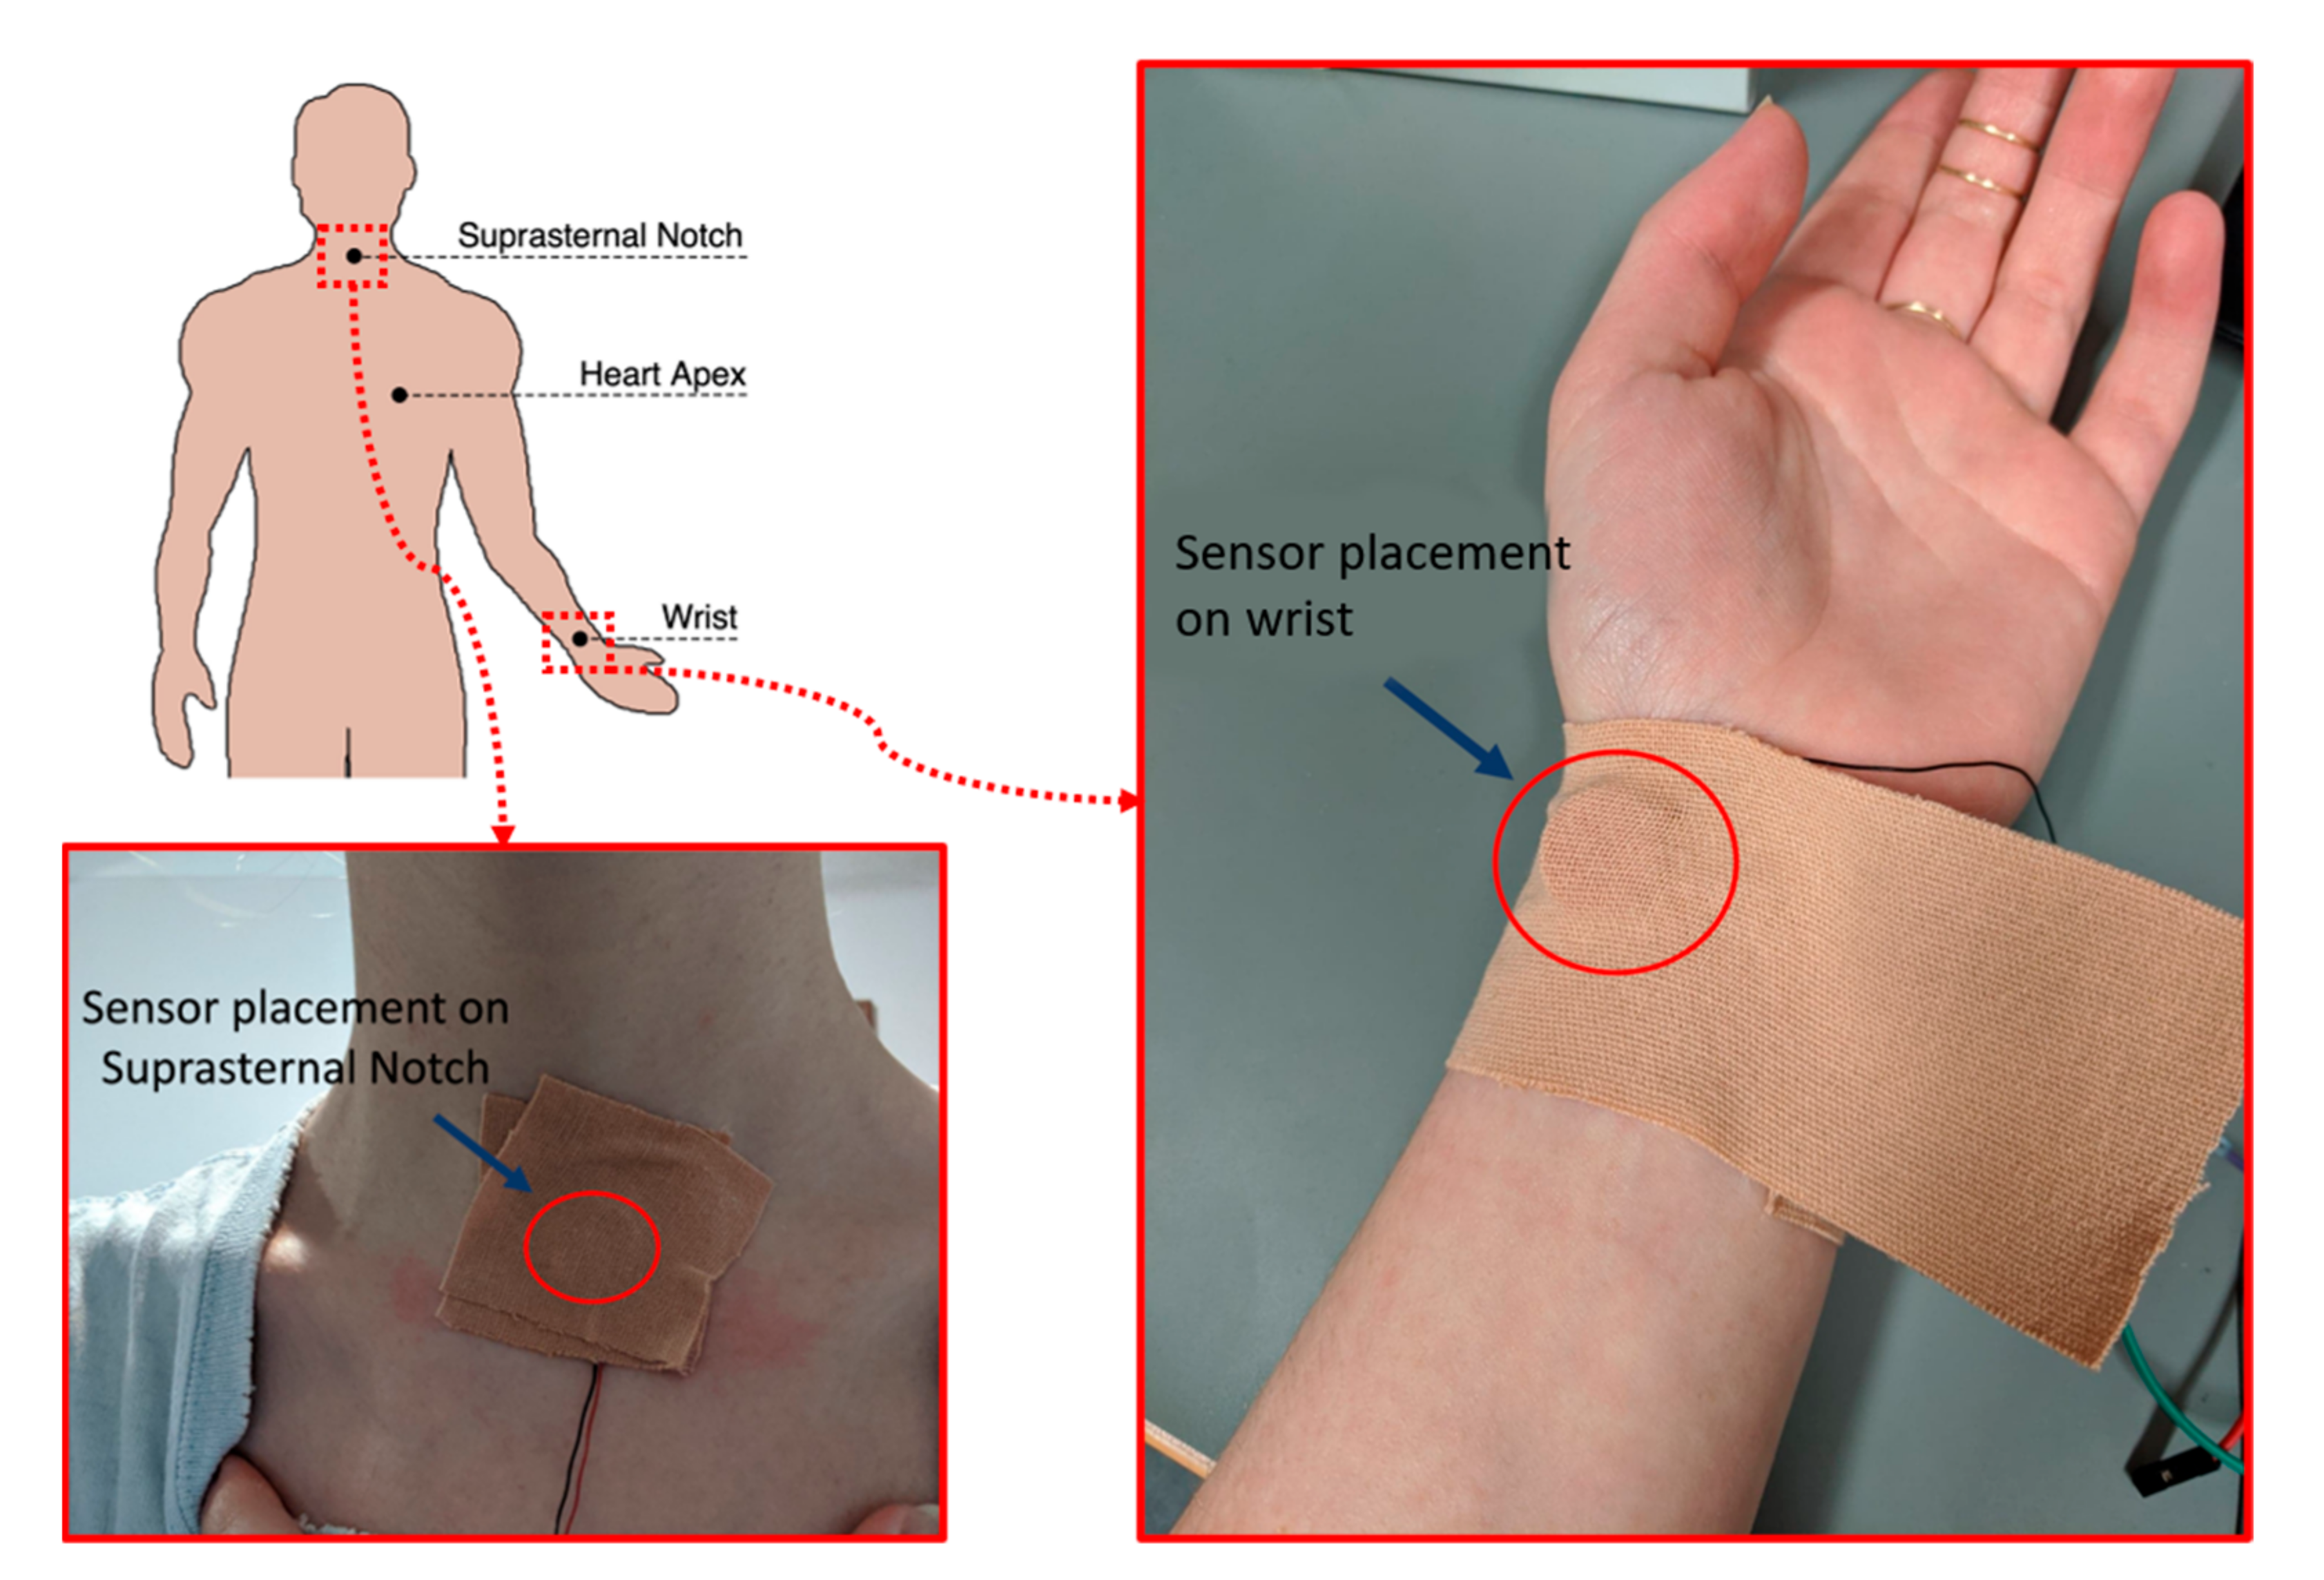
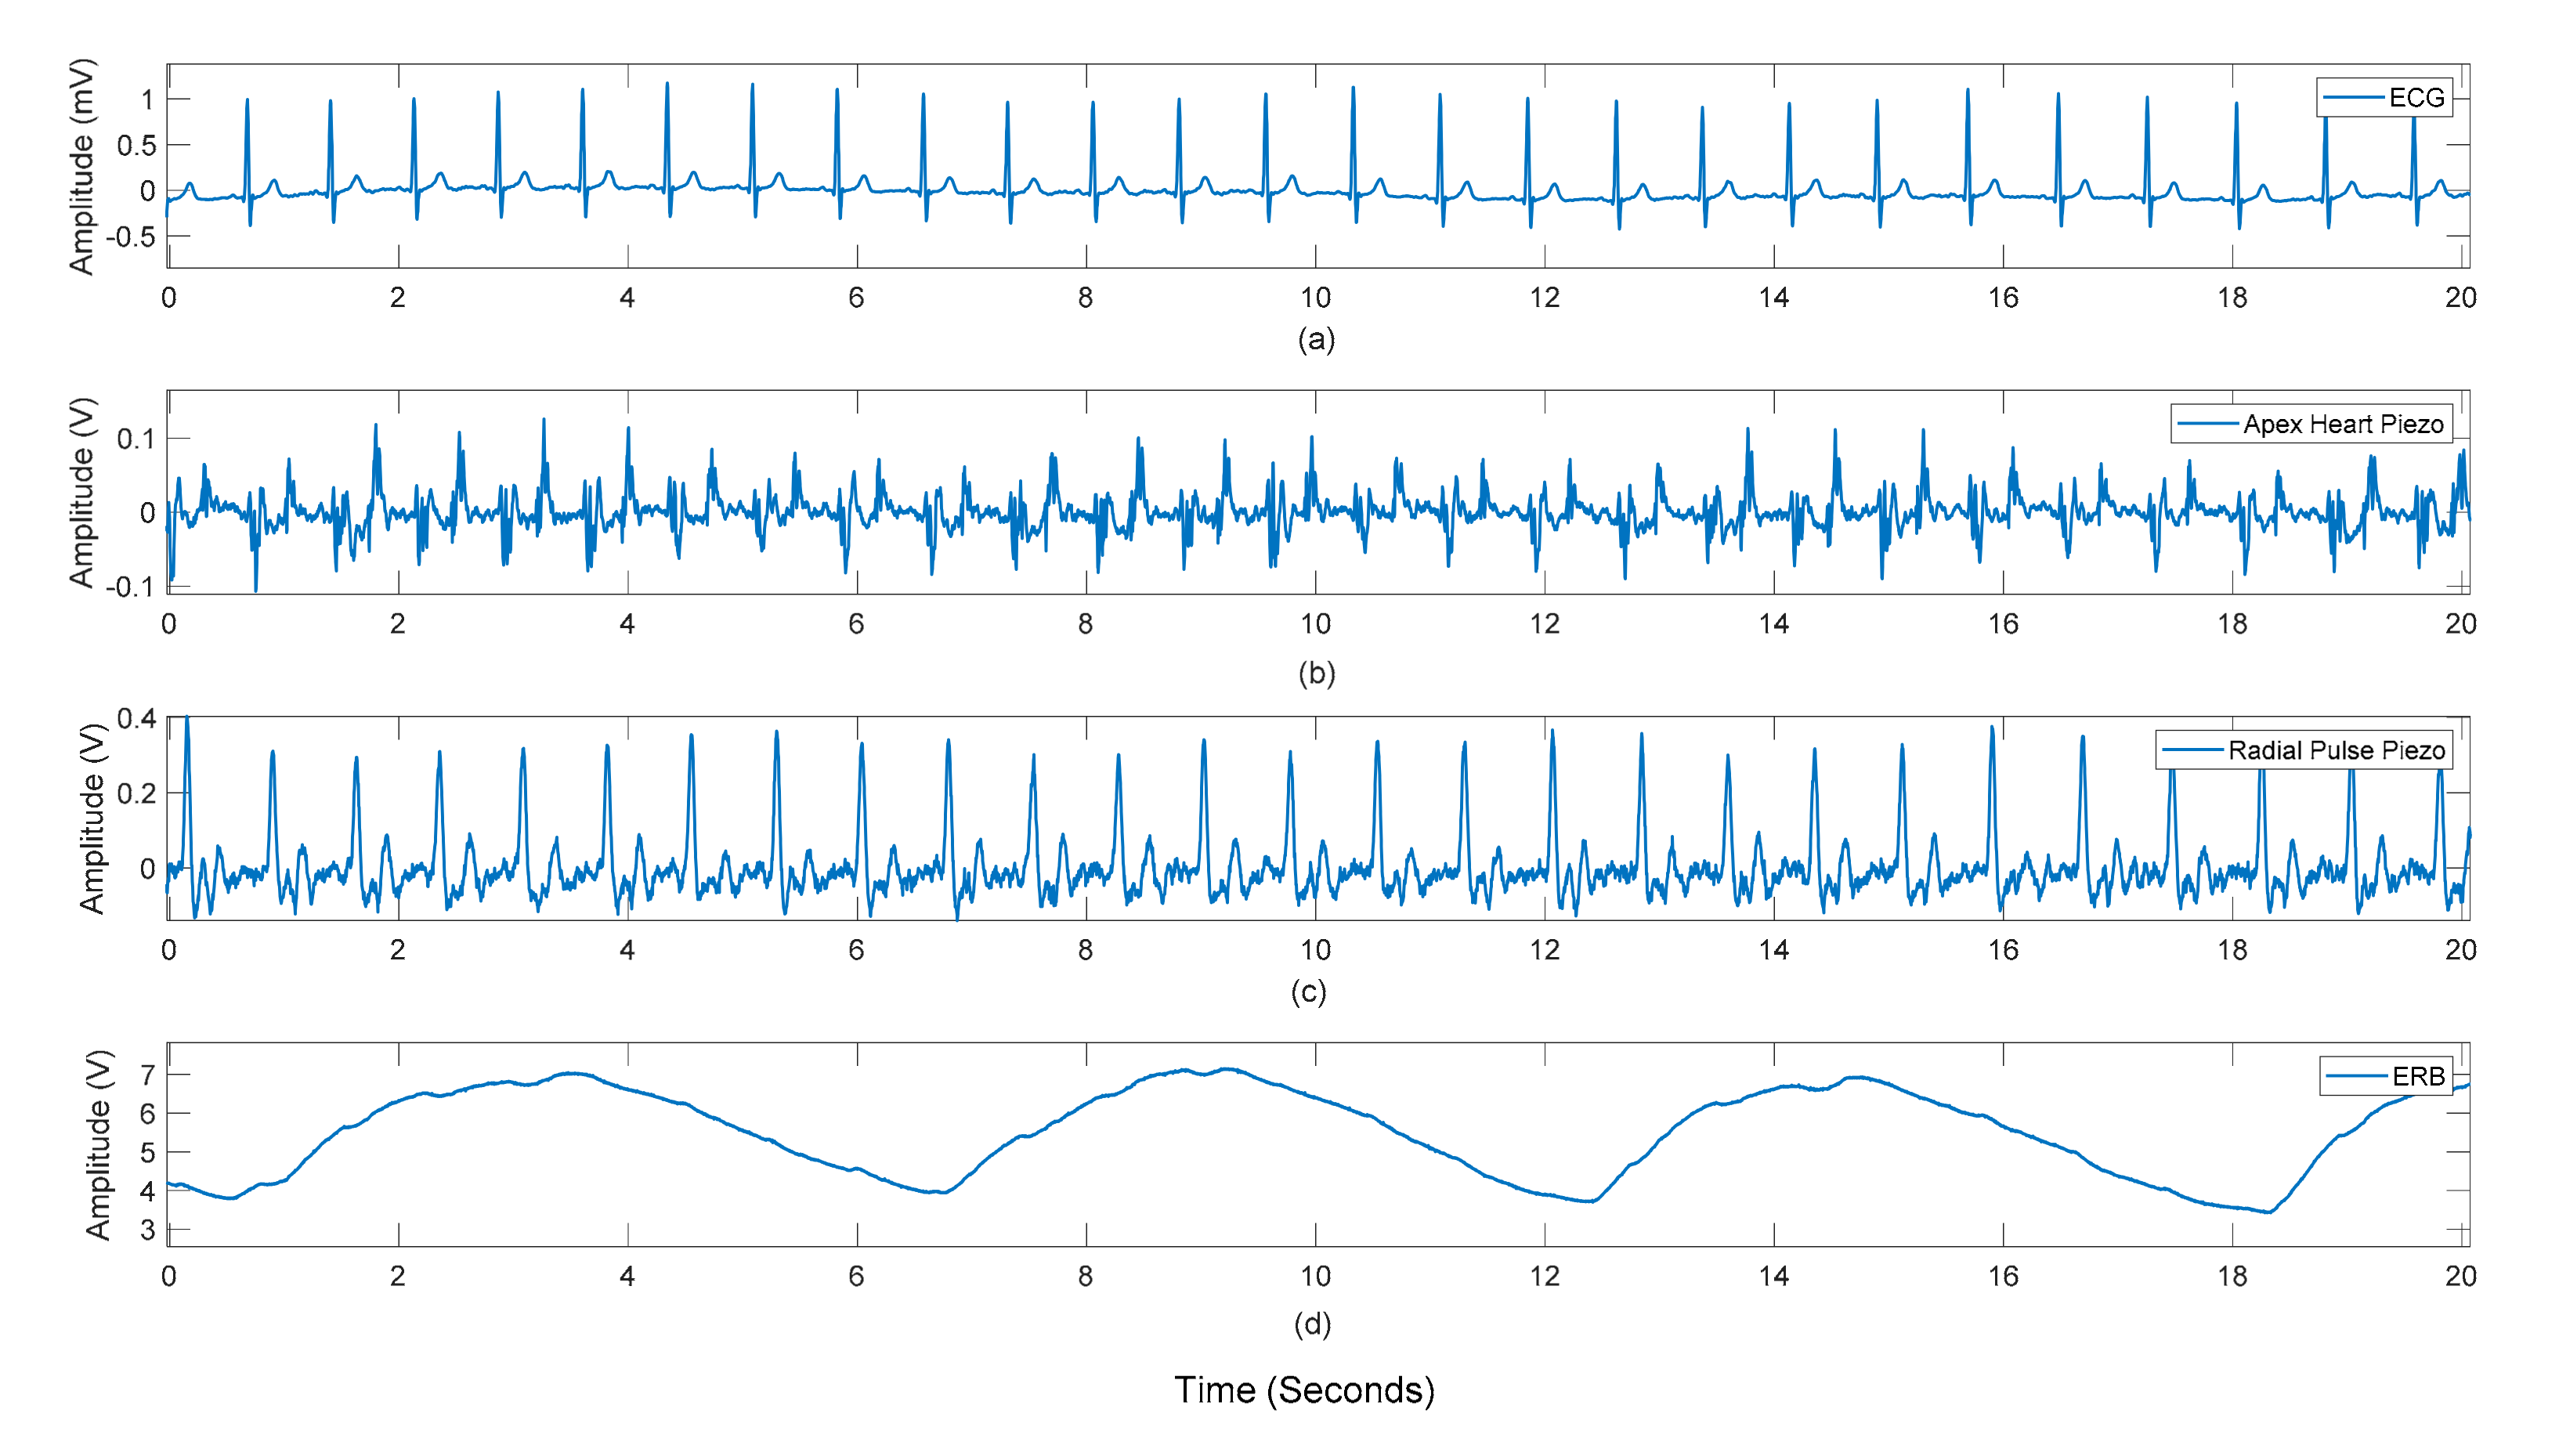
2.2.1. Data Collection
2.2.2. Pre-Processing
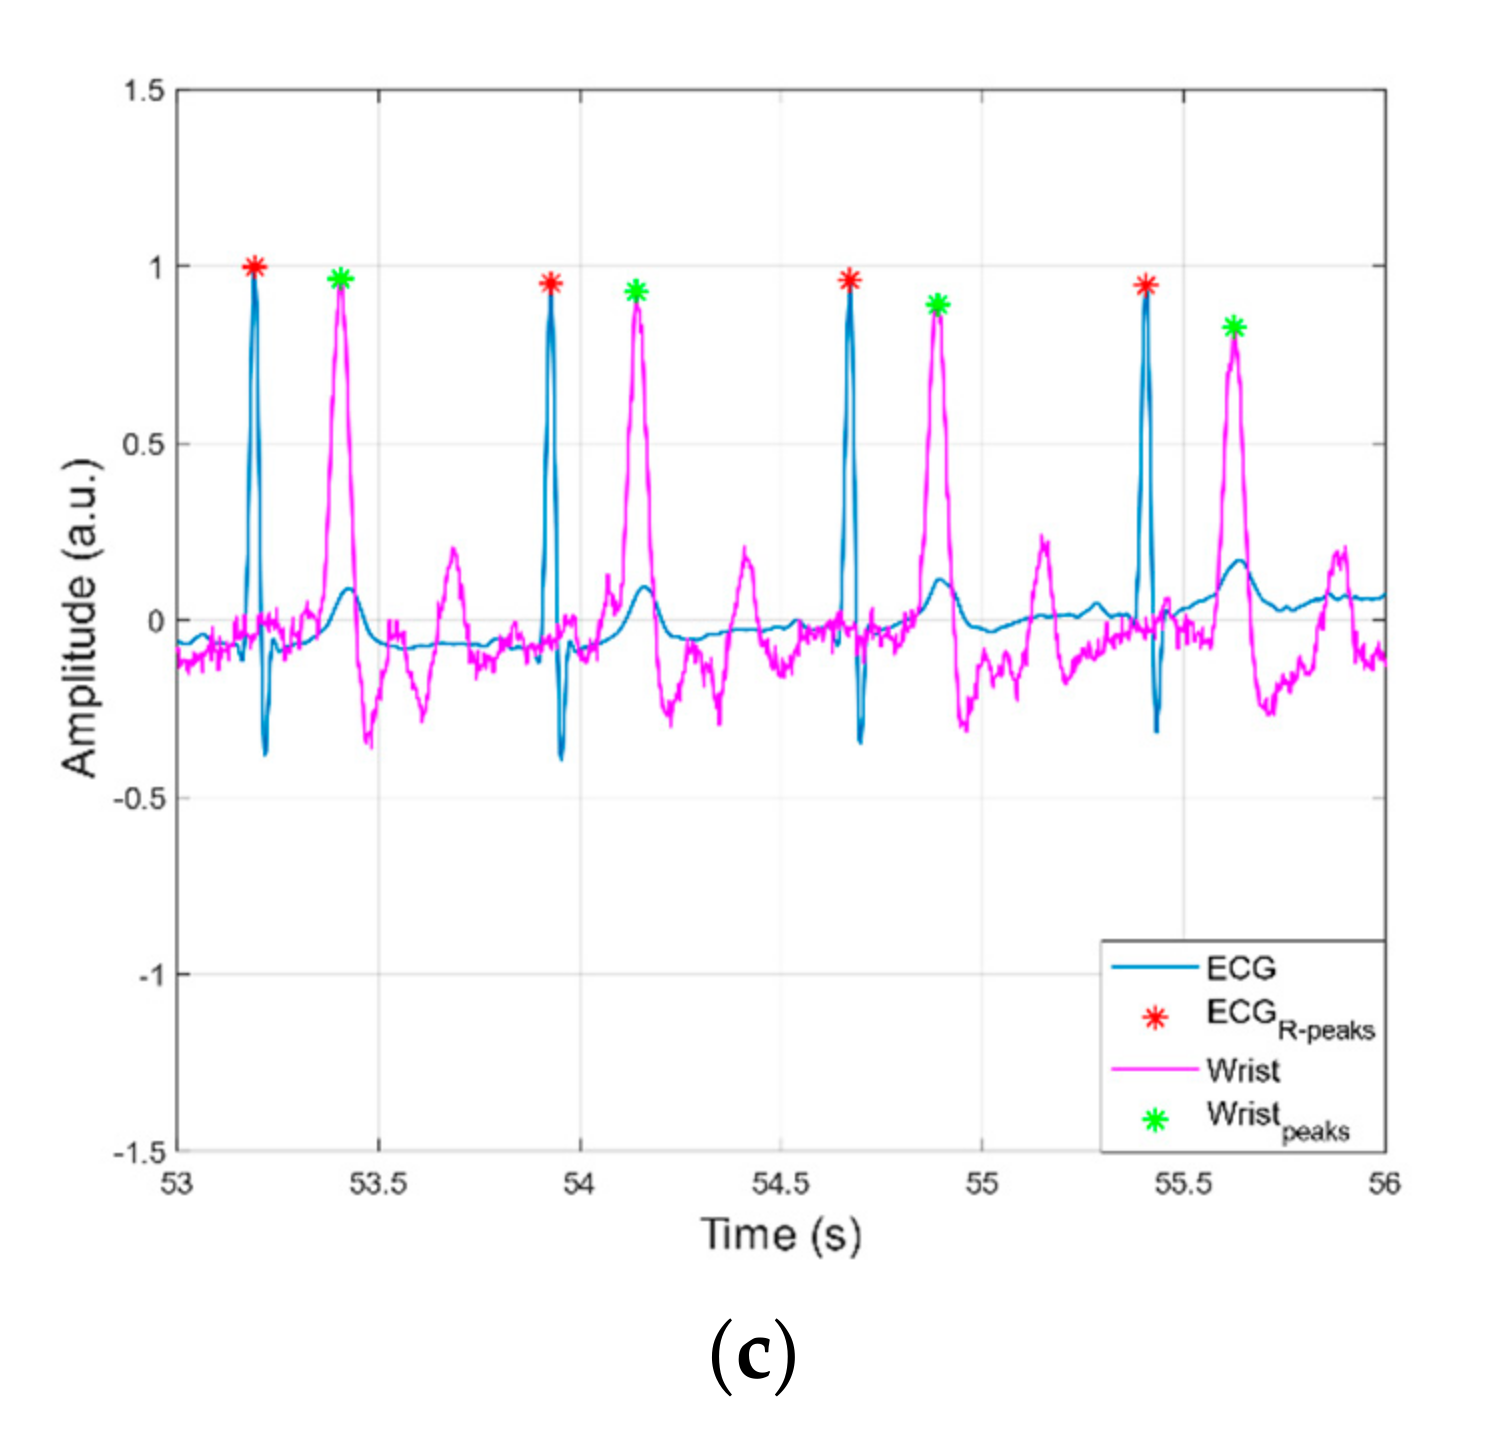
2.2.3. Heart and Respiratory Rates Extraction
2.2.4. Statistical Analyses of Heart and Respiratory Rates
3. Results
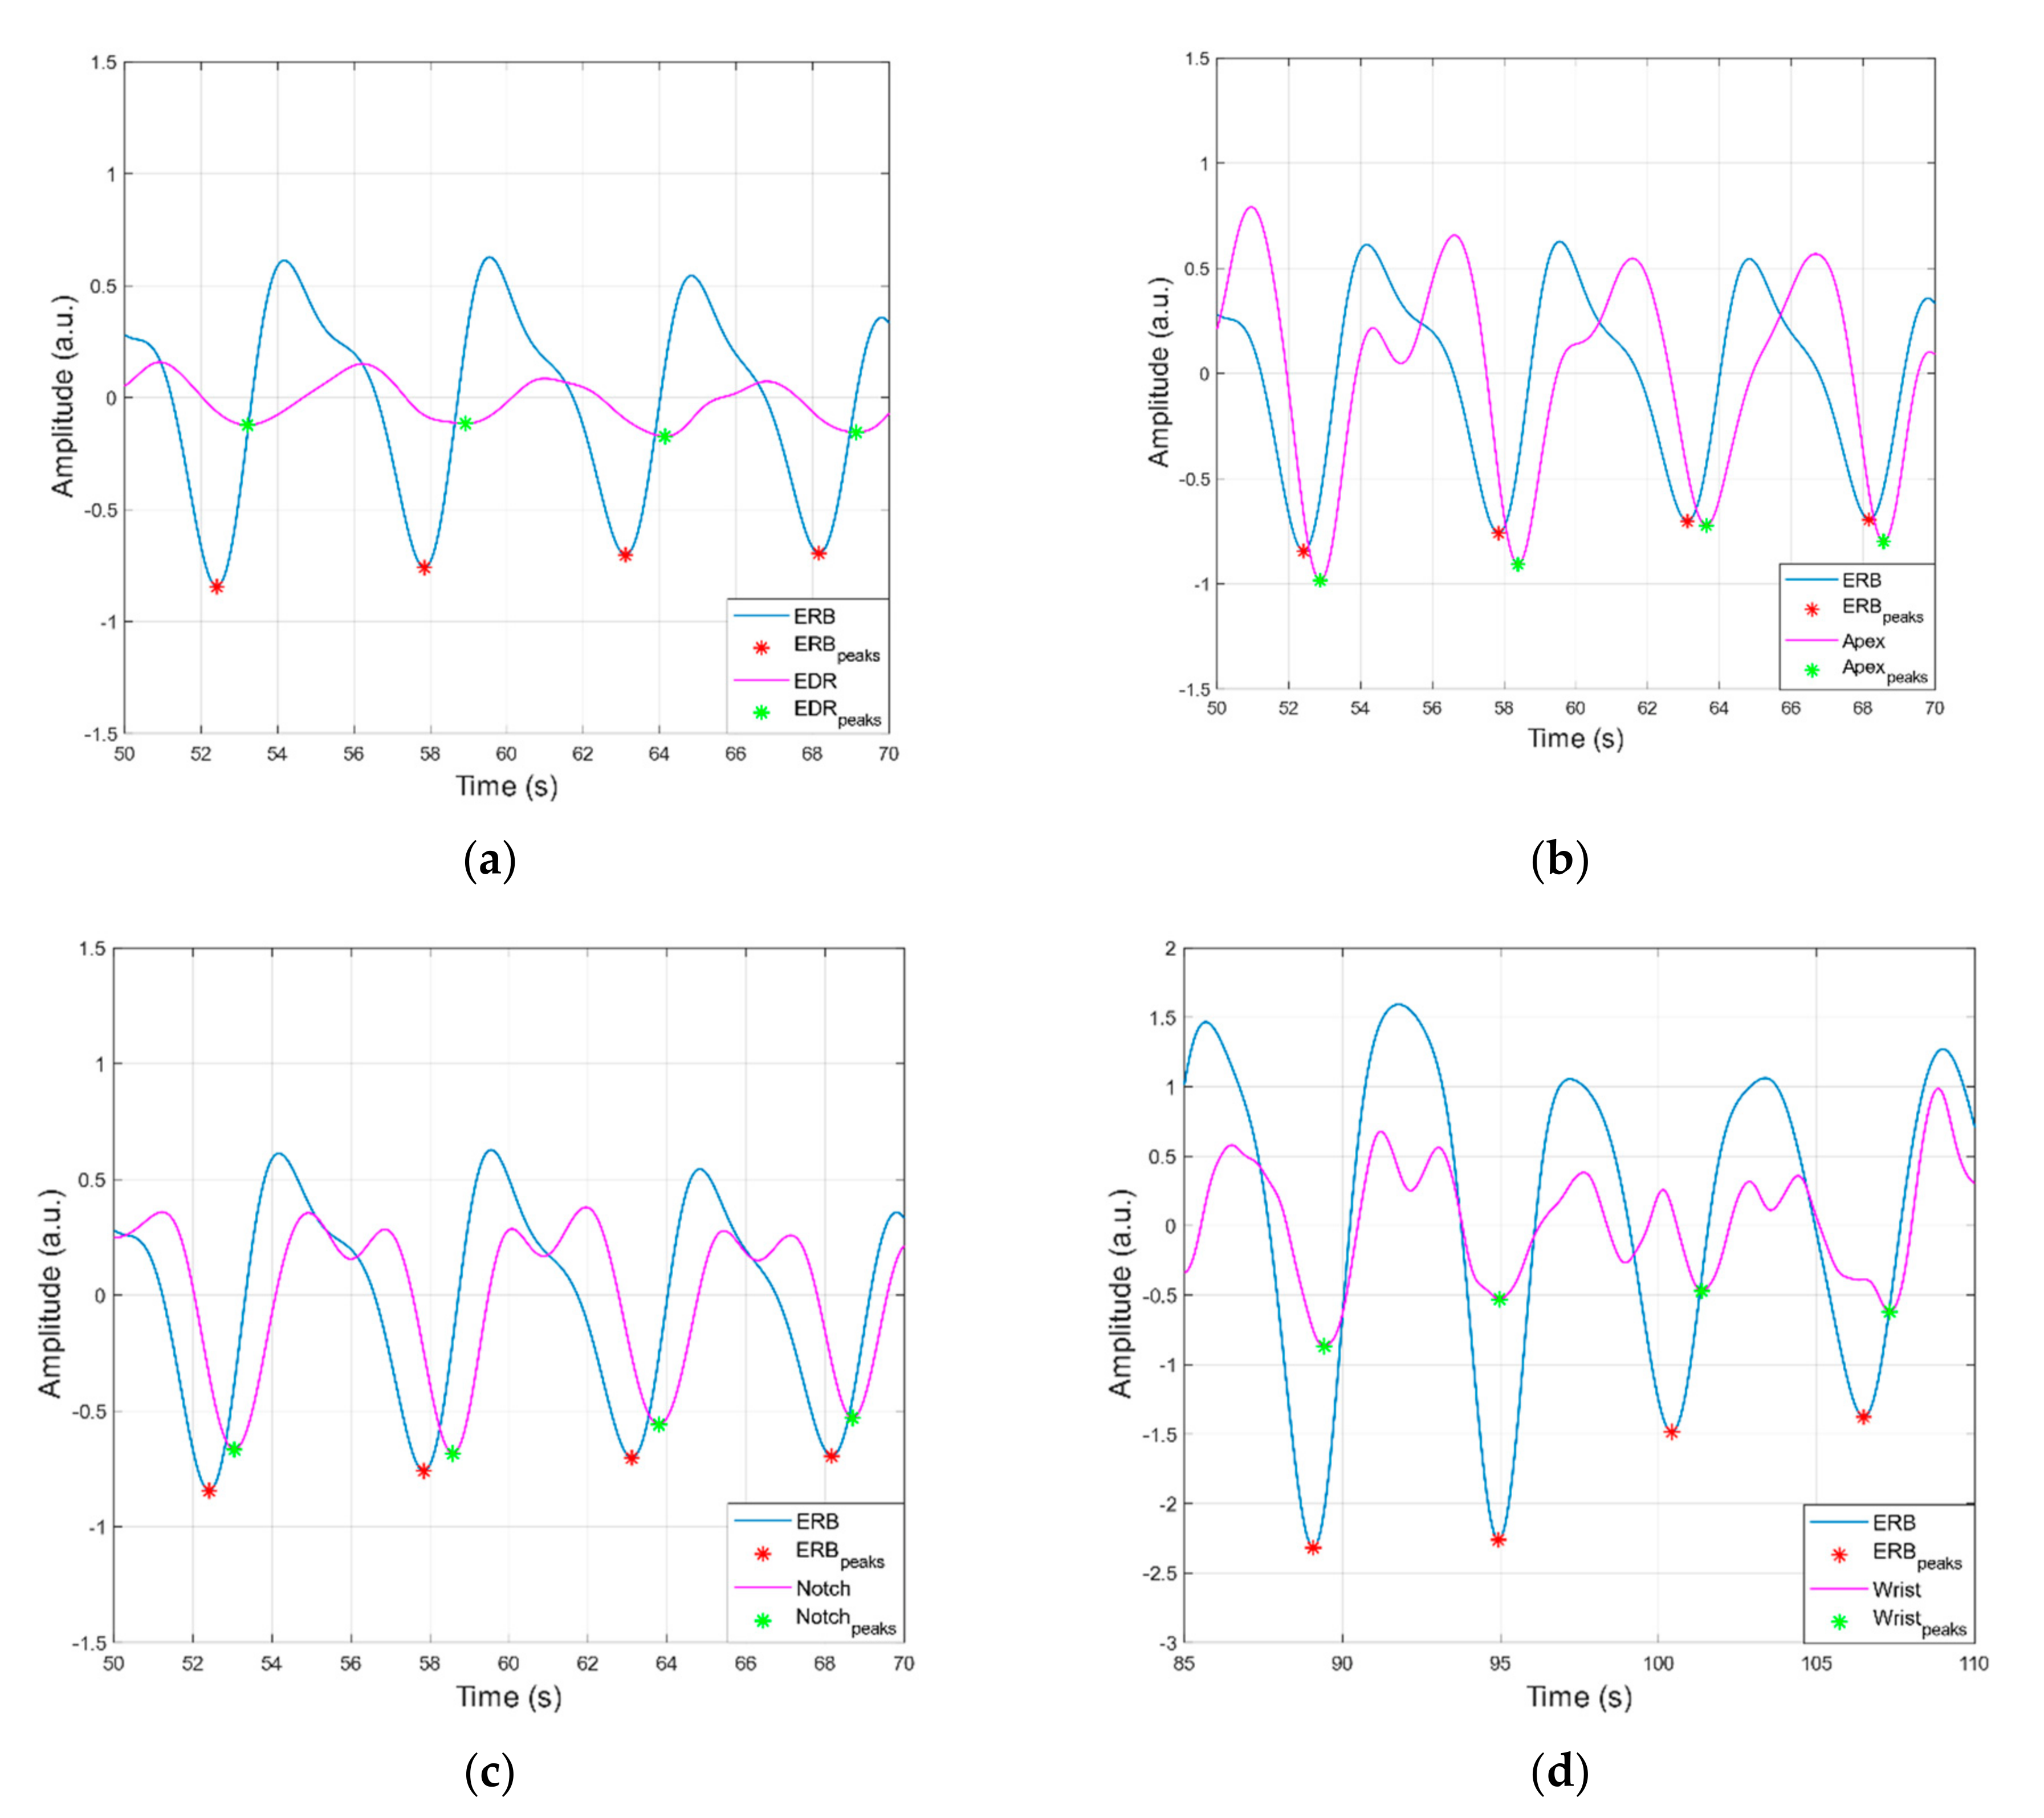
3.1. Peak Detection Method
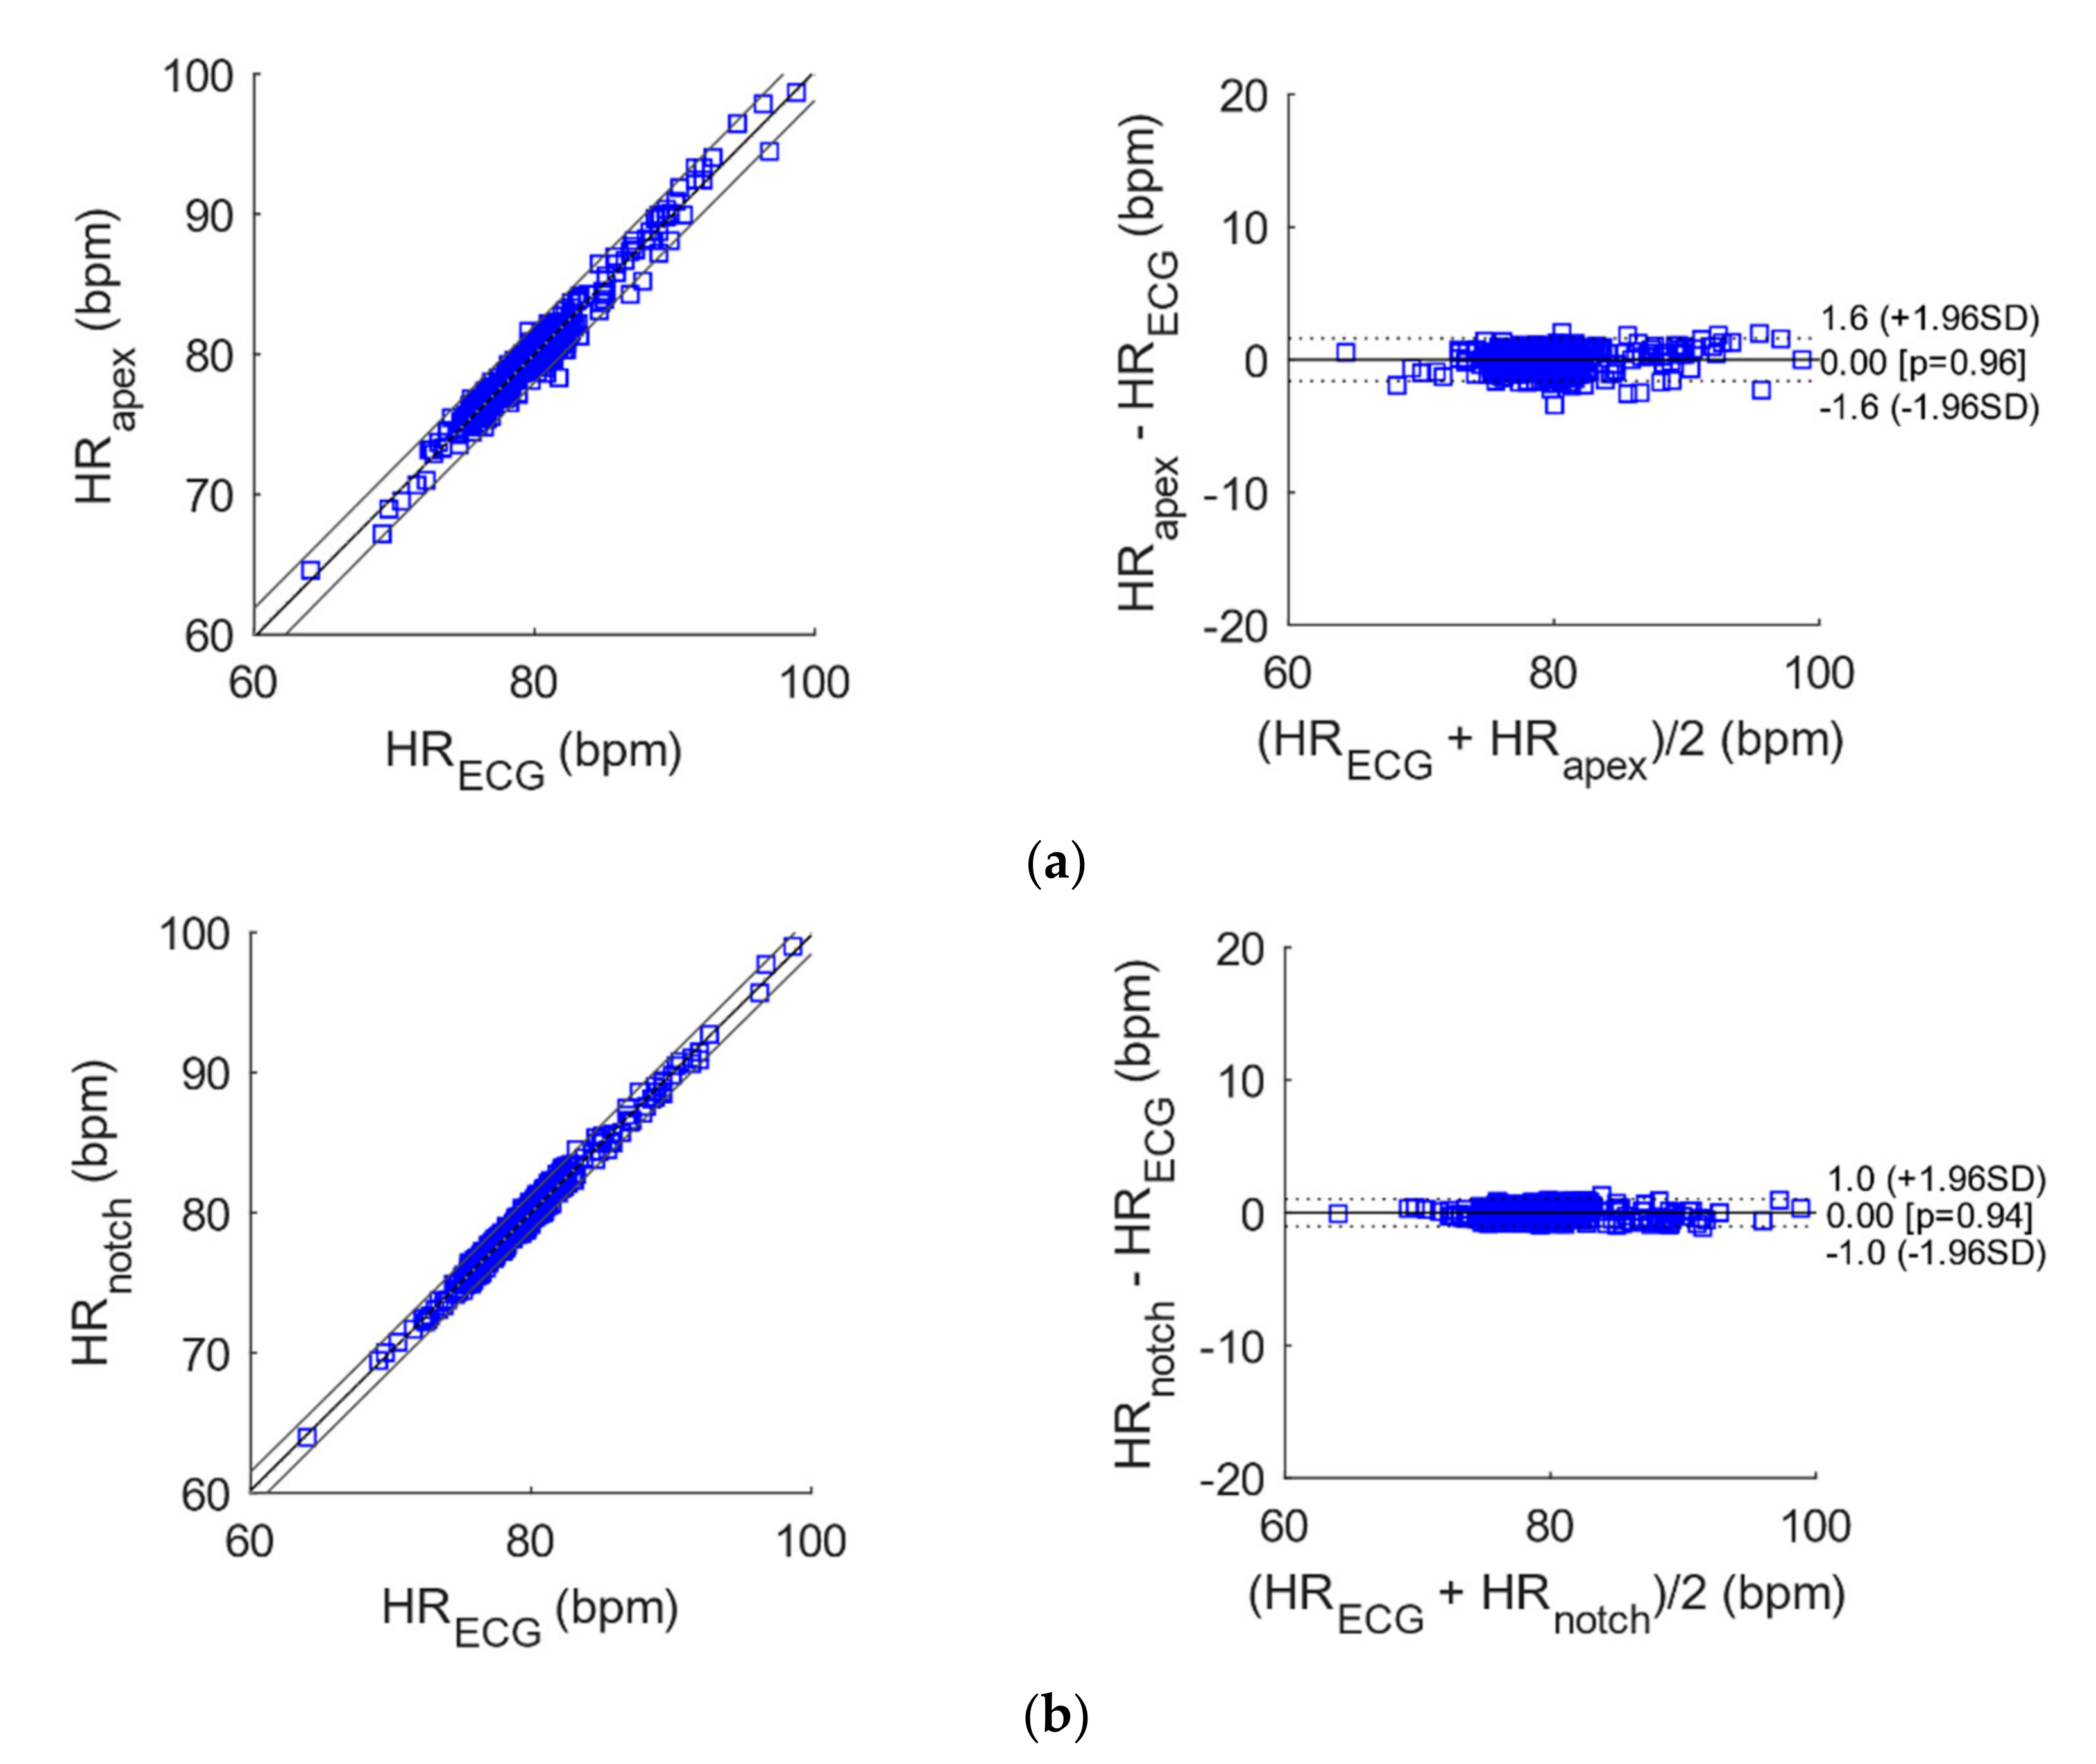
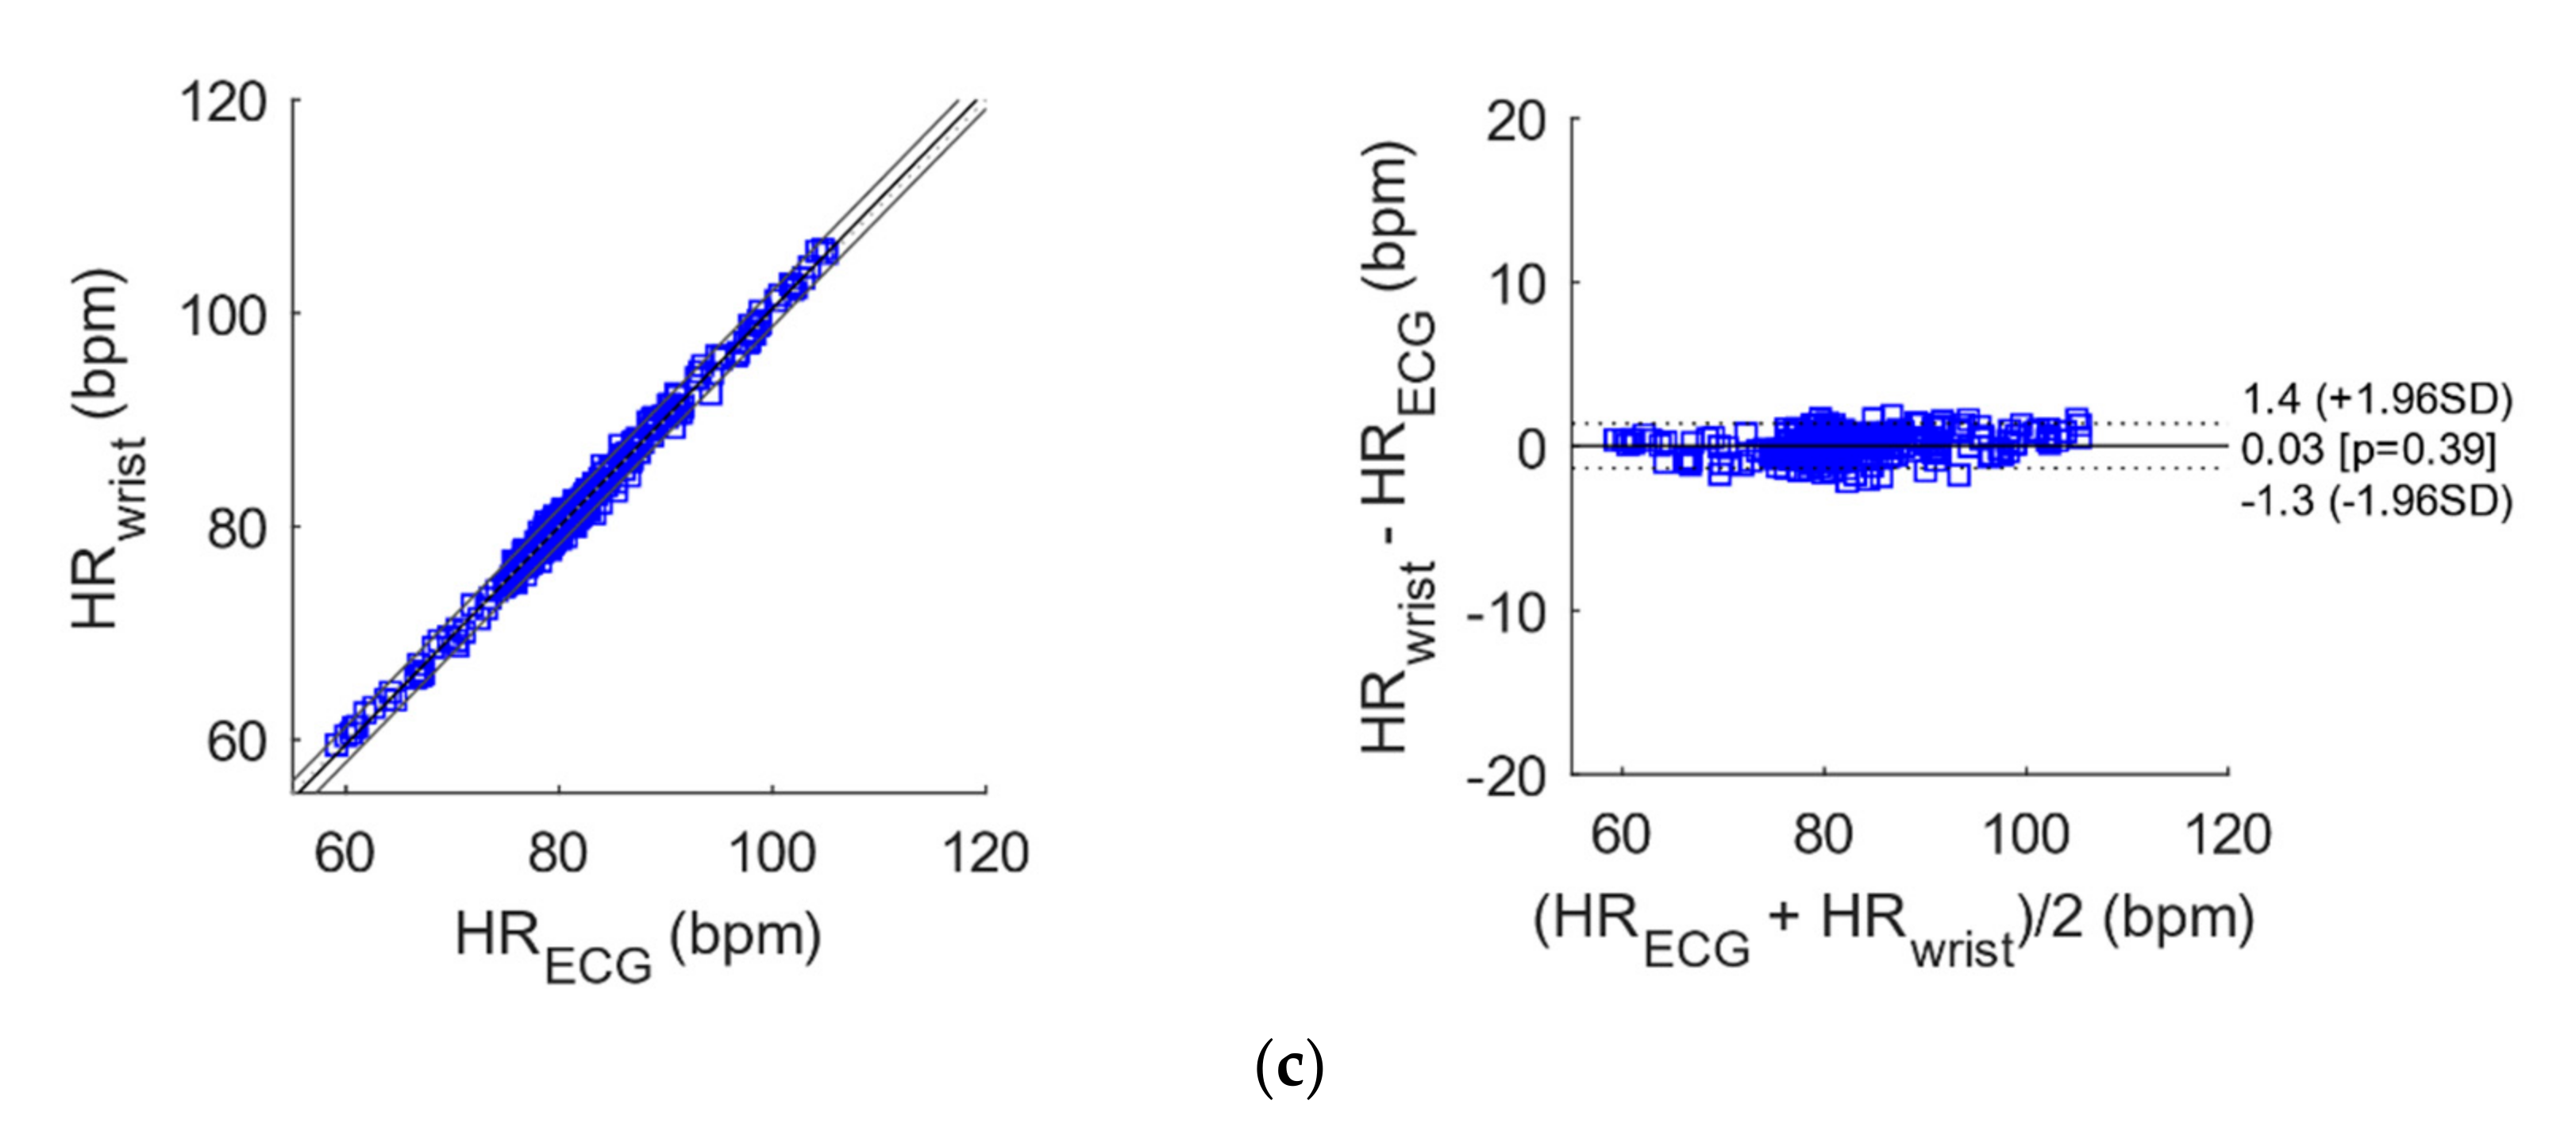
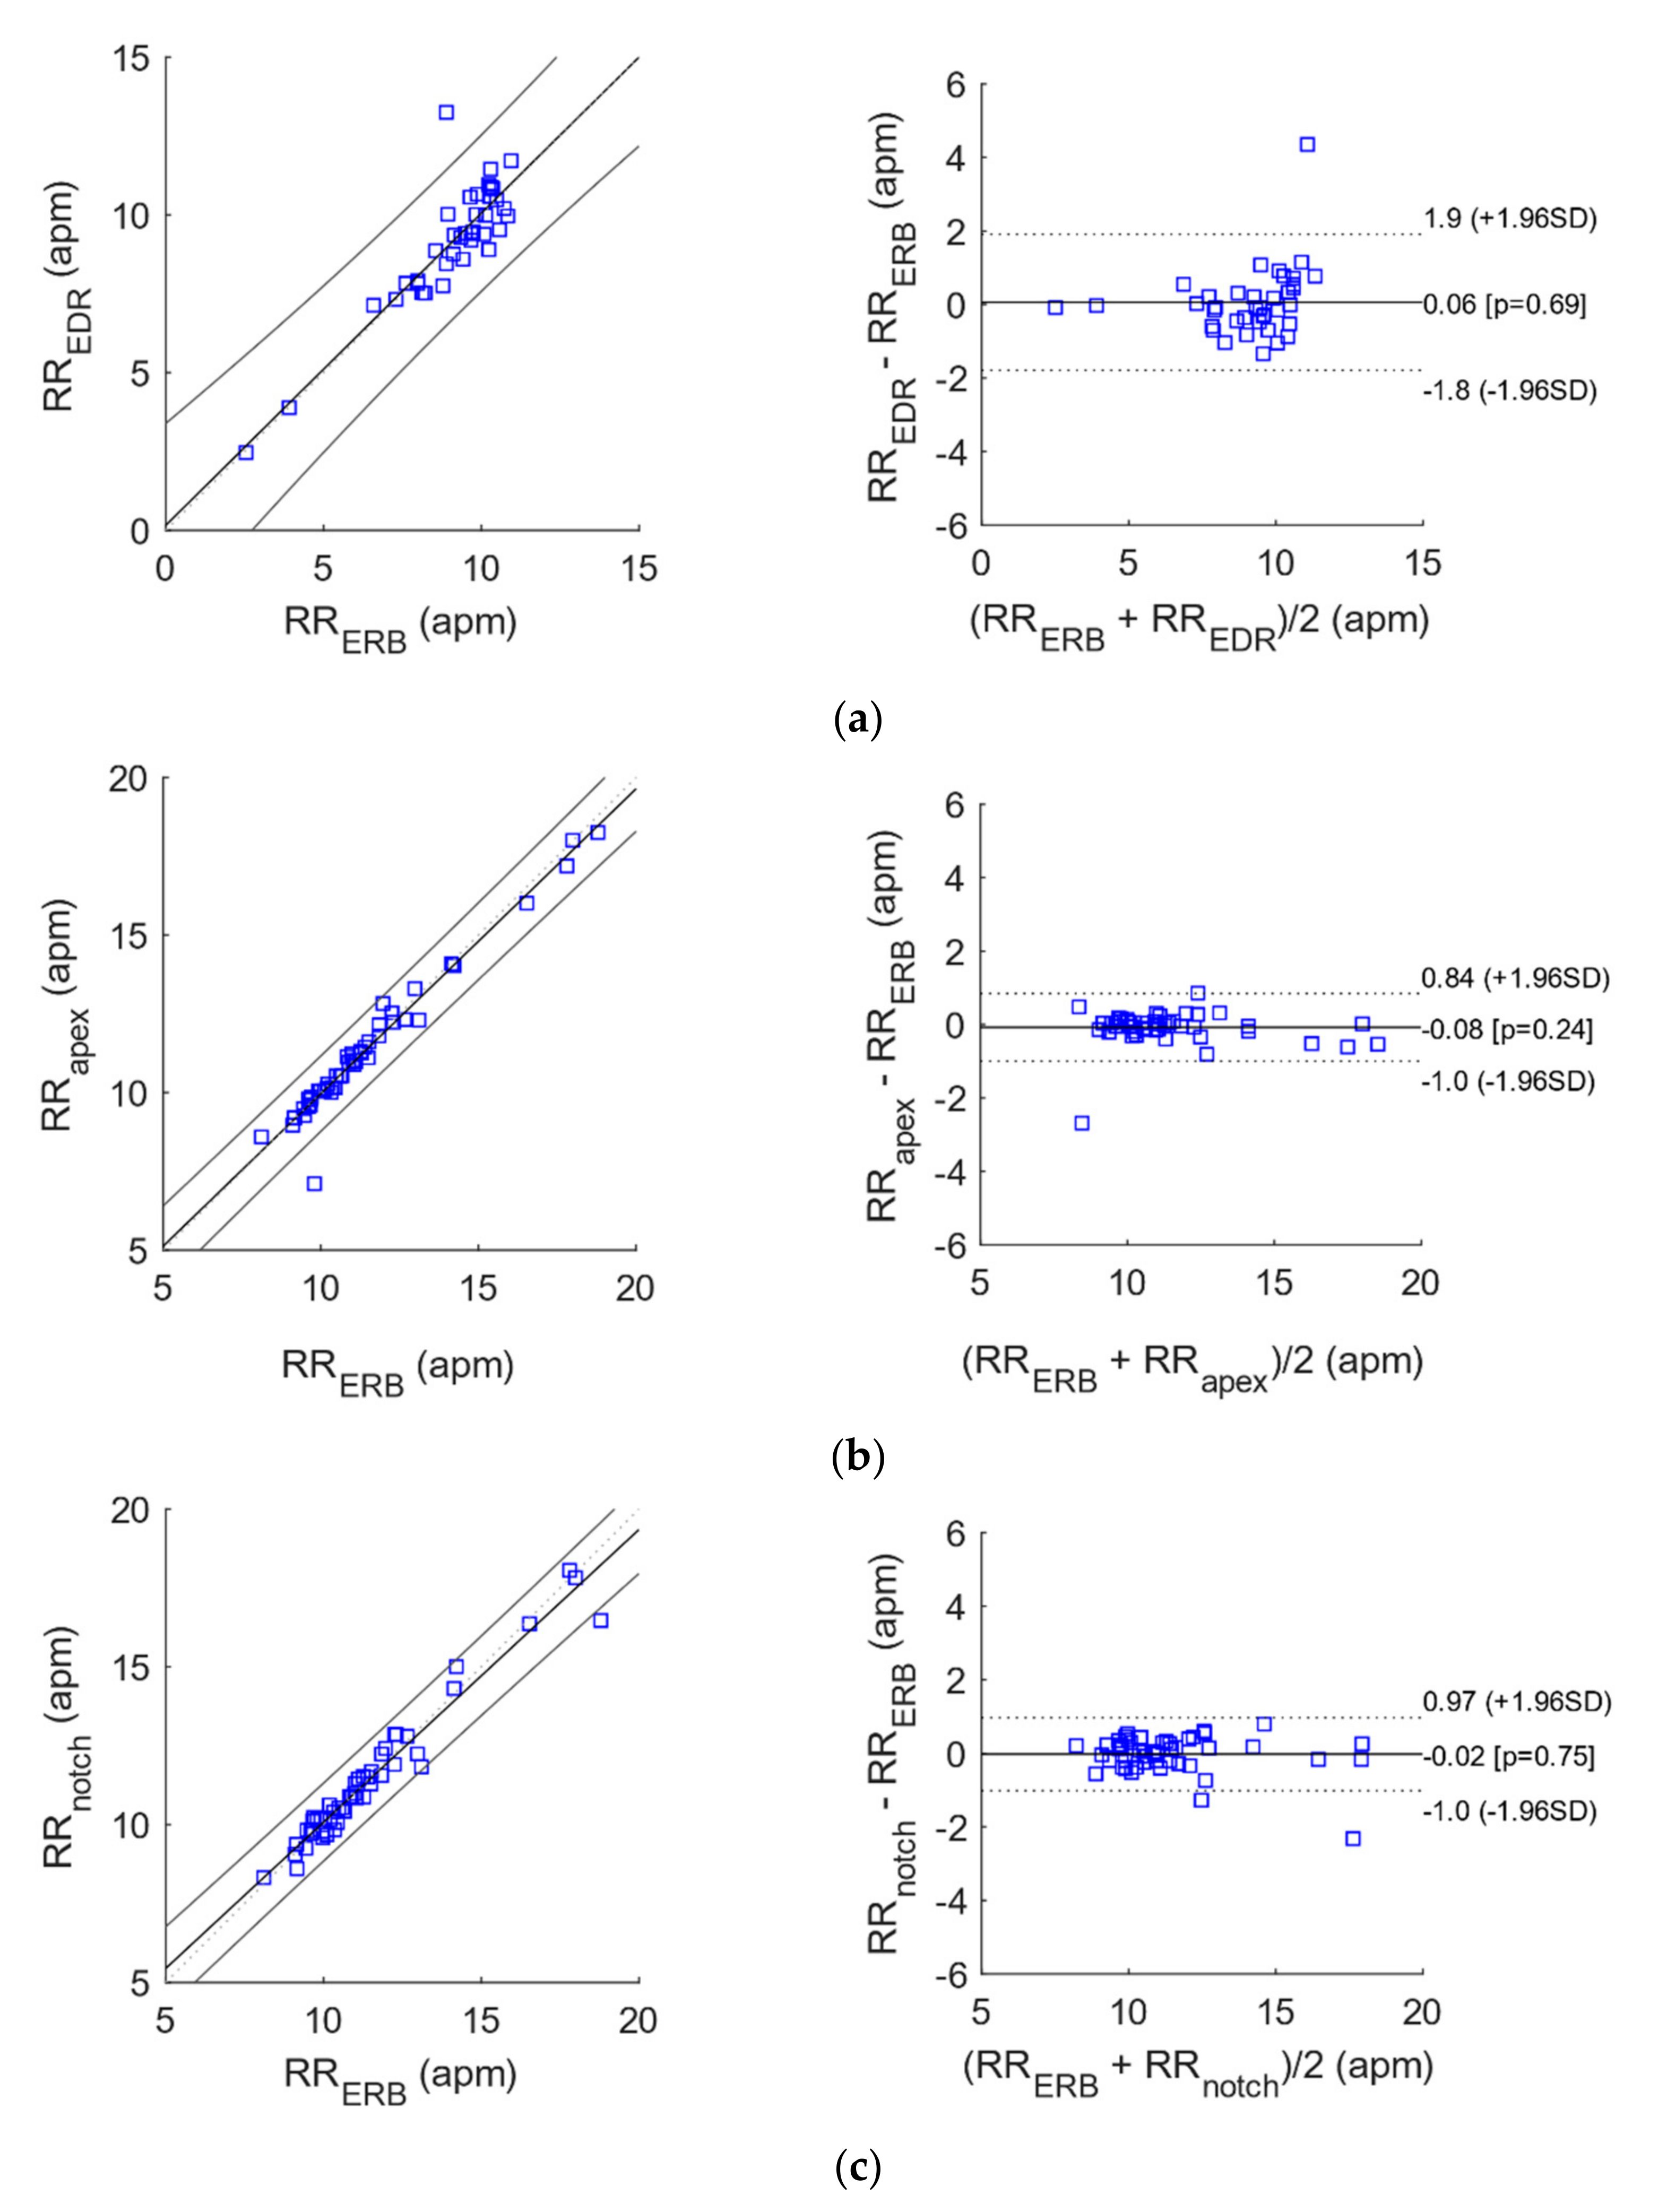
3.2. Statistical Analyses of Heart and Respiratory Rates
3.3. ADC and Bluetooth Streaming Testing
4. Discussion
- it is based on a cheaper sensor and requires a simpler conditioning circuit.
- it requires only one measurement point, which may be positioned onto different body areas.
- it does not need any electrical contact with the body and conductive gel.
- it is much more robust to electromagnetic interferences.
- it needs much simpler processing to extract a respiration signal.
5. Conclusions
Supplementary Materials
Author Contributions
Funding
Institutional Review Board Statement
Acknowledgments
Conflicts of Interest
Appendix A. DC Removal Filter Matlab Code
References
- Robertson-Steel, I. Evolution of triage systems. Emerg. Med. J. 2006, 23, 154–155. [Google Scholar] [CrossRef] [PubMed]
- Australasian College for Emergency Medicine. The Australasian Triage Scale. Emerg. Med. (Fremantle W.A.) 2002, 14, 335–336. [Google Scholar] [CrossRef] [PubMed]
- Emergency Department Care: Australian Hospital Statistics. Available online: https://nla.gov.au/nla.obj-767401731 (accessed on 28 May 2020).
- Luther, M.; Monaghan, M.; Jackson, K.; Lenson, S. How relevant is the Australasian Triage Scale to the modern Emergency Department? Australas. Emerg. Nurs. J. 2010, 13, 152. [Google Scholar] [CrossRef]
- Albahri, O.; Albahri, A.; Mohammed, K.; Zaidan, A.; Zaidan, B.; Hashim, M.; Salman, O.H. Systematic review of real-time remote health monitoring system in triage and priority-based sensor technology: Taxonomy, open challenges, motivation and recommendations. J. Med. Syst. 2018, 42, 80. [Google Scholar] [CrossRef]
- Mitchell, G.W. A brief history of triage. Disaster Med. Public Health Prep. 2008, 2, S4–S7. [Google Scholar] [CrossRef]
- Christ, M.; Grossmann, F.; Winter, D.; Bingisser, R.; Platz, E. Modern triage in the emergency department. Dtsch. Ärzteblatt Int. 2010, 107, 892. [Google Scholar] [CrossRef]
- Andres, E.; Reichert, S.; Gass, R. Development and experimentation of a telemedicine solution built around a digital stethoscope. the “Bluehealth” project. Int. J. Eng. Res. Sci. (IJOER) 2016, 2, 157–167. [Google Scholar]
- Klum, M.; Urban, M.; Tigges, T.; Pielmus, A.-G.; Feldheiser, A.; Schmitt, T.; Orglmeister, R. Wearable Cardiorespiratory Monitoring Employing a Multimodal Digital Patch Stethoscope: Estimation of ECG, PEP, LVET and Respiration Using a 55 mm Single-Lead ECG and Phonocardiogram. Sensors 2020, 20, 2033. [Google Scholar] [CrossRef] [Green Version]
- Swarup, S.; Makaryus, A.N. Digital stethoscope: Technology update. Med. Devices Evid. Res. 2018, 11, 29–36. [Google Scholar] [CrossRef] [PubMed] [Green Version]
- Szymanowska, O.; Zagrodny, B.; Ludwicki, M.; Awrejcewicz, J. Development of an Electronic Stethoscope, 1st ed.; Springer International Publishing: Berlin/Heidelberg, Germany, 2016; Volume 414, pp. 189–204. [Google Scholar]
- Webster, J.G.; Clark, J.W. Medical Instrumentation: Application and Design, 3rd ed.; John Wiley & Sons Inc.: Hoboken, NJ, USA, 2008. [Google Scholar]
- Northrop, R.B.A. Noninvasive Instrumentation and Measurement in Medical Diagnosis, 2nd ed.; CRC Press: Boca Raton, FL, USA; London, UK; New York, NY, USA, 2018. [Google Scholar]
- Ertel, P.Y.; Lawrence, M.; Brown, R.K.; Stern, A.M. Stethoscope acoustics: I. The doctor and his stethoscope. Circulation 1966, 34, 889–898. [Google Scholar] [CrossRef] [Green Version]
- Zhang, G.; Liu, M.; Guo, N.; Zhang, W. Design of the MEMS Piezoresistive Electronic Heart Sound Sensor. Sensors 2016, 16, 1728. [Google Scholar] [CrossRef] [PubMed] [Green Version]
- Ou, D.; Ouyang, L.; Tan, Z.; Mo, H.; Tian, X.; Xu, X. An electronic stethoscope for heart diseases based on micro-electro-mechanical-system microphone. In Proceedings of the IEEE International Conference on Industrial Informatics (INDIN), Emden, Germany, 24–26 July 2017; pp. 882–885. [Google Scholar]
- Ertel, P.Y.; Lawrence, M.; Brown, R.K.; Stern, A.M. Stethoscope acoustics: II. Transmission and filtration patterns. Circulation 1966, 34, 899–909. [Google Scholar] [CrossRef] [Green Version]
- Aguilera-Astudillo, C.; Chavez-Campos, M.; Gonzalez-Suarez, A.; Garcia-Cordero, J.L. A low-cost 3-D printed stethoscope connected to a smartphone. In Proceedings of the Annual International Conference of the IEEE Engineering in Medicine and Biology Society, EMBS, Orlando, FL, USA, 16–20 August 2016; pp. 4365–4368. [Google Scholar]
- Pinto, C.; Pereira, D.; Ferreira-Coimbra, J.; Portugues, J.; Gama, V.; Coimbra, M. A comparative study of electronic stethoscopes for cardiac auscultation. In Proceedings of the 2017 39th Annual International Conference of the IEEE Engineering in Medicine and Biology Society (EMBC), Jeju Island, Korea, 11–15 July 2017; pp. 2610–2613. [Google Scholar]
- Elfaramawy, T.; Fall, C.L.; Morissette, M.; Lellouche, F.; Gosselin, B. Wireless respiratory monitoring and coughing detection using a wearable patch sensor network. In Proceedings of the 2017 15th IEEE International New Circuits and Systems Conference (NEWCAS), Strasbourg, France, 25–28 June 2017; pp. 197–200. [Google Scholar]
- Yu, F.; Bilberg, A.; Voss, F. The Development of an Intelligent Electronic Stethoscope. In Proceedings of the 2008 IEEE/ASME International Conference on Mechtronic and Embedded Systems and Applications, Beijing, China, 12–15 October 2008; pp. 612–617. [Google Scholar]
- Leng, S.; Tan, R.S.; Chai, K.T.C.; Wang, C.; Ghista, D.; Zhong, L. The electronic stethoscope. Biomed. Eng. Online 2015, 14, 66. [Google Scholar] [CrossRef] [Green Version]
- Sumarna; Astono, J.; Purwanto, A.; Agustika, D.K. The improvement of phonocardiograph signal (PCG) representation through the electronic stethoscope. In Proceedings of the 2017 4th International Conference on Electrical Engineering, Computer Science and Informatics (EECSI), Yogyakarta, Indonesia, 19–21 September 2017; pp. 1–5. [Google Scholar]
- Liu, H.; Allen, J.; Zheng, D.; Chen, F. Recent development of respiratory rate measurement technologies. Physiol. Meas. 2019, 40, 07TR01. [Google Scholar] [CrossRef] [Green Version]
- Dias, D.; Paulo Silva Cunha, J. Wearable Health Devices-Vital Sign Monitoring, Systems and Technologies. Sensors 2018, 18, 2414. [Google Scholar] [CrossRef] [Green Version]
- Soon, S.; Svavarsdottir, H.; Downey, C.; Jayne, D.G. Wearable devices for remote vital signs monitoring in the outpatient setting: An overview of the field. BMJ Innov. 2020, 6, 55. [Google Scholar] [CrossRef] [Green Version]
- PUI Audio. “Bender AB1290B-LW100-R” Datasheet. Available online: https://www.digikey.com/en/products/detail/pui-audio-inc/AB1290B-LW100-R/4147326 (accessed on 29 April 2013).
- Esposito, D.; Andreozzi, E.; Fratini, A.; Gargiulo, G.D.; Savino, S.; Niola, V.; Bifulco, P. A piezoresistive sensor to measure muscle contraction and mechanomyography. Sensors 2018, 18, 2553. [Google Scholar] [CrossRef] [Green Version]
- Esposito, D.; Andreozzi, E.; Gargiulo, G.D.; Fratini, A.; D’Addio, G.; Naik, G.R.; Bifulco, P. A Piezoresistive Array Armband With Reduced Number of Sensors for Hand Gesture Recognition. Front. Neurorobotics 2020, 13, 114. [Google Scholar] [CrossRef] [Green Version]
- FORMEROL® F.10/SUGRU® TECHNICAL DATA SHEET. Available online: https://sugru.com/pdfs/tds.pdf (accessed on 1 September 2016).
- Polley, C.; Andreozzi, E.; Bifulco, P.; Esposito, D.; Naik, G.; Gunawardana, U.; Gargiulo, G. Low Cost Analogue Front End for Electronic Stethoscopes Application with Silicone Enclosure. In Proceedings of the 2019 International Conference on Electrical Engineering Research & Practice (ICEERP), Sydney, Australia, 24–28 November 2019; pp. 1–6. [Google Scholar]
- Pallas-Areny, R.; Webster, J.G. Sensors and Signal Conditioning; John Wiley & Sons: Hoboken, NJ, USA, 2001. [Google Scholar]
- Gargiulo, G.D.; O’Loughlin, A.; Breen, P.P. Electro-resistive bands for non-invasive cardiac and respiration monitoring, a feasibility study. Physiol. Meas. 2015, 36, N35. [Google Scholar] [CrossRef] [PubMed]
- BM10_AN R2 BLE Single Mode Module. Available online: https://fccid.io/YAIBM10R2/User-Manual/Manual-3614427 (accessed on 1 September 2021).
- Texas Instruments. CC2640R2F SimpleLink™ Bluetooth® Low Energy Wireless MCU. Available online: https://www.avnet.com/wps/portal/apac/products/product-aac/201803-ti/!ut/p/z0/04_Sj9CPykssy0xPLMnMz0vMAfIjo8zi3S1NPQ2dnQ183UNMTAwCLbz9PA39vAwD_I30g6sy4kPC9QuyHRUBwJ6srQ!!/ (accessed on 1 September 2021).
- MAX30003, Ultra-Low Power, Single-Channel Integrated Biopotential (ECG, R-to-R Detection) AFE. Available online: https://datasheetspdf.com/pdf/1346415/MaximIntegrated/MAX30003/1 (accessed on 1 September 2021).
- ADS124x 24-Bit, 2-kSPS, Analog-to-Digital Converters With Programmable Gain Amplifier (PGA) For Sensor Measurement. Available online: https://www.ti.com/lit/ds/symlink/ads1247.pdf?ts=1636949941174&ref_url=https%253A%252F%252Fwww.google.com%252F (accessed on 1 September 2021).
- MAX30205 Human Body Temperature Sensor. Available online: https://www.avnet.com/wps/portal/ebv/products/new-products/npi/2017/maxim-max30205/ (accessed on 1 September 2021).
- LIS2DH-MEMS Digital Output Motion Sensor: Ultra Low-Power High Performance 3-Axis “Femto” Accelerometer. Available online: https://www.st.com/en/mems-and-sensors/lis2dh.html (accessed on 1 September 2021).
- Jayarathna, T.; Gargiulo, G.D.; Breen, P.P. Continuous Vital Monitoring During Sleep and Light Activity Using Carbon-Black Elastomer Sensors. Sensors 2020, 20, 1583. [Google Scholar] [CrossRef] [PubMed] [Green Version]
- Arja, S.E.; Jayarathna, T.; Ulloa, F.; Gargiulo, G.; Breen, P. Characterization of Coated Piezo-resistive Fabric for Respiration Sensing. In Proceedings of the 2019 International Conference on Electrical Engineering Research & Practice (ICEERP), Sydney, Australia, 24–28 November 2019; pp. 1–6. [Google Scholar]
- Jayarathna, T.; Gargiulo, G.D.; Breen, P.P. Live Demonstration: Invisible Vital Monitoring. In Proceedings of the 2019 IEEE Biomedical Circuits and Systems Conference (BioCAS), Nara, Japan, 17–19 October 2019; p. 1. [Google Scholar]
- Helfenbein, E.; Firoozabadi, R.; Chien, S.; Carlson, E.; Babaeizadeh, S. Development of three methods for extracting respiration from the surface ECG: A review. J. Electrocardiol. 2014, 47, 819–825. [Google Scholar] [CrossRef] [PubMed]
- BioPac Systems Inc. MP160 Product Sheet. Available online: https://www.biopac.com/ (accessed on 1 September 2021).
- Su, S.C.; Hess, T.; Whybourne, A.; Chang, A.B. Intermittent midline suprasternal neck mass caused by superior herniation of the thymus. J. Paediatr. Child Health 2015, 51, 344–346. [Google Scholar] [CrossRef]
- Proakis, J.G.A. Digital Signal Processing, 4th ed.; Pearson/Prentice Hall: Upper Saddle River, Hobokon, NJ, USA, 2007. [Google Scholar]
- Sedghamiz, H. BioSigKit: A Matlab Toolbox and Interface for Analysis of BioSignals Software • Review • Repository Archive. J. Open Source Softw. 2018, 3, 671. [Google Scholar] [CrossRef]
- Pan, J.; Tompkins, W.J. A real-time QRS detection algorithm. IEEE Trans. Biomed. Eng. 1985, 32, 230–236. [Google Scholar] [CrossRef] [PubMed]
- Klein, R. Bland-Altman and Correlation Plot. Available online: https://www.mathworks.com/matlabcentral/fileexchange/45049-bland-altman-and-correlation-plot (accessed on 28 May 2020).
- Taebi, A.; Solar, B.; Bomar, A.; Sandler, R.; Mansy, H.A. Recent Advances in Seismocardiography. Vibration 2019, 2, 64–86. [Google Scholar] [CrossRef] [PubMed] [Green Version]
- Andreozzi, E.; Fratini, A.; Esposito, D.; Naik, G.; Polley, C.; Gargiulo, G.D.; Bifulco, P. Forcecardiography: A Novel Technique to Measure Heart Mechanical Vibrations onto the Chest Wall. Sensors 2020, 20, 3885. [Google Scholar] [CrossRef]


| TP | FP | FN | SENSITIVITY (%) | PPV (%) | |
|---|---|---|---|---|---|
| Apex vs. ECG | 374 | 0 | 0 | 100 | 100 |
| Notch vs. ECG | 374 | 0 | 0 | 100 | 100 |
| Wrist vs. ECG | 372 | 2 | 0 | 100 | 99.5 |
| Apex vs. ERB | 51 | 0 | 0 | 100 | 100 |
| Notch vs. ERB | 51 | 2 | 0 | 100 | 96.2 |
| Wrist vs. ERB | 33 | 12 | 11 | 75.0 | 73.3 |
| EDR vs. ERB | 39 | 1 | 5 | 88.6 | 97.5 |
| N | Slope | Intercept (bpm/apm) | R2 | |
|---|---|---|---|---|
| Apex vs. ECG | 372 | 1.0098 | −0.7775 | 0.97 |
| Notch vs. ECG | 368 | 0.9906 | 0.7482 | 0.98 |
| Wrist vs. ECG | 371 | 1.0221 | −1.7724 | 0.99 |
| Apex vs. ERB | 50 | 0.9673 | 0.2937 | 0.96 |
| Notch vs. ERB | 50 | 0.9273 | 0.8046 | 0.95 |
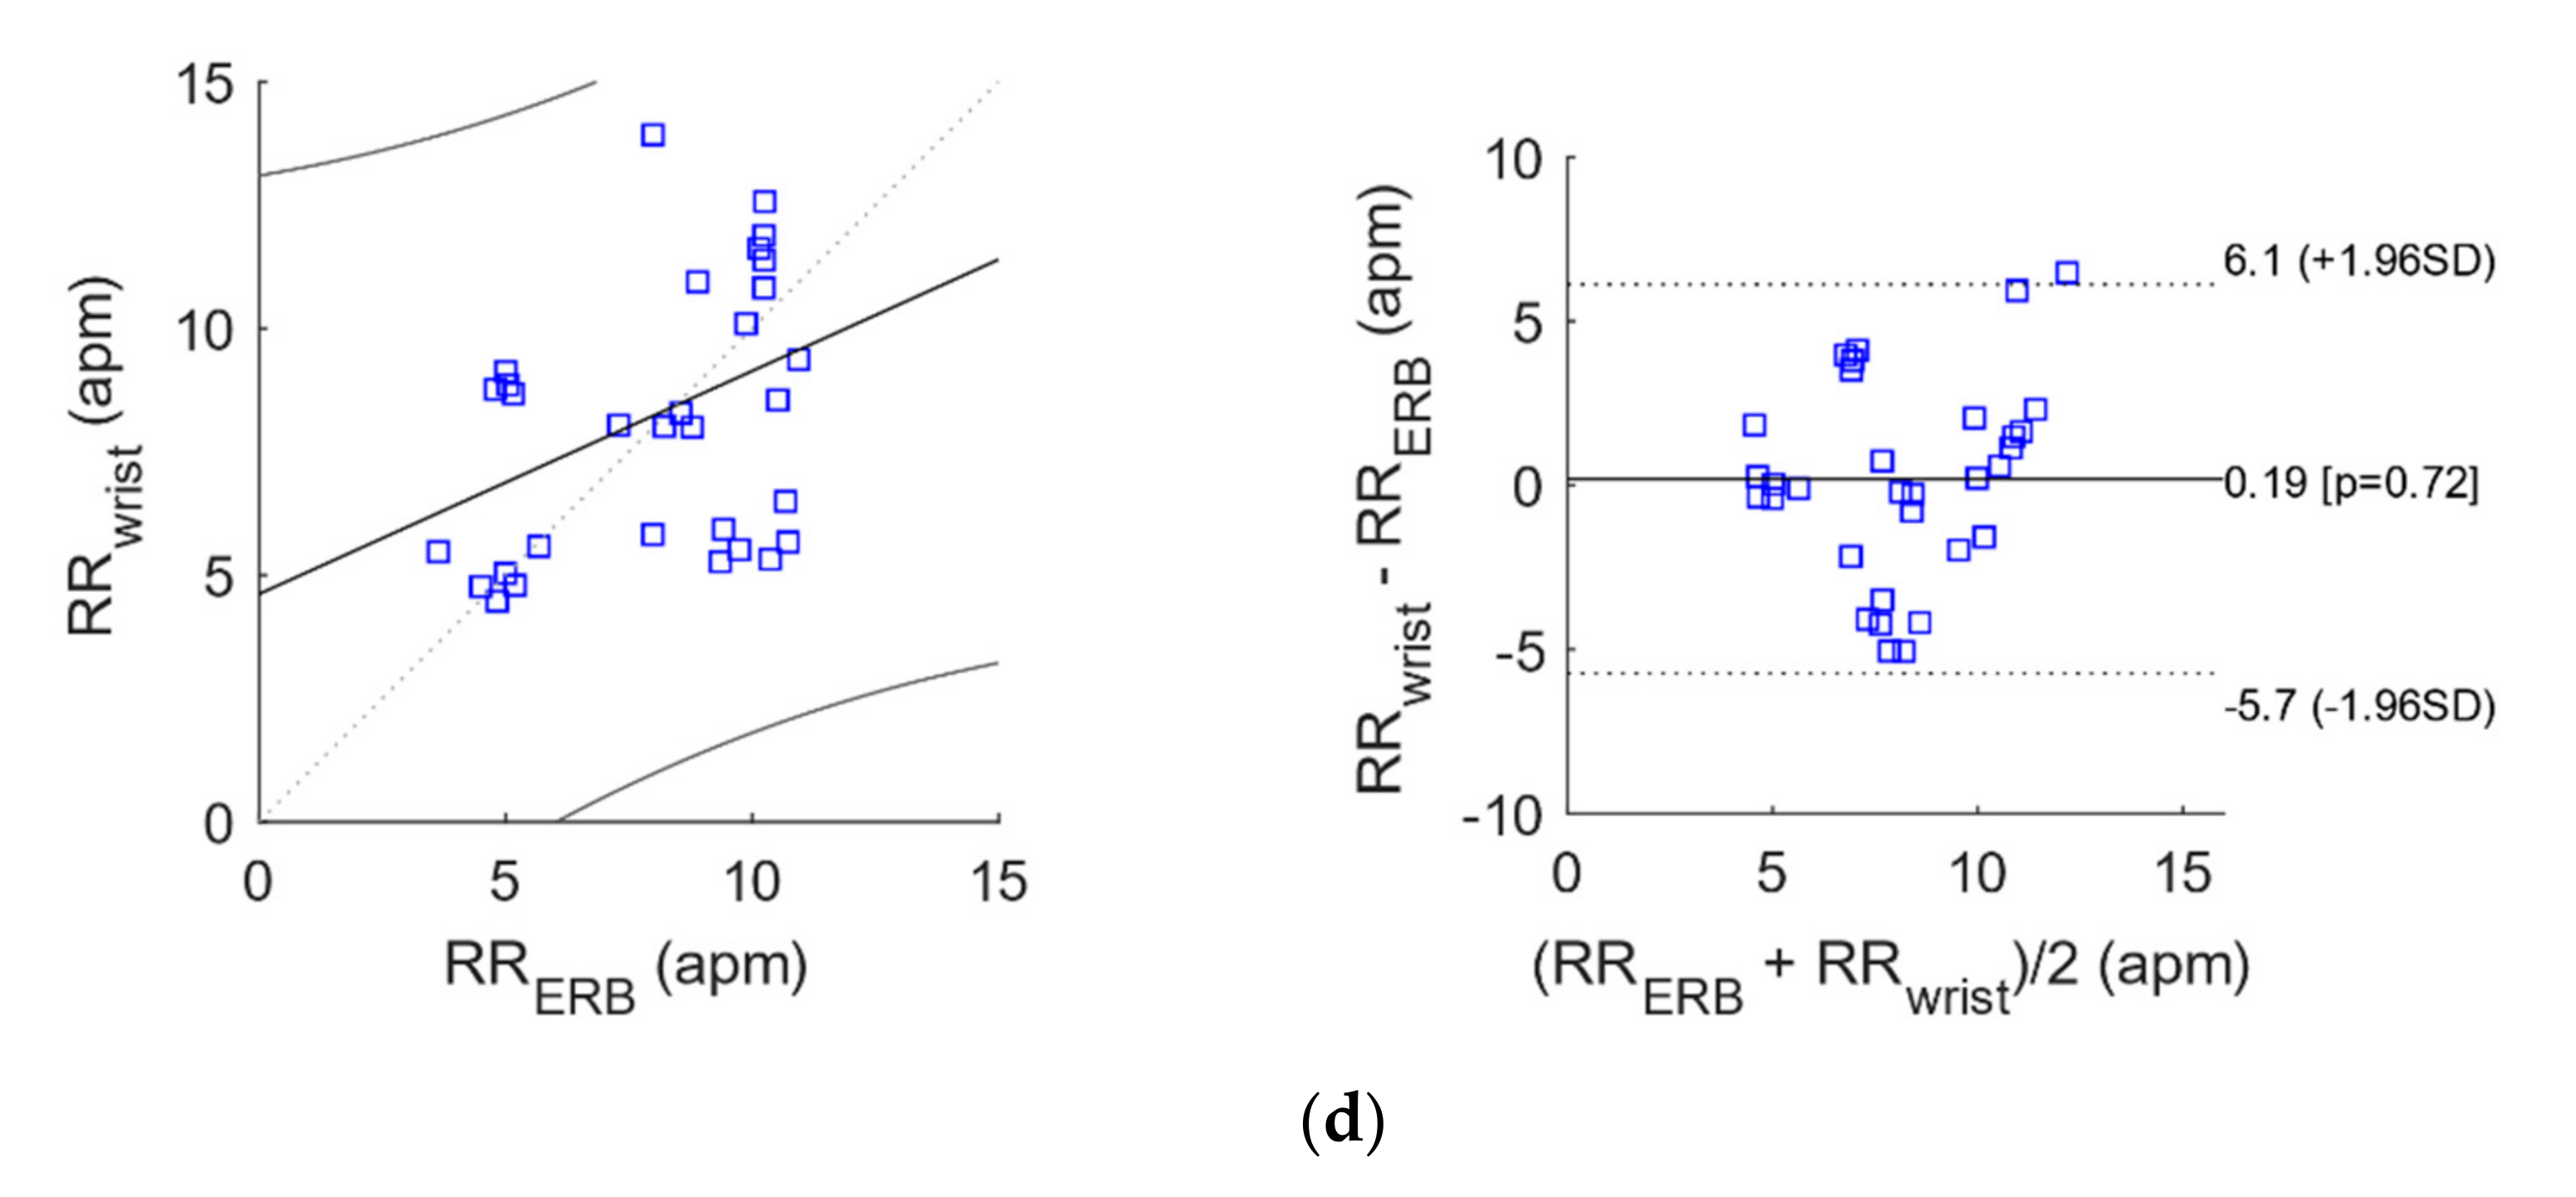
| Wrist vs. ERB | 32 | 0.4521 | 4.6176 | 0.13 |
| EDR vs. ERB | 38 | 0.9896 | 0.1565 | 0.77 |
| N | Bias (bpm/apm) | Limits of Agreement (bpm/apm) | ||
|---|---|---|---|---|
| Apex vs. ECG | 372 | 0.0021 | −1.606472 | 1.610672 |
| Notch vs. ECG | 368 | −0.0022 | −1.036492 | 1.032092 |
| Wrist vs. ECG | 371 | 0.0309 | −1.331496 | 1.393296 |
| Apex vs. ERB | 50 | −0.0781 | −0.996752 | 0.840552 |
| Notch vs. ERB | 50 | −0.0232 | −1.014764 | 0.968364 |
| Wrist vs. ERB | 32 | 0.1945 | −5.728228 | 6.117228 |
| EDR vs. ERB | 38 | 0.0621 | −1.783632 | 1.907832 |
Publisher’s Note: MDPI stays neutral with regard to jurisdictional claims in published maps and institutional affiliations. |
© 2021 by the authors. Licensee MDPI, Basel, Switzerland. This article is an open access article distributed under the terms and conditions of the Creative Commons Attribution (CC BY) license (https://creativecommons.org/licenses/by/4.0/).
Share and Cite
Polley, C.; Jayarathna, T.; Gunawardana, U.; Naik, G.; Hamilton, T.; Andreozzi, E.; Bifulco, P.; Esposito, D.; Centracchio, J.; Gargiulo, G. Wearable Bluetooth Triage Healthcare Monitoring System. Sensors 2021, 21, 7586. https://doi.org/10.3390/s21227586
Polley C, Jayarathna T, Gunawardana U, Naik G, Hamilton T, Andreozzi E, Bifulco P, Esposito D, Centracchio J, Gargiulo G. Wearable Bluetooth Triage Healthcare Monitoring System. Sensors. 2021; 21(22):7586. https://doi.org/10.3390/s21227586
Chicago/Turabian StylePolley, Caitlin, Titus Jayarathna, Upul Gunawardana, Ganesh Naik, Tara Hamilton, Emilio Andreozzi, Paolo Bifulco, Daniele Esposito, Jessica Centracchio, and Gaetano Gargiulo. 2021. "Wearable Bluetooth Triage Healthcare Monitoring System" Sensors 21, no. 22: 7586. https://doi.org/10.3390/s21227586
APA StylePolley, C., Jayarathna, T., Gunawardana, U., Naik, G., Hamilton, T., Andreozzi, E., Bifulco, P., Esposito, D., Centracchio, J., & Gargiulo, G. (2021). Wearable Bluetooth Triage Healthcare Monitoring System. Sensors, 21(22), 7586. https://doi.org/10.3390/s21227586